poverty & environment indicators report … · poverty & environment indicators report...
TRANSCRIPT

REPUBLIC OF KENYAMINISTRY OF STATE FOR PLANNING, NATIONAL DEVELOPMENT & VISION 2030
POVERTY & ENVIRONMENT INDICATORS REPORT
POVERTY AND ENVIRONMENT INITIATIVE - KENYAJanuary 2011

POVERTY & ENVIRONMENT INdIcaTORs
REPORT
REPUBLIC OF KENYAMinistry of State for Planning, National Development & Vision 2030
POVERTY AND ENVIRONMENT INITIATIVE - KENYA

iv
Ministry of state for Planning, National development & Vision 2030
AbbreviAtions And Acronyms ....................................................................... III
Acknowledgements .................................................................................... V
FOREWORD ................................................................................................ VI
executive summAry ....................................................................................VII
Poverty-environment linkAges ..................................................................... 1
1.1. CatEgORIEs OF ValuE FROm bIODIVERsIty ................................................................... 1
1.2. POVERty anD EnVIROnmEnt lInkagEs ...................................................................... 1
1.3. thE lInk tO thE mIllEnnIum DEVElOPmEnt gOals .......................................................... 5
1.4. summaRy anD COnClusIOn ................................................................................ 7
descriPtion of the nAtionAl monitoring And evAluAtion system ......................... 8
2.1. IntRODuCtIOn ............................................................................................ 8
2.2. natIOnal lEVEl REPORtIng ................................................................................ 8
2.3. DIstRICt lEVEl REPORtIng ................................................................................ 9
2.4. RElEVanCE OF CuRREnt InDICatORs tO P-E lInkED mOnItORIng ..............................................12
2.5. RElatIOnshIP bEtWEEn mDg InDICatORs anD nImEs .........................................................13
2.6. summaRy anD COnClusIOn ...............................................................................13
key issues in kenyA’s environment And nAturAl resource sector .......................14
3.1. kEy EnVIROnmEnt POlICy IssuEs ..........................................................................14
3.2. ECOsystEms sERVICEs ....................................................................................16
3.3. sustaInablE usE OF natuRal REsOuRCEs ..................................................................20
3.4. EnVIROnmEntal stEWaRDshIP .............................................................................23
3.5. EnhanCIng EnVIROnmEntal qualIty ......................................................................25
3.6. sECtORal PROgRammEs/PROjECts WIthIn DEPaRtmEnts .....................................................28
3.7. summaRy anD COnClusIOn ...............................................................................32
A new frAmework for P-e linked monitoring .................................................33
4.1. kEnya’s natIOnal POlICy FRamEWORk anD EnVIROnmEnt ...................................................33
4.2. ChallEngEs In DEVElOPIng POVERty-EnVIROnmEnt InDICatORs ..............................................36
4.3. aPPROaChEs In DEVElOPmEnt OF POVERty-EnVIROnmEnt InDICatORs .........................................36
4.4. summaRy anD COnClusIOn ...............................................................................37
annEx: matRIx OF PROPOsED InDICatORs FOR POVERty-EnVIROnmEnt mOnItORIng ..................................40
REFEREnCEs ..................................................................................................63
Table of conTenTs

P-E INdIcaTORs REPORT
v
AIDS AcquiredImmunodeficiencySyndromeAPRM nePAd African Peer review mechanismASALs Arid and semi-Arid AreasCBD UNConventiononBiologicalDiversityCBO Community-BasedOrganizationCDF ConstituencyDevelopmentFundCOMESA common market for eastern and southern AfricaCPPMU central Planning and Project monitoring unitDAMER DistrictAnnualMonitoringandEvaluationReportDC district commissionerDDO DistrictDevelopmentOfficerDEAP district environmental Action PlanDEC district environment committeeDfID DepartmentforInternationalDevelopment(UK)DHS DemographicandHealthSurveyDMEC district monitoring and evaluation committeeDO DistrictOfficerDRSRS DepartmentofResourceSurveysandRemoteSensingEAC EastAfricanCommunityEDPRS EconomicDevelopmentandPovertyReductionStrategy(Rwanda)EIA EnvironmentalImpactAssessmentEMCA environmental management and coordination Act, no. 8 of 1999ENR environmental and natural resourcesERS EconomicRecoveryStrategyforWealthandEmploymentCreation (2003-2007)FAO FoodandAgricultureOrganizationFBO Faith-BasedOrganizationFDI foreign direct investmentGHG greenhouse gasGoK GovernmentoftheRepublicofKenyaHIV HumanImmunodeficiencyVirusIAS InvasiveAlienSpeciesICT InformationandCommunicationTechnologyICZM integrated coastal Zone managementIEEA integrated environmental and economic AccountingIISD InternationalInstituteforSustainableDevelopmentISD IndicatorsofSustainableDevelopmentIUCN international union for the conservation of nature/world conservation unionJICA JapanInternationalCooperationAgencyJPOI JohannesburgPlanofImplementationKEFRI KenyaForestryResearchInstitute
abbreviaTions and acronyms

vi
Ministry of state for Planning, National development & Vision 2030
KFS KenyaForestServiceKNBS KenyaNationalBureauofStatisticsKWS KenyaWildlifeServiceLA LocalAuthorityLASDAP LocalAuthorityServiceDeliveryActionPlanLATF LocalAuthorityTransferFundMDG MillenniumDevelopmentGoalsM&E monitoring and evaluationMED MonitoringandEvaluationDirectorate(MoPND&V2030)MEMR MinistryofEnvironmentandMineralResourcesMICS MultipleIndicatorClusterSurveyMPA marine Protected AreaMoPND & V2030 MinistryofStateforPlanning,NationalDevelopmentandVision2030MTEF Medium-TermExpenditureFrameworkMTP Medium-TermPlan2008-2012NEAP national environmental Action PlanNEMA NationalEnvironmentManagementAuthorityNES national environment secretariatNESC national economic and social councilNGO NongovernmentalorganizationNIMES NationalIntegratedMonitoringandEvaluationSystemNTFPs Non-TimberForestProductsODA OfficialDevelopmentAssistanceODS OzoneDepletingSubstancesOECD OrganizationforEconomicDevelopmentandCooperationPC Provincial commissionerP-E Poverty-EnvironmentPEC Provincial environment committeePEI PovertyEnvironmentInitiativePEP Poverty-EnvironmentPartnershipPER PublicExpenditureReviewPOPS Persistent organic PollutantsPPA-IV FourthParticipatoryPovertyAssessment2005-2006PPP PublicPrivatePartnershipsPRSP PovertyReductionStrategyPaperSEA strategic environmental AssessmentSWG SectorWorkingGroupUNCED UNConferenceonEnvironmentandDevelopment(theEarthSummit)UNDP UnitedNationsDevelopmentProgrammeUNEP united nations environment ProgrammeWHO WorldHealthOrganizationWSSD (Johannesburg)WorldSummitonSustainableDevelopmentWTO WorldTradeOrganizationWWF worldwide fund for nature

P-E INdIcaTORs REPORT
vii
ThestudywasconductedunderthegeneralguidanceofJosephN.Mukui,Head,RuralPlanningDirectorate,MinistryofStateforPlanning,NationalDevelopmentandVision2030;ChristopherGakahu,AssistantResidentRepresentativeandHead,SustainabilityUnit,UNDP;andAngelaLusigi, Programme Officer, UNDP-UNEP Poverty-Environment Initiative Division of RegionalCooperation(DRC).Theday-to-dayoversightrolewastheresponsibilityofSamsonW.Wasao,National Programme Manager, Poverty Environment Initiative; with the support of JamesMwanziaandHezbourneMackobongooftheMonitoringandEvaluationDirectorate,MinistryofStateforPlanning,NationalDevelopmentandVision2030.Thereportreceivedcommentsduring a disseminationworkshop organized by theMonitoring and Evaluation Directorate.SomeofthefindingsofthestudywereusedbytheMonitoringandEvaluationDirectorateinaworkshoponthepreparationofnationalandministerial indicatorsformonitoringtheimplementationoftheVision2030andtheMedium-TermPlan2008-2012.Theircooperationwas instrumental to the success of the consulting activity, and we are grateful to all ofthem.
John T. Mukui (team leader)
Mukui Associates Limited
acknowledgemenTs

viii
Ministry of state for Planning, National development & Vision 2030
THE POVERTY aNd ENVIRONMENT INdIcaTORs REPORT
ThePovertyandEnvironmentIndicatorsReportistheproductofaconsultancycommissionedbyPElunderthephaseoneprojectOutput4:“Toolsdevelopedfortheintegrationofenvironmentintodevelopmentplansandbudgetprocesses”.TheactivitiesofthisparticularoutputwereimplementedincollaborationwiththeMonitoringandEvaluationDepartment(MED)ofthisMinistry.Thisreportisaresultofaconsultativeprocessofdevelopingministerialandnationalindicators, some of whose results were used during the formulation of the ministerial and nationalindicatorsformonitoringofVision2030anditsfirstMid-termPlan(2008-2012).
Thereportisdividedintofivemainsections:thefirstsectionoutlinespoverty¬environmentlinkages and discusses how these linkages are relevant in the national and sub-nationaldevelopmentprocesses;thesecondsectiondescribesthenationalmonitoringandevaluationsystem(NIMES) including itsdifferent levelsofreportingandthelinkstoMDGsindicators;thefourthsectionpresentsanddiscussesthekeyissuesinKenya’senvironmentandnaturalresourcessector.Finally,sectionfivesuggestsaframeworkforpoverty-environmentlinkedmonitoring within the context of nationalmonitoring and evaluation of the developmentprocess.Integrationofpoverty-environmentindicatorswiththemonitoringsystemwillensurethatpoverty-environmentandsectoral indicatorsarebuilt intotheVision2030monitoringsystemandtherebyembeddedintothenationalandsubnationalplanning,monitoringandevaluationsystems.
Thereportwillbeusefulasasourceofreferenceonpoverty-environmentlinkagesatnationalandsubnationallevelsforplanners,economists,statisticians,evaluatorsandotherinterestedpersonsworkinginthebroadareasthatlinkenvironmentandnaturalresourcestopovertyreductionanddevelopment. Itwillparticularlybeuseful for thoseofficers ingovernmentwiththeresponsibilityofmonitoringandevaluationofprojectsandprogrammesthatfocusonpovertyalleviationandenvironmentalsustainability.Thereportisalsorelevantforresearchersandscholarsintheareaofpoverty,environmentanddevelopment.
Dr. Edward Sambili Permanent Secretary, Ministry of State for Planning, National Development and Vision 2030
November, 2010
foreword

P-E INdIcaTORs REPORT
ix
1. INTROdUcTION aNd BacKGROUNd
TheGovernmentofKenyadevelopedaprogrammeofwork,theKenyaPovertyEnvironmentInitiative(PEI),tosupporttheintegrationofenvironmentintodevelopmentpolicy,planningandbudgetingprocesses.TheMinistryofStateforPlanning,NationalDevelopmentandVision2030(MoPND&V2030)leadstheprogrammeinpartnershipwiththeMinistryofEnvironmentandMineralResources(MEMR)andtheNationalEnvironmentManagementAuthority(NEMA).AspartoftheoutputsofthePEIproject,theGovernmentinitiatedanactivitytodevelopasetofpovertyandenvironmentindicatorslinkingpovertyandenvironmentatnationalandsub-nationallevels.
TheGovernment of Kenya recognizes the importance of the environment in achieving itseconomicrecoveryandpovertyreductiongoals.Forexample,theKenyaVision2030launchedin June 2008, aims at “a nation living in a clean, secure and sustainable environment”,guidedbyfourmajorthrusts:conservationofstrategicnaturalresources,pollutionandwastemanagement,aridandsemi-aridareas(ASALs)andhighriskdisasterzones,andenvironmentalplanningandgovernance.ProgressagainstVision2030andMediumTermPlanswillbemeasuredagainst targets contained in the planning documents, hence the need to review the coreindicatorsthatincludesthosethateffectivelyencompassthelinkagesbetweenpovertyandenvironment.
2. POVERTY-ENVIRONMENT LINKaGEs
Thedifferentcategoriesofvaluefromdiversity include(a)direct-usevalues(thebenefitsofawiderrangeofrawmaterialse.g.foodstuffs,medicines,buildingmaterialsandfodderfor livestock); (b) indirect-use values (environmental services that ecological biodiversitysometimesenhancese.g.microclimateregulationandprotectionfromerosion);and(c)non-usevalues(optionstousebiologicalresourcesinthefutureandculturalvalueintermsofitsrolesinoursharedsenseofhistoryandplaceintheworld).
The environment provides goods (natural resources) and services (ecosystem functions)usedforfoodproduction,theharvestingofwildproducts,energy,andrawmaterials.Theenvironment is also a recipient and partial recycler ofwaste products from the economyandan important sourceof recreation,beauty, spiritual values,andotheramenities.Theenvironmental soundness of growth is critical to the livelihood opportunities of the poor,and countries with similar levels of income and growth can have quite different levels of environmental performance as a result of differing policy, institutional frameworks andimplementationcapacities.
Poverty-environment linkagesaredynamicandcontext-specific—reflectingbothgeographiclocation and scale and the economic, social, and cultural characteristics of individuals, households,andsocialgroups. Inruralareas,poorpeopleareparticularlyconcernedwithsecure access to and the quality of natural resources - arable land and water, crop andlivestockdiversity,fishandbushmeatresources,forestproductsandbiomassforfuel.Fortheurbanpoor,water,energy,sanitationandwasteremoval,drainage,andsecuretenurearekeyconcerns.Poorwomenregardsafeandphysicallycloseaccesstopotablewater,sanitationfacilities,andabundantenergysuppliesascrucialaspectsofwell-being,reflectingwomen’sprimaryroleinmanagingthehousehold.
execuTive summary

x
Ministry of state for Planning, National development & Vision 2030
Ecosystems - such as forests, agroecosystems, grasslands, and freshwater and coastalecosystems (including coral reefs) and the biodiversity contained within them - provideessential“services”thatcontributeinnumerouswaystoproductiveactivitiese.g.provisionof natural habitat forwild pollinators that are essential to food crops; natural predatorsthatcontrolcroppestsandsoilorganismsimportanttoagriculturalproductivity;watershedprotection and hydrological stability, including recharging of ground water tables andbuffering of extreme hydrological conditions that might otherwise precipitate droughtor flood conditions;maintenance of soil fertility through storage and cycling of essentialnutrients;andbreakdownofwasteandpollutants.Whenecosystemfunctionsareimpaired,thisinevitablyleadstoanarrowingoflivelihoodchoicesandanincreaseinthevulnerabilityofthepoor.
Up to one-fifth of the total burden of disease in the developingworld is associatedwithenvironmental risk factors. There has also been an emergence of infectious diseases incombinationwithecosystemchanges,forexampleduetoalteredhabitat/breedingsites.Thepoor,particularlywomenandchildren,aremostaffectedbyenvironmentalhealthproblems,andtraditionalenvironmentalhazards-lackofsafewaterandsanitation,indoorairpollution,andexposuretodiseasevectors.
Pesticidepoisoningisasignificanthealthproblemamongpoorfarmersindevelopingcountries.Thepooralsosuffermoreindirecteffectsfromexcessiveuseofpesticides,suchasdepletionoffishstocksduetopesticideloadsinagriculturalrunoff.Contaminationoffoodcropswithpesticideresiduesisagrowingproblemforfarmersproducingforexportmarkets,asseveralimportantmarketsaretighteningtheirregulationsregardingpermissiblelevelsofpesticideresidues.
Insecurity is one of the key concerns of poor people, including their vulnerability tounpredictableevents.Insecurityrelatestopeople’sriskofexposure,susceptibilitytoloss,andcapacitytorecover.Boththeruralandurbanpooraremostoftenexposedtoenvironmentalhazardsandenvironment-relatedconflict,theysufferthegreatestlosses(atleastinrelativeterms),andtheyareintheweakestpositiontocopeandadapt.Tensionsbetweendiverseinterestgroupsovernaturalresourcescanalsocontributetoconflictandcivilstrife.
However,poverty-environmentlinksarenotnecessarilythesameascausallinkagesbetweentheenvironmentandpovertyi.e.howachangingenvironmentincreasesordecreasespoverty,orhowchangingpovertylevelsdamageorimprovetheenvironment.Theyaredimensionsofpovertythatconcerntheenvironmentalpartofthepoorpeople’slives,andthusrelatetopeople’sopportunitiesforeconomicadvancement(orlackofopportunities),socialorpoliticalempowerment(ordisempowerment),andsecurity(orvulnerability).Theydescribehowtheenvironmentalresourcesarepartandparcelofapoorperson’slivelihood.Inaddition,manytraditionalecosystemindicatorsarehighlysite-specific,andthereforeappearmorerelevantforlower-levelgeographicalareasratherthannationallevelmonitoring.
3. INTERNaTIONaL EXPERIENcE IN dEVELOPMENT OF P-E LINKEd INdIcaTORs
Among themajor achievements of the UN Conference on Environment and Development(UNCED),ortheEarthSummit,heldinJune1992wasAgenda21asablueprintforenvironmentanddevelopmentintothe21stcentury.Agenda21laysasolidfoundationforthepromotionofsustainabledevelopmentintermsofsocial,economicandenvironmentalprogress.Agenda

P-E INdIcaTORs REPORT
xi
21proposedanexpansionoftheexistingsystemsofnationaleconomicaccounts(inordertointegrateenvironmentandsocialdimensionsintheaccountingframework)andutilizationofsustainabledevelopment indicators innationaleconomicandsocialplanninganddecision-makingpractices.ThismandatewasreflectedinthedecisionoftheUnitedNationsCommissiononSustainableDevelopment(CSD)in1995toadoptanindicatorsworkprogramme,whichnowcontainsacoresetof50indicators,whicharepartofalargersetof96IndicatorsofSustainableDevelopment.The introductionofa core sethelps tokeep the indicator setmanageable,whereasthelargersetallowstheinclusionofadditionalindicatorsthatenablecountriestodoamorecomprehensiveanddifferentiatedassessmentofsustainabledevelopment.
TheCSDindicatorsethasbeenextensivelytested,appliedandusedinmanycountries.TheCSDindicatorscoverabroadrangeofissuesintrinsictoallpillarsofsustainabledevelopment-economicdevelopment,socialdevelopment,andenvironmentalprotection.Theindicatorsetisorganizedaroundthemes,namely,poverty;governance;health;education;demographics;naturalhazards;atmosphere;land;oceans,seasandcoasts;freshwater;biodiversity;economicdevelopment;globaleconomicpartnership;andconsumptionandproductionpatterns.
TheWorldBankalsodevelopeda setofPoverty-Environment Indicatorsunder thegeneralcategoriesof(a)environmentalhealthindicatorse.g.accesstosafewater,accesstosanitation,useoftraditionalfuels,useofinsecticidetreatednets,childmortality,prevalenceofdiarrheaandacuterespiratoryinfection;and(b)povertyandnaturalresourceindicatorse.g.povertyincidence,childnutrition,andexposuretonaturalhazards.TheWorldBankandtheWorldResourcesInstitutehavealsosupportedthedevelopmentofgeo-referencedindicatorsthatoverlay social or poverty indicators over a geographic framework.Other aspects ofWorldBank’sworkontheenvironmentinclude(a)aredefinitionofwealthasthecombinationofvarious forms of capital (produced, natural, and human resources) and (b) guidelines onpaymentsforenvironmentalservicessothatthosewhobenefitfromenvironmentalservicespayfortheirprovision,andthosewhoprovideenvironmentalservicesarecompensatedfordoingso.TheWorldBankalsopublishestheannualLittleGreenDataBook.
TheUnitedNationsMillenniumDevelopmentGoalshavebuiltbridgesbetweenconservationand poverty reduction, although one of theweaknesses of theMDGs is the separation ofenvironmentintooneofeightgoalssincebiodiversityconservationisnotjustthebusinessof theenvironmentgoal,butunderpins theachievementof theothers.Oneof themajorproblemswithmeasuringcountryprogresstowardMDGtargetsonenvironmentalsustainabilityisthattheyarenottime-boundandsometargetsarenotquantitative.Inaddition,theMDGsmainlyfocusonpressureindicators(measuresofecosystemuse)ratherthanecosystemserviceindicators(thecapacityofecosystemstosupplytheseservices).
UndertheglobalPEIinitiative,anumberofcountrieshavedevelopedpovertyenvironmentindicatorse.g.TanzaniaandRwanda.Tanzania’sNationalStrategyforGrowthandReductionofPoverty,knownbyitsSwahiliacronymofMKUKUTA,fullyincorporatesenvironmentalandnatural resourcesmanagement issuesandtargets in itsclustersstrategiesandprovidesanopportunity in the identification of poverty-environmental indicators, through its clearlystipulated goals and targets. MKUKUTA’s monitoring system recognizes the integration ofpoverty-environment indicators in measuring progress to achieving poverty reduction andenvironmental management targets.
TheintendedoutcomeoftheRwandaPoverty-EnvironmentInitiative(PEI)wastheintegrationof environment into national policy and planning processes to implement the Economic

xii
Ministry of state for Planning, National development & Vision 2030
Development and Poverty Reduction Strategy (EDPRS). The selection criteria were policyrelevance,measurability,clarityofthelinkagebetweenpovertyandenvironment,sensitivityto changes in data, degree of representation of priority issues, cost-effectiveness in datacollection,highqualityandreliability(unambiguous),appropriatespatialandtemporalscale,andavailabilityoreaseofsettingtargetsandbaselines.Acoresetofpriorityindicatorswasthendevelopedandbaselinesandtargetssetwheredataexisted.
Other initiatives to develop poverty-environment indicators include Uganda and Nigeria.Uganda developed a set of poverty-environment indicators covering land use, water andsanitation, use of forest resources, fish resources, environment and health, housing, andvulnerabilitytodisasters.TheEnvironmentDepartmentoftheWorldBankcommissionedastudyonpoverty-environmentindicatorsforNigeriawhoseobjectivewastoapplytheWorldBank’s analytical framework to a given country context, i.e. that of Nigeria. Canada andSwedenrecentlyscoredfirst(Sweden)andthird(Canada)inEcosystemWellbeingIndex,andhaveahighenvironmentalrecordbasedontheanalysisoftenkeyenvironmentalindicatorsusedbyOrganizationforEconomicDevelopmentandCooperation(OECD).
However,mostoftheindicatorsmentionedfailtorevealhowpressuresfromnewdevelopmentpolicies and programmes influence poverty-environment dynamics. Most of the indicatorsareinformation-intensiveandrequireafairlycomplexinformationsystemtosupporttheireffective use. some of the literature does not also highlight the extent to which the countries haveimplementedthemonitoringmechanismsproposed,andtheexperiencesgainedintheprocess.
4. dEscRIPTION OF THE NaTIONaL MONITORING aNd EVaLUaTION sYsTEM
TheNationalIntegratedMonitoringandEvaluationSystem(NIMES)isaninstitutionalframeworkforprovidingfeedbackontheeffectivenessofimplementationofthepoliciesandprogrammessetoutinnationalpolicydocumentsandensuresthatGoKobjectives,programmes/activitiesandprojectionsarebasedonsoundunderstandingofthevariouscircumstances,parameters,anddynamicsthatinfluencethesuccessofplansthroughuseoflessonslearntfromcurrentplanimplementation.
For effective implementation of NIMES, there are two levels of reporting: (a) a centralstructurewhichbringstogetherthelineministriesandotherbodiesandstakeholders(includingnongovernmentalstakeholders)toprovideareportingmechanismontheprogrammesoftheVision2030andtheMediumTermPlan2008-2012,and(b)adevolvedstructurebasedonkeypublicandnongovernmentalplayersatthelocal(district)level.
TheGovernmentinitiallydevelopedasetof31outcomeindicatorswhosemainpurposewastoprovideanoverviewofIP-ERSimplementationprocessasawhole.WiththefirstMTPforVision2030however,48outcomeindicatorshavebeendevelopedfornationallevelmonitoring.Theindicatorsincludethoseformacroeconomicstabilityandacceleratinggrowth,infrastructureandamenities,roadsafety,enhancementoftourismandtradeandindustry,childsurvival,healthandtheburdenofdisease,basiceducation,employmentcreationandlaborproductivity,improved environmental management and universal environmental screening of projects,incidenceofabsolutepoverty,accesstojustice,andpublicsectortransparencyanddevolutionofpower.However,theperformanceindicatorsdevelopedfortrackingIP-ERSareinadequateforaddressingthepoverty-environmentlinkages.

P-E INdIcaTORs REPORT
xiii
As noted in the med master Plan, one of the weaknesses of nimes is in monitoring of crosscutting issues e.g. gender, youth, HIV/AIDS, and environment. In addition, environment is a site-specificphenomenonanditsgeneralizationatthenationallevelfailstocapturesmallchangesinnaturalresourceutilizationandmanagementatthelocallevel.
5. PROTEcTORs OF THE ENVIRONMENT
Players in the environment sector are grouped into global, sub-regional, national, sub-national,community,householdand individual –allhavingdifferent interestsandactions.The competition between and within the levels is responsible for the poverty accountedbylossofenvironmentalservicesandproducts.Playersintheenvironmentsectorcanalsobe broadly grouped into three basic components of society - government, private sectorandcivil society. Inaddition,bilateral andmultilateral institutionsplaya significant role.IndividualandcollectivefunctionsoftheseinstitutionsandhowefficientlytheydispensetheirdevelopmentresponsibilitieswillinfluencetheattainmentofKenyaVision2030.Therefore,thePEIindicatorsmustcapturethecontributionsofstate,privatesectorandcivilsociety’scontributionstoenvironmentaldisruptions.
Theenabling legislation for the implementation of thenational environmentpolicy is theEnvironmental Management and Coordination Act (EMCA), No. 8 of 1999. The EMCA is aframeworklawthatprovidesforeffectivecoordinationandregulationofallactionsdirectedatorlikelytohaveinfluenceontheenvironment.However,aprominentfeatureofKenya’senvironmental legislation is its diffuse nature, with provisions being contained in a widevarietyofsectorallawswhichhaveyettobeamendedtoconformtotheEMCA.
TheMinistryofEnvironmentandMineralResources(MEMR)hastheoverallresponsibilityforpolicy direction on allmatters relating to the environment.The EMCAestablishes severalinstitutions with clearly defined mandates and responsibilities. These include the multi-sectoralNationalEnvironmentCouncil(NEC)astheapexnationalenvironmentalpolicymakingorganandtheNationalEnvironmentManagementAuthority(NEMA)asthenationalregulatoryagencywithdecentralizedentitiesattheprovincialanddistrictlevels.OtherministrieswhosefunctionshavedirectimplicationsfortheenvironmentsectorincludeMinistryofForestsandWildlife,MinistryofAgriculture,MinistryofLivestockDevelopment,andMinistryofFisheriesDevelopment.MinistrieswithfunctionssupportedbytheenvironmentsectorincludeHealth,Trade,Industry,LocalGovernment,Lands,Energy,EducationandNorthernKenya.
Kenya’s coalition government is comprised of 43 ministries, including the Office of ThePresident,Office of the Vice President, andOffice of the PrimeMinister. Eachministry iscomprisedofdepartmentsresponsibleformorespecificfunctions.Themainsemi-autonomousgovernmentagencieschargedwithimplementationofenvironmentalprogrammesincludetheNational EnvironmentManagementAuthority (NEMA), KenyaWildlife Service (KWS), KenyaForest Service (KFS), Kenya Forestry Research Institute (KEFRI), Department ofMines andGeology,theDepartmentofMeteorology,andtheDepartmentofResourceSurveysandRemoteSensing(DRSRS).
Themeso-level refers to the province and districts, where eachministry is represented.Individualministriesareresponsibleforprogrammeandactivityimplementation.Ministeriallevel management decisions are channeled through district and provincial managementcommittees chaired by district commissioners (DC) and provincial commissioners (PC),respectively. In the case of the Provincial Environment Committees (PEC) and District

xiv
Ministry of state for Planning, National development & Vision 2030
EnvironmentCommittees(DEC),NEMAservesasthesecretary.However,communitieshaveinthepastreportedthatthedistrictasaplanninganddecision-makingcentredoesnothaveclearmechanismsthatlinklocallivelihoodsissuesandoptionsthatresultinactivecommunityparticipationindistrict-levelplanningandimplementation.
6. KEY IssUEs IN KENYa’s ENVIRONMENT aNd NaTURaL REsOURcE sEcTOR
Thedraftnationalenvironmentpolicy,2008,hasidentifiedthefollowingaskeyenvironmentand natural resource issues: harmonization of sectoral policy instruments with EMCA;implementationoflandpolicy;valuationofenvironmentalandnaturalresources;rehabilitationofdegradedareas;lossofbiodiversity;concessionsandincentives;urbanizationandwastemanagement;pollution;energy;climatechangeanddisastermanagement;conservationofsharednaturalresources;invasiveandalienspecies;andpublicparticipation,environmentaleducation and awareness.
Theenvironmentisunderimmensepressurefromanincreasingpopulationandnaturalresourcealterations associated with the development process. Kenya’s important environmentalcomponentsincludeforest,freshwater,wetlands,coastalandmarine,mountains,aridandsemi-aridlands(ASALs),grasslandsandagriculturalland.
Forestecosystemsarebeingconvertedtootheruses,whichhasadverseenvironmentaleffectsonlong-termsustainabilityofforestecosystemsandendangersthecountry’swatersuppliessincethefivemajorwatertowersarelocatedinforestedlands.Manyfreshwaterecosystemshavebeendegradedbyimpoundment,excessiveabstraction,landusechangesandpollution.Wetlands are also being drained for agricultural use at an alarming rate. Other threatsto wetlands are degradation of catchments areas, pollution and unsustainable harvestingpractices.
Coastalandmarineecosystemsareunder increasingthreat fromurbanization,poorwastemanagement, shoreline modification, pollution (from land-based and other sources),overexploitationofmarinelivingresources,oilandgasexploration,useofdestructivefishingmethods,invasivealienspecies,andeffectsofclimatechange.
Mountain ecosystems are important for biodiversity conservation as they harbor uniqueassemblagesofplantsandanimals,includingendemicspecies.Mountainsareanimportantsourceofwater.Mountainecosystemshavebeensubjectedtoavarietyofusesandintheprocesshavebeensusceptibletodegradationthroughdeforestation,illegallogging,poachingofwildplantsandanimals,destructionofhabitatsbyfireandmining,grazing,encroachmentfor human settlements and agriculture as well as the effects of climate change.
AridandSemi-AridLands(ASALs)arefragileecosystemsthatreceiveverylowandunreliablerainfall.ThemainthreatstoASALsincludeexpandingagriculture,charcoalburningandfuel-wood,uncontrolledfires,humansettlements,landdegradation,deforestation,overgrazingandinvasivespecies.Thisisexacerbatedbytheimpactsofclimatechange.
Theagriculturalecosystemsprovidemanygoodsandservicesofenvironmental,economicandsocialimportanceandmakeimportantcontributionstosustainablelivelihoods,foodsecurityandnationaleconomy.However,thepresentcapitalandtechnology intensivefarmingandmonocultures have negatively impacted the environment e.g. loss of crop yields due topests.

P-E INdIcaTORs REPORT
xv
7. sUsTaINaBLE UsE OF NaTURaL REsOURcEs
The foundation for sustainableuseofnatural resources is secure,equitableaccess toandcontrolofnaturalresourcesincludingfairdistributionofthecosts,associatedbenefitsandopportunities. Activities contributing to land degradation include unsuitable agriculturallanduse,poorsoilandwatermanagementpractices,deforestationandovergrazing.Naturaldisasters,includingdroughts,floodsandlandslides,alsocontributetolanddegradation.Soilerosion is a major factor in land degradation and has severe effects on soil functions such as the soil’sability toactasabufferandfilter forpollutants, its role in thehydrologicalandnitrogencycle,and itsability toprovidehabitatandsupportbiodiversity.Soilerosionreduces theproductivityof land, requiring farmers toapplymoreandmore fertilizerandotherchemicals,whichinturncontributestosoildegradationandwaterpollution.
In Kenya, loss of biological diversity is taking place at an unprecedented rate. Themostimportantdriversarelandconversion,climatechange,pollution,unsustainableharvestingofnaturalresources,unsustainablepatternsofconsumptionandproduction,andintroductionofinvasiveandalienspecies.Invasivealienspeciessuchasprosopsisjuliflora,eichorniacrassipes,andlantanacamaraconstituteathreattobiodiversity.
Kenya isconsideredawater scarcecountry.Pollutionofwater resources isalsoagrowingconcernintermsofcostandhealth.Themaincausesofwaterpollutionareeffluentfromagriculturalactivitiesandrelatedindustries,soilerosion,industrialandhouseholdeffluent,andleachatesfromlandfillsites.
Increasing population, growing numbers of refugees, human-wildlife conflicts, widespreadpollution and the transformation of vast wildlife areas in ASALs threaten the continuedexistenceofwildlifeinKenya.
Kenya’s forestsareunderpressure fromcompetinguser-groupse.g. commercialusersandforest-adjacentcommunities.Therehasbeenimmensepressureforconversionofforestlandtootherusesespeciallytoagricultureandsettlements. Inaddition,illegallogging,cuttingtreesforfuel-woodandcharcoalaswellasgrazingcattlehasdegradedforests.Largescalelossof forestswould lead tocatastrophicandpermanentchange in thecountry’secology,withconsequentlossofagriculturalproductivity,industrialpotential,livingconditions,andaggravatednaturaldisasters,inparticularfloodsanddrought.
The overall state of Kenya’s fishery resources and their ecosystems is deteriorating dueto unsustainable fishing practices, habitat destruction, pollution, and weak managementstructures.Otherchallengesincludeuncoordinateddevelopmentapproaches,lowinvestment,inadequateaquaculturedevelopment,weaklinkagesbetweenresearchandmanagement,andcross-borderconflicts.To reverse this trendandachieve sustainabilityoffisheries, carefulstewardshipisrequiredtoconserveandprotectallaquatichabitatsforpresentandfuturegenerations.
8. ENHaNcING ENVIRONMENTaL QUaLITY
Environmentalhealthisaffectedbyharmfulenvironmentalfactorsthatimpacthumanhealthandcausedisease.Themostpressingproblemsintermsofenvironmentalhealth,including

xvi
Ministry of state for Planning, National development & Vision 2030
occupational health, are those associatedwith air andwater pollution,water supply andsanitation,wastedisposal,chemicalandfoodsafety.Thethreattotheatmospherearisesfromheightenedpollutionandvariesasaresultoflocalemissions,topographyandweather.Industryandvehiclescontinuetobethemainemittersofpollutantsintotheatmosphere.Airpollutionisoneoftheleadingriskfactorforrespiratorydiseasessuchaschronicobstructivepulmonarydisease,lungcancer,pulmonaryheartdiseaseandbronchitis.Themainairpollutantsaresuspendedparticulatematter,lead,sulphur,carbonmonoxide,hydrogensulphide,andoxideofnitrogen.Kenyadoesnothavesetstandardsformostorallairpollutants.
Despite efforts that encourage reuse, recycling and recovery, the amount of solid wastegeneratedremainshighandappearstobeontheincrease.Othercategoriesofwastesthatrequirespecialconsiderationareelectronicwastes,militarywastesandclinicalwastes.ThemainproblemsofsolidwastemanagementfacingKenyaarelackofacomprehensivenationallawonsolidwastemanagement;inadequatedumptrucks;illegalanduncontrolleddisposalofwaste;lackoffinancialresourcesforinvestmentandoperation;lackofpublicawarenessregarding solid waste management; and inadequate space for expansion/development ofdumpsites(especiallyinNairobicity).
Toxicandhazardoussubstancesareacriticalpartoftheglobaleconomyandalsooneofthegreatestthreatstohumanhealthandtheenvironment.Forexample,toxicandhazardouschemicalsarewidelyusedinKenyaparticularlyintheagriculturalsector.Toxicandhazardoussubstancesandtheirdisposalhavenotbeencomprehensivelyandadequatelyaddressedbyanypolicyorlegislationtodate.KenyalikemanyothercountriesinAfricaisvulnerabletoillegaldumpingofobsoleteandbannedtoxicandhazardoussubstances.
Exposuretohighlevelsofnoisecanresult insignificantadversehealthimpacts.Themostimportant is lossofhearingacuitycausedbyrepeatedexposuretohighnoiselevels.Suchexposuresoccurprimarilyintheworkplace,loudmusicinpublictransportvehicles,commercialactivitieswithinorclosetoresidentialareas(e.g.discos,factories,informalindustries),andreligious activities.
Theoffensiveodorornoxioussmellsofdecayisagrowingproblemespeciallyinmajorurbanareas. Itresultsfromhydrogensulphidereleasebydecomposinggarbageatdisposalsites,damreservoirsandbrokensewageconduits.
Changing patterns of consumption and production through integration of environmentalconsiderationsinallsectorsandotherpolicyareasisaprerequisiteforsustainabledevelopment.Currently,mostoftheproductionandconsumptionpracticesdonottakeintoaccounttheenvironmentalcosts.Asaresult,thebenefitsprovidedbynaturalresourcesappeartobemuchsmallerthantheyreallyare.Anintegratedaccountingsystemwillensurethatenvironmentalcostsintheproductionsystemsareconsidered.
Climatechangeisarealityandthathumanactivitiesarelargelyresponsibleforincreasingconcentrationofgreenhousegases(GHG)intheearth’satmosphere.Kenyaexperiencesheavy,devastatingfloodsduringstrongElNinoandLaNinaevents.Itisexpectedthatwithclimatechange,thefrequencyandintensityofextremeweathereventssuchasfloodsanddroughtswillincrease.ManyofthedisastersinKenyaareclimaterelated.Theyareassociatedwiththeextremeclimateeventswhichoccasionlandslides,increaseddiseaseepisodes,negativeeffects on farming, and massive livestock deaths.

P-E INdIcaTORs REPORT
xvii
Energyconsumptionperunitoftransportationactivity isakeymeasureofhowefficientlytransportationsystemsconvertenergyintohumanmobilityandgoodsdistribution.Inparticular,energyconsumptionfortransportationrelativetotheamountoffreightorpassengerscarriedandthedistancetraveledandtheresultantpollutionandclimatechangeisdependentonboththemixofvehiclesandtheenergyintensitiesofparticulartypesofvehicles.Theenergyintensities of train and bus transportation per passenger-km are commonly less than forcarsorairtransportation.Forfreight,energyintensitiesforrailandshiptransportationarecommonlylessthanfortruckingpertonne-km.
9. a NEW FRaMEWORK FOR P-E LINKEd MONITORING
Overtheyears,theGovernmentofKenyahasacknowledgedtheimportanceoftheenvironmentinachievingitseconomicrecoveryandpovertyreductiongoalsasdemonstratedinvariouskeypolicyguidelines.Forexample,environmentalchallengeshavebeenidentifiedintheKenyaVision2030andrecentparticipatorypovertyassessmentsandothermechanismsofpickingvoices of the poor have recorded increase in awareness and concerns for environmentalissues,especiallywithregardtopovertyreductionandsustainabilityofcurrentdevelopmentpoliciesandactivities.
Forexample, according to the fourthParticipatoryPovertyAssessment2005-2006, all thecommunities visited were concerned about the environment, e.g. destruction of naturalvegetation in the water catchments areas and conversion of such areas to agricultural use, reduction inwatervolumes fromnatural sources,disposalofnon-biodegradablematerials(plastics),urbanpollution,disposalofhumanwasteespeciallyinurbaninformalsettlementsandsmallurbancenters,anddenudationoftreesinmostpartsofthecountry.
AcommunityconsultativeplanningstudyundertakenbyWWFinBondo,Murang’aandMeruSouth districts listed the poverty-environment challenges to include an ever increasingpopulationanddiminishingresources,seasonalandenvironmentalstress,copingwithhungerand other povertymanifestations, environmental health and diseases, limited communityinvolvementinthemanagementofnaturalresources,andgovernanceandcorruption(e.g.illegallogging,sandharvesting,andlittletrustinpublicinstitutions).
Regionalandprovincialconsultativemeetingsheldaspartoftheprocessofpreparingthedraftnationalenvironmentpolicyrevealedthatcommunitiesareawareofthelinksbetweenlivelihoods and the environment, and the attendant dangers with the wanton destruction of theKenya’snaturalresourcebase.Someofthecommonissuesthatarosefromtheregional/provincialconsultativemeetingsinclude:wastemanagementinmosturbancenters,pollutioninlakesanddeclininglakewaterlevels,waterscarcityandwaterquality,encroachmentonwetlands,deforestation,pooragriculturalpractices,human-wildlifeconflict,lossofdiversity,quarryingandminingincludingsandharvesting,inconsistenciesinlawsandweakinstitutionalarrangements,unplanned settlements, climatechange, lackofdisastermanagement, andinvasivespeciese.g.waterhyacinth,prosopisjurifloraandhippograss.
However,thepolicyframeworkcontainedinVision2030andtheMediumTermPlan2008-2012shouldhavebeensubjectedtoaStrategicEnvironmentalAssessment(SEA)beforebeingusedasabasis fordevelopmentofP-E indicators, soas togaugetheenvironmental soundnessof thepolicy frameworkandensure that it doesnothurt thepoor in the short-termand

xviii
Ministry of state for Planning, National development & Vision 2030
underminelong-rungrowthanditseffectivenessinreducingpoverty.
TheoverallpurposeoftheP-EIndicatorswillbetoprovideameasurementframeworkthroughwhich to: (a) identify whether environment and poverty reduction linkages contribute toachievingnationalandsub-nationaldevelopmentpolicies,objectivesandtargetswithintheframeworkofVision2030andtheMediumTermPlan2008-2012;and(b)enableassessmentofprogresstowardssoundenvironmentalmanagementandpovertyreduction.This linkagebetweennationalpoliciesandtheimplementedprogrammesthroughtheP-Eindicatorswillassisttodemonstratetheextenttowhichdevelopmentissustainableinthelong-term,andprovidecruciallessonsforfutureprogrammedesign.Themeasurementswillbedoneatthenationalandsub-nationallevelsaselaboratedunderNIMES.
10. OUTLINE OF THE REPORT
The report consists of fourmain chapters.To lay the groundwork fordevelopingpoverty-environment indicators, the first chapter describes the role of environment in povertyreductionandotherpoverty-environmentlinkages,usingthemillenniumdevelopmentgoalsasaspringboard.
Thesecondchapterisadescriptionofthenationalmonitoringandevaluationsystemcoveringnational level reporting (e.g. NIMES and theNational EnvironmentalAction Plan), districtlevelreporting,andareviewofrelevanceofcurrentindicatorstoP-Elinkedmonitoring.Theaimofthischapteristopresentcurrentnationalandsub-nationalstructureswithinwhichtheproposedP-Eindicatorswillfall,andalsoserveasabasisfordiscussiononappropriateinstitutional arrangements for generation of data for the indicators.
ThethirdchapterpresentsspecificenvironmentalissuesinKenyagroupedaroundfivemainthemes: environmental issues, ecosystem services, sustainable use of natural resources,environmental stewardship, and enhancing environmental quality. The chapter serves toidentifythecriticalissuesthattheproposedpoverty-environmentindicatorsshouldcover.
Chapterfourcoverstheneedforanationalenvironmentframework,therelationshipbetweenP-EindicatorsandnationalP-Epolicyguidelines(e.g.Vision2030,draftenvironmentpolicy),anewframeworkforP-Elinkedmonitoring,andtherangeofproposedindicators.
The matrix of proposed national and sub-national level indicators in theAnnex uses thethematicissuesaspresentedinVision2030andMedium-TermPlan2008-2012.Theindicatorsselectedaresupposedtoprovideamenufromwhichacoresetofindicatorscanbeselected.Otherindicatorscanalsobechosenforministerialandagencylevel.
During the preparation of national and ministerial level indicators for tracking theimplementationofVision2030andMedium-TermPlan2008-2012,theconsultantsparticipatedinproviding inputsonpoverty-environment linked indicators.Table2showsthe indicatorsthatwere tentativelyagreedupon for inclusion in thenationalmonitoringandevaluationframework.

P-E INdIcaTORs REPORT
1
PoverTy-environmenT linkages 11.1 caTEGORIEs OF VaLUE FROM BIOdIVERsITY
TheobjectivesoftheConventiononBiologicalDiversityare(a)theconservationofbiologicaldiversity;(b)thesustainableuseofitscomponents;and(c)thefairandequitablesharingofthebenefitsarisingoutoftheutilizationofgeneticresources.
According to the Convention on Biological Diversity (1992), ‘biodiversity’ refers to ‘thevariabilityamonglivingorganismsfromallsourcesincluding,amongotherthings,terrestrial,marineandotheraquaticecosystemsandtheecologicalcomplexesofwhichtheyarepart;thisincludesdiversitywithinspecies,betweenspeciesandofecosystems’.Biodiversityreferstothelivingworld’scapacitytochange–variability–andtherangeofbiologicalformsandprocessesthatderiveasaresult–variety.Theimportanceofbiodiversitytohumansisthechoicesthatitoffers,fromtheperspectiveofboththepresentbenefitsofvariedandvariablelifeformsandthefutureoptionsassociatedwithvarietyandthecapacityoforganismstomutateandadapt(Vermeulen,2004).
Thedifferentcategoriesofvaluefromdiversityinclude:•Direct-usevalues:thebenefitsofawiderrangeofrawmaterials(e.g.foodstuffs,medicines,buildingmaterialsandfodderforlivestock).
•Indirect-use values: the environmental services that ecological biodiversity sometimesenhances. More diverse ecosystems may be better providers of stable and effectivemicroclimate regulation, protection from erosion, or other services. A perhapsunderestimated indirect-usevalueofgreaterbiodiversity isprotection frompredators,parasitesanddiseases.
•Non-usevalues:options tousebiological resources in the future (optionvalue),eitherduringourownlifetimesorinfuturegenerations(bequestvalue).Morediversecommunitiesofplantsandanimalsofferagreatervarietyofpotentialfutureusesaswellasagreatercapacitytoevolvenewformsandprocesses.Biodiversityalsohasanon-useculturalvalueintermsofitsrolesinoursharedsenseofhistoryandplaceintheworld,includingtheintrinsicvalueofnon-humanspecies’righttoexistence.
BiodiversityisalsointimatelylinkedtoEarth’sclimateand,inevitably,toclimatechange.Forinstance,changestonaturalecosystemsinfluencebothclimatechangeandpeople’sabilitytocopewithsomeofitsdamagingimpacts(ReidandSwiderska,2008).Inturn,climatechangeaswellaspeople’sresponsestoit,affectbiodiversity.Biodiversityiskeytoman’sadaptationtoclimatechange,effectivenessoflandscapesfunctionsinabsorbingandstoringcarbon,andtheeffectivenessofvegetationandecosystemsinreducingtheadverseimpactsofclimatechange.
1.2 POVERTY aNd ENVIRONMENT LINKaGEs1
Poverty encompasses both income and non-income dimensions of deprivation, includinglack of income and othermaterialmeans; lack of access to basic social services such aseducation,health,andsafewater;lackofpersonalsecurity;andlackofempowermentto
1This section is mainly based on UNDP, World Bank, European Commission, DfID, Linking Poverty Reduction and Environmental Management: Policy Challenges and Opportunities, July 2002

2
Ministry of state for Planning, National development & Vision 2030
participateinthepoliticalprocessandindecisionsthatinfluenceaccesstobasicrights.Theenvironmentalsoundnessofeconomicgrowthiscriticaltothelivelihoodsopportunitiesofthepoor,andcountrieswithsimilarlevelsofincomeandgrowthcanhavequitedifferentlevelsofenvironmentalperformanceasaresultofdifferencesinpolicy,institutionalarrangementsandimplementationcapacities.
The environment provides goods (natural resources) and services (ecosystem functions)usedforfoodproduction,theharvestingofwildproducts,energy,andrawmaterials.Theenvironmentisalsoarecipientandpartialrecyclerofwasteproductsfromtheeconomyandan important sourceof recreation,beauty, spiritual values,andotheramenities.Poverty-environmentlinkagesaredynamicandcontext-specific—reflectingbothgeographiclocationand scale and the economic, social, and cultural characteristics of individuals, households, andsocialgroups.Inruralareas,poorpeopleareparticularlyconcernedwithsecureaccesstoandthequalityofnaturalresources—arablelandandwater,cropandlivestockdiversity,fishandbushmeatresources,forestproductsandbiomassforfuel.Fortheurbanpoor,water,energy, sanitation andwaste disposal, drainage, and secure tenure are key concerns. Forpoorwomen,accesstopotablewater,sanitationfacilities,andabundantenergysuppliesarecrucialaspectsofwell-being,reflectingwomen’sprimaryroleinmanagingthehousehold.
Thepoor,particularlythoselivinginruralareas,oftendirectlyrelyonavarietyofnaturalresourceproducts(biodiversity)andecosystemservicesasasourceoflivelihood.Increasingly,theruralpoorliveinareasofhighecologicalvulnerabilityandrelativelylowlevelsofbiologicalorresourceproductivity,suchassubtropicaldry-landsorsteepmountainslopes.Thus,bothenvironmentalconditionsandaccesstoavarietyofnaturalresourcesarecrucialtotheabilityofpoorpeopletosustaintheirlivelihoods.
Naturalresourcescanbeaprimarysourceoflivelihoodormaysupplementahousehold’sdailyneedsandincome,andthepooraremostdependentonenvironmental incomeinrelativeterms.Soildegradationandthelossofpest-anddrought-resistantcropandlivestockvarietiesrepresentmajorthreatstoimprovingagriculturalproductivity,whichunderpinsthelivelihoodsof the vastmajority of rural poor and is a cornerstoneof poverty reduction strategies inmanycountries.Poorpeopleareaffectedbynaturalresourcedegradationandbiodiversitylossmuchmorethantherichbecauseoftheirlimitedassetsandtheirgreaterdependenceoncommonpropertyresourcesfortheirlivelihoods.Thepoorarealsomoredependentonbiomassfuelsandlessefficienttraditionaltechnologiese.g.openfirecookingandheatingmethods.Inaddition,poorruralwomenaredisproportionatelyaffectedbynaturalresourcedegradationandbiodiversityloss,asevidentbyincreasedtime,physicalburden,andpersonalrisk women face in traveling greater distances to collect fuel, fodder, and water due to growingresourcescarcityormorerestrictedaccesstocommonpropertyareas.Thisreducesthetimespentonincome-generatingactivities,cropproduction,andhouseholdandchild-rearingresponsibilities.
Ecosystems - such as forests, agroecosystems, grasslands, and freshwater and coastalecosystems (including coral reefs) and the biodiversity contained within them - provideessential“services”thatcontributeinnumerouswaystoproductiveactivitiese.g.provisionof natural habitat forwild pollinators that are essential to food crop production; naturalpredatorsthatcontrolcroppestsandsoilorganismsnecessaryformaintenanceofsoilfertilityandagriculturalproductivity;watershedprotectionandhydrologicalstability,includingtherecharging of ground water tables and buffering of extreme hydrological conditions thatmightotherwiseprecipitatedroughtorfloodconditions;maintenanceofsoilfertilitythrough

P-E INdIcaTORs REPORT
3
storage and cycling of essential nutrients; and breakdown ofwaste and pollutants.Whenecosystemfunctionsareimpaired,thisinevitablyleadstoanarrowingoflivelihoodchoicesandanincreaseinthevulnerabilityofthepoor.Somekeyecosystemtypes inKenyaareat riskofcollapse.These includecoral reefsandfreshwater systems that are at risk of fast decline due to pollution, overuse, or otherperturbationsthatreducebiodiversityorthatexceedacertainthresholdoftolerance.Theconsequenceisthatpeoplewhodependontheseecosystemsmayfindthemselvesdeprivedofessentialgoodsandservicesinarelativelyshorttimespanandunabletocopeoradapt.
Up to one-fifth of the total burden of disease in the developingworld is associatedwithenvironmentalriskfactors.Thepoor,particularlywomenandchildren,aremostaffectedbyenvironmentalhealthproblems,andtraditionalenvironmentalhazards-lackofsafewaterandsanitation,indoorairpollution,andexposuretodiseasevectors.
Therehasalsobeenanemergenceofinfectiousdiseasesincombinationwithecosystemchanges(PatzandConfalonieri,2005;seealsoPattanayakandYasuoka,2008,ondeforestationandmalaria).Thereasons(ordriversandtrends)canbedividedinsixgroups.Theseinclude:•Alteredhabitat/breedingsites:increasingbreedingsitesforthevectors(e.g.mosquitoes)duetoirrigationandwaterprojectsincultivatedsystems.
•Niche invasion or interspecies host transfer effects on infectious diseases transmissione.g.throughinteractionsbetweenwildnonhumanprimatesandhumansintropicalforesthabitats.
•Biodiversitychangeeffectsofinfectiousdiseasetransmission:e.g.batsinBrazilattackhumansandnexttothattheytransmitpathogensthatcauserabies.
•Human-inducedgeneticchangesofdiseasevectorsorpathogens:Forinstance,intensiveanimal production routinely uses antibiotics, and such sub-therapeutic levels exertselectivepressureontheemergenceofresistantbacteria(e.g.thedrug-resistantbacteriaSalmonellaenteritidis).
•Environmentalcontaminationofinfectiousagentsofdiseases:Oneexampleiscontaminationofwaterthroughinfectiousoocystslocatedinthefecalofmammals.
•Synergiesbetweenmalnutritionandinfectiousdiseases:Malnutrition,asaconsequenceofenvironmentaldegradation,hasahugeimpactonmorbidityandmortalityduetoinfectiousdiseases(e.g.diarrhoea,malaria,pneumoniaandmeasles).
Inadequate access to safe drinking water and sanitation, combined with poor hygienepractices, are major causes of ill health and life-threatening diseases, especially amongchildrenunderfiveyears.Theruralpoorrelyonnaturalwatersourcessuchasstreamsfortheirwashinganddrinkingwater.Vector-bornediseasessuchasmalariaarealsolinkedtoarange of environmental conditions and factors related to water contamination and inadequate sanitation.
Indoor air pollution from open burning of wood fuels (wood, dung, crop residues) duringcookingandheatingresultinprematuredeathformanywomenandchildrenasaresultofacute respiratory infections.Outdoor air pollution is becoming a health concern in urbanareas,andisprojectedtorivalindoorairpollutionasahealthriskfactoroverthenexttwodecades.Thethreemostcommonenvironment-relatedillnessesprevalentinpoorcountries,namely,diarrhealdiseases,respiratoryinfectionsandmalaria,arerelatedtowaterandindoorairpollution.Theseillnessesarealsofundamentallylinkedtoquantityandqualityofwatersupplyanduseoftraditionalenergy.

4
Ministry of state for Planning, National development & Vision 2030
Pesticidepoisoningisasignificanthealthproblemamongpoorfarmersindevelopingcountries.Thepooralsosuffermoreindirecteffectsfromexcessiveuseofpesticides,suchasdepletionoffishstocksduetopesticideloadsinagriculturalrunoff.Contaminationoffoodcropswithpesticideresidues isagrowing incomeproblemfor farmersproducing forexportmarkets,asseveralimportantmarketsaretighteningtheirregulationsregardingpermissiblelevelsofpesticideresidues.
Insecurityisoneofthekeyconcernsofpoorpeople,includingtheirvulnerabilitytounpredictableevents.Insecurityrelatestopeople’sriskassociatedwithexposure,susceptibilitytoloss,andcapacitytorecover.Boththeruralandurbanpooraremostoftenexposedtoenvironmentalhazardsandenvironment-relatedconflict,theysufferthegreatestlosses(atleastinrelativeterms),andtheyareintheweakestpositiontocopeandadapt.
Resourcemismanagementandenvironmentaldegradationcanexacerbatethefrequencyandimpactofdroughts,floods,forestfires,andothernaturalhazards.Thepoorarethemostvulnerable to environmental disasters (“shocks”) aswell as tomore gradual processes ofenvironmentaldegradation(“stresses”)-asthemajorityoftheruralpoorliveinecologicallyfragileareas,whiletheurbanpooroftenliveandworkinenvironmentswithhighexposuretoenvironmentalhazards.Thefrequency,intensityanddurationofextremeweathereventsis also likely to increase as a result of climate change,with significant negative impactsfromincreasedfoodinsecurity,greaterspreadofvector-bornedisease,moreflooding,andexacerbationoflanddegradation.
Tensionsbetweendiverseinterestgroupsovernaturalresourcescancontributetoconflict.Thesetensionsmaybeplayedoutattheregionallevel;atthenationallevel;andatthelocalleveloveraccesstonaturalresourcesonwhichthepoordirectlydependfortheirlivelihoods.Insuchcircumstances,thepoorwillbethemostnegativelyaffectedbecausetheyhavethefewestresourcestocopewithphysicalloss,andtheyarethemostvulnerabletoviolenceandlackappropriatemeansforlegalredress.Newresearchsuggeststhatcivilwarsmoreoftenarefueledbyrebelgroupscompetingwithnationalgovernmentsforcontrolofdiamonds,coffee,andothervaluableprimarycommodities thanbypolitical,ethnic,or religiousdifferences(Ross,2004).Insomecases,naturalresourceconflictscanbesoseverethattheycontributetowiderunrestandcanaffectthepoliticalstabilityofacountry.
Insummary,thevariouslinkagesbetweenpovertyandecosystemsrevealsthefollowingtenconstituentsand/ordeterminantsofwell-beingcloselyrelatedwithecosystems(Duraiappah,2002;citedinUNEPandtheInternationalInstituteforSustainableDevelopment,2004):•Beingabletobeadequatelynourished•Beingabletobefreefromavoidabledisease•Beingabletoliveinanenvironmentallycleanandsafeshelter•Beingabletohaveadequateandcleandrinkingwater•Beingabletohavecleanair•Beingabletohaveenergytokeepwarmandtocook•Beingabletousetraditionalmedicine•Beingabletocontinueusingnaturalelementsfoundinecosystemsfortraditionalculturalandspiritualpractices
•Being able to cope with extreme natural events including floods, tropical storms andlandslides
•Beingabletomakesustainablemanagementdecisionsthatrespectnaturalresourcesandenabletheachievementofasustainableincomestream

P-E INdIcaTORs REPORT
5
However,poverty-environmentlinksarenotnecessarilythesameascausallinkagesbetweentheenvironmentandpoverty(i.e.howachangingenvironmentincreasesordecreasespoverty,orhowchangingpovertylevelsdamageorimprovetheenvironment).Theyaredimensionsofpovertythatconcerntheenvironmentalpartofthepoorpeople’slives,andthusrelatetopeople’sopportunitiesforeconomicadvancement(orlackofopportunities),socialorpoliticalempowerment(ordisempowerment),andsecurity(orvulnerability).Theydescribehowtheenvironmentalresourcesarepartandparcelofapoorperson’slivelihood.
AsobservedbyHenningerandHammond(2002),thereareseriousconceptualproblems inmoving fromP&E links into P&E indicators. For example, “lack of an adequate supply ofcleanwatercontributestoillhealthandtheburdenofdisease;lackofasecurefoodsupplycontributestomalnutritionandhunger;andtheseinturnbearsomerelationshiptolevelsofpollutionandtheconditionofthenaturalresourcebasewithinacountry.Butprovable,causalrelationships between national average statistical indicators of environmental quality orconditionsandpovertyreductiongenerallydonotexist”(HenningerandHammond,2002).Inaddition,manytraditionalecosystemindicatorsarehighlysite-specific,andthereforeappearmorerelevantforlower-levelgeographicalareasratherthannationallevelmonitoring.
1.3 THE LINK TO THE MILLENNIUM dEVELOPMENT GOaLs
Itiswidelyacceptedthatbiodiversitylossandpovertyarelinked,andthatconservationandpovertyreductionshouldthereforebeaddressedjointly(RoeandElliott,2004).TheUnitedNationsMillenniumDevelopmentGoalshasbuiltbridgesbetweenthetwo,althoughoneoftheweaknessesoftheMDGsistheseparationofenvironmentintooneofeightgoalssincebiodiversityconservationisnotjustthebusinessoftheenvironmentgoal,butunderpinstheachievement of the other goals.
BiodiversityconservationisdirectlyaddressedinMDG-7(‘EnsureEnvironmentalSustainability’).Thisincludesatargetto‘integratetheprinciplesofsustainabledevelopmentincountrypoliciesandprogrammesandreversethelossofenvironmentalresources.’OfthetenindicatorsforMDG-7, four specifically address conservation: proportion of land area covered by forest,proportionoffish stockswithin safebiological limits,proportionof terrestrialandmarineareasprotected,andproportionofspeciesthreatenedwithextinction.
Inthecaseofincomepoverty(MDG-1),biodiversitycanprovideopportunitiesforjobs,smallandmicroenterprise,andgenerateincomethroughpaymentsforenvironmentalservices(e.g.intourismandwildproductsasasourceofcashincomeandemploymentforpoorpeople).Biodiversityunderpinsfoodsecurity(HungerMDG1),whilehealth-relatedMDGs4,5and6aredependent onbiodiversity asmoderndrugshave their origin in natural products, andmanypeoplerelyonwildherbalmedicinalplants.Water(MDG-7)isdependentonthegoodsandservicesthatbiodiversityprovides,andconservationofareassuchaswatercatchmentsforestsandfloodplainsisvitaltosustaindeliveryofecosystemservicessuchaswatersuppliesandfloodcontroltosettlementsandproductioncenters.Biodiversityhasavaluableroletoplayinachievingtheothermillenniumdevelopmentgoals,assummarizedinTable1below:

6
Ministry of state for Planning, National development & Vision 2030
mdg ExamplesoflinkstotheEnvironmenteradicate extreme povertyandhunger
Livelihoodsandfoodsecuritydependonfunctioningecosystems;Thepooroftenhavenoentitlementstoenvironmentalresources and inadequate access to environmental information, marketsanddecision-making;Lackofenergyserviceslimitsproductiveopportunitiesforthepoorest
Achieve universal primaryeducation
Timespentcollectingwaterandfuelwoodcanreducetimeavailableforschooling;Lackofenergy,waterandsanitationdiscourageteacherstolivein rural areas
Promotegenderequalityandempowerwomen
water and fuel collection reduce the time that women and girlsmighthaveavailableforeducation,literacyandincome-generatingactivities;Womendonotbenefitfromequalentitlementstolandandother natural resources
Reducechildmortality Waterandsanitation-relateddiseases(e.g.diarrhea)andrespiratoryinfectionsarethetwomostimportantcausesofunder-fivechildmortality;Lackofcleanwaterandfuelsforboilingwatercontributetopreventablewater-bornediseases
Improvematernalhealth Indoorairpollutionandcarryingheavyloadsofwaterandfuel-woodaffectwomen’shealth,increasingrisksofcomplicationduringpregnancy;Lackofenergy(light,refrigeration)andsanitationlimitthequalityofhealthservicesinruralareas
Combatmajordiseases Environmentalhealthhazardsareassociatedwithriskfactors(e.g.malaria,parasiticinfections);disease vector host from wildlife to humans due to environmental degradation
ensure environmental sustainability
Keepingtheresourcebase(landareacoveredbyforests,biodiversity,watersources)andregulatingenergy,carbondioxideemissionsandrecyclingprovidesthefoundationforthelinksdescribedinthistable
Globalpartnershipfordevelopment
Globalenvironmentalproblemsneedtheparticipationofrichcountries(thatconsumemoreresources);Externaldebt,unfairtermsoftradeandpredatoryinvestmentcanincreasepressuretooverexploitenvironmentalassetsindevelopingcountries;Productionofpollutantsasaresultofdevelopmentactivities
MainSource:UNDP/WorldBank/EuropeanCommission/DfID,LinkingPovertyReductionandEnvironmentalManagement:PolicyChallengesandOpportunities,July2002;alsoreproducedinPoverty-EnvironmentPartnership,2005.
Table1:ThelinksbetweentheenvironmentandtheMillenniumDevelopmentGoals

P-E INdIcaTORs REPORT
7
1.4 sUMMaRY aNd cONcLUsION
Thechapterpresentstherelationshipsbetweenpovertyandenvironment,wherepoverty-environmentlinkagesaredescribedasthedimensionsofpovertythatconcerntheenvironmentalpartofpoorpeople’slives.Theyareaspectsofpovertythatrelatetopeople’sopportunitiesforeconomicadvancement(or lackofopportunities), socialorpoliticalempowerment(ordisempowerment), and security (or vulnerability). Poverty-environment linkages are notnecessarilythesameascausal linkagesbetweentheenvironmentandpoverty(i.e.howachangingenvironmentincreasesordecreasespoverty,orhowchangingpovertylevelsdamageor improvetheenvironment). Insteadtheydescribehowenvironmentalresourcesarepartandparcelofapoorperson’slivelihood.
Thechapterclassifiesenvironmentalservicesandproductsintoprovisioning,regulatingandenrichingservices.Bothenvironmentalconditionsandaccesstoavarietyofnaturalresourcesarecrucialtotheabilityofpoorpeopletosustaintheirlivelihoods,andthepooraregenerallymoreaffectedbynaturalresourcedegradationandbiodiversity lossthantherichbecauseof their limited assets and their greater dependence on common property resources fortheirlivelihoods.TheP-Eindicatorsshouldbeabletotrackcontributionsofenvironmentalresourcestopoorpeople’seffortsforimprovingtheirwell-being.

8
Ministry of state for Planning, National development & Vision 2030
descriPTion of The naTional moniToring and evaluaTion sysTem
2
2.1 INTROdUcTION
TheNationalIntegratedMonitoringandEvaluationSystem(NIMES)isaninstitutionalframeworkforprovidingfeedbackontheeffectivenessofimplementationofthepoliciesandprogrammessetoutinnationaldocumentsliketheVision2030,theMediumTermPlan2008-2012,sectoralpolicydocuments,Ministries’ strategicplans,annualworkplansandperformance targets.TheNIMESensuresthatGoKobjectives,programmes/activitiesandprojectionsarebasedonsoundunderstandingofthevariouscircumstances,parameters,anddynamicsthatinfluencethesuccessofplansthroughusinglessonslearntforfutureplanning.
TheVision2030andsectoralpoliciesarenationalprogramsthatarenotnecessarilyconfinedtoGovernmentactivitiesandNIMES is thereforedesignedtoencompassallother relevantstakeholders that contribute toeffective implementationof these keyprograms includingpublic bodies at central and devolved levels, the private sector and civil society e.g.nongovernmental organizations (NGOs), faith-based organizations (FBOs) and community-basedorganizations(CBOs).
ThemainpurposeoftheNIMESisto:•BuildanM&Esystemforreportingatbothcentralgovernmentandlowerdevolvedlevels(mainlythedistrictlevel)
•PromotethepracticeofM&Eatalllevelsofgovernmentandcivilsociety•Providetimelyandreliablefeedbacktothebudgetarypreparationprocessthroughthepreparationofreports
•Provideregular,timelyandreliablereportontheeffectivenessofgovernmentprogrammes,and
•Ensuretheactiveparticipationofcivilsociety.
For effective implementation of NIMES, there are two levels of reportingwhich arewellstructured and integrated. The first is a central structure which brings together the lineministries and other bodies and stakeholders (including nongovernmental stakeholders) toprovideareportingmechanismontheprogrammesoftheVision2030andtheMediumTermPlan2008-2012.Thesecondisadevolvedstructurebasedonkeypublicandnongovernmentalplayersatthelocal(district)level.
2.2 NaTIONaL LEVEL REPORTING
Progress against the Economic Recovery Strategy for Wealth and Employment Creation(ERS) was measured against 31 indicators contained in the ERS implementation matrix.The outcome indicators for Vision 2030 were later developed consisting of 48 outcomeindicators for national level reporting andmonitoring, 16Districts andConstituency levelindicators,aswellas30genderreportingandmonitoringindicators.Atthenationallevel,theMonitoring and Evaluation Directorate of theMoPND&V2030 compilesAnnual ProgressReportsagainsttheagreedperformanceindicatorsusingdataandinformationsuppliedbytheKenyaNationalBureauofStatistics(KNBS)andrelevantfocalministries’CentralPlanningandProjectMonitoringUnits(CPPMUs).ThesedatasetsarealsosupplementedbyDistrictAnnual

P-E INdIcaTORs REPORT
9
MonitoringandEvaluationReports(DAMER)compiledbytheDistrictDevelopmentOfficerwithinputsfromsectoraldistrictofficersandforwardedtoMoPND&V2030.ThenationalAnnualProgressReport(APR)isacompositeonthenationalperformancetowardstheachievementofnationalobjectives.Itisbuiltaroundaperiodicreportingsystembasedonindicatorsattheoutput,outcome,andimpactlevels.
InordertoreporttothenationalM&Esystem,eachministrypreparesandsubmitsreportsonabiannualbasistocentralgovernmentthroughtheMonitoringandEvaluationDirectorate(MED)oftheMoPND&V2030.ThesereportsarepreparedinadherencetotheagreedformatsandaresummarizedasrequiredbytheMED.Initially,reportingtotheMEDwasrequiredonanannualbasis,normallyinJuly-August,priortothecommencementoftheannualbudgetarypreparation process in September/October, but this has been reviewed to biannual (six-monthly)reportingtoimprovetheeffectivenessandtimelinessofthesystem.
AttheMinistrylevel,severaltypesofreportinghavebeenestablishedtomeettherequirementsoftheNationalM&Esystem:•Reporting by sections/departments to the CPPMU: this form of reporting is of basicinformationnecessary for thecompilationofministerialM&Ereports.This reporting isundertakenbyeachdepartmentonthebasisofitsprogrammesassetoutintheministerialStrategicPlanandAnnualWork-plans(AWP).ThislevelofreportingiscoordinatedbytheCPPMUthatensurestheMEDM&Esystemiscompliedwithintermsofthesetstandards.Each Ministry has a CPPMU and the Head of the Ministry’s CPPMU is the designatedPrincipalM&EOfficer.Inthecaseofparastatalsandothersemi-autonomousgovernmentagencies(SAGAs),theM&Efocalpointisvestedintherespectiveplanningdepartment,whoforwardtheSAGA’sreportsthroughtheir respectiveparentministries totheMED.Thesekeyofficesareresponsibleforensuringthatthenecessaryflowsofinformationandreportsareprovidedonatimelybasis.
•Reporting by the CPPMU tomanagement takes the form of the submission of routinereportsbytheHeadofCPPMUtoseniormanagement intheMinistry.This isaprimarymechanismofinternalfeedbackwithintheMinistryintermsoftheprogressbeingmadeintheimplementationoftheAWPandachievingtheministerialperformancetargets.ThisinternalfeedbackmechanismisveryimportantbeforethereportsareforwardedtoMEDasitensuresMinisterialownershipofthereports.
OncethereportsarereceivedbyMEDandconsolidated,theMEDreportsbackinatimelymanner toall theMinistries/departmentswhoseprogrammesare themainobjectof theReport.ThisencouragesfuturecompliancewiththeM&EsystemaswellasprovidingimportantfeedbackonprogrammeeffectivenesstoadministrativeandtechnicalstaffintheconcernedMinistries.ThefeedbackprovidedalsoensuresbetterutilizationofthereportsbyMinistriesandtheentirenationalplanningandbudgetingactivitiese.g.SectorWorkingGroups(SWGs),Public Expenditure Reviews (PERs) and Public Expenditure Tracking Surveys (PETS). ThenationalM&E reports also form a valuable frame of reference to the NEPADAfrican PeerReviewMechanism(APRM)andtheMDGs.
2.3 dIsTRIcT LEVEL REPORTING
The broad purpose of M&E activities at the District level is tomonitor and evaluate theimplementation and effectiveness of programmes at the community level in order toprovidefeedbackfortheimprovementandfurtherdevelopmentofappropriatepoliciesandprogrammes.ThisbroadpurposeisdesignedtogiveKenyansavoicetoexpresstheirviews

10
Ministry of state for Planning, National development & Vision 2030
ontheappropriatenessandeffectivenessofdevelopmentpoliciesandprogrammes;assessprogressmadewiththecorenationalobjectiveoffosteringempowermentatthelocallevel;providedistricts’viewsoftheperformanceofthecentralministriesindeliveringservicestothepeopleandcommunitiesineverydistrict;provideanalysisandrecommendationsrelatingto institutional structuresand systemsat thedistrict levelandbelow; informtheprocessof refinementof thenationalpolicyofdecentralizationon thebasisofactual conditions,constraintsandopportunitiesatthedistrict,constituencyandcommunitylevel;complementthe monitoring and evaluation of central government through the central structure of the nationalM&Esystem;andidentifyanddefineappropriateissuesarisingatthedistrictlevelwhichrequireappropriatepolicyresponseseitheratdistrict,constituencyornationallevels.The16districtandconstituencyoutcomeindicatorsspecifiedintheMTP(2008-2012)oftheVision2030aremeanttoservethispurpose.
Theorganizationalstructureatthedistrictlevelischaracterizedbythepresenceofdifferenttypesofstructures,including(a)theprovincialadministrationbothatdistrictlevelandthelower levels such as division, location and sub-location, and (b) the various categories oflocal authorities (includingTownCouncils, CountyCouncil,Municipal Councils),which areself-governingunitswhichreportadministrativelytotheMinistryofLocalGovernment.Therearealso structuresand systemswhicharedefinedon thebasisofconstituencies,and thelocalofficesoftheMinistriesofcentralgovernment.Otherthanthegovernmentstructures,thereareotherstakeholderssuchastheprivatesector,civilsocieties(e.g.nongovernmentalorganizations)whichoperateatthislevel.TheinstitutionalstructureforM&Eatthedistrictlevelisthereforedesignedtobeall-inclusiveandcoversallinstitutions,whichcoexistwithinanygivendistrict.
Therefore,district levelM&Eneeds to takeaccountofdistrict-specificplanningprocessesandthevariouscategoriesoforganizationoperatingatthedistrictlevel.Someofthevariousplanningprocessesthatthedistrictsmustconsiderinclude:•ThenationalprogrammessetoutintheVision2030andtheMediumTermPlan2008-2012,whichdefinesbothbroadgoalsandawiderangeofsectoralpoliciesandprogrammes,whichareimplementedbycentralandlocalgovernmentandbynongovernmentalstakeholders.ThisisanimportantfunctionofM&EatthedistrictleveltotracktheextenttowhichthenationalgoalssetoutintheVision2030andtheMediumTermPlan2008-2012arebeingrealizedateachdevolvedlevel.
•Thedistrict level planning processes,which are centered on theDistrictDevelopmentPlans.Theseplanssetouttheprogrammesandprojectsonasectoralbasisforachievingthestateddevelopmentobjectivesatthedistrictlevel.
•Theplanspreparedbylocalauthorities(LAs),whichrelatetotheapplicationofrecurrentanddevelopmentexpenditurebytheLAs.Theseincludethelocalauthorityservicedeliveryactionplans(LASDAPs)whicharepreparedannuallybyeveryLAandwhichunderpinstheplanning and the LA’s applications for funding from the LocalAuthority Transfer Fund(LATF).
•Plans prepared at the Constituency level for prioritization of the application of fundsavailablethroughtheConstituencyDevelopmentFund(CDF).
•Planspreparedbythecommitteesresponsibleforthemanagementofthevariousspecialfundsavailabletothedistrictlevel,includingtheDistrictRoadsCommittee,theHIV/AIDSCommitteeandtheBursaryFundCommittees.
•DistrictPovertyReductionStrategydocumentspreparedintherun-uptothepreparationof the national PrsP and ers.

P-E INdIcaTORs REPORT
11
Tobeabletocoordinatemonitoringandevaluationthatservethemanyplayersatthedistrictlevel,aDistrictMonitoringandEvaluationCommittee(DMEC)exists ineachdistrictwherealltheinstitutionalcategoriesfunctioningatthedistrictlevelareincluded.ThesecretarytoDMECistheDistrictDevelopmentOfficer(DDO)andthemembershipisallkeystakeholdersindevelopmentmattersineachdistrict.TheCommitteecoordinatesthedistrictM&Esystemwhileappreciatingthediversityofplanningandimplementationprocessforeachstakeholder.
The District Monitoring and Evaluation Committee ensure that all programmes/ projectsimplementedatthedistrictlevel,irrespectiveoftheimplementingagency,aremonitoredandevaluatedandaDistrictAnnualMonitoringandEvaluationReview(DAMER)reportisprepared.TheDAMERinprinciplecoversthefullrangeofactivitiesandprogrammesbeingundertakeninthedistricttopromotedevelopment,includingthoseundertakenbycentralgovernmentagencies,localpublicsectorinstitutions,theprivatesector,thenongovernmentalsectorandcivilsociety.TheDAMERispreparedinJune-AugustofeachyearandsubmittedtotheMEDby31August.
Keyactivitiesundertaken in thepreparationof theDAMER include:preparationofaworkplanandbudgetfortheannualDAMERpreparationprocessbytheDDO;holdingofaninitialstakeholdermeeting from both governmental and nongovernmental sectors to brief themontheDAMERpreparationprocess;establishmentofaTaskForcebytheDMECtopreparetheDAMER;collectionofinformationrequiredforthecompletionoftheDAMER;holdingofinterviewswithkeystakeholdersbytheTaskForcemembers;preparationofadraftDAMERdocument;holdingasecondstakeholdermeetingtobriefstakeholdersfromthedistrictonthe provisional findings of theDAMER exercise and to obtain feedback before finalizationoftheDAMER;revisionofthedraftDAMERtoproduceafinalDAMER;andsubmissionoftheDAMERtolocalstakeholders,theProvincialPlanningOfficerandtheMED.
The DAMER preparation team relies on a wide range of sources of information includingexisting reports prepared by various organizations under existing reporting channels suchasperiodicdistrictreportspreparedbythedistrictadministration,whicharesubmittedtotheOfficeofthePresident;reportssubmittedbytheDDOtoMoPND&V2030;reportsontheCDFtotheMoPND&V2030;LASDAPandotherLocalAuthorityreportstotheMinistryofLocalGovernment;lineMinistryDistrictofficesreportstotheirheadoffices;RegionalDevelopmentAuthorities’reportstotheirparentministries;Specialprogrammes(e.g.ASALprogramme)reportstotheOfficeofthePresident;crosscuttingprogrammes(e.g.HIV/AIDS);andreportspreparedbythevariousNGOs,faith-basedorganizations,localcommunitiesandDevelopmentPartnersoperatinginthedistrictwhereapplicable.Useofsuchexistingreportsisverycrucialtothewholeprocessesbecauseitensuresconsistencybetweenthevariousreportsemanatingfromthedistrictandminimizesduplicationofeffortinthecollectionofinformation.
Othersourcesof information includededicatedsurveysundertakenbyoronbehalfoftheDAMERpreparationteam,tocollectinformation,forexample,onthepublic’sperceptiononthedevelopmentprocesses;formalsurveysundertakenbytheKNBSandotherdata-gatheringinstitutionsinthepublicsectorandcivilsociety;andinformationcollectedthroughsurveysconductedbytheAfricanPeerReviewMechanism.
TheMEDreviewsasampleoftheDAMERsandundertakesananalysisto identifythematicconclusionsarisinginthedistrict-levelreports.TheAnnualProgressSynthesisReportforthe

12
Ministry of state for Planning, National development & Vision 2030
devolvedstructureincludes,inannexform,thefindingsfromadistrictinrelationtothemainareascoveredbythereport.ThethematicfindingsarepresentedinaseparatechapterintheMED’sNationalAnnualProgressReport.
2.4 RELEVaNcE OF cURRENT INdIcaTORs TO P-E LINKEd MONITORING
For purposes of the overall monitoring and evaluation of the MTP and Vision 2030, theGovernmentdevelopedasetof48outcomeindicatorswhosemainpurposewastoprovideanoverviewofMTPimplementationprocessasawhole.Theintentionwastohavethe48performanceindicatorsformacontinuingbasisofoverallmonitoringandevaluationoftheMTPoveraperiodoffiveyears.The48performanceindicatorsselectedforsummaryreportingarenotanexhaustivesetofoutcomeindicatorsfortheMTPand,ingeneral,ministriesdevelopedanduseseveralotherindicatorsthatdonotfeatureinthelistof48indicators.MostoftheMinisterial level indicators are at output level and are relevant in informing the nationallevelmonitoring.NIMESconsistsofcoreindicatorsforeachsector(fromtheMinisterial-levelindicators)duetotheneedtohaveamanageablesystem.
The 48 indicators include those for macroeconomic performance monitoring(e.g.macroeconomicstabilityandeconomicgrowth,pricestability,domesticdebt,publicsectorwagebill,governmentrevenue,andpublicexpendituremanagementreform),infrastructureandamenities(roadnetwork,powercoverage,andwatercoverage),roadsafety(saferroadsystem), enhancement of tourism and trade and industry, child survival (infantmortality,underweightinchildren),healthandtheburdenofdisease(e.g.HIV/AIDS,maternalmortality),basic education (net enrolment rate, incidence of school dropouts and school repetition,transitionratetosecondaryeducation),employmentcreationandlaborproductivity,improvedenvironmentalmanagementanduniversalenvironmentalscreeningofprojects,incidenceofabsolutepoverty,accesstojustice,andpublicsectortransparencyanddevolutionofpower.Asnoted in the med master Plan, one of the weaknesses of nimes is in monitoring of crosscutting issuese.g.gender,youth,HIV/AIDS,andenvironment.
Out of the 48 outcome indicators, there are some that are very important for purposesof trackingpovertyandenvironment,but the linkagesarenotveryclearor inbuilt in theindicators.Theanalysisontherelevanceoftheindicatorsisthereforebasedontheircurrentstatewheretheissueoflinkagesisnotwelldefined.
Someoftheindicatorshaveinherentweaknessesinmeasuringwhattheysetouttomeasure.Forexample,theoutcomeindicatorfortheroadsectoristhe“proportionofroadnetworkinbad/poorcondition”,whichdoesnotshowprogressinkilometersofdifferentcategoriesofroadse.g.tarmacorgraveled/expanded.Inaddition,theindicatordoesnotcaptureanythingtodowithnegativeimpactonenvironmentasaresultofroadsconstruction.Theindicatoronwatercapturesaccess tosafewater,butdoesnotaddress important issues todowithenvironment likeprotectionof catchment areas, sanitation issues andefficiencyofwateruse.Indicatorsontourism(annualgrowthrateoftourists)andagriculture(growthrate)focusmoreonproductionandrevenue,withminimalconcernonconservationoftheecosystems(incaseoftourism)andsoilfertility,soilprotectionandlanddemarcation/tenure(incaseofagriculture).
The direct environmental indicators include forest area protected by gazettement andproportionofpublic sectorprojects subjected toEIA.Amore informative indicatorwouldhavebeen theabsolutenumberofhectaresexcisedeachyearorestimatedareaof trees

P-E INdIcaTORs REPORT
13
plantedthroughre-afforestationinthecountry.Theindicatorsdonotcoverthewholerangeofenvironmentalprotectione.g.numberoftreesplantedandsurvived,hectaresoflandprotectedfromerosion,pollutioncontrol,andcompliancewithEIAs.Theindicatorontheprevalenceofabsolutepovertyisagoodsummaryindicatorofpovertybutitisnotenvironmentallylinked,andmightnotthereforecapturewhatisbeingdonetotheenvironmentaspoorpeopleattempttomoveoutofpoverty.Theindicatorofhealthrelatingtoinpatientmalariamorbidityhassomeelementsofenvironmentlinkages,butthereisneedforindicatorsfocusingonwaterandsanitation-relateddiseasesanddeathscausedbyairpollutionandpoorhygieneorlimitedaccess to safe water and clean sanitation.
2.5 RELaTIONsHIP BETWEEN MdG INdIcaTORs aNd NIMEs
TheindicatorsforreportingunderNIMESandMDGsdifferincoverage,andevendefinitions(Mukui, 2008). At the national level, statistics are available that satisfy reporting underthetwosystems,althoughindicatorsforlowerlevelgeographicalareasmaynotbereadilyavailableorup-to-date(withtheexceptionofeducationandhealthindicators).
AlthoughKenyaregularlypreparesprogressreportsontheachievementoftheMDGs,ithasnotaligned thenational level reporting to its international reporting requirements to theUnitedNationsontheMDGs.TheGovernmentshouldstrivetomeetitsinternationalreportingrequirements,andincorporatepoverty-environmentindicatorsthatarenotreflectedintheNIMESorreportingontheMDGs.Inaddition,thefullrangeofindicatorsunderMDGreportingrequirementsshouldbeasubsetofNIMES,sothatresourcesareallocatedforcompilingMDGindicatorsandtheindicatorsbecomepartofthenationalinformationbase.
Several Ministries also maintain lists of indicators that satisfy both the MDG reportingrequirements, nimes, and their own internal needs. however, some of the ministerial-level indicatorsarenotincludedinthe31ERSindicators.Thereshouldthereforebeaconcertedeffort to document the information base at theministerial level, and an analysis of theextenttowhichitmeetsreportingundertheMDGsandtheproposedpoverty-environmentindicators.
2.6 sUMMaRY aNd cONcLUsION
TheNIMESisawellstructuredsystembothatthenationalanddistrictlevels.ThenationalanddistrictreportingrequirementsarealsocleartoimplementingMinistriesanddepartmentsas well as district-based stakeholders. The organizational structure for reporting appearswellcoordinatedandsystematic inthewayinformationisexpectedtoflow.However,theperformanceindicatorsdevelopedfortrackingIP-ERSareinadequateforaddressingpoverty-environment linkages and there is need to review them with an intention of improving/revisingtheindicatorsfortrackingVision2030programmes.
Inaddition,thereisaweakrelationshipbetweentheexistingindicatorsandresourceallocation(asanindicatorofeffortrequiredtoeffectchange)andtheoutcomeindicatorsarehardlyusedforministerialperformancemonitoring.Ministerialperformancecontractsmainlyrelyon Input Indicators (resources required for implementation of project or programme) andOutput Indicators (activities carriedout,measuredby training seminarsandworkshopsorgoodsandservicesgeneratedbytheprojectorprogramme),whileNIMESfocusesonOutcomeIndicators(useofoutputandlevelofsustainedproductionofbenefits).
14
Ministry of state for Planning, National development & Vision 2030
Thelackofastructuredprocessofmainstreamingenvironmentandnaturalresourcesintotheplanningandbudgetaryframeworksalsomakesitdifficulttotracktheeffectsofdevelopmentactivitiesontheenvironmentandnaturalresourcebase,ortheextenttowhichcurrentgrowthachievementsunderminelong-termdevelopmentthroughover-miningofnaturalresources.

P-E INdIcaTORs REPORT
15
key issues in kenya’s environmenT and naTural resource secTor
3
this Chapter presents the key issues in Kenya’s environment and natural resourcesectorsanditsimplicationsforP-Elinkages.TheChapteraimstodevelopaconceptualframeworkthatservesasalinkbetweenenvironmentalissuesandthePE-Indicators.
The issuescovered include (a)ecosystems, (b)environmental stewardship, (c) sustainableuseofnaturalresources,and(d)howtoenhanceenvironmentalquality.TheChapterisbasedonareviewofthedraftNationalEnvironmentPolicy(developedundertheleadershipoftheMinistryofEnvironmentandMineralResources),Kenya’scountryprofileonenvironmentbyJICA(2002),Vision2030,MTP2008-2012,andtheClimateChangeThematic reportontheNationalCapacityNeedsself-Assessment(NCSA)forKenya.
3.1 KEY ENVIRONMENT POLIcY IssUEs
The impactofhumanson theenvironment is a functionof totalpopulation, consumptionpatterns,wastegenerationandthetypeoftechnologiesused.TherateofgrowthinhumanpopulationisamajordriverofenvironmentaldegradationinKenya.
There is need to sustainably manage the finite natural resources on which economicdevelopment and people’s livelihoods, especially the poor, depend. In particular, there isneed to: (a) integrate environmental consideration in development planning, budgetinganddecision-makingprocessesforachievingaspirationsofVision2030anddomesticationofmultilateralandregionalenvironmentalagreements;(b)addresstheemergingenvironmentalchallenges such as climate change, and unsustainable consumption and productionpatterns, and unsustainable human settlements; (c) provide policy direction for effectiveimplementation of the Environmental Management and Coordination Act; (d) harmonizeconflictingpolicies inkeysectors suchaswater, forestry,wildlife,energy,andagriculturewithaviewtoenhancingcross-and inter-sectoral linkages; (e) raisepublicawarenessonenvironmentalissuesandenhancepartnershipsandstakeholderinvolvement;(f)curbmarkedincrease in environmental degradation and loss of biodiversity; and (g) decentralize anddevolveenvironmentalprotectiontothegrassrootsandenlisttheparticipationoftheprivatesector,nongovernmentalorganizations,community-basedorganizationsandothernon-stateactors.
Thedraftnationalenvironmentpolicy,2008,hasidentifiedthefollowingaskeyissues:
(a)Harmonization of sectoral policy instruments with EMCA: There are several sectoralpolicies and laws that deal with matters related to the environment which are notharmonizedwithEMCA.Someofthepolicies (e.g. inagriculture, tradeand industry)have significant negative impacts on the environment. It is imperative that policyinstrumentsinthesesectorsareharmonizedwithEMCAinordertoenhancesustainableenvironmentalmanagementandutilizationofnaturalresources.
(b)Implementation of land policy: Kenya does not have a clearly definedNational LandPolicy.Thishasresultedinlandconflictsandpoorlanduseplanning,thuscontributingto serious environmental degradation. however, it is acknowledged that at the time of developing this report, theGovernment had formulated a draftNational Land PolicywhichisawaitingCabinetapproval.

16
Ministry of state for Planning, National development & Vision 2030
(c)Valuationofenvironmentalandnaturalresources:Itisevidentthatthereismarketfailuregiventhatthevalueofenvironmentalresourcesishardlyreflectedinpricingofmarketedgoods and services as they are considered “public goods”. Integrating environmentalconsiderationsintothebehaviorofenterprisesandconsumerswouldreflectachangeinconsumptionandproductionpatterns.
(d)Rehabilitation of degraded areas: There are several degraded areas that requirerehabilitation.Theseincludequarries,riverbanks,deforestedareas,abandonedminesandquarries,erodedshorelineandhilltops.
(e)Lossofbiodiversity:Biodiversityplaysafundamentalroleinunderpinningthefunctionsof ecosystems and the services they provide. Themost important drivers of loss ofbiodiversityincludehabitatlossandfragmentation,landdegradation,climatechange,pollution,unsustainableharvestingofnaturalresources,bio-piracyandintroductionofinvasiveandalienspecies.Ingeneral,theavailabledatasuggestthatdespiteavarietyofinitiatives,biodiversitycontinuestodecline.
(f) Concessionsandincentives:Severalpoliciesparticularlyintheagricultural,tradeandindustrysectorprovideforconcessionsandincentivescausingnegativeenvironmentalimpacts.
(g)Urbanizationandwastemanagement: Increasing levelsofurbanizationarecausedbynaturalgrowthoftheurbanpopulationandmigrationoftheruralpopulationtowardsurban centers. Urbanization often leads to destruction of sensitive ecosystems. Inaddition, inadequate waste collection and waste management are the cause of serious urbanpollutionandhealthhazards.Thus,manyurbanenvironmentalproblemsaretheresultofpoormanagement,poorplanningandabsenceofcoherenturbanpoliciesratherthanofurbanizationitself.
(h)Pollution: Pollution continues to have a negative impact on the environment. Theintroductionofpollutantsintoair,waterandland,intentionallyoraccidentally,negativelyaffectspeople’shealthandwell-being,andtheenvironment.
(i) Energy:EnergyconsumptioninKenyaisontheincrease.However,therelativeutilizationofrenewableenergysources,excludinghydro-electric,islowandevenhydro-electricpoweroutputfluctuates in linewithprecipitationvolumes.Policy incentives todrivethe integration of renewable energy (i.e. solar, wind and biogas) into all aspects ofdevelopmentareurgentlyneeded.
(j) Climatechangeanddisastermanagement:Globally,theclimateischangingresultingindirectimpactsontheenvironment.AdverseimpactsfromclimatechangearealreadybeingobservedasevidencedbyvanishingglaciersonMt.KenyaandMt.Kilimanjaro.People and the environment are increasingly suffering from the effects of naturaldisasterssuchasfloods,landslidesandprolongeddroughts.Thereasonsforthisincludehigh population growth and density, environmental degradation, and the effects ofclimate change. managing disasters remains a challenge.
(k)Conservation of shared natural resources: Conflicts over control and managementof shared/trans-boundary resources are very common. For example, Lake Victoriaexperiencessuchseriousconflictsespeciallyinaccessingfisheriesresources.Thiscallsfor a framework for a harmonized and common approach to the conservation andmanagementofsuchshared/trans-boundaryresources.
(l) Invasive and alien species: Invasive and alien species are a major threat to theenvironment.Thesespeciesareathreatto indigenousspeciesthroughtheeffectsofpredation,alterationofhabitatordisruptionofecosystemprocesses.Theprevention,control or eradication of those invasive and alien species that threaten ecosystems,habitatsandspeciesisamajormanagementchallenge.
(m)Publicparticipation,environmentaleducationandawareness:broadpublicparticipation

P-E INdIcaTORs REPORT
17
inthedecision-makingprocessesisoneofthefundamentalpreconditionsforsustainabledevelopment, and this presupposes access to information on the environment anddevelopment. Sound environmental management has to be based on openness andparticipationatalllevels.Tostrengthenthepossibilityofthepublictoexertpressure,itisimperativethatenvironmentaleducationandpublicawarenessisenhanced.
3.2 EcOsYsTEMs sERVIcEs
Kenya’s national environment priorities recognize that life and thewell-being of Kenyansdependontheenvironment(throughitsservices)andhowwelltheenvironmentistakencareof.Recognitionofthevalueofenvironmentalhealthforwell-beingisinformedbyknowledgethatdevelopmentisadouble-edgedswordthatincludesdisruptionstoenvironmentalfunctionsforservicesandproducts,hencetheneedtopromotetheconceptofsustainabledevelopmentinordertomoderatethenegativeimpactsofdevelopment.
According toDaily (1997),ecosystem servicesarebroadly grouped into threecomponents-provisioning, regulating, and enriching. Under the provisioning services are food,microorganisms, animal products, genetic material, bio-chemicals and pharmaceuticals,fuels/energy,fiber,non-livingmaterials,freshwater,etc.
Undertheregulatingenvironmentalservicesarepurificationofairandwater,mitigationoffloodsanddroughts,detoxificationanddecompositionofwastes, renewalof soilsandsoilfertility,pollinationof cropsandnatural vegetation, control of vastmajorityofpotentialagriculturalpests,dispersalofseedsandtranslocationofnutrients,maintenanceofbiodiversityfromwhichhumanityhasderivedkeyelementsofitsagricultural,medicinalandindustrialenterprise,protectionfromthesun’sharmfulultravioletrays,partialstabilizationofclimate,moderationoftemperatureextremesandtheforceofwindsandwaves,etc.
Theenrichingenvironmentalservicesarecomprisedofspiritualusesandrelationshipofpeopleto land and water, aesthetic values, social relations and values, education and scientificvalue, etc.
However,inspiteoftheseimportantfunctions,theenvironmentisunderimmensepressurefromanincreasingpopulation.Kenya’skeyenvironmentalcomponentsincludeforest,freshwater,wetlands,coastalandmarine,mountains,aridandsemi-aridlands(ASALs),grasslandsandagricultural land.
3.2.1 Forest EcosystemsThe conservation and sustainabledevelopmentofforestecosystemsandtheir associated resources are essential foraneffectivepovertyreductionandsustainable development strategy.Consequently, the limited existingforestswhichcomprise less than2%ofKenya’stotallandareaareofvitalimportance. Forest ecosystems areimportant in conservation of soil,water, moderation of climate, and biodiversity. Forest ecosystems are

18
Ministry of state for Planning, National development & Vision 2030
therichestterrestrialhabitatsforbiodiversity.Maintainingforestbiodiversityprotectstheeconomicpotentialoffutureopportunitiesfornewnon-timberproducts,suchasfoodandmedicines aswell as social sustainability by offering aesthetic, spiritual and recreationalsettingsforpeople.
Forestecosystemsarebeingconvertedtootheruses.Agriculture,industry,humansettlementand development of infrastructure affect them most. These competing land uses haveadverseenvironmentaleffectsonlong-termsustainabilityofforestecosystems.Lossofforestecosystemshasnegativeimpactsonagricultureandthetourismindustrywhicharevitaltothenationaleconomy. Italsoendangers thecountry’swater supplies since thefivemajorwater towers are located in forested lands.
3.2.2 Fresh Water EcosystemsProvisioning services of freshwater ecosystemsincludethestorageandretention of water for domestic, agricultural and industrial use. regulating services include modifyingwaterflows(hydrologicalflows),recharginganddischarginggroundwater resources and diluting orremovingpollutants.Supportingservices of the hydrological cycleare important for soil formationand soil retention and nutrient cycling. Freshwater ecosystemsalso provide habitat for a greatnumberofspecies,promotingbiodiversitywhichunderliestheresilienceandproductivityofecosystems.Theyarealsoimportantforrecreation(e.g.LakesNakuruandNaivasha)aswellastheirspiritualandinspirationalrolesindifferentcultures.
In Kenya, many freshwater ecosystems have been degraded by impoundment, excessiveabstraction, landuse changes andpollution.Thepollutants tend to accumulate in rivers,lakesandwetlandscausingmuchdamagetowildlife.Asriversruntothesea,pollutantsalsoendupincoastalandmarineecosystemssuchaslagoons,estuariesandbays.Anexampleoftheimpactofhighchemicalpollutionwithoriginsfromagricultureisthewaterhyacinth.
3.2.3 Wetlands EcosystemsWetlandscoverabout3%ofKenya’ssurfacearea.Wetlandsplayanimportantroleinregulatingwater flow, groundwater recharge, water storage, filtering of nutrients and pollutants,shorelineandmicroclimatestabilizationandareofexceptionalimportanceashabitatsforlargenumberofspeciesespeciallybirds.Wetlandhabitatsarealsoofhigheconomicimportanceforprovisionofwaterandfisheries.Wetlandsinaridandsemi-aridlandsareanimportantrefugeforgrazing.Wetlandsarebeingdrainedforagriculturaluseatanalarmingrate.Otherthreatsto wetlands are degradation of catchments areas, pollution and unsustainable harvestingpractices.
Given their fragility, there is an urgent need to effectively manage and sustainably usewetlands.Abalancehastobestruckbetweentheenvironmentalfunctioningofwetlandsandtheiruseforlivelihood.Thisrequiresmanagementregimeswhichhelpmaintainsomeofthe

P-E INdIcaTORs REPORT
19
natural characteristics of wetlands while also allowing for their wise use. the convention on WetlandsofInternationalImportanceEspeciallyasWaterfowlHabitat(RamsarConvention)towhichKenyaisacontractingpartyprovidesaframeworkfornationalactionandinternationalcooperationfortheconservationandwiseuseofwetlandsandtheirresources.
KenyahasdevelopedaDraftWetlandsConservationandManagementPolicytodomesticatetheprovisionsoftheRamsarConvention.Currently,KenyahasfiveRamsarlistedsites,namely,LakesNakuru,Naivasha,Bogoria,BaringoandElementaita.TheTanaDeltaisintheprocessofbeinglistedasaRamsarsite.
3.2.4 coastal and Marine EcosystemsCoastal and marine ecosystems are composed of multiple interacting systems: maritime,terrestrialandaquatic,includingtheislandsandthe200nauticalmilesexclusiveeconomiczone(EEZ).Islandsofferuniqueecosystems.Coastalandmarineecosystemsprovideawiderangeof importantgoodsandservices.Theservices include storingandcyclingnutrients,regulatingwaterbalances,bufferinglandandprotectingitagainsterosionfromstormsandwaves,andfilteringpollutants.Onalargerscale,theoceansalsoplayanimportantroleinregulatingplanetarybalancesinhydrologyandclimate.
Coastal and marine ecosystems are under increasing pressure from overexploitation andpollution.Themajor direct threats to these ecosystems include urbanization, poorwastemanagement, shoreline modification, pollution (from land-based and other sources),overexploitationofmarinelivingresources,oilandgasexploration,useofdestructivefishingmethods, invasive alien species, and effects of climate change. The coastal zone is also
receivingincreasingnumbersoftourists.
Kenyawasoneof thefirstAfricancountriestoestablishmarineprotectedareas(MPAs)in1968.Atpresent,Kenyahas 6marineparksandreservesaccountingforabout1%ofthePAs in the country,with commitment underthe Nairobi Convention to increase it to atleast10%.TheGovernmenthasputinplaceaframework for the formulation of integrated CoastalZoneManagement (ICZM)PolicyandIntegratedOceanManagementPolicy.
3.2.5 Mountain EcosystemsMountain ecosystems are important for biodiversity conservation as they harbor uniqueassemblagesofplantsandanimals,includingendemicspecies.Mountainsareanimportantsourceofwater.Forexample,MtKenya,MtElgon,AberdaresRanges,MauEscarpmentandCherangani Hills are some of the Kenya’s major water towers. Mountain ecosystems areverydistinctfromlowlands,beingparticularlyfragileandhighlysusceptibletoerosionandlandslides.
Kenya’smountainecosystemshavebeensubjectedtoavarietyofusesandintheprocesshavebeensusceptibletodegradation.Themaindriversofmountainecosystemsdegradationaredeforestation,illegallogging,poachingofwildplantsandanimals,destructionofhabitatsbyfireandmining,grazing,encroachmentforhumansettlementsandagriculture,aswellastheeffects of climate change.

20
Ministry of state for Planning, National development & Vision 2030
3.2.6 arid and semi-arid Lands EcosystemsArid and Semi-Arid Lands (ASALs) arefragile ecosystems that receive verylowandunreliable rainfall.TheASALsconstitute about 80% of Kenya’s landarea and supports about 30% of thepopulation.Themainformoflandusein ASALs is pastoral grazing (mainlycamels, cattle and goats), accountingfor about 60% of the total livestockpopulation. Pastoralism involvesconsiderable mobility to capitalizeon spatially and temporally dispersed
commonly-ownednaturalresourceswhichareregulatedatthe levelofcollectivity,ratherthanbyseparatelandowners.TheASALs further provide critical habitats forwildlife and ecosystem diversity, includingwetlands formigratory species.Themain threats toASALs include expanding agriculture,charcoalburningand fuel-wood,uncontrolledfires,humansettlements, landdegradation,deforestationandovergrazing.This isexacerbatedbythe impactsofclimatechange.TheGovernmentisgivingspecialattentiontoinvestmentinASALsthatincludedevelopmentofanintegrated land use master Plan.
3.2.7 Grassland EcosystemsThereareseveraltypesofgrasslandsdependingonlocation:highland,savannah,moorlandand
rangelands.Otherimportantgrasslandtypesincludefireinducedgrasslands,seasonal flood plain and deltagrasslands. Grasslands are importanthabitats for wildlife and migratoryspeciesespeciallybirds.Consequently,grasslands are important for nature-based tourism, extensive livestockproduction and recreation activitiesas well as for water conservation and erosion control.
3.2.8 agricultural EcosystemsAgricultural ecosystems provide different types of goods and services of environmental,economicandsocialimportanceandmakeimportantcontributionstosustainablelivelihoods,foodsecurityandnationaleconomy.Forexample,theagriculturalsectoraccountsforabout24%oftheGDP.Whereasthepresentcapitalandtechnologyintensivefarmingandmonocultureshave been extremely productive and competitive, they also bring a variety of economic,environmentalandsocialproblems.TheamountofcropdiversityperunitofarablelandinKenyahasdecreased.Therefore,relianceonmonoculturefarmingandagro-industrialinputs(suchascapitalintensivetechnology,pesticidesandchemicalfertilizers)negativelyimpactontheenvironment.Forexample,thelossofcropyieldsduetopestsdespitethesubstantialincreaseintheuseofpesticidesisasymptomoftheenvironmentalcrisisinagriculture.

P-E INdIcaTORs REPORT
21
The range of solutions tomitigate the environment-based crisis in the agricultural sectorshouldincluderesearchanddevelopment(R&D),asbiotechnologyhasimmensepotentialtoenhancelivelihoodsandcontributetotheeconomicdevelopmentofthecountry.However,livingmodifiedorganisms(LMOs), ifnotregulated,mayposesignificantriskstoecologicalresources andhuman and animal health.TheGovernment is in the process of enacting aBiotechnologyandBiosafetylegislation.
3.3 sUsTaINaBLE UsE OF NaTURaL REsOURcEs
Thefoundationforsustainableuseofnatural resources issecure,equitableaccesstoandcontrolofnaturalresourcesincludingfairdistributionofthecosts,associatedbenefitsandopportunities.Themajorityofthepopulationlivesinruralareas,andmostofthemdependonnaturalresourcesfortheir livelihoods,andoftenfortheir immediatesurvival.Thekeynaturalresourcesareland,soils,biodiversity,water,wildlife,forest,fisheries,mineralsandlivestock.
3.3.1 LandLandresourcesarefinite,fragileandnon-renewable.Landisaresourcethatprovidestheessentialservicesfordevelopmentandhumanwellbeing.Consequently,thepressureonlandiseverincreasing,mainlyfrompressuretoincreasefoodproductionandunsustainablehumansettlements.
Theunsustainableuseof land inurbanand ruralareas isamajorareaofconcerndue totheseriousimpactontheenvironment.Activitiescontributingtolanddegradationincludeunsuitableagricultural landuse,poorsoilandwatermanagementpractices,deforestationandovergrazing.Naturaldisasters,includingdroughts,floodsandlandslides,alsocontributeto landdegradation. Inorder toachievesustainablemanagementof theenvironmentandnaturalresources,itisimperativetohaveaNationalLandPolicy.
3.3.2 soilsFertilesoilsareafoundationforsustainableagriculture.Soilsarealsoanessentialplayerin thehydrological cycle. Soildegradationprocessesofparticular concern throughout thecountryincludeerosion,compactionandsoilfertilitydepletion.Thelossofvegetationcoverhasexposedsoilstowindandsoilerosion.soil erosion is a major factor in land degradation and has severe effects on soil functions suchasthesoil’sabilitytoactasabufferandfilterforpollutants,itsroleinthehydrologicalandnitrogencycle,and itsabilitytoprovidehabitatandsupportbiodiversity.Soilerosionalsocausesincreasedratesofsiltationofdamsandrivers,andincreasedriskoffloodinginriversandestuaries.Thus,soilerosionreducestheproductivityof land,requiringfarmerstoapplymoreandmorefertilizerandotherchemicalsthathelpcheckfallingproductivity.Theresultantexcessiveuseoffertilizersandotherchemicalscontributetosoildegradationandwaterpollution.However,manysmall-scalefarmerscannotaffordproduction-enhancingchemicalinputsandsogetlowcropyieldsandreturns.Also,soilsinmanypartsofKenyaarecontaminatedbyheavymetals(lead,exhaustgasesandcadmium)thatfindtheirwayintothefood chain.
Wastewater irrigation in Nairobi may be a significant source of kale, spinach, tomatoes,chilies,onions,cabbages,arrowroots,sugarcaneandmaize(Mukui,2002).Thesevegetablesposeahealthrisktoconsumerssinceheavymetalslikeleadandmercuryaredepositedintheplanttissuesandcanleadtoheavymetalpoisoningwhensubstantialquantitiesareconsumed

22
Ministry of state for Planning, National development & Vision 2030
overalongtime.Afewfarmersalsogrowfoddercrops(e.g.Napiergrass)alongtheriver,andheavymetalsmightbefindingtheirwayintoplanttissuesandfinallyintoanimalproductswhichcanposeaserioushealthrisktoconsumers(Mukui,2002).
Currently,nomonitoringforsoilpollutionisbeingdone.SomeoftheinstitutionsresponsibleforregulatingandmonitoringsoilcontaminationaretheMinistryofAgriculture,MinistryofEnvironmentandMineralResources(includingNEMA),MinistryofWaterandIrrigation,andMinistryofHealth,withthesupportofNGOsandCBOsatthelocallevel.
3.3.3 BiodiversityBiodiversitycontributes toawidevarietyofenvironmental services, suchas regulationofthegaseouscompositionof theatmosphere,protectionofcoastal zone, regulationof thehydrological cycle and climate, generation and conservationof fertile soils, dispersal andbreakdownofwastes,pollinationofmanycrops,andabsorptionofpollutants.Humanhealthandwell-beingaredirectlydependentonbiodiversity.Forexample,10%oftheworld’s25topsellingdrugs in2000werederivedfromnaturalsources.Biodiversityalsoprovidesgeneticresources for foodandagriculture,and thereforeconstitutes thebiologicalbasis for foodsecurity and support for human livelihoods.A number ofwild crop relatives are of greatimportancetothenationaleconomy.
InKenya,lossofbiologicaldiversityistakingplaceatanunprecedentedrate.Theimportantdriversoflossofbiodiversityincludelandconversion,climatechange,pollution,unsustainableharvestingofnaturalresources,unsustainablepatternsofconsumptionandproduction,andintroductionofinvasiveandalienspecies.Invasivealienspeciessuchasprosopsisjuliflora,eichorniacrassipes,andlantanacamaraconstituteathreattobiodiversity.
3.3.4 Water ResourcesKenya is considered awater scarce countrywith annual renewable freshwater supplyof 647m3 per capita. Kenya’s total annualrenewable water resource is estimated at30.7billioncubicmetresperyear,with20.2billion cubic metres coming from internalrenewablesurfacewaterandtheremaindersuppliedbygroundwaterandincomingflowsfrom trans-boundary rivers. Most of thedrinking water comes from surface water sources or from underground aquifers. About 32% of Kenyan households rely ongroundwaterfortheirdrinkingwatersupply.Currentestimatesofwatersupplyindicatethat75%ofthecountry’surbanpopulationhasaccesstosafedrinkingwater,whileabout50%oftheruralpopulationhasaccesstopotablewater from various sources. the demand for water is high and increasing. the main demand comesfromhouseholds,industry,agriculture,irrigationandhydropowerproduction.Atthesametime,plentyofwaterisrequiredtosustaintheecosystemsandoftenthiscomponentisomittedwhenquantifyingdemand.
Pollutionofwaterresources isagrowingconcernandprovidesamajorchallenge,both in
2Leachate is a liquid that has percolated through soil and dissolved some soil materials in the process (McGraw-Hill, 2003

P-E INdIcaTORs REPORT
23
termsofcostandhealth,withpollutantscomingmainlyfromagriculture,untreatedsewage,industry andmining. Infestations of variouswater bodies by invasiveweeds are a furthersourceofsurfacewaterdegradation.Unsustainablelandusepracticesthatleadtocatchmentsdegradationisalsoamajorproblemthataffectsquantityandqualityofwater.
one of the greatest threats to human health remains the continued use of untreated water.Whilethepercentageofpeopleservedwith improvedwatersupplieshas increased,alargemajorityofthoselivinginruralareasand informal settlements still lack access to safedrinkingwaterandimprovedsanitation,which is a major cause of water-related diseases.Themaincausesofwaterpollutionare effluent from agricultural activities andrelatedindustries;soilerosion;industrialandhouseholdeffluent;andleachatesfromlandfillsites2 .The institutions andorganizations responsible formonitoringand regulatingwaterpollutionincludetheMinistryofWaterandIrrigation,MinistryofEnvironmentandMineralResources(includingNEMA),NairobiandMoiuniversities,NationalWaterConservationandPipelineCorporation,MinistryofLocalGovernment,MinistryofLands,MinistryofAgriculture,andMinistryofTransportandCommunication.
3.3.5 Wildlife ResourcesWildliferesourcescontributedirectlyandindirectlytothelocalandnationaleconomythroughrevenuegenerationandwealthcreation.Forexample,in2007,wildlifeaccountedfor70%ofthegrosstourismearnings,25%oftheGrossDomesticProduct(GDP)andmorethan10%oftotalformalsectoremployment.Increasingpopulation,growingnumbersofrefugees,human-wildlifeconflicts,widespreadpollutionandthetransformationofvastwildlifeareasinASALsthreatenthecontinuedexistenceofwildlifeinKenya.
3.3.6 Forest ResourcesForestsareimportantformaintainingbiologicaldiversityandarevitalfortheeconomythroughthe production of timber and non-timber products and provision of other environmentalservices (e.g. sustainable eco-tourism). Besides providing a habitat for wildlife, forestsconservesoilandmitigatefloodsanddrought.Forestssupportthelivelihoodsofruralandurbancommunitiesbyprovidinghouseholdenergy for cooking,buildingmaterials, fodder,medicinesandemploymentopportunities.Inaddition,forestsprovidenumerousculturalandreligiousbenefitstolocalpeople.
Kenya’s forests are under pressure fromcompeting user-groups, namely commercialusers and forest-adjacent communities. Immensepressurealsocomesfromconversionof forest land to other uses especially toagriculture and settlements. in addition, illegal logging, cutting trees for fuel-wood and charcoalaswellasgrazingcattlehasdegradedforests. large scale loss of forests would lead tocatastrophicandpermanentchangeinthe
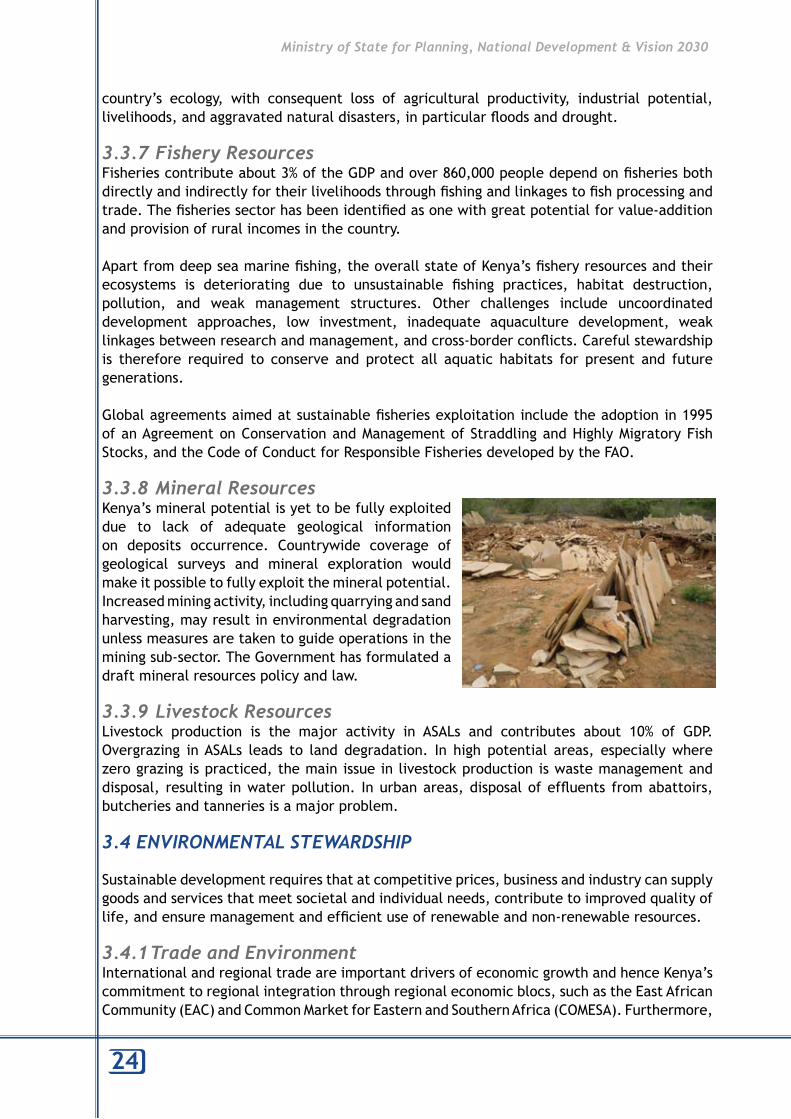
24
Ministry of state for Planning, National development & Vision 2030
country’s ecology, with consequent loss of agricultural productivity, industrial potential,livelihoods,andaggravatednaturaldisasters,inparticularfloodsanddrought.
3.3.7 Fishery ResourcesFisheriescontributeabout3%oftheGDPandover860,000peopledependonfisheriesbothdirectlyandindirectlyfortheirlivelihoodsthroughfishingandlinkagestofishprocessingandtrade.Thefisheriessectorhasbeenidentifiedasonewithgreatpotentialforvalue-additionandprovisionofruralincomesinthecountry.
Apartfromdeepseamarinefishing,theoverallstateofKenya’sfisheryresourcesandtheirecosystems is deteriorating due to unsustainable fishing practices, habitat destruction,pollution, and weak management structures. Other challenges include uncoordinateddevelopment approaches, low investment, inadequate aquaculture development, weaklinkagesbetweenresearchandmanagement,andcross-borderconflicts.Carefulstewardshipis therefore required to conserve and protect all aquatic habitats for present and futuregenerations.
Globalagreementsaimedatsustainablefisheriesexploitationincludetheadoptionin1995ofanAgreementonConservationandManagementofStraddlingandHighlyMigratoryFishStocks,andtheCodeofConductforResponsibleFisheriesdevelopedbytheFAO.
3.3.8 Mineral ResourcesKenya’smineralpotentialisyettobefullyexploiteddue to lack of adequate geological information on deposits occurrence. Countrywide coverage ofgeological surveys and mineral exploration wouldmakeitpossibletofullyexploitthemineralpotential.Increasedminingactivity,includingquarryingandsandharvesting,mayresultinenvironmentaldegradationunlessmeasuresaretakentoguideoperationsintheminingsub-sector.TheGovernmenthasformulatedadraftmineralresourcespolicyandlaw.
3.3.9 Livestock ResourcesLivestock production is the major activity in ASALs and contributes about 10% of GDP.Overgrazing inASALs leads to land degradation. In high potential areas, especiallywherezerograzingispracticed,themainissueinlivestockproductioniswastemanagementanddisposal, resulting inwaterpollution. Inurbanareas,disposalofeffluents fromabattoirs,butcheriesandtanneriesisamajorproblem.
3.4 ENVIRONMENTaL sTEWaRdsHIP
Sustainabledevelopmentrequiresthatatcompetitiveprices,businessandindustrycansupplygoodsandservicesthatmeetsocietalandindividualneeds,contributetoimprovedqualityoflife,andensuremanagementandefficientuseofrenewableandnon-renewableresources.
3.4.1 Trade and EnvironmentInternationalandregionaltradeareimportantdriversofeconomicgrowthandhenceKenya’scommitmenttoregionalintegrationthroughregionaleconomicblocs,suchastheEastAfricanCommunity(EAC)andCommonMarketforEasternandSouthernAfrica(COMESA).Furthermore,

P-E INdIcaTORs REPORT
25
globalizationhasinpartreducedbarrierstointernationaltradeandinvestmentflows.Thereisabroadconsensusthatinthelong-term,developmentshouldfocusontheachievementofrapid,equitableandsustainableeconomicgrowth.
Theenvironmentalgoodsandservicescanalsobelinkedtothegoalsofthe2002JohannesburgWorld Summit on Sustainable Development (WSSD), which reaffirmed that sustainabledevelopmentisdependentuponstrongcommitmentstotangibletargetsandtimeframeswithrespect toWater,Energy,Health,AgricultureandBiodiversity (WEHAB).Thus, thecountrymustaimtosustainthebenefitsfromtradeandinvestmentwithouthavingadverseimpactson the environment.
3.4.2 sustainable consumption and Production PatternsChanging patterns of consumption and production through integration of environmentalconsiderationsinallsectorsandpolicyareasisaprerequisiteforsustainabledevelopment.Currently,mostoftheproductionandconsumptionpracticesdonottakeintoaccounttheenvironmental costs.Asa result, thebenefitsprovidedbynatural resourcesappear tobemuchsmallerthantheyreallyare.
Anintegratedaccountingsystemwillensurethat environmental costs in the productionsystemsareconsidered.Therepercussionsofunsustainable consumption and productionpractices have been growing and haveresulted in environmental challenges such as climate change, ozone depletion, lossof biodiversity, water and air pollution,forest and soil degradation, and increasing waste generation. Environment-friendlytechnological developments can yieldenormousenvironmentalbenefits.
AsespousedinPrinciple8oftheRioDeclaration,“toachievesustainabledevelopmentandahigherqualityoflifeforallpeople,Statesshouldreduceandeliminateunsustainablepatternsof production and consumption and promote appropriate demographic policies.” There isaneed todevelopandapplymethodsand tools serving topromote resourceefficiency inconsumptionandproductionpatternsacrosssectors.
3.4.3 Industrial developmentThestructuralchangesimplicitinattainingthegrowthratesdemandedbytheincomepovertyMDGs and Vision 2030 means that ways must be found to achieve sustainable industrialdevelopment.Thiscallsforanenvironmentallysoundindustrialdevelopmentstrategythatintegratesandpromotescohesionofindustrialandenvironmentalpoliciesandthatenhancestransfer ofenvironmentally sound technologies.The Small andMediumEnterprises (SMEs)have been recognized as the engine to industrialization, at least in the early stages of acountry’sdevelopment.SMEsandotherindustriescontributesignificantlytoenvironmentaldegradationandpollutionduetofactorssuchasthetypeandageofthetechnologiesinuse,shop-floorpracticesandotherindustry-specificcharacteristics.
26
Ministry of state for Planning, National development & Vision 2030
3.4.4 sustainable Human settlementThepatternofhumansettlementsinthecountryisinfluencedbynaturalresourceendowmentswhichincludeavailabilityandaccessibilityofland,shelter,water,foodandsocialamenities.Althoughurbanizationhasgrownrapidly,Kenyaisstilllargelyaruralsociety.Ruralsettlementshave environmental problems which are influenced by many factors including populationgrowth,culturaltraditions,topography,climate,availableresourcesandtheeconomy.Thehugenumberofrefugeesseekingasafeplacefromconflicts,ofteninmassivecamps,canhavemajorimpactonthelocalenvironment,throughtheirownfuel-woodandfoodneeds.
The capacity of the urban centers to provide housing, infrastructure, services and jobopportunities remains a challenge. Sustainable human settlement involves creating theconditionsunderwhichpeopleinbothruralandurbansettingscanenjoyhealthy,productiveandwellintegratedlives.Thisshouldensurethatpeopleliveinsafe,healthyanddignifiedconditions,withrelativelyeasyaccesstoamenities.
3.4.5 EnergyToagreatextentenergydrivesdevelopment.TheGovernmenthasmadedeliberateeffortstoprovidepowertoremoteareastospurdevelopmentandimprovethelivelihoodsofpeople.Theseincludehydroenergy,petroleumenergyandgeothermalenergy.Fuel-woodprovides83%ofthetotalenergyrequirementsforhouseholdcooking.Thecountry’senergyrequirementswillincreasesubstantially,andtheenergypoliciesmustthereforeensurearobustandefficientenergysupplysystemandahighdegreeofself-sufficiencyinkeepingwiththegoalsofsustainabledevelopmentandindustrialcompetitiveness.Thus,theenergysystemshouldincreasetheuseofrenewableenergy.
Energyconsumptionperunitoftransportationactivity isakeymeasureofhowefficientlytransportationsystemsconvertenergyintohumanmobilityandgoodsdistribution.Inparticular,energyconsumptionfortransportationrelativetotheamountoffreightorpassengerscarriedandthedistancetraveledandtheresultantpollutionandclimatechangeisdependentonboththemixofvehiclesandtheenergyintensitiesofparticulartypesofvehicles.Theenergyintensities of train and bus transportation per passenger-km are commonly less than forcarsorairtransportation.Forfreight,energyintensitiesforrailandshiptransportationarecommonlylessthanfortruckingpertonne-km.
3.4.6 climate change and disaster ManagementThereisscientificconsensusbytheIntergovernmentalPanelonClimateChange(IPCC)thatclimatechangeisarealityandthathumanactivitiesarelargelyresponsibleforincreasingconcentrationofgreenhousegases(GHG)intheearth’satmosphere.Kenya,likemanyothercountries,isconcernedaboutclimatechangeanditsresultantimpacts.Inaddressingclimatechange,twoapproachesareadopted,aimedattacklingboththecausesofclimatechange(GHGemissions)andtheadaptationmeasuresontheimpactsofclimatechange.
Manyofthedisastersareclimaterelated,andareassociatedwiththeextremeclimateeventswhich occasion landslides, increased disease episodes, negative effects on farming, andmassivelivestockdeaths.Kenyaexperiencesheavy,devastatingfloodsduringstrongElNinoandLaNinaevents.Theeconomicimpactsoffloodsanddroughtcutacrossallkeysectorsoftheeconomy,includingagriculture,industryandmanufacturing,tourism,infrastructureandpublichealth.Itisexpectedthatclimatechangewillincreasethefrequencyandintensityofextremeweathereventssuchasfloodsanddroughts.

P-E INdIcaTORs REPORT
27
3.5 ENHaNcING ENVIRONMENTaL QUaLITY
Alllifedependsonacleanandhealthyenvironment.Thisvastwebofinterwovensystemsisoftenthreatenedbythepresenceofharmfulsubstancesaswellasionizingagents.Inthisregard,environmentalhealth,airquality,wastemanagement,radiation,toxicandhazardoussubstancesandnoiserequirespecialattention.
3.5.1 Environmental HealthThemost pressingproblemswith respect to environmental health, including occupationalhealth,arethoseassociatedwithairandwaterpollution,watersupplyandsanitation,wastedisposal,chemicalandfoodsafety.Theill-healtheffectsofharmfulenvironmentalexposuresmaybeacuteandsometimesalongtimemayelapsebetweentheinitialexposureandtheappearance of an adverse health effect. A better understanding is needed of biologicaldispositiontoaparticularhealthoutcomeandthewayinwhichhumanactivitiesandlifestylesput people at higher risk. In linewith the principle of sustainability, development shouldminimizenegativeenvironmentalhealthimpactsandmaximizehealthbenefits.
3.5.2 air QualityThethreattotheatmospherearisesfromheightenedpollutionandvariesasaresultoflocalemissions,topographyandweather.Industryandvehiclescontinuetobethemainemittersofpollutantsintotheatmosphere,withfossilfuelsaccountingforthebulkofthem.Oneresultisglobalwarmingwhichaffectsmanynaturalsystemsandtheotherisairpollutionthatmaycausebothacuteandchronichealtheffects.
Airpollutionisoneoftheleadingriskfactorforrespiratorydiseasessuchaschronicobstructivepulmonarydisease(COPD),lungcancer,pulmonaryheartdiseaseandbronchitis.Theeffectsofoutdoorairpollutionarecompoundedbythoseofindoorairpollution.Mosthouseholdsusecharcoalandfirewoodfordomesticcooking,andthusindoorairpollutionaffectsbothurbanandruralpopulations.Themainairpollutantsaresuspendedparticulatematter(SPM),lead(Pb),sulphur(SOx),carbonmonoxide(CO),hydrogensulphide(H2S),andoxideofnitrogen(NOx).
Kenyadoesnothavesetstandardsformostorallairpollutants,exceptforThikatown,wherestandardshavebeendeveloped.Theinstitutionsandorganizationsresponsibleformonitoringand regulating air pollution includeMinistry of Environment andMineral Resources (MinesandGeology,NEMA,DepartmentofResourceSurveysandRemoteSensing),MinistryofLabour(DirectorateofOccupationalHealthandSafety),KenyaBureauofStandards(KEBS),MinistryofLocalGovernment,NairobiandMoiuniversities,MinistryofEnergy,MinistryofHealth,andMinistryofTransportandCommunication.
3.5.3 Waste ManagementInefficient production processes, low durability ofgoods and unsustainable consumption patterns leadto excessive waste generation. Despite efforts thatencouragereuse,recyclingandrecovery,theamountofsolidwastegeneratedremainshighandappearstobeontheincrease.SolidwastesandwastewatereffluentsarethelargestthreatstothequalityofKenya’swaters.By2002,about12,955 tonsof solidwastewasbeinggenerated daily throughout Kenya, with Nairobi City

28
Ministry of state for Planning, National development & Vision 2030
alonegenerating1,785tonsdaily(JICA,2002).In1996,only45%ofthetotalannualwastewas collected.
Insomepartsofthecountry,effectivecollectionandtreatmentfacilitiesexist,whileinotherplacessuchfacilitiesdonotexist.Manyoftheunsanitarysystemshavebeenresponsibleforthespreadoftyphoidandcholera,eitherdirectlythroughcontaminatedwatersuppliesorindirectlythroughcontaminatedfoods.Wastewateroftenresultsinincreasednutrientlevelsleading to algal blooms anddepleted dissolved oxygen resulting in destruction of aquatichabitats.Mostoftheurbancentreslackwastewatertreatmentinfrastructure.
The other categories of wastes that require special consideration are electronic wastes,militarywastesandclinicalwastes.Spillsfromoiltankerscandevastatecoastalandmarineecosystems.ThemainproblemsofsolidwastemanagementfacingKenyaare:(a)lackofacomprehensivenational lawon solidwastemanagement; (b) inadequatedump trucks; (c)illegalanduncontrolleddisposalofwaste;(d)lackoffinancialresourcesforinvestmentandoperation;(e)lackofpublicawarenessregardingsolidwastemanagement;and(f)inadequatespaceforexpansion/developmentofdumpsites(especiallyinNairobicity).
TheinstitutionsresponsibleforregulationandmonitoringofsolidwastemanagementincludetheMinistryofLocalGovernment,MinistryofWaterandIrrigation,MinistryofEnvironmentandMineral Resources (Mines andGeology, NEMA),Ministry of Health,Ministry of Labour,MinistryofLands,MinistryofLocalGovernment(urbanauthorities),andMinistryofCommerceandIndustry.
3.5.4 Radioactive WasteAlthoughtherearenonuclearpowerplantsinKenya,radioactivematerialsarecommonlyusedinconsumerproductssuchastobacco,beer,rubber,tyreandsteelmanufacturingindustries,oil well drilling, medical institutions and agriculture. Concern exists about radioactivepollution,includingradioactivewastedumpedonuncontrolledlandfillsiteswithoutinspectionbylocalgovernmentsthatmayaffectthehealthofgarbage-relatedworkersandscavengers,radioactivematerialsdumpedon thecoast thatmayaffect thenatural environment, andthe international transport of nuclear waste. The Kenya government has signed severalinternational agreements for the purpose ofmanaging radioactivewastes and other toxicwastes.
Differenttypesofradiationvaryintheirabilitytoaffecthealth.Allkindsofionizingradiationcan cause cancer and other health effects. other long-term effects are teratogenic and genetic mutations3.Teratogenicmutations result from the exposure of fetus to radiation,whilegeneticeffectsarethosethatcanbepassedfromparenttooffspring.Itisthereforecriticaltolimitexposuresfromaspecificsourcetothepublictolevelsunder100millirem4.
Matters concerning the use, importation, exportation and introduction of radioactivematerialsandequipmentarestrictlymanagedbytheRadiationProtectionCommitteesetupundertheRadiationProtectionAct.InstitutionsandorganizationsresponsibleforregulatingandmonitoringofradioactivewasteincludetheMinistryofHealth,MinistryofEnvironmentandMineralResources (MinesandGeology,NEMA),UniversityofNairobi,MinistryofLocalGovernment,andMinistryofLabour(DirectorateofOccupationalHealthandSafety).
3Teratogens are chemicals or other factors that specifically cause abnormalities during embryonic growth and development.4Roentgen equivalent man (rem) is a unit of ionizing radiation equal to the amount that produces the same damage to humans as 1 roentgen of high-voltage x-rays (McGraw-Hill, 2003).

P-E INdIcaTORs REPORT
29
3.5.5 Toxic and Hazardous substancesToxicandhazardoussubstancesareacriticalpartoftheglobaleconomyandalsooneofthegreatestthreatstohumanhealthandtheenvironment.Forexample,toxicandhazardouschemicalsarewidelyusedinKenyaparticularlyintheagriculturalsector.Toxicandhazardoussubstancesandtheirdisposalhavenotbeencomprehensivelyandadequatelyaddressedbyanypolicyorlegislationtodate.Toxicandhazardoussubstancesarewidelydispersedintheenvironmentandtheirproductionisontheincrease.Kenya,likemanyotherAfricacountries,isvulnerabletoillegaldumpingofobsoleteandbannedtoxicandhazardoussubstances.
3.5.6 NoiseRepeated exposure to high noise levels can result in significant adverse health impacts,especiallylossofhearingacuity.Suchexposuresoccurprimarilyintheworkplace.Thenoiselevelsthatcanresultinhearingdamagearequiteloud,andoftensignificantlyinterferewithcommunication,andthusleadtoquantifiableproductivitylosses.Noisealsocausesannoyancewhichleadstonegativecommunityreactions.Therelativelyhighlevelsofsoundthatcanresultinannoyancemaypropagateoverconsiderabledistancesandconsequentlyaffectalargepopulation.Sourcesofnoiseincludecommercialactivitieswithinor close to residential areas (e.g. discos and othermachinery), transportation sector andreligiousactivities.Theproblemofnoiseiscreatedbyconstructionwork,vehiclemovement,factories, informal industries, loudmusic in public transport vehicles (i.e.matatus), andaeroplanes.TheKenyaGovernmentrecentlyenactedaspecificlegislationthatgovernsand/orregulatesnoiselevels.Inaddition,section55oftheFactoryActempowerstheMinisterof Labour to develop guidelines on noise in the workplace. Some of the institutions andorganizations responsible for regulating andmonitoring noisepollution includeMinistry ofLabour (Department ofOccupationalHealth and Safety, Factory Inspectorate),Ministry ofEnvironmentandMineralResources (MinesandGeology,NEMA),MinistryofTransport,andKenyaBureauofStandards.
3.5.7 Environmental Monitoring and assessmentEnvironmentalmonitoringisintendedtoprovidescientificallysounddataandinformationonthe status and trends of the environment. the mechanisms for coordinated environmental monitoring,datacollection,processing,managementandassessmentarestill inadequate.Thereisaneedtodevelopaworkingprogrammeforenvironmentalmonitoringtocoordinateenvironmental data collection and assessment and to ensure compatibility of data andreportingstandards.
3.5.8 Offensive OdourThe offensive odor or noxious smells of decay is a growing problem especially in majorurbanareas. Itmainly results fromhydrogen sulphide releasebydecomposing garbageatdisposal sites, dam reservoirs and broken sewage conduits. Other causes of odor includetanninplantsatAthiRiver,slaughterhousesandpiggeriesinDagoreti,papermanufacturingplantsinWebuye,leachatesfromthewastelandfillsites,bone-mealplants,andwastewaterfromgarbagecollectionvehicles.TheEnvironmentManagementandCoordinationAct1999,Section107,providesforproceduresformeasurementanddeterminationofnoxioussmellsand ways of controlling them. Some of the institutions and organizations responsible forregulating and monitoring noxious smells include the Ministry of Labour (Department ofOccupationalHealthandSafety),MinistryofEnvironmentandMineralResources(MinesandGeology,NEMA),KenyaBureauofStandards,MinistryofLocalgovernment,MinistryofEnergyandMinistryofHealth.

30
Ministry of state for Planning, National development & Vision 2030
3.6 sEcTORaL PROGRaMMEs/PROJEcTs WITHIN dEPaRTMENTs
ThissectionpresentsflagshipprojectsandprogrammesidentifiedinthefirstMediumTermPlans2008-2012forimplementingVision2030toserveasalinktoenvironmentalissuesandtheproposedP-Eindicatorsatanoutcomelevel.TheMTPplacesapremiumonhigheconomicgrowth, faster job creation, poverty reduction, improved income distribution and genderequitywhilealsoensuringthatbalanceisattainedindevelopmentacrossallregionsofthecountry.Vision2030acknowledgesthatdisparitiesexistbetweentherichandthepoorandinequitabledistributionofpublic resourcesbetween individuals, regionsandalonggenderlines.ThekeytargetstoaddressthedualproblemofpovertyandinequalityintheMTP(2008-2012)include:(a)raisingtheaverageannualincomeperpersonfromanestimatedUS$650in2006toaboveUS$992by2012;(b)reducepovertylevelsfrom46.9%to28%by2012;(c)reduceruralandurbaninequalityGiniindicesfromthecurrentlevelsof0.38and0.447to0.34and0.407,respectivelyby2012;and(d)raisethelevelofHumanDevelopmentIndexfromabout0.532in2007tobetween0.6and0.7by2012.According to the MTP, identified flagship projects/programmes aim to achieve faster andsignificantstructuralchangesintheKenyaneconomybyincreasingtheshareofmanufacturingandindustryinGDPandthatofmanufacturedexportsintotalexports.Projectsandprogrammeslistedbelowarethosethathaveabearingonenvironment,butcoveringallthethreepillarsofVision2030.
3.6.1 TourismTourismcurrentlyaccountsfor10%ofGDP,makingitthethirdlargestsectoroftheeconomyafteragricultureandmanufacturing.TourismisakeyplayerincreationofemploymentandKenya’sleadingforeignexchangeearnergeneratingaboutKShs65.7billionin2007,upfromKShs21.7billionin2002.Emergingissuesinthetourismsectorincludeenvironmental(i.e.loss ofwildlife habitat, inappropriate policies, human/wildlife conflicts, etc), inadequateinfrastructure,narrowproductdiversity,inadequatebed/hotelcapacity,untappeddomestictourism, inadequate skilled human resources, and inadequate research and developmentbudget.
ThefollowingaresomeoftheflagshipprojectsidentifiedintheMTP(2008-2012):a) Developmentofthreeresortcities(Isiolo,DianiandKilifi);b) Premierparksinitiative;c) Underutilizedparksinitiative;d) Development of niche products (eco-tourism, cultural-tourism, local tourism
entrepreneurship,water-basedtourism,sportstourism,andcruisetourism);e) Legalreforms(i.e.amendmentoftheKTDCAct, implementationoftheDevelopment
Finance Institutions reform strategy forKTDC,enactment ofKTBandKICCActs, andpassingandenhancementoftheTourismBill2007).
3.6.2 agriculture, Livestock and FishingAgriculture contributes about 24%GDP, 75%of industrial rawmaterials and60%ofexportearnings.ComponentsoftheagriculturalsectorthatKenyansderivealivelihoodfromincludefoodcrops, industrial crops, horticulture,fishproduction,dairy andbeefproduction, andagricultural marketing.
Among theemerging issues in agriculture arehigh cost of inputs, landuseproblems (i.e.subdivision), limitedapplicationofagricultural technologiesand innovations,weakfarmer
P-E INdIcaTORs REPORT
31
institutions, poor livestock husbandry practices, overdependence on rain-fed agriculture,inadequatecreditfacilities,andlowmarinefishexports.TheflagshipprojectsidentifiedintheMTPashavingpotentialforreducingtheconstraintsfacingagricultureinclude:a) Enactmentoftheconsolidatedagriculturalreformbill;b) Investmentinfertilizercost-reduction;c) Establishmentofdisease-freezones;d) Landusemasterplan;e) ASALdevelopmentproject;f) Key support initiatives: agricultural research and development; extension services;
transformationofparastatalsandproducerorganizations;thecooperativesector;seedand breed quality improvement; low-cost irrigation technology; livestock initiatives;reorganizationofagriculturalinvestmentandexportpromotionagencies;developmentofidentifiedidlelandsinhighpotentialandASALareas;legal,regulatoryandinstitutionalreforms; improvingaccesstofarminputs;promotingthegrowingandconsumptionoftraditional foods; empowering farmers through participatory grassroots stakeholders’forums;andagriculturalfinancialservices.
3.6.3 Wholesale, Retail and International TradeThe trade sector is singled out by theMTPas playing a crucial role in the attainment ofthenationaldevelopmentobjectivesincludingtheMDG1(eradicatingextremepovertyandhunger)andMDG8(developingglobalpartnerships fordevelopment).Thefivemainareasidentifiedunderthetradesectorare(a)distributionandwholesaletrade;(b)retailtrade;(c) international trade; (d) informal trade; and (e) trade in services and electronic trade(e-trade).
ThecontributionofthewholesaleandretailtradetoGDPgrewby10.3%perannumbetween2003 and 2006. Emerging issues for the wholesale, retail and international trade sectorincludeweakbusinessregulatoryframework,poorinfrastructure,poormarketaccess,poorlydevelopedbusinessskills,lowutilizationofinformationandcommunicationtechnology(ICT),low capacity in market development, limited access to finance and credit, and negativeimpactoftheHIV/AIDSpandemic.Someoftheflagshipprojects/programmes identified intheMTP(2008-2012)are:a) Createatleast10hubsand1,000-1,500ProductBusinessGroupswithpilotprojectsin
Maraguatobeextendedtootherregions;b) Buildatleast10tier-onemarketwithpilotprojectsinAthiRiver,constructwholeand
retailhawkersmarketinselectedurbanareas;c) Developandinstitutionalisecapacitybuildingandtrainingprogrammesontechnology
andbusinessprocurementnegotiationskillsfortraderassociationsandtheirmembers;d) Businesslinkagesandsub-contractingprogrammesthroughPublicPrivatePartnerships
(PPP);e) Support and promote the development of cooperative organizations tomarket their
producedirectly, therebyshortening supplychains,achievingeconomiesof scaleandreducingconsumerpriceswhileincreasingproducerearnings;and,
f) EstablishandstrengtheninformaltradersassociationstoformSACCOssoastoenhancesavingsmobilization,andenhancementofmanagementoftheexistingSACCOs.
3.6.4 ManufacturingThemanufacturing sector is expected to provide impetus for achievingMDGs in both themedium-andlong-term.Vision2030outlinesfourobjectivesforthemanufacturingsector:(a)strengthenproductioncapacityand localcontentofdomestically-manufacturedgoods;

32
Ministry of state for Planning, National development & Vision 2030
(b)increasethegenerationandutilizationofR&Dresults;(c)raisetheshareofproductsintheregionalmarketsfrom7%to15%;and,(d)developnicheproductsforexistingandnewmarkets.
some of the emerging issues in the manufacturing sector include low value addition and narrow export base; underdeveloped and /or dilapidated transport network; inadequate, costlyandunstablesupplyofenergy;lowadoptionofinformationandcommunicationtechnology(ICT); overlaps and ambiguity inmandates and functions; low technology, innovation andR&D uptake; weak legal, regulatory and institutional frameworks; influx of sub-standard,counterfeit and contraband goods; inadequate capacity to meet quality and standards;limitedaccesstofinancialservices;andlimitedproductionandmanagerialskills.Theflagshipprojects/programmeslistedbytheMTP(2008-2012)include:a) Developmentofindustrialandmanufacturingzones;b) DevelopmentofatleastfiveSMEindustrialparksandspecializedeconomiczonesinkey
urbancentres;c) Productionandmarketdiversification;d) Researchdevelopmentandcommercializationprogrammes;e) CreateanSMER&D,riskandventurecapitalfund;f) Createbusinessandtechnologyincubationprogrammetoincludeanincubationfund;g) One-villageone-product;and,h) 4K(KEBS,KIRDI,KIPI,KNFJKA)MSE2030initiativesproject.
3.6.5 Environment, Water and sanitationthe goal of the environment sector is to enhance access to water and sanitation and a clean, secure,andsustainableenvironment.TheVision2030recognizestheeconomicimportanceoftheenvironmentsector,e.g.byattributingabout42%oftheGDPasderivedfromnaturalresource-basedsectorsofagriculture,forestry,tourism,mining,waterandenergy.Itisfurtherstatedthatthesustainabilityofsupplyoftheseenvironmentalservicesandnaturalresourceproductsrequirescience-basedmanagementandconservationpractices.Consequently,Vision2030hasplannedflagshipactivities/programmesaimedatachievingvaryingimpactsonthestate of the environment. this is where careful integration of environmental concerns into allsectorsoftheeconomyisrequired,assomeoftheplannedprojectswillleadtoincreasednegative impacts e.g. pollution, large quantities of solid waste, effluent discharge frommanufacturing,soilerosionfrompoorland-usepracticesandlossofbiologicaldiversity.
Emergingissuesinenvironmentincludeenvironmentaldegradation;waterresources(waterscarcity, water security, water catchments management, water quality, infrastructuredevelopment, sanitation, andmonitoringof resources); pollutionandwastemanagement;climate change; biotechnology; integrated environmental planning; institutional and legalframework;forests;wildlife;biologicaldiversity,ecosystemandhabitatmanagement;andmineralsandmining.Theenvironmentalflagshipprojects/programmesinclude:a) Rehabilitationandprotectionofindigenousforestsinthefivewatertowers;b) Securewildlifecorridorsandmigratoryroutes;c) Preparationofanationalspatialland-usemasterplan;d) Wastemanagementsystems;e) Rehabilitation,regenerationandrestorationofNairobirivers;f) Waterresourcesinformationmanagement;g) Waterharvestingandstorageprogramme;h) Urbansewerageprogramme;i) Waterstorageandharvesting;

P-E INdIcaTORs REPORT
33
j) Nationalwatersupplyandsanitation;k) Waterresourceinformationmanagement;l) Irrigationanddrainage;m)Additionalprograms:carbonoffsetschemes;disasterpreparedness;compensationfor
environmental services programme; exploration and mining; invasive species; trans-boundary waters; geological mapping; linkages with institutions of higher learning;and,
n) Policy,legalandinstitutionalreforms.
3.6.6 Population, Urbanization and HousingHighpopulationgrowth,rapidrural-urbanmigration,skyrocketing costs of housing constructionmaterials, and high cost of housing finance havebeena challenge to theKenya government sinceindependence.SomeoftheissuesidentifiedbytheMTP (2008-2012) include rural-urban migration,increasinghighratesofurbanisation,andinabilityfor housing sector to grow at the same rate as the population, and hence the mushrooming ofurban slums. Flagship projects include preparingand implementing strategic development andinvestment plans for six metropolitan regions(Nairobi, Mombasa, Kisumu-Kakamega, Nakuru-
Eldoret,Wajir-Garissa,Kitui-Mwingi-Meru).More specifically, the following projectsareearmarkedforthedurationofthefirstMTP2008-2012:a) Preparationofanationalland-useplan in order to facilitate better urbanplanning;b) Installation of physical and socialinfrastructure in slums in 20 urban areastomakethemformalsettlements,permitconstruction of permanent houses andattractprivateinvestment;c) Producing 200,000 housing unitsannually by 2012 under PPP and otherinitiatives;
d) Establishinghousingtechnologycentresineachconstituencytoincreaseaccesstodecenthousingbypromotinglocation-specificbuildingmaterialsandlow-costhousing;
e) Establishing secondary mortgage finance corporation to increase access to housingfinance;and,
f) Enacting the Housing Bill, 2006 to legislate for a one-stop housing developmentapprovalmechanismtofast-trackapprovalofhousingplansandreducethetimecostofconstruction.

34
Ministry of state for Planning, National development & Vision 2030
3.7 sUMMaRY aNd cONcLUsION
ThischapterpresentsspecificenvironmentalissuesinKenyagroupedaroundfivemainthemes:environmentalissues,ecosystemsservices,sustainableuseofnaturalresources,environmentalstewardship,andenhancingenvironmentalquality.Ineach,issuesarepresented,challengesandcurrenteffortstoresolvethemhighlighted,andsourcesofdataandinstitutionsresponsibleforcollectingdatapresented.
Our understanding of the environmental sector should be informed by outcomes of theMillenniumEcosystemAssessmentandlessonsfromseveralsources,includingtheMillenniumDevelopmentGoals.Inordertoeffectivelylinkenvironmenttopoverty,threerelationshipshavebeenexplored:(a)theappreciationofhowhuman-wellbeingisdependantonenvironmentalservicesandproducts;(b)theidentificationofbarriersanddriversthatpreventKenyansfromsustainableuseofenvironmentalservicesandnaturalresourceproductstoimprovetheirwellbeing;and(c)the identificationofpolicyresponseoptionsthatremoveidentifiedbarriersso as to allowpoorKenyans improve theirwell-being throughenvironmental services andnaturalresourceproducts.Thischapterservestoidentifythecriticalissuesthattheproposedpoverty-environmentindicatorsshouldcover.

P-E INdIcaTORs REPORT
35
a new framework for P-e linked moniToring
4
4.1 KENYa’s NaTIONaL POLIcY FRaMEWORK aNd ENVIRONMENT
Overtheyears,theGovernmentofKenyahasacknowledgedtheimportanceoftheenvironmentinachievingitseconomicrecoveryandpovertyreductiongoalsasdemonstratedinvariouskeypolicyguidelines.Forexample,theEconomicRecoveryStrategyforWealthandEmploymentCreation(2003-2007)recognizedtheneedtoachievebroadmacroandsectoralobjectiveswithoutcompromisingtheenvironment.EnvironmentalchallengeshavealsobeenidentifiedintheKenyaVision2030,whichaimsat“anationlivinginaclean,secureandsustainableenvironment”.Recentparticipatorypoverty assessments andothermechanismsofpickingvoicesofthepoorhavealsorecordedincreaseinawarenessandconcernsforenvironmentalissues,especiallywithregardtopovertyreductionandsustainabilityofcurrentdevelopmentpoliciesandactivities.Thedevelopmentofgenericindicatorswillbeinformedbyareviewofenvironmentalissuesraisedbythepoorthroughparticipatorypovertyassessments,Kenya’senvironmentpolicyframework,reportonconnectingpovertyandecosystemservicesinKenya(UNEPandIISD,2005),andrelevantindicatorinitiativesinothercountries.
Ideally,thepolicyframeworkcontainedinVision2030andtheMediumTermPlan2008-2012shouldhavebeensubjectedtoaStrategicEnvironmentalAssessment(SEA)beforebeingusedasabasis fordevelopmentofP-E indicators, soas togauge theenvironmental soundnessof thepolicy framework andensure that it doesnot hurt thepoor in the short-termandunderminelong-rungrowthanditseffectivenessinreducingpoverty.SEAisnowwidelyusedtorefertoasystematicprocesstoanalyzetheenvironmental (and increasinglythesocialandsometimestheeconomic)effectsofpolicies,plans,andprograms.Forexample,growthcanleadtocollapseornearcollapseoffisheries,declineofagricultureduetosalinizationfromirrigation,downstreamimpactsduetoupstreamlandusechange(e.g.severefloodingcaused by deforestation in the upper watersheds), and decline in exports of intensivelyfarmed commercial aquaculture operations (e.g. shrimp farming due primarily to diseasefrompollutionandpoorenvironmentalcontrols).
Thus, to improvetheenvironmental soundnessofgrowth,economicpoliciesanddecision-makingneedtobetterreflectthe“publicgoods”natureofmanyenvironmentalgoodsandservicesbyaddressingthepersistentpolicyandmarketfailuresthatleadtotheirundervaluationandmisuse(UNDP,WorldBank,EC,DfID,2002).
4.1.1 Voices from the Field
ThefourthParticipatoryPovertyAssessment2005-2006(PPA-IV)dealswithperceptionsofthepeopleonissuesrelatedtopovertydynamicsanddiagnostics,andanalysisoftheimpactoffivepro-poorpolicyareas,namely,agriculturalextensionservices,waterandsanitation,ruralaccessroads,basiceducationandpublichealthcare.AlthoughenvironmentwasnotpartofthescopeofthePPA-IV,“allthecommunitiesvisitedwereconcernedabouttheenvironment,e.g. destruction of water catchments areas and conversion of such areas to private use,reduction inwatervolumes fromnatural sources,disposalofnon-biodegradablematerials(plastics),urbanpollution,disposalofhumanwasteespeciallyinurbaninformalsettlementsandsmallurbancenters,anddenudationoftreesinmostpartsofthecountry”(page96).

36
Ministry of state for Planning, National development & Vision 2030
WWFEasternAfricaRegionalProgrammeOffice(EARPO)undertookacommunityconsultativeplanningstudy,onbehalfofthePovertyandEnvironmentInitiative-Kenya,toidentifypovertyand environmental challenges, causes and solutions in bondo, murang’a and meru south districts (WWF, 2006).The following poverty-environment challenges cut across the threedistricts:
• Everincreasingpopulationanddiminishingresources:decreasingavailabilityoflandandlarge families
• Seasonal and environmental stress: notably flooding, landslides, physical erosion anddepletedsoilsasaresultofdeforestationandpoorlandusepractices
• Copingwithhungerandotherpovertymanifestations• Environmental health and diseases: waterborne diseases and poor access to potable
water due to environmental degradation• Limitedcommunityinvolvementinthemanagementofnaturalresources• Governance and corruption: illegal logging in the forests, sand harvesting, and little
trustinpublicinstitutions(includingthosethatmanagedevolvedfunds).
Aspartoftheprocessofpreparingthedraftnationalenvironmentpolicy,12regional/provincialconsultativemeetingswereheld inMarch-April2008toseekopinionsandcontributionsofthestakeholdersattheregionallevel.Themeetingscapturedtheenvironmentalchallengesfacing different areas and suggestions on future actions needed to promote and enhanceenvironmental conservation and sustainable utilization of natural resources. The processrevealedthatcommunitiesareawareofthelinksbetweenlivelihoodsandtheenvironment,andtheattendantdangerswiththewantondestructionoftheKenya’snaturalresourcebase,andrecommendedawiderangeofpolicyactionstoreversethesituation.
Someof thecommon issues thatarose fromthe regional/provincialconsultativemeetingsinclude:(a)wastemanagementinmosturbancenters,(b)pollutioninlakesanddeclininglakewaterlevels,(c)waterscarcityandwaterquality,(d)encroachmentonwetlands,(f)deforestation, (g) poor agricultural practices that lead todecline in soil fertility and lossoftopsoil,(h)human-wildlifeconflictsasaresultofpoaching,encroachmentandblockingofwildlifemigrationcorridors,(i) lossofdiversity,(j)quarryingandminingincludingsandharvesting, (k) inconsistencies in lawsandweak institutional arrangements, (l) unplannedsettlements,(m)climatechange,(n)lackofdisastermanagement,and(p)invasivespeciese.g.waterhyacinth,prosopisjurifloraandhippograss.
4.1.2 Vision 2030 and The Medium-Term Plan 2008-2012
TheKenyaVision2030,whichisbeingimplementedthroughfiveyearmedium-termrollingplans with the first one covering the period 2008-2012, anchored on three main pillars(economic,socialandpolitical)isexpectedtotransformKenyaintoarapidlyindustrializingmiddle-incomenationbytheyear2030.Vision2030doesnotexplicitlyrecognizeenvironmentandnaturalresourcesasfoundationfordevelopment,butasoneofthesevenkeysectorsin the social pillar, alongside education and training, health sector,water and sanitation,housingandurbanization,andgender,youthandvulnerablegroups.
Vision 2030 lists the major challenges relating to environmental management to includesustainablemanagementofnatural resources (especially thecontinueddestructionof thefivewatertowers),demandforfarmlandandforestproducts,wildlifeintheirnaturalhabitats(poaching,human-wildlifeconflicts,habitatdestruction,andchangesinlandusepatterns),

P-E INdIcaTORs REPORT
37
medicalandhazardouswastes,climatechangeanddesertification,andharnessingofstrategicnaturalresources(e.g.innovationinutilizationofnaturalresources).
The Flagship Projects for 2008-2012 Medium-Term Plan period include rehabilitation andprotection of indigenous forests in the five Water Towers (Mau Escarpment, Mt. Kenya,AberdaresRanges,CheranganyHillsandMt.Elgon);securewildlifecorridorsandmigratoryroutes;preparationofaNationalSpatialPlan (LandUseMasterPlan);wastemanagementsystem;rehabilitation,regenerationandrestorationofNairobirivers;waterharvestingandstorageprogramme;urbansewerageprogramme;nationalwatersupplyandsanitation;waterresource information management; and irrigation and drainage. Additional programmesinclude carbon offset scheme, disaster preparedness, compensation for environmentalservicesprogramme,explorationandmining,managementandcontrolof invasive species(e.g. prosopsis juriflora andwater hyacinth), trans-boundary waters, geologicalmapping,andlinkageswithinstitutionsofhigherlearning(forcapacitybuildinginenvironment-relateddisciplines).
Progress in human development depends on environmental services and products. TheKenyaGovernmenthasthereforetriedtoenrichtheone-dimensionalperspectiveofpovertyas income or deprivation to amulti-dimensional approach that encompasses amultitudeof constituents anddeterminants ofwell-being.The relationships amongconstituents anddeterminantsofwell-beingarecloselylinkedtoenvironmentalservices,andthemagnitudeoftheirrelationshipsdiffersacrossstakeholders.Forexample,richKenyanscanaffordtobuycleanwaterorequipmenttofilterandpurifyit.PoorKenyanshavenooptionsbutdependonnaturaland/orpublicwatersupply.
However,Kenyastillfacessomeproblemsandissuesinenvironment.Theseinclude:
• Parameterstomeasureand/orquantifyenvironmentalphenomenaarepoorlydevelopedor lacking all together.
• Poorunderstandingofenvironmentalphenomenahasledtotheentrenchedbeliefthatenvironmentalproducts(naturalresources)mustbemined(factorsofproduction)foreconomicdevelopmentwithoutregardforsustainableproduction.Forexample,mostofwaterforNairobicomesfromMuran’ga,butpaymentforwaterbyNairobiresidentsisonlyfortheliquidatthetapandinvestmentisforinfrastructure.ItdoesnotincludepaymentstoguaranteethesustainabilityofwatersupplyfromtheAberdaresecosystemsothattheAberdaresresidentsdonotengageinactivitiesandpracticesthatthreatensustainableflowofwater(quantityandquality).
• ThefragmentednatureoftheKenya’senvironment-povertyframework,e.g.thescatterednatureofthesector/constituentsorabsenceofanationalenvironmentalframework;andtheviewofenvironmentasbeingindisharmonywiththenationalleveleconomicdevelopmentduetopoorcommunicationatapolicylevel.
TheoverallpurposeoftheP-EIndicatorswillthereforebetoprovideameasurementframeworkthroughwhichto:(a)identifywhetherenvironmentandpovertyreductionlinkagescontributeto achieving national and sub-national development policies, objectives and targets (e.g.Vision2030,MediumTermPlan2008-2012,DistrictDevelopmentPlans,EnvironmentActionPlans);and(b)enableassessmentofprogresstowardssoundenvironmentalmanagementandpovertyreduction.Thislinkagebetweennationalpoliciesandtheimplementedprogrammesthrough theP-E indicatorswill assist to demonstrate the extent towhich development issustainableinthelong-term,andprovidecruciallessonsforfutureprogrammedesign.

38
Ministry of state for Planning, National development & Vision 2030
Progress towards implementationof thepoliciesandachievementofplannedprogrammeswillbemeasuredagainstthesettargetsthroughtheP-Eindicators.Themeasurementwillbedoneatthenationalandsub-nationallevelsaselaboratedunderNIMES.AnnualProgressReportswillbepreparedusingdataandinformationsuppliedbytheKenyaNationalBureauofStatistics(KNBS),relevantfocalministries’CentralPlanningandProjectMonitoringUnits(CPPMUs), District Development Officers, and specialized semi-autonomous governmentagencies(SAGAs).
4.2 cHaLLENGEs IN dEVELOPING POVERTY-ENVIRONMENT INdIcaTORs
Thepurposeoftheassignmentwastodeveloppoverty-environmentindicatorsthatarerelevanttopoverty,environment,andthelinkagebetweenthetwo.However,asmentionedpreviously,poverty-environment links are not necessarily the same as causal linkages between theenvironmentandpoverty,butaredimensionsofpovertythatconcerntheenvironmentalpartofpoorpeople’slives,andthusrelatetopeople’sopportunitiesforeconomicadvancement,socialorpoliticalempowerment,andvulnerability.Inaddition,manytraditionalecosystemsindicators are highly site-specific, and therefore appear more relevant for lower-levelgeographicalareasratherthannationallevelmonitoring.
TherangeofindicatorsandknowledgebasederivedfromtheNIMES,millenniumdevelopmentgoalsandotherinternationalexperiencesdifferinscopeandsometimesindefinitions.The31 ERS indicators mainly focused on improvement of incomes without a commensuratefocusonsustainabilityofecosystemsuponwhichthatdevelopmentisderived.The48MTPoutcome indicators for national level reporting andmonitoring are an improvement fromtheERSindicators.Mostindicatorsdevelopedforinternationallevelreportingarealsomoresuited to national level performancemonitoring, rather than sub-national or site-specificconcerns.Theindicatorsalsorarelyincludeanyqualitativeorquantitativemeasurementsoftheextenttowhichacountry’splanningandbudgetaryframeworksmainstreamenvironmentandsustainablemanagementofnaturalresources.TherangeofindicatorsunderNIMESdoesnotfullymeettheneedsforinternationalreportingobligationsundertheMDGs.
4.3 aPPROacHEs IN dEVELOPMENT OF POVERTY-ENVIRONMENT INdIcaTORs
TheframeworkfordevelopingP-Eindicatorswillneedtomeetanumberofrequirements.First, there is need for national and sub-national level indicators for mainstreamingenvironmentandnaturalresourcesintoplanningandbudgetaryframeworks.Secondly,therewillbeseparateindicatorsonpovertyandenvironment,andP-Eindicatorsthatreflecttherelationshipbetweenpovertyandenvironment.
Thematrix of proposed indicators in theAnnex uses the thematic issues as presented inVision2030andMedium-TermPlan2008-2012,withthefirstcolumnshowingthepillarandsectorclassificationandthesecondcolumnshowingthedevelopmentissuesfortheparticularpillar/sector.Thethirdandfourthcolumnspresentnationalandsub-nationallevelindicators,respectively.Theindicatorsselectedaresupposedtoprovideamenufromwhichacoresetofindicatorscanbeselected.Otherindicatorscanalsobechosenforministerialandagencylevel.
ThemainadditiontoexistingERSindicatorsistheinclusionofmeasurementsofsustainable

P-E INdIcaTORs REPORT
39
development,adoptionofstrategiesthatmainstreamenvironmentinplanningandbudgetaryframeworks,governanceissues(e.g.participatorynaturalresourcemanagementatcommunitylevel),andtheroleofconsumptionandproductionpatternsinsustainabledevelopment.Inshort,theexistingenvironmentalpressureindicatorshavebeenaugmentedbymeasuresofbiodiversityandecosystemsstress.
Attheministeriallevel,indicatorsshouldbeharmonizedwiththestrategicplans,andtheministerialandagencylevelperformancecontractingshouldincludeanumberofinputandoutputlevelindicatorswhichareproperlyalignedtospecificoutcome/impactindicators.
During the preparation of national and ministerial level indicators for tracking theimplementationofVision2030andMedium-TermPlan2008-2012,theconsultantsparticipatedin providing inputs on poverty-environment linked indicators. Table 2 below shows theindicators thatwere tentatively agreed upon for inclusion in the nationalmonitoring andevaluation framework.
4.4 sUMMaRY aNd cONcLUsIONThedevelopment of generic indicatorswas informedby a reviewof environmental issuesraisedby thepoor throughparticipatorypovertyassessments,Kenya’senvironmentpolicyframework,reportonconnectingpovertyandecosystemservicesinKenya(UNEPandIISD,2005),andrelevantindicatorinitiativesinothercountries.
TheoverallpurposeoftheP-E Indicators istoprovideameasurementframeworkthroughwhich to: (a) identify whether environment and poverty reduction linkages contribute toachievingnationalandsub-nationaldevelopmentpolicies,objectivesandtargetswithintheframeworkofVision2030;and(b)enableassessmentofprogresstowardssoundenvironmentalmanagementandpovertyreduction.Outputlevelindicatorswillbetrackedatsub-nationallevelwhileoutcome/impactindicatorswillbetrackedatnationallevel.ItisalsoimportanttoensurethatperformancecontractingprocessesintheMinistriesisalignedwiththemonitoringprocesswherethesettargetsforeachindicatorshouldguidethespecifictasksforindividualofficersinspecificGovernmentministries.
Table2:ReportingFrameworkforEnvironment,WaterandSanitation,AgricultureandRuralDevelopment
medium-term PlAn outPut/flAgshiP ProJects
outPut indicAtor dAtA source ministry resPonsible
forest cover increased by50%
Landareacoveredbyforests(hectares,%oftotallandarea)
KFSAnnualReport mfw
solid waste managementsystemsdevelopedin5municipalities
%ofsolidwaste(i)recycled,(ii)composted,(iii)incinerated,and(iv)land-filledonacontrolledsite
nemA Annual Report
memr
three climate change databasesestablished
No.ofdatabasesestablished–nemA, memr, mfw
nemA/kfs Annual Reports
memr/mfw
Fiveadaptationprogrammesonclimate change and desertificationpiloted
No.ofprogramspiloted nemA/kfs Annual Reports
memr/mfw

40
Ministry of state for Planning, National development & Vision 2030
Spatialdataonlanduseincreasedfrom30%to50%
Up-to-datelandusemaps drsrs/nemA records
memr/mol
Spatialdataonlandcover increased from 30%to70%
Landcovermaps drsrs/nemA records
memr/mol
five clean DevelopmentMechanismsprojectsattracted
No.ofCDMprojectsoperational nemA Annual Report
memr
Fivewatertowers(MauEscarpment,Mt.Kenya,AberdaresRanges,cherangani hills, mt. Elgon)rehabilitated/conserved
No.ofrehabilitated/conservedwater towers
kfs /kws Annual Reports
mfw
wildlife corridors andmigratoryroutessecured from human activity
no. of wildlife corridors and migratoryroutessecured
kfs /kws Annual Reports
mfw
Improvementofsolidwaste management systemforNairobi
%ofsolidwaste(i)recycled,(ii)composted,(iii)incinerated,and(iv)land-filledonacontrolledsite;
Numberoflicensedwaste management sites
NEMAAnnualReport memr
Land-usemapsupdated/modernized
Updated/modernizedland-usemaps
drsrs/mols/moA records
memr/mol
tana river delta Initiativeimplemented
tana river delta initiative implementedandoperational
tArdA Annual Report
mrdA
bura irrigation scheme rehabilitated
RehabilitatedBuraIrrigationscheme commissioned
NIBAnnualReport MOW&I/MOA
Developmanagementplansfor5wetlands
no. of wetlands that are protectedfromintensivehumanactivities(prerequisitesincludepreparationofawetlandsmasterplanandharmonizationofvariouspiecesofenablinglegislation)
nemA Annual Report
memr
All marine area protected
Proportionofmarineareasprotected
kws and nemA AnnualReports
mfw/memr
Complianceofalldischarges to meet thewaterqualityregulations
Levelofwaterpollutants(byspecifiedpollutants)
wrmA/nemA Annualreports
mow and i /memr
All wastewater from municipalitiestreated
Wastewatertreatment(numberofmunicipalitiesandpercentvolumewastewatertreated)
mol/ wrmA/ nemA Annual reports
MoL/MOW&I
100%compliancetoeiA/eA regulations
%levelofadherencetoEIA/environmental audit regulations
nemA Annual Report
memr
100%compliancetoairandnoisepollutionregulations
Ambientconcentrationofair/noisepollutantsinurbanareas
nemA/kmd AnnualReports
memr

P-E INdIcaTORs REPORT
41
gauging of water volume in major rivers
water volume gauging for major rivers(inFebruary,thedriestmonthoftheyear)
wrmA Annual Report
MOW&I
Computerizedlandregistryestablished
Numberofcomputerizedlandregistries
mol Annual Report
mol
national land use masterplanestablished
Preparationandimplementationofanationallanduseplan(prerequisitesincludeharmonizationofvariouspiecesofenablinglegislation)
mol Annual Report
mol
Production of the majorfoodcropsincreasedby45%
Increaseagriculturalyield(perunitarea)formajorfoodcropsby45%(maize,riceandwheat)
moA Annual Report
moA
20newagro-processingtechnologiesdeveloped
increased value addition in agriculturalcommodities;
No.ofagro-processingtechnologies developed/applied
MOA/MoCDMAnnualReports
3tierfertilizercostreductionby30%
Tonnesoffertilizers(i)bulked,(ii)locallyblendedand(iii)locallyproduced(fertilizerplant)
MOA/MOT&IAnnualReports
moA
4LivestockdiseasefreezonesestablishedinASALregions(1inCoast;1inLaikipia,1in isiolo, and 1 north Rift)
Numberoflivestockdiseasefreezonescreated
mold Annual Report
mold
Mobilize/investsavings/depositsinviablecooperativeventures/enterprises
Valueofsavingsmobilized/investedthroughcooperatives/sAccos
MOCD&MAnnualReports
MOCD&M
Note:Therewereadditionalindicatorson(a)accesstosafewater(urban/rural,andNorthernKenya),(b)waterstorageandharvestingcapacitypercapita,(c)accesstosanitation(urban/rural,andNorthernKenya),(d)assenttonationalenvironmentalpolicyandpolicyonwildlifeecosystemsprotection,and(e)reductioninlossesduetofloods(valueofpropertyandfarmsdestroyedduetofloods).

42
Ministry of state for Planning, National development & Vision 2030
VISI
ON
203
0 PI
LLA
R/SE
CTO
RM
AJO
R D
EVEL
OPM
ENT
ISSU
ESN
ATIO
NA
L-LE
VEL
OU
TCO
ME
IND
ICAT
ORS
SUB-
NAT
ION
AL
OU
TPU
T LE
VEL
IND
ICAT
ORS
ECO
NO
MIC
PIL
LAR
the
mAc
roec
on
om
ic
frAm
ewo
rk
Thepu
rsuitofam
acroecon
omicframew
orkthat
willfacilitatelo
wand
stableinfla
tion
and
interest
rates,asustainab
lepub
licsectorde
btposition,
andacompe
titiverea
lexcha
ngeratetosupp
ort
anexp
ort-ledecon
omicgrowthand
helptodeliver
highand
sustainab
lele
velsofgrow
th,em
ploymen
tan
dpo
vertyredu
ction.The
rateofgrowthofthe
econ
omywasprojected
toriseto10%by
2012/13,
andwou
ldreq
uirecon
tinu
edim
plem
entation
ofprude
ntfiscal,mon
etaryan
dexchan
gerate
polic
ies;enh
ancedefforttoraisethelevelo
fin
vest
men
ts a
nd s
avin
gs,
and
acce
lera
ting
str
uctu
ral
reform
sinordertoincrea
sethe
efficien
cyofbo
th
physicaland
hum
ancap
italand
raisetotalfactor
prod
uctivity.Th
eGovernm
entwillensurethatthe
bu
lkofexpe
ndituresarem
etfromtaxreven
ueand
thatoverallexpe
nditureiscon
trolledtoensure
thatthe
overallgovernmen
tde
ficitissustainab
le,
whi
ch in
clud
es m
aint
aini
ng a
str
ong
reve
nue
effo
rt,
keep
ingtheoverallfi
scaldefi
citatle
sstha
n5%
of
GDP,con
taininggrow
thoftotale
xpen
dituresan
dshiftingresou
rcestopriorityareas,an
dincrea
sing
theshareofdevelop
men
texpe
nditures.
mAc
roec
on
om
ic P
erfo
rmAn
ceGrossdom
esticprod
uct(GDP)percap
ita;
Investmen
tshareinGDP;
Grosssaving;
Adjusted
netsavingsaspe
rcen
tageofgross
nation
alin
come(GNI);
Infla
tion
rate;
Remittancesaspe
rcen
tageofGNI
sust
Ain
Able
Pu
blic
fin
Ance
Deb
ttoGNIratio;
Curren
taccoun
tde
ficitaspe
rcen
tageofGDP
emPl
oym
ent
Employmen
t-to-pop
ulationratio;
Labo
rprod
uctivityand
unitlabo
rcosts
Acce
ss t
o e
ner
gy
Grossdom
esticexpe
nditureon
ren
ewab
le
energy(solar,windan
dhydroe
lectricity)asa
percen
tofGDP;
Annu
alene
rgyconsum
ption,totaland
by
mainusercategory;
Intensityofene
rgyuse,totaland
byecon
omic
activity;
Percen
tageofho
useh
oldsin
ruraland
urban
area
susingalternativesourcesofene
rgyto
woo
dfuel(includ
ingcharcoal)forcooking
Acce
ss t
o e
ner
gy
Rateofad
option
ofeffic
ient
energysavingtechno
logies
for
diff
eren
t ca
tego
ries
of
energyusers;
Prop
ortion
ofpo
pulation
de
pend
enton
biomass,solar,
windan
dhydro-electric
energy;
tonn
es o
f ch
arco
al e
stim
ated
torea
churban
marke
ts;
Num
bersofscho
olspiloting
biogas,solar,winden
ergy;
Num
berofhou
seho
ldswith
operationa
lbiogas,solar,
winden
ergyunits
an
nex
: m
aTri
x o
f Pr
oPo
sed in
dic
aTo
rs f
or
P ove
rTy-
envi
ron
men
T m
on
iTo
rin
g

P-E INdIcaTORs REPORT
43
VISI
ON
203
0 PI
LLA
R/SE
CTO
RM
AJO
R D
EVEL
OPM
ENT
ISSU
ESN
ATIO
NA
L-LE
VEL
OU
TCO
ME
IND
ICAT
ORS
SUB-
NAT
ION
AL
OU
TPU
T LE
VEL
IND
ICAT
ORS
(e.g.solar,windan
dhydro-electricity)in
totale
nergyuse;
Percen
tageofKe
nyaelectricitygene
ratedby
rene
wab
lesou
rces(solar,wind,biomass,and
minih
ydrosou
rces);
Thepe
rcen
tageofKe
nya’selectricity
gene
ratedby
non
-ren
ewab
lesou
rces(e.g.
diesel);
Percen
tageofurba
nan
druralh
ouseho
lds
conn
ectedtoelectricity;
Percen
tofhou
seho
ldsusingen
ergysaving
stov
es
info
rmAt
ion
An
d c
om
mu
nic
Atio
n
tech
no
log
ies
Internetusersper100pop
ulation;
Fixedteleph
onelin
esper100pop
ulation;
Mob
ilecellularteleph
onesubscriberspe
r100
popu
lation
rese
Arch
An
d d
evel
oPm
ent
Grossdom
esticexpe
nditureon
R&Dasa
percen
tofGDP
con
sum
Ptio
n A
nd
Pro
du
ctio
n P
Atte
rns
Materialinten
sityoftheecon
omy;
Dom
esticmaterialc
onsumption;
Waterusein
tensityby
econo
micactivity;
Perc
ent
of h
ouse
hold
s an
d in
dust
ries
usi
ng
fuel-w
oodasasou
rceofene
rgyforcooking;
Gen
erationofwaste;
Gen
erationofhazardo
uswaste;
Mod
alsplitofpa
ssen
gertran
sportation
;Mod
alsplitoffreighttran
sport;
Energyin
tensityoftranspo
rt

44
Ministry of state for Planning, National development & Vision 2030
VISI
ON
203
0 PI
LLA
R/SE
CTO
RM
AJO
R D
EVEL
OPM
ENT
ISSU
ESN
ATIO
NA
L-LE
VEL
OU
TCO
ME
IND
ICAT
ORS
SUB-
NAT
ION
AL
OU
TPU
T LE
VEL
IND
ICAT
ORS
tou
rism
VISION:Tobecom
eatop-tenlonghau
lto
uris
t de
stin
atio
n in
the
wor
ld t
hat
offe
rs a
hig
h va
lue,
div
erse
and
di
stin
ctiv
e vi
sito
r expe
rien
ce
ISSU
ESFOR2030:
prod
uctqu
ality
anddiversity,
infr
astr
uctu
re,
marke
tingKen
ya,
security,strategic
lead
ershipand
co
ordi
nati
on
Improvem
entofsecurity;
Inad
equa
tein
frastructuresup
porte.g.road
ne
twork;
Narrowprodu
ctqua
lityan
ddiversity
Inad
equa
tehotel/b
edcap
acity;
Strategiclead
ershipand
coo
rdinatione.g.
unne
cessarycompe
tition
and
dup
licationof
marke
tingefforts;
Marke
tingKen
yaasatouristde
stination;
Untap
peddo
mestictourism;
Environm
entalissue
se.g.lo
ssofha
bitatdu
eto
chan
ge in
land
use
, hu
man
enc
roac
hmen
t in
to
protectedarea
s,lo
ssofwild
lifemigratorycorrido
rs,
andinad
equa
tepolicyan
dgovernan
cetocurb
poaching;
Inad
equa
teskille
dhu
man
resou
rce;
Researchand
develop
men
t
Tourismcon
tributiontoGDP;
rati
o of
loca
l res
iden
ts t
o to
uris
ts in
maj
or
tour
ist
regi
ons
and
dest
inat
ions
Agri
cult
ure
VISION:Tobe
inno
vati
ve,
commercially
orie
nted
and
m
oder
n fa
rm a
nd
lives
tock
sec
tor
ISSU
ESFOR2030:
prod
uctivity,land
us
e, m
arke
ts a
nd
valu
e ad
diti
on
Highcostofinpu
ts;
Land
usein
agriculture(subd
ivisionintoune
cono
mic
units);
Limited
app
reciationofagriculturaltechn
ologyan
dinno
vation
e.g.inad
equa
tecap
italtoad
opttonew
/recentin
novation
s;w
eak
farm
er in
stit
utio
ns e
.g.
mis
man
agem
ent
in
coop
erativesocieties;
Poorlivestockhu
sban
drypractices;
Limited
exten
sion
services;
Overdep
ende
nceon
rain-fedagriculture;
Inad
equa
teexp
loitationofvalue
add
ition;
Inad
equa
tecreditfacilities;
Lowm
arinefishexpo
rts
foo
d s
ecu
rity
Annu
alpercap
itafood
produ
ction;
Perc
ent
of h
ouse
hold
inco
me
from
agr
icul
ture
an
dliv
estock(by
incomequ
intileperann
um);
Tren
dsin
foo
dprices(forselected
staples);
Percen
toftotalpop
ulationwho
arefoo
dinsecure;
Land
produ
ctivity(ton
esoffood
/ha/
an
num);
Sustaina
bleuseofwaterforprodu
ction;
Area
of
rain
wat
er h
arve
stin
g/ w
ater
conservation
techn
ologies,disaggregated
by
type
(i.e.terraces,m
icro-catchmen
ts,etc);
Prop
ortion
offood
produ
cedthatissoldto
themarke
t(bywea
lthqu
intile);
foo
d s
ecu
rity
Num
berofpeo
plead
opting
drou
ghttolerantcrops;
Num
beroflivestockke
epers
adop
tingdroughtabe
tting
strategies;
lAn
d u
se A
nd
stA
tus
Thenu
mbe
rofla
nduseplans
prep
ared
and
implem
ented
atdistrictlevel;
Existenceofope
ration
al
land
reg
istr
atio
n se
rvic
es a
t districtand
sectorlevel;
Effectiven
essofope
ration
al
dist
rict
and
sec
tora
l lev
els

P-E INdIcaTORs REPORT
45
VISI
ON
203
0 PI
LLA
R/SE
CTO
RM
AJO
R D
EVEL
OPM
ENT
ISSU
ESN
ATIO
NA
L-LE
VEL
OU
TCO
ME
IND
ICAT
ORS
SUB-
NAT
ION
AL
OU
TPU
T LE
VEL
IND
ICAT
ORS
Percen
tofpeo
plewith<ha
ofland
who
have
regularan
dsustaine
doff-farm
employmen
t
lAn
d u
se A
nd
stA
tus
Perc
ent
of r
ural
hou
seho
lds
wit
h se
cure
land
tenu
re;
Increa
sednu
mbe
rofbee
keep
ers(on-oroff-
farm
);Land
usecha
nge;
Land
affectedby
desertific
ation;
Arab
leand
perman
entcrop
land
area;
Area
und
er o
rgan
ic f
arm
ing
lAn
d d
egrA
dAt
ion
Prop
ortion
ofarab
lela
ndtha
tisprotected
from
erosion
;Pe
rcen
toffarmerspracticingsoil
conservation
techn
ologies;
Perc
ent
of ir
riga
tion
and
oth
er w
ater
-intensiveprojectstha
tha
vebee
nsubjected
toenviron
men
talimpa
ctassessm
ent
Agri
cult
urA
l in
Puts
Fertilizeruseeffic
iency;
Useofagriculturalpesticide
s;Pe
rcen
t of
far
mer
s w
ith
acce
ss t
o an
d us
ing
inorganican
dorganicfertilizers;
Perc
ent
of f
arm
ers
wit
h ac
cess
to
and
usin
g im
proved
see
d;Num
berofapp
rovedagriculturechem
icalsin
use;
Num
berofban
nedagriculturalche
micalson
themarke
t;Q
uant
itie
s of
unu
sed
indu
stri
al a
nd
agrochem
icalsprop
erlydispo
sedoff;
land
registrationservices;
Increa
sednu
mbe
rofvillages
withland
titledee
dsby
2012;
Sensitizationmee
tingshe
ld
onla
ndten
ure(ann
ually
);lo
cal l
eade
rs t
rain
ed in
land
disputeresolution
;Pe
rcen
t of
far
mer
s w
ho h
ave
plan
tedmed
icinalplant
species;
Compreh
ensivela
nd
evalua
tion
/suitability
assessmen
trepo
rt;
Redu
ctionindisap
pearan
ce
ofcertaingrassspe
cies
crucialtograzingland
prod
uctivity;
Num
berofcon
tingen
cyplans
andstrategiesprepa
redto
dealwithdrou
ghtan
dflo
ods;
Decreased
useoffirein
harvestingbee
produ
cts
and
an in
crea
sed
use
of
approp
riatetechno
logyfor
harv
esti
ng
lAn
d d
egrA
dAt
ion
Prop
ortion
oftheagriculture
budg
etspe
ntoned
ucating
farm
ers
and
lives
tock
ke
epersinbestpracticesfor
conservingthe
environ
men
t;Pe
rcen
t of
agr
icul
tura
l sec
tor
budg
etspe
ntonsoil

46
Ministry of state for Planning, National development & Vision 2030
VISI
ON
203
0 PI
LLA
R/SE
CTO
RM
AJO
R D
EVEL
OPM
ENT
ISSU
ESN
ATIO
NA
L-LE
VEL
OU
TCO
ME
IND
ICAT
ORS
SUB-
NAT
ION
AL
OU
TPU
T LE
VEL
IND
ICAT
ORS
Num
berofpun
itiveagriculturalle
gislation
hurtingfood
produ
ctionby
smallfarmers
e.g.gen
eticallym
odified
organ
ismswith
term
inatorgen
es(on
eexam
pleism
aize
cons
erva
tion
, fo
rest
an
daq
uaticecosystems
conservation
activities;
Area
of
land
und
er
operationa
lsoila
ndwater
conservation
program
mes
wh
ole
sAle
An
d
retA
il t
rAd
eVISION:Tom
ove
tow
ards
a f
orm
al
sect
or t
hat
is
effic
ient,multi-
tiered
,diversified
inprodu
ctran
ge
and
inno
vati
ve
ISSU
ESFOR2030:
improvem
ent
inthe
sup
ply
chain,promotion
ofprodu
cer-
basedgrou
ps
or a
ssoc
iati
ons,
im
proving
thebu
sine
ss
envi
ronm
ent
Wea
kbu
sine
ssregulatoryfram
ework;
Infrastructure;
Marke
taccess;
Busine
ssskillsdevelop
men
t;Lowutiliz
ationofin
form
ationan
dcommun
ication
techno
logies;
Lowcap
acityinm
arke
tde
velopm
ent;
Limited
accesstofina
ncean
dcred
it;
hiv
/Aid
s
mAn
ufA
ctu
rin
g
VISION:Th
ede
velopm
entof
robu
st,diversified
an
dcompe
titive
man
ufac
turi
ng
Lowvalue
add
itionan
dna
rrow
exp
ortba
se;
Und
erde
velope
dan
d/ordila
pida
tedtran
sport
netw
ork;
Inad
equa
te,costlyand
unstablesupp
lyofen
ergy;
Lowado
ptionofin
form
ationan
dcommun
ication
techno
logy;
Overlap
san
dam
biguitiesinm
anda
tesan
dfunction
s;
Num
berofcom
paniestha
tad
heretoISO
14000stan
dards;
Perc
ent
of in
dust
ries
whi
ch h
ave
unde
rgon
e en
vironm
entala
udit;
Num
berofin
dustriesand
enterprisesadh
ering
toenviron
men
talstand
ards;
Num
berofin
dustrialunitstha
tha
vein
stalled
techno
logiestha
tredu
cele
velsofpo
llutants
reachingthe
environ
men
t(i.e.usingclea
ner
Num
berofpollution
permits
issued
peryea
rby
indu
stries
and
othe
r la
rge
scal
e en
terprises;
Num
berofenviron
men
tal
audi
ts u
nder
take
n fo
r in
dust
ries
tha
t ha
ve n
ot h
ad
EIAsdon
eon
the
m;

P-E INdIcaTORs REPORT
47
VISI
ON
203
0 PI
LLA
R/SE
CTO
RM
AJO
R D
EVEL
OPM
ENT
ISSU
ESN
ATIO
NA
L-LE
VEL
OU
TCO
ME
IND
ICAT
ORS
SUB-
NAT
ION
AL
OU
TPU
T LE
VEL
IND
ICAT
ORS
Lowtechn
ology,in
novation
and
R&Duptake;
Wea
klegal,regulatoryan
dinstitutiona
lframew
orks;
Influ
xofsub
stan
dard,coun
terfeitan
dcontraba
nd
good
s;Inad
equa
tecap
acitytom
eetqu
alityan
dstan
dard
requ
irem
ents;
Limited
accesstofina
ncialservices;
Limited
produ
ctionan
dman
agerialskills
prod
uction
techn
ologies)
Perc
ent
of in
dust
ries
and
ot
her
com
mer
cial
ent
itie
s w
ith
was
tew
ater
tre
atm
ent
faci
litie
s
busi
nes
s Pr
oce
ss
ou
tso
urc
ing
/off
-sh
ori
ng
VISION:Tobethe
topoff-shoring
dest
inat
ion
in A
fric
a
issu
es f
or
2030:ba
sic
infr
astr
uctu
re,
talentpoo
l,
localsup
plier
base,incentive
fram
ewor
k
Poortelecom
mun
icationinfrastructure;
Highcostand
unreliabilityofene
rgysupp
ly;
Lackofde
dicatedBP
Ofacilities;
Inad
equa
tesup
plyofnecessaryskills;
Poorlo
calsup
plierba
seofthene
cessaryha
rdware
andsoftware;
no
targ
eted
ince
ntiv
es f
or b
Po
fin
Anci
Al s
ervi
ces
VISION:Amore
effic
ientand
compe
titive
finan
cialsystem
to d
rive
sav
ings
an
d in
vest
men
t fo
r sustaina
blebroa
d-ba
sedecon
omic
grow
th
Mob
ilization
and
accesstofina
ncialservices;
Legala
ndregulatoryfram
ework;
Retiremen
tbe
nefits;
Capa
citycon
straintse.g.inactua
rialstudies
Sensitizationon
accessto
cred
itservices;
Perc
enta
ge o
f ru
ral
popu
lation
accessingm
icro-
finan
ceforsustainab
le
inco
me
gene
rati
ng a
ctiv
itie
s no
tba
sedon
NRprod
ucts
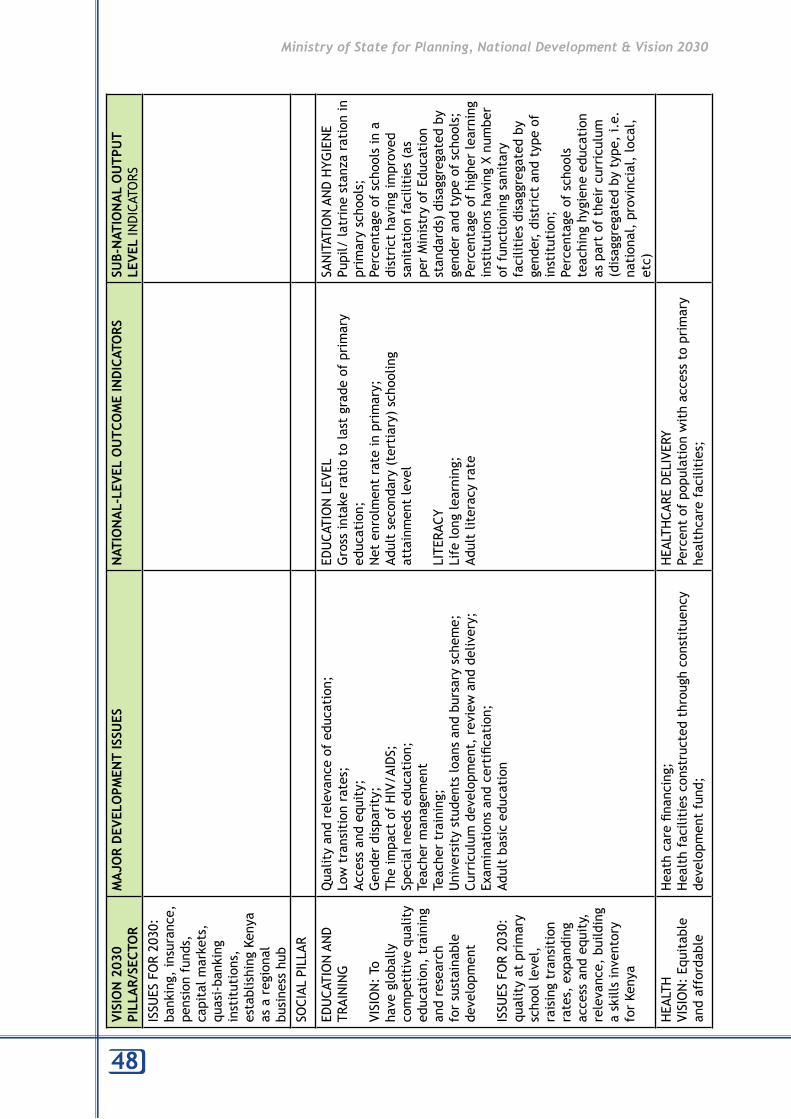
48
Ministry of state for Planning, National development & Vision 2030
VISI
ON
203
0 PI
LLA
R/SE
CTO
RM
AJO
R D
EVEL
OPM
ENT
ISSU
ESN
ATIO
NA
L-LE
VEL
OU
TCO
ME
IND
ICAT
ORS
SUB-
NAT
ION
AL
OU
TPU
T LE
VEL
ind
icAt
ors
ISSU
ESFOR2030:
bank
ing,in
surance,
pensionfund
s,
capitalm
arke
ts,
quasi-ba
nking
inst
itut
ions
, establishingKen
ya
as a
reg
iona
l bu
sine
sshub
soci
Al P
illA
r
edu
cAti
on
An
d
trAi
nin
g
VISION:To
havegloba
lly
compe
titivequa
lity
educ
atio
n, t
rain
ing
and
rese
arch
forsustaina
ble
developm
ent
ISSU
ESFOR2030:
qualityatprimary
scho
ol le
vel,
ra
isin
g tr
ansi
tion
rates,exp
anding
accessand
equ
ity,
relevance,building
askillsinventory
forKe
nya
Qua
lityan
drelevanceofedu
cation
;Lowtransitionrates;
Accessand
equ
ity;
Gen
derdisparity;
Theim
pactofHIV/A
IDS;
Specialn
eedsedu
cation
;te
ache
r m
anag
emen
tTeache
rtraining;
Universitystud
entslo
ansan
dbu
rsarysche
me;
Curriculum
develop
men
t,reviewand
delivery;
Exam
inationsand
certific
ation;
Adultba
siced
ucation
edu
cAti
on
lev
elGrossin
take
ratiotolastgrade
ofprim
ary
education;
Netenrolmen
tratein
primary;
Adultsecond
ary(tertiary)schoo
ling
atta
inm
ent
leve
l
lite
rAcy
Lifelo
ngle
arning;
Adultliteracyrate
sAn
itAt
ion
An
d h
ygie
ne
Pupil/la
trinestan
zarationin
prim
aryscho
ols;
Perc
enta
ge o
f sc
hool
s in
a
districthavingim
proved
sanitation
facilities(as
perMinistryofEdu
cation
stan
dards)disaggregated
by
gend
erand
typ
eofschoo
ls;
Perc
enta
ge o
f hi
gher
lear
ning
institutionshavingXnu
mbe
roffun
ctioningsan
itary
facilitiesdisaggregatedby
gend
er,districtand
typ
eof
institution;
Perc
enta
ge o
f sc
hool
s teachinghygiene
edu
cation
aspartofthe
ircurriculum
(disaggregated
bytype
,i.e.
nation
al,provincial,local,
etc)
heA
lth
VISION:Eq
uitable
andaffordab
le
Hea
thcarefin
ancing;
Hea
lthfacilitiesconstructedthroughconstituen
cy
developm
entfund
;
heA
lth
cAre
del
iver
yPe
rcen
tofpop
ulationwithaccesstoprim
ary
healthcarefacilities;

P-E INdIcaTORs REPORT
49
VISI
ON
203
0 PI
LLA
R/SE
CTO
RM
AJO
R D
EVEL
OPM
ENT
ISSU
ESN
ATIO
NA
L-LE
VEL
OU
TCO
ME
IND
ICAT
ORS
SUB-
NAT
ION
AL
OU
TPU
T LE
VEL
IND
ICAT
ORS
healthcaresystem
of t
he h
ighe
st
possiblequa
lity
issu
es f
or
2030:he
alth
infr
astr
uctu
re,
heal
th s
ervi
ce
deliv
ery,develop
ing
equitablefin
ancing
mec
hani
sms
Hum
anresou
rceinhea
lth;
Wea
khe
althin
form
ationman
agem
entsystem
sIm
mun
izationagainstinfectiouschildho
od
dise
ases
heA
lth
stA
tus
And
ris
ksMorbidityofmajordisea
sessuchasHIV/A
IDS,
malaria,tube
rculosis;
Prevalen
ceofdiarrhea
amon
gun
der5-year
olds;
Percen
tofpeo
pleslee
pingund
ertreated
mosqu
itone
ts;
inci
denc
es o
f m
alar
ia a
mon
g w
omen
and
youn
gchild
ren;
Annu
al d
eath
rat
e fr
om m
alar
ia a
mon
g un
der-
fiv
esand
pregnan
twom
en;
Percen
tofm
alariacasesrep
orted(severean
dun
complicated
);Prop
ortion
ofho
useh
oldexpe
nditurespen
ton
malariatreatmen
t;Incide
nceofcho
lerain
rural/u
rban
areas;
Prevalen
ceoftoba
ccouse(smoking)
wAt
er A
nd
sA
nit
Atio
n
VISION:To
ensu
re w
ater
an
d sa
nita
tion
availabilityforall
issu
es f
or
2030:ad
dressing
waterscarcity,
watersecurity,
catc
hmen
ts
man
agem
ent,
in
crea
sed
Waterscarcity;
Watersecurity;
Watercatchmen
tsm
anagem
ent;
Waterqua
lity
Infrastructuredevelop
men
te.g.poo
rph
ysical
plan
ningin
urban
areas;
Poor
mon
itor
ing
of w
ater
res
ourc
es
wAt
er Q
uAn
tity
Existenceofaninventoryofwaterresou
rces
inKen
ya(waterresou
rcesm
asterplan
);Prop
ortion
ofwatershed
sprotected;
Prop
ortion
oftotalw
aterresou
rcesused,i.e.
totalw
aterwithd
rawalaspe
rcen
toftotal
rene
wab
lewaterresou
rces;
Adop
tion
ofpa
ymen
tsforenviron
men
tal
services,espe
ciallytha
tsupp
ortsustaina
ble
man
agem
ent
of w
ater
cat
chm
ents
are
as e
.g.
byNairobiwatercon
sumers
Acce
ss t
o w
Ater
Thepe
rcen
tageofruralh
ouseho
ldsab
leto
fetchclea
nan
dsafewaterin
und
er30mins
wAt
er Q
uAn
tity
Incide
ncesofwaterstress;
inci
denc
es o
f w
ater
-use
confl
icts;
Num
beroffun
ctiona
lsafe
wat
er s
ourc
es
Acce
ss t
o w
Ater
Num
berofim
proved
water
sources;
Acce
ss t
o w
Ater
Num
berofim
proved
water
sources;
Num
berofnew
urban
poo
r

50
Ministry of state for Planning, National development & Vision 2030
VISI
ON
203
0 PI
LLA
R/SE
CTO
RM
AJO
R D
EVEL
OPM
ENT
ISSU
ESN
ATIO
NA
L-LE
VEL
OU
TCO
ME
IND
ICAT
ORS
SUB-
NAT
ION
AL
OU
TPU
T LE
VEL
IND
ICAT
ORS
(go,collect,return)from
aprotected
sou
rce;
Averagetimespen
tby
wom
enand
children
colle
ctingwater;
Prop
ortion
ofruralp
opulationusingan
im
proved
watersou
rce;
Thepe
rcen
tageofurba
nho
useh
oldswith
accesstopipe
dorprotected
waterastheir
maindrinkingwatersou
rce;
Percapitawateruseamon
gpo
orhou
seho
lds;
Prop
ortion
ofho
useh
oldincomespen
ton
w
ater
wAt
er Q
uAl
ity
Area
ofclea
nwaterbod
ies–ba
sedon
the
Ke
nyawaterstand
ardsof(yea
r);
Num
berofwatersam
plestested,m
eetingthe
Ke
nyaWaterQua
lityStan
dards;
Thenu
mbe
rofwaterbod
ieswithturbidity
valuesabo
vethe
Ken
yastand
ards;
Thenu
mbe
rofwaterbod
ieswithflu
oride
levelsabo
vethe
Ken
yastand
ards;
Thenu
mbe
rofwaterbod
ieswithba
cterial
contam
inationlevelsabo
vethe
Ken
ya
stan
dards;
Presen
ceoffaecalcoliformsinfreshwater;
Bioche
micaloxygende
man
dinwaterbod
ies
Percen
tofhea
lthspen
dingontrea
tmen
tof
water-borne
disea
ses;
Incide
nceofcho
lerain
ruralareas;
Incide
nceofcho
lerain
urban
areas
sAn
itAt
ion
Thepe
rcen
tageofho
useh
oldslo
catedin
unplan
nedsettlemen
tsand
slumsthatla
ck
adeq
uatebasicessen
tialutilities(w
ater,
househ
olds(orareas)
conn
ectedtopiped
water;
Num
berofschoo
lswitha
safewaterfacilitywithin100
met
er r
adiu
s
Rural:
Recurren
texpe
nditureon
ruralw
atersup
plyasa
percen
tageoftotalw
ater
expe
nditures;
Thenu
mbe
rofruraldistricts
thatarebelow
the
nationa
laverageofruralwatersup
ply
coverage;
Averagepe
rpe
rson
,da
ily
provisionofwaterthrou
gh
ruralw
aterpoints;
Thepe
rcen
tageofrural
waterschem
esm
anaged
by
bene
ficiarycom
mun
ities;
Thenu
mbe
rofwaterbasin
man
agem
entplan
sprep
ared
an
dim
plem
ented
Urban
:Re
curren
texpe
nditureon
urba
nwatersup
plyasa
percen
tageoftotalw
ater
expe
nditures;
Thenu
mbe
roftotal
hous
ehol
d co
nnec
tion
s inUrban
WaterSup
ply
Authorities(UWSA
s);
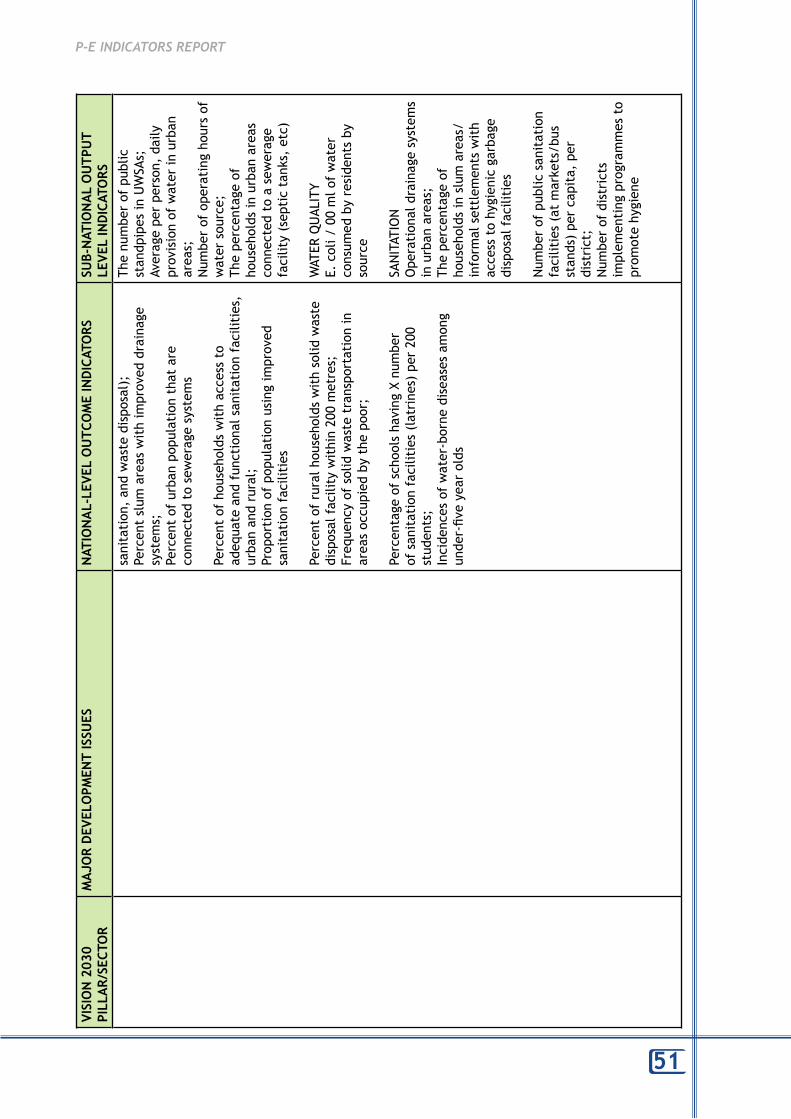
P-E INdIcaTORs REPORT
51
VISI
ON
203
0 PI
LLA
R/SE
CTO
RM
AJO
R D
EVEL
OPM
ENT
ISSU
ESN
ATIO
NA
L-LE
VEL
OU
TCO
ME
IND
ICAT
ORS
SUB-
NAT
ION
AL
OU
TPU
T LE
VEL
IND
ICAT
ORS
sanitation
,an
dwastedispo
sal);
Percen
tslum
areaswithim
proved
drainage
system
s;Pe
rcen
tofurban
pop
ulationthatare
conn
ectedtosew
eragesystem
s
Perc
ent
of h
ouse
hold
s w
ith
acce
ss t
o ad
equa
te a
nd f
unct
iona
l san
itat
ion
faci
litie
s,
urba
nan
drural;
Prop
ortion
ofpo
pulation
usingim
proved
sa
nita
tion
fac
iliti
es
Perc
ent
of r
ural
hou
seho
lds
wit
h so
lid w
aste
disposalfacilitywithin200metres;
Freq
uencyofsolidwastetranspo
rtationin
area
soccupied
bythepo
or;
Percen
tageofscho
olsha
vingXnum
ber
ofsan
itationfacilities(latrine
s)per200
stud
ents;
Incide
ncesofwater-borne
disea
sesam
ong
unde
r-fiv
eyearolds
Thenu
mbe
rofpub
lic
stan
dpipesin
UWSA
s;Averagepe
rpe
rson
,da
ily
provisionofwaterin
urban
area
s;Num
berofope
ratinghou
rsof
watersou
rce;
Thepe
rcen
tageof
househ
oldsin
urban
areas
conn
ecte
d to
a s
ewer
age
facility(sep
tictank
s,etc)
wAt
er Q
uAl
ity
E.coli/
00mlo
fwater
consum
edbyreside
ntsby
so
urce
sAn
itAt
ion
Ope
ration
aldrainagesystem
sinurban
areas;
Thepe
rcen
tageof
hous
ehol
ds in
slu
m a
reas
/ in
form
al s
ettl
emen
ts w
ith
accesstohygien
icgarba
ge
disposalfacilities
Num
berofpub
licsan
itation
facilities(atmarke
ts/b
us
stan
ds)pe
rcapita,pe
rdistrict;
Num
berofdistricts
implem
entingprogram
mesto
prom
otehygien
e

52
Ministry of state for Planning, National development & Vision 2030
VISI
ON
203
0 PI
LLA
R/SE
CTO
RM
AJO
R D
EVEL
OPM
ENT
ISSU
ESN
ATIO
NA
L-LE
VEL
OU
tco
me
ind
icAt
ors
sub-
nAt
ion
Al o
utP
ut
leve
l in
dic
Ato
rs
sanitation
,an
dwastedispo
sal);
Percen
tslum
areaswithim
proved
drainage
system
s;Pe
rcen
tofurban
pop
ulationthatare
conn
ectedtosew
eragesystem
s
Perc
ent
of h
ouse
hold
s w
ith
acce
ss t
o ad
equa
te a
nd f
unct
iona
l san
itat
ion
faci
litie
s,
urba
nan
drural;
Prop
ortion
ofpo
pulation
usingim
proved
sa
nita
tion
fac
iliti
es
Perc
ent
of r
ural
hou
seho
lds
wit
h so
lid w
aste
disposalfacilitywithin200metres;
Freq
uencyofsolidwastetranspo
rtationin
area
soccupied
bythepo
or;
Percen
tageofscho
olsha
vingXnum
ber
ofsan
itationfacilities(latrine
s)per200
stud
ents;
Incide
ncesofwater-borne
disea
sesam
ong
unde
r-fiv
eyearolds
Thepe
rcen
tageof
hous
ehol
ds w
ith
hand
washingfacilities;
Perc
ent
of h
ouse
hold
s practicingbasichygiene
;Pe
rcen
tofpoo
rho
useh
olds
withap
prop
riateprovisions
fordisposalofchild
ren’s
faeces;
Percen
tofpeo
plewith
know
ledg
eofbasicsan
itation
andhygien
ebe
havior;
Percen
tofpeo
plewith
know
ledg
e an
d/ o
r aw
aren
essab
outtran
smission
ofdiarrhe
adiseases;
Perc
ent
of h
ouse
hold
s maintainingprope
rhygien
e(clearingstagna
ntwaterand
bu
shesaroun
dho
mestead
s)
wAt
er u
ser
com
mit
tees
Num
berofW
aterUser
Committees(WUCs)form
ed
perdistrict/division
;Pe
rcen
tofW
UCswithO&M
budg
et;
Percen
tofW
UCshea
dedby
wom
en;
Theprop
ortion
ofwom
en
participatingindecision
makingbo
dies(water
committees,bo
ards,region
al
consultation
units,ministry
ofwater)

P-E INdIcaTORs REPORT
53
VISION2030
Pill
Ar/s
ecto
rm
AJo
r d
evel
oPm
ent
issu
esn
Atio
nAl
-lev
el o
utc
om
e in
dic
Ato
rssu
b-n
Atio
nAl
ou
tPu
t le
vel
ind
icAt
ors
envi
ron
men
tAl
mAn
Agem
ent
VISION:Ana
tion
liv
ing
in c
lean
, se
cure
and
sustaina
ble
envi
ronm
ent
ISSU
ESFOR2030:
cons
erva
tion
, po
llution
and
waste
man
agem
ent,
As
Als
and
high
ris
k disasterzon
es,
envi
ronm
enta
l plan
ningand
go
vern
ance
Environm
entald
egrada
tion
;Fo
restry;
Pollu
tion
and
wastem
anagem
ent;
Clim
atechan
ge;
Biotechn
ology;
Integrated
environ
men
talp
lann
ing;
Environm
entale
ducation
and
awaren
ess;
inst
itut
iona
l and
lega
l fra
mew
ork
vuln
erAb
ilit
y to
nAt
urA
l h
AZAr
ds
Function
ingea
rlywarningsystemsinplace;
Percen
toftotalpop
ulationwho
are
suscep
tibleorexp
osed
totheriskofflo
ods,
land
slidesordrou
ght(hazardpron
earea
s);
Percen
tageofpo
pulation
livingin
areas
of h
igh
risk
of
envi
ronm
enta
l dis
aste
r (disaggregateby
typ
e,i.e.floo
d,la
ndslides,
drou
ghts,food
sho
rtages)
dis
Aste
r Pr
ePAr
edn
ess
And
res
Pon
seArea
(ha
orsqkm)ofsteep
hillsan
dmou
ntainsand
ran
geland
sprotectedfrom
hu
man
activities;
Percen
tofdegrade
dwetland
sreha
bilitated
;Hum
anand
econo
miclo
ss(loss/d
estruction
of
prop
erty)du
etonaturaldisastersin
clud
ing
numbe
rofhum
andea
ths,in
juriesorillne
sses
duetofloo
ds,land
slidesordrou
ght;
Percen
tofpeo
pleresettledfrom
wetland
s,
stee
phillsorextrem
elydryrangelan
ds;
Percen
tofdryla
ndsan
dstee
pslop
esund
er
cultivationorlivestockgrazing;
Area
(inha)ofba
rehillsplan
tedwithtree
san
dsoilstab
ilizinggrasses;
Percen
tofhillyarea
swhichhavebe
en
terr
aced
or
unde
r so
il co
nser
vati
on
Atm
osP
her
eCa
rbon
dioxide
emission
s;Em
ission
sofgreen
housegases;
Consum
ptionofozone
dep
letingsub
stan
ces;
Ambien
tconcen
trationofairpollutantsin
urba
narea
s
dis
Aste
r Pr
ePAr
edn
ess
And
re
sPo
nse
Rainfallrelia
bilityan
dvariab
ilityle
adingto
inci
dent
s of
dro
ught
, an
d flo
ods;
Perc
enta
ge o
f la
nd a
rea
affected
byrefugee-related
disasters;
Num
berofdistrictsado
pting
flood
man
agem
entsystem
s;Num
berofslumim
provem
ent
projectsim
plem
ented;
Existenceofrob
ustea
rly
warningsystem;
exis
tenc
e of
dis
aste
r prep
ared
nessplan;
Inventory/datab
aseof
sett
lem
ents
in w
etla
nds
and
stee
phills;
exis
tenc
e of
res
ettl
emen
t plan
and
app
rovedbu
dget;
Num
berofsen
sitization
m
eeti
ngs
held
on
environm
entald
isasters;
Num
berofgroup
ed
sett
lem
ents
sit
es e
valu
ated
foren
vironm
entalsuitability;
Num
berofhou
seho
ldswho
ha
vebee
nrend
ered
hom
eless
orlo
stprope
rtydu
etofloo
ds
andland
slides;
Totalv
alue
ofprop
ertylo
st
ordestroyed
byflo
odsan
dland
slides;

54
Ministry of state for Planning, National development & Vision 2030
VISION2030
Pill
Ar/s
ecto
rm
AJo
r d
evel
oPm
ent
issu
esn
Atio
nAl
-lev
el o
utc
om
e in
dic
Ato
rssu
b-n
Atio
nAl
ou
tPu
t le
vel
ind
icAt
ors
wet
lAn
ds
Prop
ortion
ofwetland
sthatisprotected
from
intensivehu
man
activities;
Prop
ortion
ofcriticalwetland
sun
der
intensiveagriculturaluse;
Existencean
dim
plem
entation
ofpro-po
or
polic
yan
dlawonwetland
s;Pe
rcen
t of
loca
l com
mun
itie
s liv
ing
arou
nd
crit
ical
wet
land
s in
volv
ed in
eco
tour
ism
or
recr
eati
onal
act
ivit
ies
fore
sts
Prop
ortion
oftotallan
darea
und
erforestan
dtree
cover;
Prop
ortion
ofland
areacoveredby
forests;
Prop
ortion
ofpu
blicla
ndsetaside
forforestry
activities;
Percen
tofforesttree
sda
maged
by
defolia
tion
;Area
offorestund
ersustainab
leforest
man
agem
entasapercentofforestarea;
Perc
ent
of f
ores
ts m
anag
ed t
hrou
gh
participatoryarrangem
entswithlocal
commun
ities;
Percen
tofbarehillsplanted
withtree
s
mAr
ine
envi
ron
men
tPe
rcen
tageoftotalp
opulationliv
ingin
coastala
reas;
Bathingwaterqua
lity;
Prop
ortion
offishstockswithinsafebiological
limits;
Prop
ortion
ofmarinearea
protected
;Marinetrop
hicinde
x(w
heretroph
icm
eans
“pertainingtoorfunction
inginnutrition
”);
Percen
tofnationa
l(or
district)bu
dgetspe
nton
disa
ster
mit
igat
ion
Atm
osP
her
eNum
berofope
ration
al
programmestomon
itor
noise,autom
obile
and
indo
or
pollu
tion
;
wet
lAn
ds
Wetland
masterplan
;Pe
rcen
t of
wet
land
s in
vent
orie
d
fore
sts
Num
berofparticipa
tory
fore
st m
anag
emen
t ag
reem
ents
sig
ned
and
implem
entedatdistrict
levels;
Num
ber(and
areainha)
ofope
ration
alforestry
conservation
program
mes;
Num
beroftreenu
rseries
establishe
d(atvilla
geand
location
/divisionlevel);
Num
beroftreeseed
lings
plan
ted(i.e.on
state,
privateland
,etc);
redu
ctio
n in
def
ores
tati
on in
area
spron
etosoile
rosion

P-E INdIcaTORs REPORT
55
VISION2030
Pill
Ar/s
ecto
rm
AJo
r d
evel
oPm
ent
issu
esn
Atio
nAl
-lev
el o
utc
om
e in
dic
Ato
rssu
b-n
Atio
nAl
ou
tPu
t le
vel
ind
icAt
ors
Area
ofcoralree
fecosystemsan
dpe
rcen
tage
live
cove
r
eco
syst
ems
Prop
ortion
ofterrestriala
reaprotected,total
andby
ecologicalregion;
Man
agem
enteffectiven
essofprotected
area
s;Area
ofselected
keyecosystem
sFragmen
tation
ofha
bitats
sPec
ies
Chan
gein
threa
tstatusofspecies;
Abun
danceofselectedke
yspecies;
Abun
danceofin
vasivealie
nspecies
wAs
te g
ener
Atio
n A
nd
mAn
Agem
ent
Wastetreatmen
tan
ddisposal;
Wastewatertreatmen
t;Man
agem
entofrad
ioactivewaste;
Percen
tofpeo
plewithaccesstowaste
man
agem
entservicesin
urban
and
ruralareas
envi
ron
men
tAl
mAn
Agem
ent
Improved
legislationon
land
and
natural
resourceutiliz
ation;
land
are
a us
ed f
or n
r m
anag
emen
t th
at is
subjecttoten
uresecurity;
Establishm
entoffun
ctioningcon
stitue
ncies
and
dist
rict
env
iron
men
t co
mm
itte
es
mAr
ine
envi
ron
men
tAr
ea o
f m
arin
e/aq
uati
c re
serv
es c
reat
ed a
nd
prop
erlym
anaged
tosustain
prod
uction
;Area
offishingm
oratoriums
operationa
l
eco
syst
ems
Area
ofecosystemsad
dressed
byarea-ba
sedconservation
programmes,disaggregated
byecosystem
typ
e(i.e.
drylan
d,highforests,
man
groves,wetland
s)
wAs
te g
ener
Atio
n A
nd
m
AnAg
emen
tPr
esen
ce o
f st
anda
rds
and
guid
elin
es f
or in
dust
rial
waste;
Mun
icipaland
solidwaste
man
agem
entplan
s;Existenceofdatab
ase
andmon
itoringplan
for
hazardou
swastes;
Num
berofope
ration
al
programmestomon
itor
indu
strialefflue
ntsan
dagriculturalche
micals;
LocalG
overnm
entbu
dgets
set
asid
e fo
r w
aste
man
agem
ent;

56
Ministry of state for Planning, National development & Vision 2030
VISION2030
Pill
Ar/s
ecto
rm
AJo
r d
evel
oPm
ent
issu
esn
Atio
nAl
-lev
el o
utc
om
e in
dic
Ato
rssu
b-n
Atio
nAl
ou
tPu
t le
vel
ind
icAt
ors
mAi
nst
reAm
ing
en
viro
nm
ent
Acro
ss P
er
ANDBUDGET
S:Num
berofdistrictstha
tusemainstrea
ming
guidelines;
Num
berofMinistriesan
dDistrictsestab
lishing
effectiveen
vironm
entalu
nits;
Percen
tofdistrictswithlegala
ndregulatory
fram
eworkforpo
llution
con
trol;
Prop
ortion
ofEIAs/SEA
swhichNEM
Ajudg
es
tohavesuccessfullyresultedinavoided
or
mitigated
negativeim
pacts;
Prop
ortion
ofen
vironm
entala
udits
resultinginsuccessfully
implem
ented
recommen
dation
s;Pe
rcen
t of
dis
tric
ts w
hich
hav
e fo
rmul
ated
an
dareim
plem
entinganti-erosionregulation
san
dby
elaw
s
Perc
ent
of lo
cal g
over
nmen
ts
withby
elaw
sorordinan
ces
onsolidwastem
anagem
ent;
Num
berofpub
licwaste
man
agem
entsensitization
mee
tingshe
ldin
urban
areas;
Num
berofpub
lic-private
partne
rshipsin
solidwaste
man
agem
ent
init
iate
d an
d op
erationa
l;Pr
esen
ce o
f a
func
tion
al
Clea
nerProd
uction
Cen
tre;
trai
ning
s he
ld o
n cl
eane
r prod
uction
red
uct
ion
of
bio
div
ersi
ty
LOSS:
redu
ctio
n in
loss
of,
or
disapp
earanceof,pa
rticular
tree
spe
cies;
redu
ced
rate
of
loss
of
indicatorspecies(plants,
anim
als,fish);
incr
ease
d ar
ea o
f fo
rest
biod
iversityund
ereffective
man
agem
ent;
Num
berofin
dicatoran
imal
speciesinparticularha
bitats;
Distributionofin
dicator
species
sPec
ies
Num
berofbiodiversity
inventorieshe
ld;

P-E INdIcaTORs REPORT
57
VISION2030
Pill
Ar/s
ecto
rm
AJo
r d
evel
oPm
ent
issu
esn
Atio
nAl
-lev
el o
utc
om
e in
dic
Ato
rssu
b-n
Atio
nAl
ou
tPu
t le
vel
ind
icAt
ors
Num
berofbiodiversity
awar
enes
s an
d co
nser
vati
on
trainingshe
ld;
Prop
ortion
oftree
nurseries
stoc
ked
wit
h th
reat
ened
tre
e speciespe
rdistrict
AwAr
enes
s o
n
envi
ron
men
tAl
MAN
AGEM
ENT:
Num
berofcam
paigns/
publications/
adve
rtis
emen
ts/
mee
ting
s re
late
d to
env
iron
men
tal
Man
agem
entAu
thority
(NEM
A)peryea
r;Num
beroftrainingsin
commun
ityba
sedna
tural
resourcesman
agem
ent;
Num
beroffarmersan
dliv
estockkee
perstrained
on
envi
ronm
enta
l con
serv
atio
n (includingaccessto
approp
riateextension
packages);
Prop
ortion
ofbu
dgetusedfor
publicawaren
esson
poverty-
envi
ronm
ent
issu
es a
t di
stri
ct
leve
l
envi
ron
men
tAl
mAn
Agem
ent
Num
berofenviron
men
tal
man
agem
entsystem
s

58
Ministry of state for Planning, National development & Vision 2030
VISION2030
Pill
Ar/s
ecto
rm
AJo
r d
evel
oPm
ent
issu
esn
Atio
nAl
-lev
el o
utc
om
e in
dic
Ato
rssu
b-n
Atio
nAl
ou
tPu
t le
vel
ind
icAt
ors
establishe
dan
dim
plem
ented
atsectoran
ddistrictle
vels;
Num
berofenviron
men
tal
heal
th e
duca
tion
act
ivit
ies
held
Thepe
rcen
tofpolicies/
strategies/programmesand
projectssub
jecttoan
EIA/
SEA;
Thenu
mbe
rofprope
rty
tran
sfers(e.g.privatizations)
subjecttoenviron
men
tal
audi
ts
PoPu
lAti
on
, u
rbAn
iZAt
ion
An
d
ho
usi
ng
VISION:An
ad
equa
te a
nd
decentlyhou
sed
nati
on
ISSU
ESFOR2030:
inad
equa
tecap
acity
forurba
nan
dregion
alplann
ing,
insufficien
tserviced
la
nd,
conc
entr
atio
n ofprope
rty
developm
entin
the
high
inco
me
category,legal
and
adm
inis
trat
ive
reform
s,sup
plyof
affordab
lefina
nce
Hou
sing(stockan
dqu
ality)
PoPu
lAti
on
Popu
lation
growthrate;
Dep
ende
ncyratio;
Contraceptiveprevalen
cerate;
Unm
etnee
dforfamily
plann
ing
ho
usi
ng
Percen
tofpeo
pleliv
inginsub
stan
dard
hous
ing

P-E INdIcaTORs REPORT
59
VISION2030
Pill
Ar/s
ecto
rm
AJo
r d
evel
oPm
ent
issu
esn
Atio
nAl
-lev
el o
utc
om
e in
dic
Ato
rssu
b-n
Atio
nAl
ou
tPu
t le
vel
ind
icAt
ors
for
mor
tgag
es
andprop
erty
developm
ent,
lack
of
adeq
uate
co
nstr
ucti
on
capa
city
gen
der
, vu
lner
Able
g
rou
Ps A
nd
yo
uth
VISION:Men
and
wom
enenjoying
ahighqua
lityof
life
and
equa
l op
portun
ities;
improved
liv
elih
oods
of
vulnerab
lepersons
at h
ouse
hold
, commun
ityan
dna
tion
alle
vels;
arespon
sible,
glob
ally
compe
titiveand
prospe
rousyou
th
ISSU
ESFOR2030:
Addr
ess
gend
er
disparities
Sexualand
gen
der-ba
sedviolen
ce;
Gen
dereq
uityin
participa
tion
,po
wer,resource
distribu
tion
and
socioecon
omicopp
ortunities
live
lihoo
ds a
nd a
cces
s to
ess
enti
al s
ervi
ces
of a
ll vulnerab
legroup
se.g.in
ternallydisplaced
persons,
disabled
;Ch
ildprotection;
Fully
develop
the
you
thpoten
tialtoen
gagein
socioe
cono
micdevelop
men
t
Shareofwom
enin
wageem
ploymen
tinthe
no
n-agriculturalsector;
Vulnerab
leemploymen
t,bysex
Perc
ent
of r
ural
land
tha
t is
reg
iste
red/
titled
;Pe
rcen
t of
fem
ale
and
child
-hea
ded
househ
oldswho
sela
ndistitled;
Percen
tofla
nd-related
dispu
tessuccessfully
resolved
;Pe
rcen
t of
rur
al h
ouse
hold
s ac
cess
ing
cred
it
from
fina
ncialinstitution
susingland
as
colla
tera
l
Securela
ndtitle:
Num
berofla
ndtitlesan
dlic
ensesissued
byMinistryof
Land
s;Pe
rcen
tage
of
land
tit
les
issued
tothepo
orand
vulnerab
le;
Perc
enta
ge o
f la
nd t
itle
s giventofarmers;
Percen
tageoftitlesprovide
dtowom
enfarmers;
Utiliz
ationan
drecognition
ofsuchtitlesassecurityfor
loan
san
dothe
rde
velopm
ent
init
iati
ves
soci
Al e
Qu
ity
And
Po
vert
y re
du
ctio
n
Equa
lsocioecon
omicopp
ortunitiesand
poverty
redu
ctio
nPo
vert
yProp
ortion
ofpo
pulation
livingbelow
nationa
lpo
verty
Prop
ortion
ofpo
pulation
below
$1ada
y;
Pove
rty
Mea
nda
ilycaloricavaila
bility
athou
seho
ldle
vel;

60
Ministry of state for Planning, National development & Vision 2030
VISION2030
Pill
Ar/s
ecto
rm
AJo
r d
evel
oPm
ent
issu
esn
Atio
nAl
-lev
el o
utc
om
e in
dic
Ato
rssu
b-n
Atio
nAl
ou
tPu
t le
vel
ind
icAt
ors
Percen
tmea
nda
ilycaloricavaila
bility/in
take
pe
rpe
rson
;
ineQ
uAl
ity
rati
o of
sha
re in
nat
iona
l inc
ome
or
consum
ptionofhighe
sttolowestqu
intile
dri
nki
ng
wAt
erProp
ortion
ofpo
pulation
usinganim
proved
w
ater
sou
rce
Acce
ss t
o e
ner
gy
Shareofhou
seho
ldswitho
utelectricityor
othe
rmod
ernen
ergyservices;
Percen
tageofpo
pulation
usingsolidfue
lsfor
cook
ing
livi
ng
co
nd
itio
ns
Prop
ortion
ofurba
npo
pulation
livingin
slums;
Thepe
rcen
tageofho
useh
oldincomeinrural
area
sde
rivedfrom
the
sustainab
leprocessing
andmarke
tingofna
turalresou
rceprod
ucts;
Thepe
rcen
tageofho
useh
oldincomeinrural
area
sde
rivedfrom
non
-NRba
sedactivities;
Thepe
rcen
tageofruralincom
ede
rivedfrom
activitiesrelated
towild
life(con
servation,
tourism),forestry(harvestingforestryprodu
cts
forconsum
ptionan
dtrad
e)and
fisheries;
Num
berofbiodiversity-ba
seden
terprises
man
aged
byoremployingthepo
or
nu
trit
ion
Al s
tAtu
s o
f ch
ild
ren
Percen
tofund
er-fiv
eswho
areund
erweight;
Percen
tofruralchildrenun
der5yearswho
ar
e st
unte
d
Percen
tofpoo
rho
useh
olds
consum
ing<80%ofcaloric
requ
irem
ent(or<2mea
lsa
day);
Perc
ent
of h
ealt
hcar
e fa
cilit
ies
wit
h fe
edin
g programforsickan
dm
alno
uris
hed
child
ren
at
healthcen
ters;
Num
berofschoo
lswitha
regularfeed
ingprogram
livi
ng
co
nd
itio
ns
Num
berofestab
lishe
dne
w
marke
tsforlo
cally
produ
ced
woo
dan
dno
n-woo
dprod
ucts
(i.e.ho
ney,gum
s,resins,
etc)withinan
dou
tsidethe
coun
try;
Theprop
ortion
ofincome
from
rel
evan
t se
ctor
-ba
sedactivitytha
tisset
asidean
drealized
byrural
commun
ities;
reve
nue
gene
rate
d fr
om
sustaina
blean
dpa
rticipatory
utilization
bylocal
com
mun
itie
s of
nat
ural
re
sour
ces

P-E INdIcaTORs REPORT
61
VISION2030
Pill
Ar/s
ecto
rm
AJo
r d
evel
oPm
ent
issu
esn
Atio
nAl
-lev
el o
utc
om
e in
dic
Ato
rssu
b-n
Atio
nAl
ou
tPu
t le
vel
ind
icAt
ors
Poli
ticA
l Pi
llAr
rule
of
lAw
VISION:Ad
herence
to t
he r
ule
of la
w
applicab
letoa
mod
ern,
mar
ket-
basedecon
omy
in a
hum
an-r
ight
s respectingstate
Inad
equa
cyofthecurren
tconstitution
;Inad
equa
teand
outda
tedpo
licies,la
wsan
dre
gula
tion
s in
reg
ards
to
gove
rnan
ce,
hum
an r
ight
s,
justicean
dwiderruleofla
w;
Inad
equa
tecom
mitmen
tofpatriotism,na
tion
al
valuesand
normsthatuph
oldgood
governa
nce;
Ineffectivejusticean
ddisputeresolution
mecha
nism
s;Lowpub
liccon
fiden
cein
governa
ncean
druleoflaw
institutions;
inad
equa
te r
egar
d fo
r th
e so
cial
and
hum
an
dimen
sion
sofgoverna
nce,justice,lawand
order;
Highlyun
der-capa
citatedorund
er-m
otivated
institutions;
Wea
kinteragencycoop
erationan
dcross-agen
cy
colla
boration
amon
ggovernan
ceand
ruleofla
w
inst
itut
ions
Percen
tageofpo
pulation
havingpa
idbribe
s;Num
berofin
tentiona
lhom
icidesper100,000
popu
lation
Securela
ndtitle:
Num
berofla
ndtitlesan
dlic
ensesissued
byMinistryof
Land
s;Pe
rcen
tage
of
land
tit
les
issued
tothepo
orand
vulnerab
le;
Perc
enta
ge o
f la
nd t
itle
s giventofarmers;
Percen
tageoftitlesprovide
dtowom
enfarmers;
Utiliz
ationan
drecognition
ofsuchtitlesassecurityfor
loan
san
dothe
rde
velopm
ent
init
iati
ves
dec
entr
AliZ
Atio
n
VISION:A
democraticprocess
ofdecen
tralization
of d
ecis
ion-
mak
ing
and
reso
urce
m
anag
emen
t
Theba
siclegala
ndpolicyfram
ework;
Thepo
liticaland
adm
inistrativefram
ework;
Locala
utho
rityfina
ncing;
Locala
utho
rityhum
anresou
rce;
Coordina
tingthe
decen
tralizationprocess
Pove
rty
Prop
ortion
ofpo
pulation
livingbelow
nationa
lpo
verty
Prop
ortion
ofpo
pulation
below
$1ada
y;
Qu
Alit
y o
f Pu
blic
EX
PENDITURE
:Num
berofdistrictswith
clea
nau
ditcertificates;
Num
beroflo
calg
overnm
ent
authoritiesthatpub
lishtheir
incomean
dexpe
nditure
repo
rts;
Rateofpu
blicparticipa
tion
inthe
develop
men
tplan
ning
processes
ROUTINEDATACO
LLEC
TION:
Num
berofm
onitoring
sche
mes
whi
ch c
olle
ct
poverty/en
vironm
entald
ata;

62
Ministry of state for Planning, National development & Vision 2030
VISION2030
Pill
Ar/s
ecto
rm
AJo
r d
evel
oPm
ent
issu
esn
Atio
nAl
-lev
el o
utc
om
e in
dic
Ato
rssu
b-n
Atio
nAl
ou
tPu
t le
vel
ind
icAt
ors
Percen
tageoffunction
ingM&E
inthe
Ministry,Dep
artm
ent,
Agen
cy(MDAs)an
ddistricts;
Perc
enta
ge o
f se
ctor
s th
at
have
incl
uded
env
iron
men
t in
M&Esystem
s;Num
berofpoverty-
envi
ronm
ent
rela
ted
case
s involvingthepo
orand
the
vulnerab
lecon
clud
edin
thecourtsystem
and
inthe
commun
ityreconciliation
committees;
Num
berofawaren
essraising
worksho
pon
EMAforjudg
es
andmagistrates;
Num
beroftitledee
ds
allocatedtothe
poo
ran
dvulnerab
le;
func
tion
ing
mec
hani
sms
to
empo
werthe
poo
ran
dthe
vulnerab
letoun
derstand
an
d ex
erci
se t
heir
rig
hts
over
la
nd a
nd o
ther
res
ourc
es
establishe
d;fu
ncti
onin
g m
echa
nism
for
inclusionofvulne
rablegrou
ps
establishe
datdistrictlevel;
Affirmativeaction
program
mes
forvulnerab
legroup
sestablishe
datalllevels;
Num
berofawaren
essraising
campa
ignsonsocialtoleran
ce
cond
uctedpe
ryear;
Num
berofenviron
men
tal
bye-lawspa
ssed
bylocal
gove
rnm
ent
auth
orit
ies

P-E INdIcaTORs REPORT
63
VISION2030
Pill
Ar/s
ecto
rm
AJo
r d
evel
oPm
ent
issu
esn
Atio
nAl
-lev
el o
utc
om
e in
dic
Ato
rssu
b-n
Atio
nAl
ou
tPu
t le
vel
ind
icAt
ors
elec
torA
l An
d P
oli
ticA
l Pr
oce
sses
VISION:Gen
uine
ly
compe
titiveand
issue-ba
sedpo
litics
Lawsan
dregulation
sforpo
liticalparties;
Enha
ncingthelegala
ndregulatoryfram
ework
coveringthe
electoralprocess;
Civiced
ucation;
Prom
otio
n of
incl
usio
n of
wom
en a
nd d
isad
vant
aged
grou
psin
electoraland
politicalprocesses;
Enrichingthequ
alityofparlia
men
tarydeb
atesby
providingrelevantin
form
ationon
propo
sedlaws
andpo
licies
dem
ocr
Acy
And
Pu
blic
PA
rtic
iPAt
ion
VISION:Ape
ople-
cent
ered
and
po
liticallyengaged
op
ensociety
Constitution
aland
legalreformsne
cessaryto
devolvepo
werand
sup
portlo
calg
overna
nce;
enco
urag
ing
form
al a
nd in
form
al c
ivic
edu
cati
on
andaction
program
s;Prom
otingop
enengagem
entbe
twee
ngovernmen
tan
dcivilsociety,aswella
sthefree
flow
of
info
rmat
ion
EquitableaccesstoNR:
Thepo
orhaveeq
uitablestatusin
decision-
makingab
outuseofNRatcon
stitue
ncyan
ddistrictle
vel;
Num
berofope
ration
alworke
r’sun
ionsat
workp
laces;
Mecha
nism
sforpa
rticipatoryde
cision
-making
establishe
dan
dfunction
ingatalllevels;
func
tion
ing
lega
l mec
hani
sms
deal
ing
wit
h po
verty-en
vironm
entissuesestab
lishe
datall
levelsin
line
withEM
CA;
Num
berofawaren
ess-raisingcampa
ignstha
tinform
poo
ran
dvulnerab
legroup
softhe
ir
rights;
Prop
ortion
ofpo
orand
vulne
rableho
useh
olds
withlegally
-enshrined
land
titles;
Function
ingmecha
nism
stoempo
werthe
poo
ran
dthevulnerab
le,espe
ciallywom
en,to
unde
rsta
nd a
nd e
xerc
ise
thei
r ri
ghts
ove
r la
nd
andothe
rresourcesareestablishe
d;An
nualfue
l-woo
dconsum
ptionasa
prop
ortion
oftotalstand
ingvolume
villa
ge e
nvir
onm
ent
committees:
Perc
enta
ge o
f w
omen
an
dvulnerab
legroup
srepresen
tedindistrict
or v
illag
e en
viro
nmen
t co
mm
itte
es

64
Ministry of state for Planning, National development & Vision 2030
VISION2030
Pill
Ar/s
ecto
rm
AJo
r d
evel
oPm
ent
issu
esn
Atio
nAl
-lev
el o
utc
om
e in
dic
Ato
rssu
b-n
Atio
nAl
ou
tPu
t le
vel
ind
icAt
ors
elec
torA
l An
d P
oli
ticA
l Pr
oce
sses
VISION:Gen
uine
ly
compe
titiveand
issue-ba
sedpo
litics
stre
ngth
enin
g le
gal f
ram
ewor
k fo
r et
hics
and
integrity;
Prom
otingresults-ba
sedman
agem
entwithinthe
publicservice;
Encouragingpu
blicaccesstoin
form
ationan
dda
ta;
Introd
ucingcivilia
noversightarou
ndthe
keyle
gal,
justicean
dsecurityin
stitutions;
Strengthen
ingpa
rliamen
t’slegislativeoversight
capa
city
Publ
ic
Adm
inis
trAt
ion
An
d s
ervi
ce
del
iver
y
VISION:Po
licy-
driv
en a
nd s
ervi
ce-
focu
sed
gove
rnm
ent
inst
itut
ions
Strengthen
ingrulesan
dprocessesarou
ndthe
policy
cycle;
Dee
peningthe
useofcitizenan
dservicechartersas
accoun
tabilitytools;
Strengthen
ingecon
omicgoverna
nceforbe
tter
macroecon
omicm
anagem
ent;
Inculcatingape
rforman
ceculturein
the
pub
lic
serv
ice
secu
rity
, Pe
Ace
buil
din
g
And
co
nfl
ict
mAn
Agem
ent
VISION:Security
ofallpe
rson
san
dprop
ertythrou
ghou
ttherepu
blic
Prom
otingpu
blic-privatecoo
peration
and
civilian
/commun
ityinvolvem
entforim
proved
safetyan
dsecurity;
Dee
peningpolicy,le
gala
ndin
stitutiona
lreformsfor
improved
enforcemen
tofla
wand
order;
Prom
otingprocessesforna
tion
aland
inter-
commun
itydialogue
inordertobu
ildharmon
yam
ongethn
ic,racialand
otherin
terestgroup
s;Prom
otingpe
acebu
ildingan
dreconciliationto
improveconfl
ictman
agem
entan
den
suresustained
pe
acewithinthecoun
try;
Inculcatingthecultureofrespe
ctforthe
san
ctity
ofhum
anlifetha
trestrainspe
oplefromresorting
toviolenceasam
eanstoresolvingpe
rson
aland
commun
itydisputes

P-E INdIcaTORs REPORT
65
Adams,William.M.,RosAveling,DanBrockington,BarneyDickson,JoElliott,JonHutton,Dilys Roe, Bhaskar Vira,WilliamWolmer, Biodiversity Conservation and the Eradication ofPoverty,Science,Vol.306,12November2004
Atack, Iain,FourCriteriaofDevelopmentNGOLegitimacy,World Development27(5),May1999
Baumann,Pari,Improvingaccesstonaturalresourcesfortheruralpoor:Acriticalanalysisofcentralconceptsandemergingtrendsfromasustainablelivelihoodsperspective,LSPWorkingPaper1,AccesstoNaturalResourcesSub-Programme,FoodandAgricultureOrganizationoftheUnitedNations,July2002
causton, david r., A Biologist’s Basic Mathematics,EdwardArnoldPress,London,1983
Comim,Flavio,PovertyandEnvironment Indicators,prepared forUNDP-UNEPPovertyandEnvironmentInitiative,March2008
Daily,G.C.(ed.),Nature’sServices:Societal dependence on natural ecosystems, island Press, Washington,DC,1997
Dalal-Clayton,BarryandSteveBass,AReviewofMonitoringMechanismsforNationalSustainableDevelopmentStrategies,A reportprepared for theOrganisation forEconomicCooperationand Development, Paris, International Institute for Environment and Development (IIED),EnvironmentalPlanningIssuesNo.27,July2006
DepartmentforInternationalDevelopment(DfID),Achievingsustainability:povertyeliminationandtheenvironment,Strategiesforachievingtheinternationaldevelopmenttargets,October2000
DfID,Poverty-EnvironmentLinkages:developingandassessingtheuseofindicators,DfIDDraftReportwrittenbyF.Nunan,U.GrantandA.Shephard,London,2001
Department for International Development, Contribution of the environment and naturalresourcestopro-poorgrowth:achecklistexaminingtheseissueswithinapovertyreductionstrategy,October2004
Duraiappah,A.K.,PovertyandEcosystems:AConceptualFramework,UNEPDivisionofPolicyandLawPaper,UnitedNationsEnvironmentProgramme,Nairobi,2002
Food and Agriculture Organization, Forestry Department, Forestry Policy and InstitutionsService,LinkingNationalForestProgrammesandPovertyReductionStrategies:Kenya,ScottGeller,RosalieMcConnell,JohnWanyiri,November2007
HeinrichBöllFoundationRegionalOffice,EastandHornofAfrica,ProtectorsofEnvironment:MappingandProfilingEnvironmentalOrganisationsinKenya,Nairobi,2006
references

66
Ministry of state for Planning, National development & Vision 2030
Irwin,FrancesandJanetRanganathan,RestoringNature’sCapital:AnActionAgendatoSustainEcosystemServices,WorldResourcesInstitute,Washington,DC,2007
JICA,TheStudyofSolidWasteManagementinNairobiCity,1998
JICA,CountryProfileonEnvironment–Kenya,February2002
Kenya,MinistryofPlanningandNationalDevelopment,Annual Progress Report 2003/2004: Investment Programme for the Economic Recovery Strategy for Wealth and Employment Creation 2003-2007,July2005
Kenya,MinistryofPlanningandNationalDevelopment,Economic Recovery Strategy: Annual Progress report 2004-2005,MonitoringandEvaluationDirectorate,August2006
Kenya, Ministry of Planning and National Development, Implementation of the NationalIntegrated Monitoring and Evaluation System: Methodological and Operational Guidelines,July2006
Kenya,DraftfinalstrategicplanfortheMinistryofEnvironmentandNaturalsResources2006-2010
Kenya,MinistryofPlanningandNationalDevelopment,Basic Report of Fourth Participatory Poverty Assessment, December 2007
Kenya, Ministry of Environment and Mineral Resources, Provincial consultative meetingsconsolidatedreport,preparedbyProfessionalTrainingConsultants(PTC),7May2008
Kenya,Kenya Vision 2030: A Globally Competitive and Prosperous Kenya,2008
Kenya,First Medium Term Plan 2008-2012 of Kenya Vision 2030,2008
Kenya,Ministry of State for Planning, National Development and Vision 2030, Handbook of National Reporting Indicators, 2009
mcgraw-hill, McGraw-Hill Dictionary of Environmental Science,NewYork,2003
Mukui,JohnT.,Mid-TermReviewoftheProjecton“MainstreamingMDGsinKenya’sDevelopmentProcess”, Report prepared for theMinistry of Planning andNational Development,UnitedNationsDevelopmentProgramme,andtheEmbassyofFinland,June2008
Mukui, JohnT.,Mid-TermReviewof thePoverty andEnvironment Initiative-Kenya,Reportprepared for the United Nations Development Programme and the Ministry of Planning,NationalDevelopmentandVision2030,October2008
Narayan,D.,withR.Patel,K.Schafft,A.Rademacher,andS.Koch-Schulte,Voices of the Poor: Can Anyone Hear Us?WorldBank,Washington,DC,2000
National Environment Management Authority (Kenya), National Environment Action PlanFramework,December2008

P-E INdIcaTORs REPORT
67
Pattanayak,SubhrenduK.andJunkoYasuoka,Deforestationandmalaria:Revisitingthehumanecologyperspective,InCJPColfer(ed.),People,Health,andForests:AGlobalInterdisciplinaryOverview,Earthscan,2008Patz,JonathanA.,UlissesE.C.Confalonieri,Chapter14:HumanHealth:EcosystemRegulationofInfectiousDiseases,InRashidHassan,RobertScholes,NevilleAsh(eds.),EcosystemsandHumanWell-being:CurrentStateandTrends,Volume1,FindingsoftheConditionandTrendsWorkingGroupoftheMillenniumEcosystemAssessment,Washington,IslandPress,2005
Pintér,László,PeterHardiandPeterBartelmus,SustainableDevelopmentIndicators:ProposalsforaWayForward,PreparedfortheUnitedNationsDivisionforSustainableDevelopment(UN-DSD),December2005
Poverty-EnvironmentPartnership,AssessingEnvironment’sContributiontoPovertyReduction,preparedbyUNDP,UNEP,IIED,IUCNandWRI,onbehalfofthePoverty-EnvironmentPartnership,2005
Ranganathan, Janet, Ciara Raudsepp-Hearne, Nicolas Lucas, Frances Irwin,Monika Zurek,KarenBennett,NevilleAsh,PaulWest,EcosystemServices:AGuideforDecisionMakers,WorldResourcesInstitute,2008
Reed,David,AnalyzingthePoliticalEconomyofPovertyandEcologicalDisruption,EconomicChange, Poverty, and the Environment Project, WWF’s Macroeconomics for SustainableDevelopmentProgramOffice,May2004
Reed,DavidandPradeepTharakan,DevelopingandApplyingPovertyEnvironmentIndicators,WWF’sMacroeconomicsforSustainableDevelopmentProgramOffice,October2004
Reid,HannahandKrystynaSwiderska,Biodiversity,climatechangeandpoverty:exploringthelinks,AnIIEDBriefing,InternationalInstituteforEnvironmentandDevelopment(IIED),Feb2008
Roe,DilysandJoannaElliott,Povertyreductionandbiodiversityconservation:rebuildingthebridges,InternationalInstituteforEnvironmentandDevelopment,London,OryxVol.38No2,April2004
Ross,Michael,“HowdoNaturalResourcesinfluenceCivilWar:Evidencefromthirteencases”,International Organization,58(1),March2004
Stewart,S.,Happyeverafterinthemarketplace:Nongovernmentorganizationsanduncivilsociety, Review of African Political Economy24(71),11-34,1997
Swiderska, Krystyna, Mainstreaming biodiversity in development policy and planning: AreviewofcountryExperience,BiodiversityandLivelihoodsGroup,InternationalInstituteforEnvironmentandDevelopment,September2002
UnitedNations,Agenda21,ProgrammeofActionforSustainableDevelopment,adoptedattheUnitedNationsConferenceonEnvironmentandDevelopment,RiodeJaneiro,Brazil,1992
united nations, Indicators of Sustainable Development Framework and Methodologies, new York,August1996

68
Ministry of state for Planning, National development & Vision 2030
United Nations, Commission on Sustainable Development, Indicators of Sustainable Development: Guidelines and Methodologies,SecondEdition,September2001UnitedNationsDevelopmentProgramme,WorldBank,EuropeanCommission,DepartmentforInternationalDevelopment(DfID), Linking Poverty Reduction and Environmental Management: Policy Challenges and Opportunities,July2002
United Nations Environment Programme and the International Institute for SustainableDevelopment,ExploringtheLinks:HumanWell-Being,Poverty&EcosystemServices,2004
UnitedNationsEnvironmentProgramme(UNEP)andtheInternationalInstituteforSustainableDevelopment (IISD), Connecting poverty & ecosystem services, A series of seven countryscopingstudies:FocusonKenya,2005
united nations, economic and social Affairs, Indicators of Sustainable Development: Guidelines and Methodologies,ThirdEdition,October2007
UnitedNationsEnvironmentProgramme(UNEP),Kenya: Atlas of our Changing Environment, DivisionofEarlyWarningandAssessment(DEWA),UNEP,2009
Vermeulen,Sonja,Biodiversityplanning:Whyandhowshouldlocalopinionsmatter?GatekeeperSeriesNo.115,InternationalInstituteforEnvironmentandDevelopment,NaturalResourcesGroupandSustainableAgricultureandRuralLivelihoodsProgramme,2004
world bank, Putting Our Commitments to Work, an Environment Strategy Implementation Progress Report,Washington,D.C.,May2003
WWFEasternAfricaRegionalProgrammeOfficeandGeorgeKut,Voicesfromthefield:Bondo,Murang’aandMeruSouthdistricts,preparedbytheonbehalfofthePovertyandEnvironmentInitiative-Kenya,August2006

UNEP
For more information contact,The Project Manager
Poverty and Environment Initiative - KenyaMinistry of State for Planning , National Development and Vision 2030
Bruce House, 8th Floor, Standard Street,P.O. Box 30005-00100, Nairobi, Kenya
Tel: +254-20-342399/342406, Cell: +254-714-606038Email: [email protected]
About PEI:
PEI is a global UN-led programme to support country level efforts to mainstream poverty-environment linkages into national planning and implementation processes . PEI does this by providing technical and financial assistance as well as delivering capacity development programmes to governments and other stakeholders at the country level. The ultimate objective is to integrate the valuable contribution of good environmental management to improved livelihoods, increased economic security and income opportunities for the poor. PEI Kenya started in 2005 and has since worked with the Government of Kenya to improve the understanding of stakeholders of P-E linkages, has conducted a preliminary economic assessment of the contribution of environment and natural resources to Kenya’s economic growth, has build the capacity of the government in delivering pro-poor environment policy and has strengthened the participation of key environment stakeholders in policy-making and planning processes through relevant trainings. PEI has also facilitated the development of tools for integration of environment into development plans and budget processes. The current phase of PEI-Kenya runs from 2011 through 2013 covering the remaining period of the Country Programme Action Plan between the Government of Kenya and UNDP.