poverty, hunger, and agriculture in sub-saharan africa · poverty, hunger, and agriculture in...
TRANSCRIPT
Poverty, Hunger, and Agriculture
in Sub-Saharan Africa
Opportunities and Challenges
by: Prabhu Pingali, Kostas Stamoulis, and Gustavo Anríquez
WDR 2008: What it means.
World Bank after 25 years looks again at agriculture in its flagship publication.
It reflects the “change of heart” by a major funding institution which will hopefully be translated in much greater funding for agriculture and rural poverty than in the past
It contributes to the increased awareness of the problems facing agriculture and rural poverty today and in the future.
It constitutes a powerful advocacy tool for the funding of agricultural and rural development projects.
It opens the debate on agriculture, rural development, and poverty reduction.
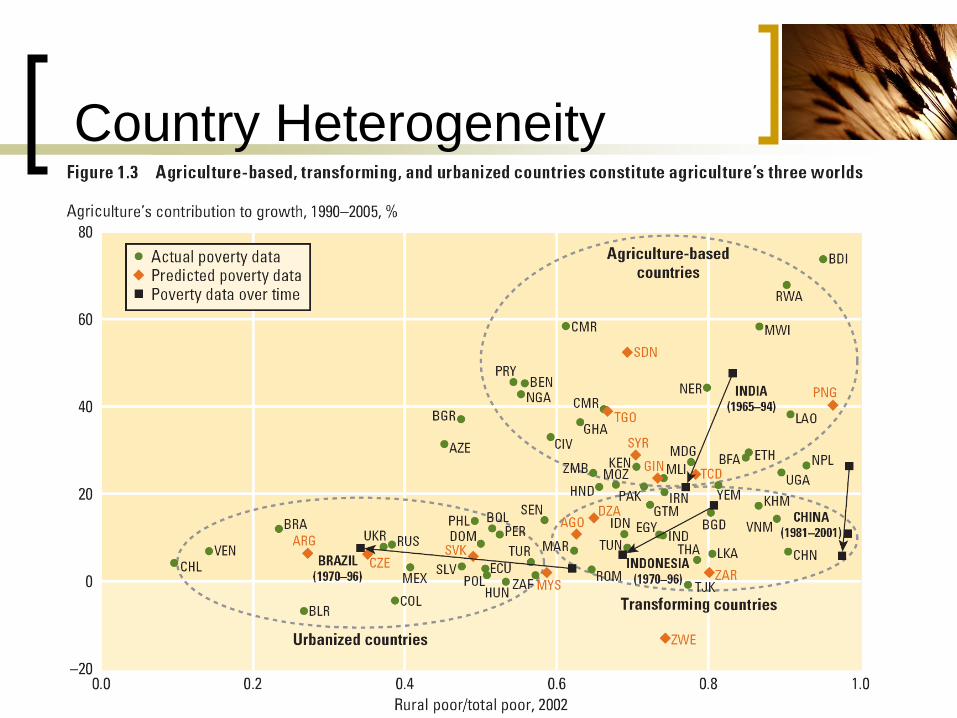
Country Heterogeneity
Africa...Still Agricultural and
Rural
Still today agricultural value added accounts
on average for ¼ of national GDP in Sub-
Saharan Africa (SSA); and the sector
employs 56% of the labor force.
More than 65% of the population is rural.
Poverty is predominantly rural, both in raw
population numbers, as well as in the
relative poverty rate.
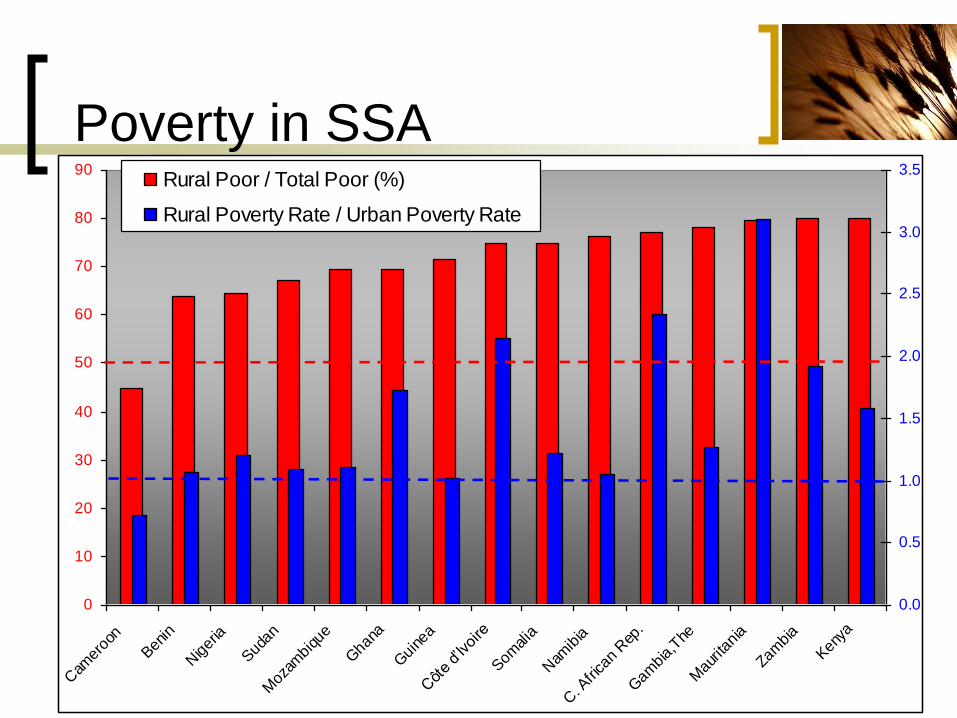
Poverty in SSA
0
10
20
30
40
50
60
70
80
90
Cam
eroo
n
Ben
in
Niger
ia
Sud
an
Moz
ambi
que
Gha
na
Gui
nea
Côt
e d’Ivoi
re
Som
alia
Nam
ibia
C. A
frica
n Rep
.
Gam
bia,
The
Mau
ritan
ia
Zam
bia
Ken
ya
0.0
0.5
1.0
1.5
2.0
2.5
3.0
3.5Rural Poor / Total Poor (%)
Rural Poverty Rate / Urban Poverty Rate

Widespread Hunger in SSA
Countries with High Prevalence of Undernourishment (> 35%)
0 10 20 30 40 50 60 70 80
Zimbabw e
Zambia
Yemen
Tanzania, United Rep of
Tajikistan
Sierra Leone
Rw anda
Mozambique
Madagascar
Liberia
Korea, Dem People's Rep.
Haiti
Guinea-Bissau
Ethiopia
Eritrea
Congo, Dem. Republic of
Comoros
Central African Republic
Burundi
Angola
Prevalence of
undernourishment in
total population (%)
Source: FAO
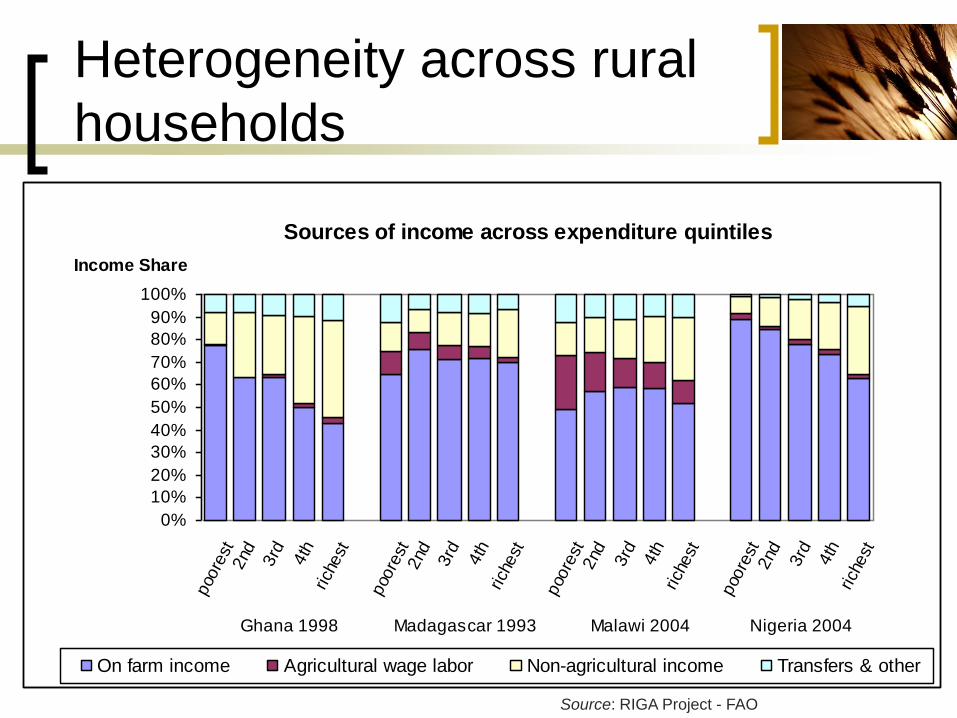
Heterogeneity across rural
households
Sources of income across expenditure quintiles
0%
10%
20%
30%
40%
50%
60%
70%
80%
90%
100%
poo
rest
2nd 3rd 4th
rich
est
poo
rest
2nd 3rd 4th
rich
est
poo
rest
2nd 3rd 4th
rich
est
poo
rest
2nd 3rd 4th
rich
est
Ghana 1998 Madagascar 1993 Malawi 2004 Nigeria 2004
Income Share
On farm income Agricultural wage labor Non-agricultural income Transfers & other
Source: RIGA Project - FAO
There is progress...
The share of undernourished people in the
region’s population fell from 35% (1990/92
MDG base) to 32% (2001/03), after reaching
36% in the mid nineties.
Countries like Ghana and probably Gabon
have already met MDG goal on
undernourishment.
Most success stories correlated with
agricultural production growth.
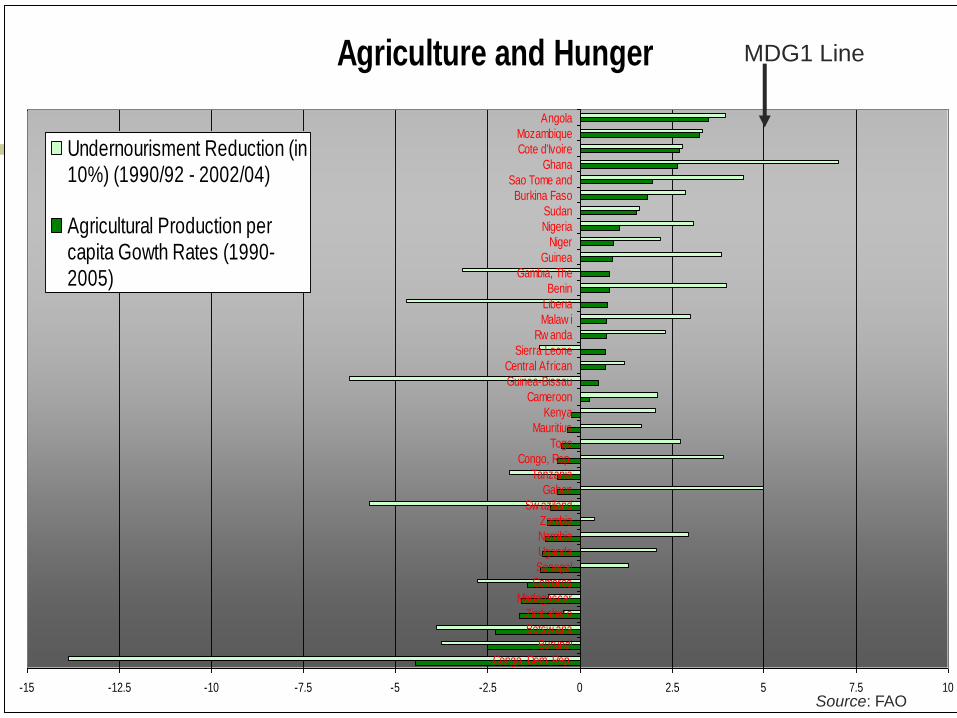
Agriculture and Hunger
-15 -12.5 -10 -7.5 -5 -2.5 0 2.5 5 7.5 10
Congo, Dem. Rep.
Burundi
Botsw ana
Zimbabw e
Madagascar
Comoros
Senegal
Uganda
Namibia
Zambia
Sw aziland
Gabon
Tanzania
Congo, Rep.
Togo
Mauritius
Kenya
Cameroon
Guinea-Bissau
Central African
Sierra Leone
Rw anda
Malaw i
Liberia
Benin
Gambia, The
Guinea
Niger
Nigeria
Sudan
Burkina Faso
Sao Tome and
Ghana
Cote d'Ivoire
Mozambique
Angola
Undernourisment Reduction (in10%) (1990/92 - 2002/04)
Agricultural Production percapita Gowth Rates (1990-2005)
MDG1 Line
Source: FAO
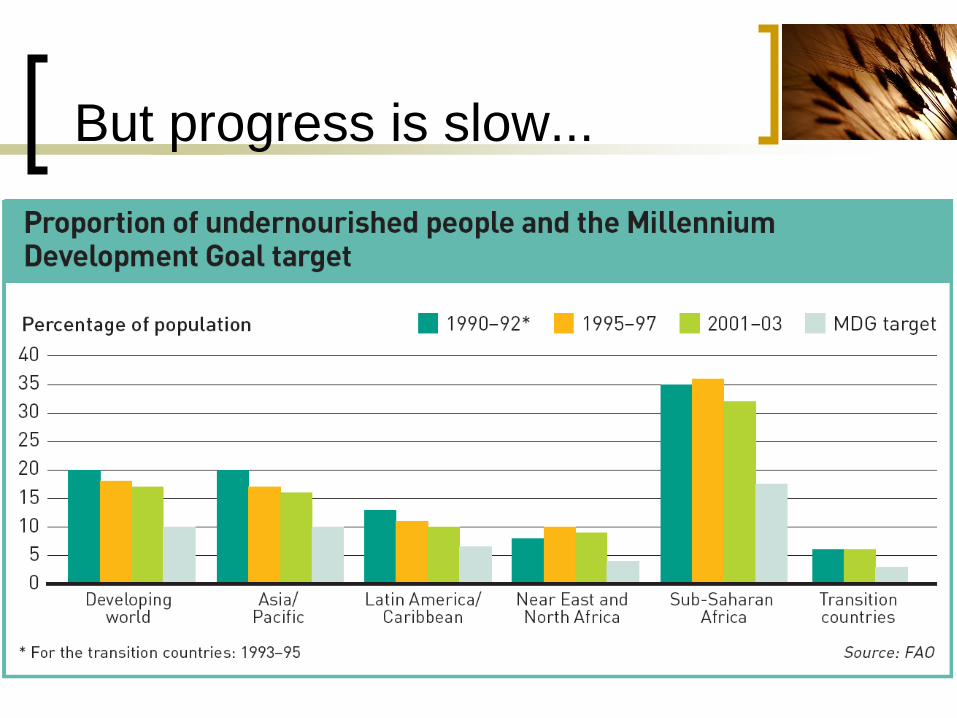
But progress is slow...
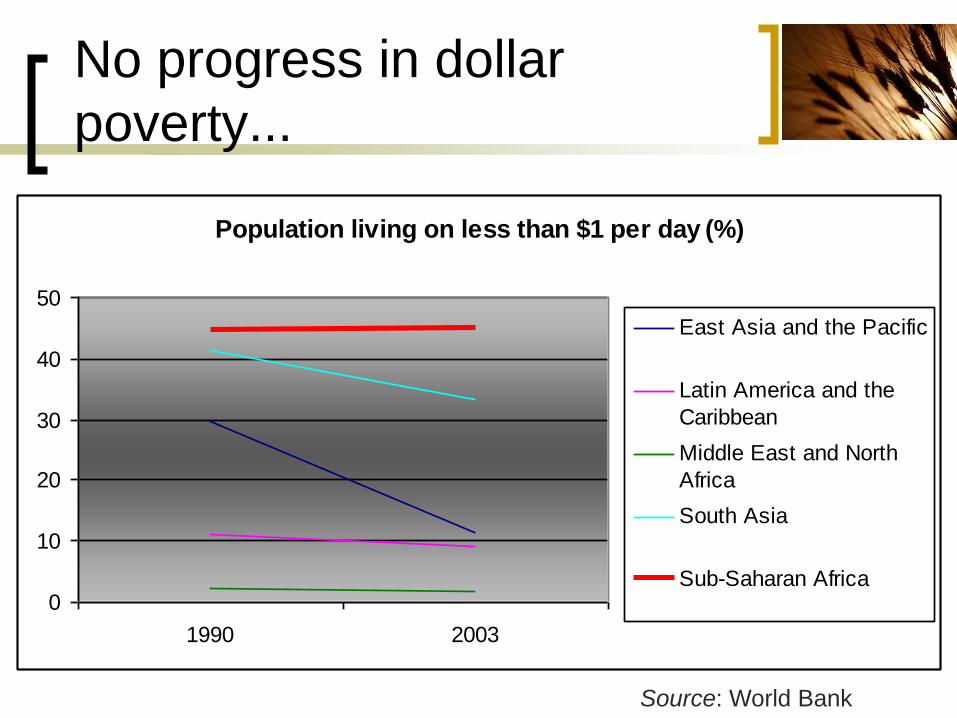
No progress in dollar
poverty...
Population living on less than $1 per day (%)
0
10
20
30
40
50
1990 2003
East Asia and the Pacific
Latin America and the
Caribbean
Middle East and North
Africa
South Asia
Sub-Saharan Africa
Source: World Bank
Main message
In agricultural-based Sub-
Saharan Africa agriculture is
the key sector for:
1. overall growth
2. poverty reduction
3. hunger alleviation
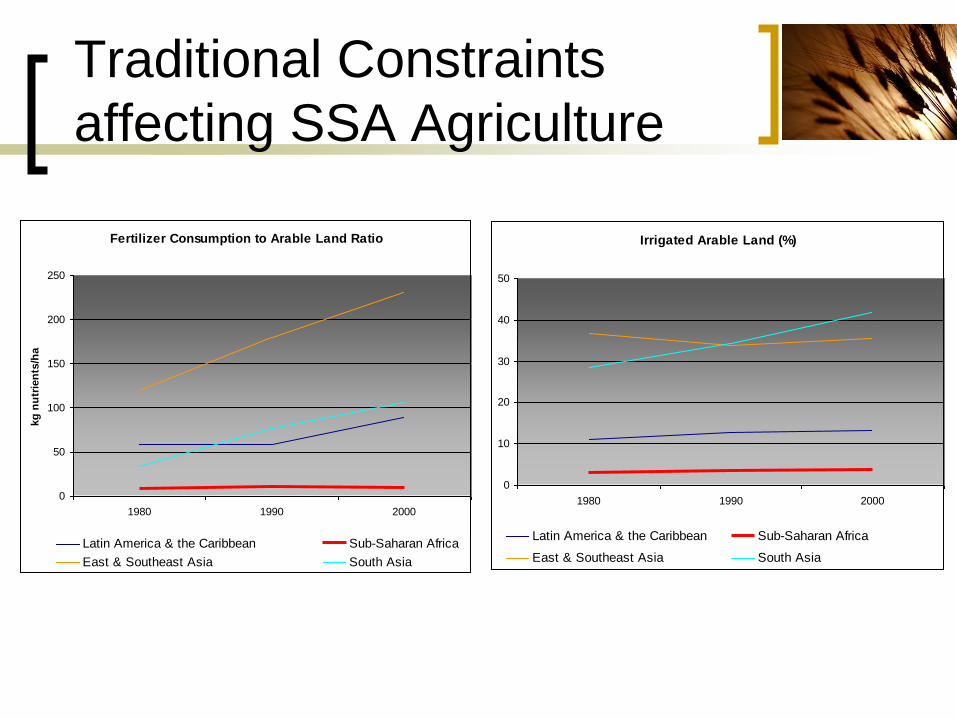
Traditional Constraints
affecting SSA Agriculture
Fertilizer Consumption to Arable Land Ratio
0
50
100
150
200
250
1980 1990 2000
kg
nu
trie
nts
/ha
Latin America & the Caribbean Sub-Saharan Africa
East & Southeast Asia South Asia
Irrigated Arable Land (%)
0
10
20
30
40
50
1980 1990 2000
Latin America & the Caribbean Sub-Saharan Africa
East & Southeast Asia South Asia

Constraints result in...
Variability of Agriculture
0 5 10 15 20 25 30
Burkina Faso
Guinea-Bissau
Seychelles
Namibia
Mali
Niger
Ethiopia
Lesotho
Sw aziland
Senegal
Mozambique
Sudan
Mauritania
Mauritius
Gambia, The
Cape Verde
South Africa
Zimbabw e
Rw anda
Chad
Angola
Malaw i
Zambia
Eritrea
Standard Deviation of
Yearly Agricultural Value
Added Growth (1990-2005)
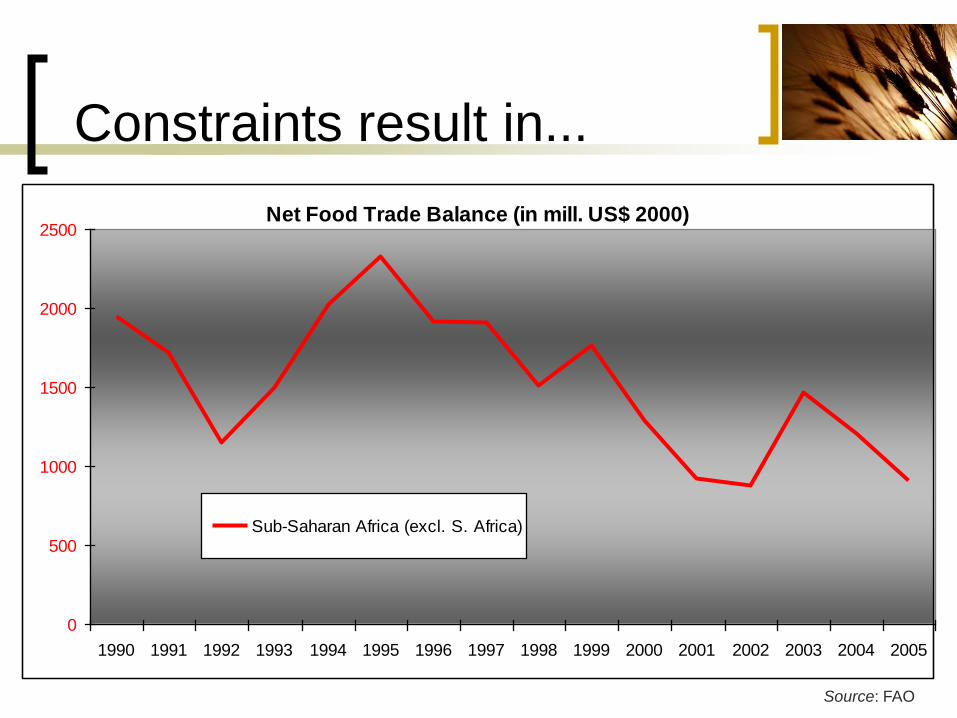
Constraints result in...
Net Food Trade Balance (in mill. US$ 2000)
0
500
1000
1500
2000
2500
1990 1991 1992 1993 1994 1995 1996 1997 1998 1999 2000 2001 2002 2003 2004 2005
Sub-Saharan Africa (excl. S. Africa)
Source: FAO
And there are new
emerging challenges...
Rapid Urbanization
Integration into global markets
Climate change
Biofuels and rising food prices
Signs of a brighter future
Several countries are making progress
Growing peace and improved governance
Renewed commitment to agriculture at national level (i.e. NEPAD, CAADP and Maputo Declaration)
Turnaround in ODAs for African agriculture.
Increased public interest on getting African agriculture moving (charities, aid organizations, G8, NGOs, etc.)
Agenda for Moving Forward
A coherent cross-sectoral policy agenda
Delivering on external assistance commitments / donor coordination
Delivering on the Maputo declarationand investing along the 4 pillars of CAADP
A twin-track approach