poverty in edinburgh data and evidence
TRANSCRIPT

1
Poverty in Edinburgh – data and evidence September 2020
Contents
Introduction ......................................................................................................................................... 2
1. Setting the baseline: Poverty in Edinburgh .................................................................................... 3
2. People .........................................................................................................................................13
3. Pockets ........................................................................................................................................14
5. Prospects.....................................................................................................................................20
6. Places ..........................................................................................................................................27
Appendix 1 – Methodology and target setting .....................................................................................31
References and sources.......................................................................................................................38

2
Introduction
In November 2018 the Edinburgh Poverty Commission launched an inquiry into the causes, experience of,
and solutions to poverty in Scotland’s capital city. The final report of the commission – A Just Capital:
Actions to End Poverty in Edinburgh – sets out the actions and changes needed to end poverty in
Edinburgh over the next ten years. These actions are the result of almost two years of evidence gathering
and deliberation by the commission and the many contributors and partners we have worked with along
the way.
This paper acts as an accompaniment to the Commission’s final report and provides an overview of the
evidence gathered on the extent, drivers, and experience of poverty in Edinburgh. In doing so it provides a
baseline picture of poverty in Edinburgh against which progress over the next ten years can be assessed. It
also provides a broad picture of the evidence and understanding of poverty which underpin the
commission’s findings and actions.
Information used in this report is drawn from a range of data sources including official statistics, bespoke
survey work, focus groups, interview sessions and written evidence submitted to the commission during
the past eighteen months. The majority of the data and information presented in the report relates to the
year leading up to March 2020, so provides a baseline picture of the city before the onset of the
Coronavirus outbreak. In developing this report, however, we have drawn on data produced in recent
months and on analysis on the likely ways in which Coronavirus is changing the experience and risks of
poverty in the city. In doing so, this report draws and builds on our interim report published in May 2020 –
Coronavirus and Poverty in Edinburgh.

3
1. Setting the baseline: Poverty in Edinburgh
Key Messages
• An estimated 77,600 people were in poverty in Edinburgh in the year prior to the coronavirus
outbreak, including almost one in five of all children
• People live in poverty in every area of this city. almost two thirds of people on very low incomes
live in areas out with those parts of Edinburgh commonly described as ‘deprived’ or
‘disadvantaged’
• Levels of child poverty in Edinburgh and Scotland have risen by more than 25% in the past five
years, as have levels of in work poverty. 65% of all children in poverty live in a family where adults
are in paid employment.
• Over three quarters of people in poverty live in social or private rented accommodation and
housing costs in Edinburgh are a key driver of high poverty rates in the city. Our estimates suggest
that 15,600 people in this city would not be living in poverty if Edinburgh’s housing costs were
closer with the Scottish average.
• Poverty rates are anticipated to rise sharply during early 2021, while long term trends suggest a
continued steady increase throughout the next decade. Without policy changes it is conservatively
estimated that an additional 4,500 Edinburgh citizens could be living in poverty by spring 2021.
What is poverty?
Being in poverty means not being able to heat your home, pay your rent, or buy essentials for your children. It means
waking up every day facing insecurity, uncertainty, and impossible decisions about money.
These are problems that can affect all and any of us. Almost anyone can experience poverty at some point in their
lives. Unexpected events such as bereavement, illness, redundancy, or relationship breakdown are sometimes all it
can take to push us into circumstances that then become difficult to escape. And these levels of poverty we see in
Edinburgh affect us all. Poverty is not an individual
affliction, it is a social problem.
What poverty represents more than anything else is a
waste of potential. People in poverty die sooner, have
poorer health, and deal everyday with the unnecessary
strains on families, on education, and on life choices. This
is bad for all of us and deprives our society of the skills and talents of people who have a valuable contribution to
make to the wellbeing of everyone in this city.
Defining Poverty
To be in poverty is to have resources that are well below the level needed to maintain a decent standard of living. In
order to quantify the number of people in Edinburgh we think are living in poverty, we have adopted a definition of
“Having to choose between heating a home or
eating… being left with very little money after the
bills are paid… being made to feel inadequate and
unable to provide the basics.”
Edinburgh Poverty Commission contributor

4
relative poverty against household income after housing costs as our baseline. The relative poverty measure defines a
household is in poverty when their income after housing costs are less than 60% of the UK median income level.
As an illustration, for a couple with 2 children in Scotland, this threshold is the equivalent of £22,700 per annum (after
housing costs such as rents or mortgage payments are deducted). 77,000 people in Edinburgh, including around 1 in 5
of all children in the city, live on incomes below this thresholdi.ii
Poverty in Scotland, 2019iii
19% of people living in Scotland, a total of 1 million people, were living in relative poverty after housing
costs during 2016-19.
Of all those in poverty, 13% have been living on incomes below the poverty threshold for more than 3
years. Understanding the persistence of poverty is important – evidence shows that the longer someone is
in poverty, the more it impacts on their health, well-being, and overall life chances. Overall, an estimated
133,000 people in Scotland are in persistent poverty, including 39,000 children.
Alongside the headline measure of poverty defined above, additional analysis of poverty in Scotland is
available showing the number of citizens falling into very low income groups, or who are experiencing
‘material deprivation’ driven by difficulty in affording basic essentials such as food and clothing. Some
730,000 people in Scotland live on incomes below the more stringent ‘severe poverty’ threshold (50% of
median incomes), or 14% of all citizens. At the same time, 13% of children are estimated to grow up
experiencing low income and material deprivation.
Over half of all people in poverty in Scotland live in households where at least one adult is in employment.
These rates of ‘in work poverty’ are even higher for families with children, where 65% are working
households.
For many people the experience of poverty comes as
a rising tide of circumstances over which they have
little control. Life events such as relationship break
downs, job losses or poor health can pull almost
anyone into poverty at some point in their life.
Coronavirus is making more people than ever
vulnerable to these shocks, and emphasising the
need for powerful support systems to help people
stay afloat

5
Source: Scottish Government, Poverty, and Income Inequality in Scotland 2016-19
Who is in poverty in Scotland?
In order to understand the solutions to poverty, it is important to appreciate who is most at risk of falling
into poverty, and why. Poverty rates, and by extension the risk of falling into poverty, varies considerably
between households in Scotland. In particular, the risk of poverty can be seen to depend highly on factors
such as age, gender, the number of children in a family, marital status, disability, tenure of housing, as well
as employment status.
In summary:
• Poverty rates are higher for people from BAME backgrounds than for White British people in
Scotland. 38% of Asian or Asian British people in Scotland live in poverty, double the average for all
citizens.
• Disability is a key factor increasing the risk of poverty for any household. 23-25% of households
with a disabled child or adult are in poverty, compared to 17% of those with no disabled resident.
• Poverty risks rise considerably depending on the number of children in a household. 18% of people
who live in a household with no children are in poverty, compared to 29% of those in households
with 3 or more children.
13%
17%
11%
12%
All ages
Children
Working age adults
Pensioners
Persistent poverty - % of all in poverty in Scotland, 2018
19%
14%
24%
12%
All ages in poverty
Severe poverty
Children in poverty
Children in poverty andmaterial deprivation
Severe poverty and material deprivation, Scotland, 2016-19
53%
65%60%
All people Children Working-age adults
In work poverty, Scotland, 2016-19

6
• People in poverty are highly concentrated in rented accommodation in Scotland. 77% of people in
poverty live in either a social rented or a private rented property.
• Among working age adults, the availability and accessibility of well-paid full time work remains one
of the most important factors influencing rates of poverty. Some 74% of all unemployed people in
Scotland are in poverty, compared to only 5% of people in households where all adults are in full
time work.
• Nevertheless, work alone does not guarantee an escape or avoidance of poverty. 29% of
households which rely on part time employment are in poverty, as well as 26% of multiple adult
households where only one adult is in full time employment.
Poverty in Edinburgh, 2019
Edinburgh is an affluent city. Average
incomes are 27% higher than the Scotland
average. Unemployment rates for the last
decade have been lower than those of any
other major UK city. Employment rates are
high and average wages are higher than
those of most other areas in the UK.
Despite this economic success, however,
poverty does exist in Edinburgh.
There are no official Scottish Government
estimates for measuring poverty at the
local authority level in Scotland. This year,
however, DWP and HMRC have begun
publication of an experimental data series
providing estimates of local child povertyiv.
This source offers a very useful picture of
the spatial distribution of child poverty in
Scotland and provides a basis from which
estimates of all age poverty both before
and after housing costs can be derived.
Overall, the analysis shows that Glasgow
accounts for by far the highest concentration of poverty, accounting for 17% of all children in poverty in
Scotland. Edinburgh (at 6%) ranks among a second group of highly poverty intensive areas. In total five
0% 5% 10% 15% 20%
Shetland Islands
Orkney Islands
Na h-Eileanan Siar
East Renfrewshire
Clackmannanshire
East Dunbartonshire
Inverclyde
Stirling
Argyll and Bute
Moray
Midlothian
East Lothian
Scottish Borders
South Ayrshire
Angus
West Dunbartonshire
Perth and Kinross
East Ayrshire
Dumfries and Galloway
Renfrewshire
Falkirk
Aberdeen City
Dundee City
Aberdeenshire
North Ayrshire
West Lothian
Highland
South Lanarkshire
City of Edinburgh
Fife
North Lanarkshire
Glasgow City
% of Scotland's total children in poverty (before housing costs), 2016-19

7
areas in Scotland – Glasgow, North Lanarkshire, Fife, and City of Edinburgh – collectively account for 44% of
all children in poverty in Scotland.
Using this data as a starting point alongside the Scotland level analysis presented above, this report
estimates that a total of 76,700 people in Edinburgh were living in poverty in 2016-19 after housing costs.
This equates to 15% of the total population of the city – lower than the Scottish average of 19%, but still
high considering the affluence and economic success the city has enjoyed over recent yearsv.
Further analysis of the model used for this report highlights the important impact high housing costs in
Edinburgh have on poverty rates in the city. Across Scotland as a whole an estimated 120,000 people (12%
of all in poverty) are only considered to be in poverty after housing costs are considered. These people, in
other words, are in poverty because of the high cost of their housing. In Edinburgh these rates are much
higher than the Scottish average. Our estimates suggest that 22,600 people in Edinburgh are pushed into
poverty by the cost of housing – this equates to 29% of all people in poverty, more than double the Scottish
average ratio. Taking this analysis further, the data suggest that an estimated 15,000 people could be
removed from poverty in Edinburgh if the cost of housing in the city were more in line with the Scottish
average.
Source: Scottish Government, Poverty and Income Inequality in Scotland 2016-19; Edinburgh Poverty Commission, Full
methodology for Edinburgh estimates are provided in Annex 1 to this report
Poverty rates in Edinburgh vary considerably between different areas of the city, with rates of up to 27%
recorded in some electoral wards, and as low as 3% in other. This pattern of inequality is replicated across
all four of the locality areas which make up the city – North West, North East, South East, and South West.
Every locality contains areas of high poverty. Most localities contain areas of relatively low poverty.
This spatial pattern of poverty is replicated by modelling of local child poverty rates. Overall, this analysis
estimates that 18% of all children in Edinburgh live in relative poverty after housing costs. This is almost 1 in
5 children across the city and is estimated at approximately 14,600 children.
18%
15%
24%
19%
0%
5%
10%
15%
20%
25%
30%
Children All ages
Relative poverty (after housing costs), 2016-19
Edinburgh Scotland
Relative poverty before and after housing costs, 2016-19
Scotland Edinburgh
Before Housing Costs 900,000 54,100
After Housing Costs 1,020,000 76,700
In poverty due to housing costs
120,000 22,600
% in poverty due to housing costs
12% 29%

8
Source: Edinburgh Poverty Commission, Full methodology for Edinburgh estimates are provided in Annex 1
Alongside analysis of poverty as defined above, the Scottish Index of Multiple Deprivation (SIMD) is another
key tool for identifying concentrations of deprivation in Scotland. The 2020 SIMD is the latest iteration of
the data set, which is updated approximately every three to four years. In particular the index provides a
useful analysis of the micro-geography of deprivation in Edinburgh, showing analysis below the ward level
cited above.
In the map shown here, for instance, areas coded red rank among the most deprived 20% of areas in
Scotland, with areas coded dark blue amongst the least deprived. Overall, the 2020 edition of the SIMD
shows that 71 areas (datazones) in Edinburgh are ranked among the 20% most deprived in Scotland. Some
60,000 people live in these areas, or 11% of the total population of the city.vi
The index also shows that 44,600 people in Edinburgh are considered ‘income deprived’ - a proxy measure
for poverty based largely on benefits take up rates. Most notably, however, analysis of the index shows
that the distribution of people on low incomes in Edinburgh is very different than that seen in many other
parts of Scotland. In Glasgow, for instance, there is a strong correlation between low income individuals
and deprived areas – 71% of all income deprived people in Glasgow live in those parts of the city ranked
among the 20% most deprived in Scotland. In Edinburgh, however, this ratio is almost precisely reversed.
Only around a third of income deprived residents live in those areas of Edinburgh coded dark red in the
4%6% 7% 7% 8% 8%
12% 12%15%
17% 17% 18% 18%
23% 24%27% 27%
15%
0%
5%
10%
15%
20%
25%
30%M
orn
ings
ide
Sou
thsi
de
/Ne
win
gto
n
Cit
y C
en
tre
Fou
nta
inb
rid
ge/C
raig
lock
har
t
Co
rsto
rph
ine/
Mu
rray
fie
ld
Inve
rlei
th
Leit
h W
alk
Co
linto
n/F
airm
ileh
ead
Dru
m B
rae/
Gyl
e
Cra
igen
tin
ny/
Du
dd
ings
ton
Alm
on
d
Leit
h
Sigh
thill
/Go
rgie
Pe
ntl
and
Hill
s
Lib
ert
on
/Gilm
ert
on
Po
rto
bel
lo/C
raig
mill
ar
Fort
h
Edin
bu
rgh
Relative poverty in Edinburgh by electoral ward, 2016-19

9
map above. In other words, around 65% (almost two thirds) of people who are income deprived live
outside of the 20% most deprived areas of Scotland.
Source: Scottish Index of Multiple Deprivation 2020
Poverty Trends and Projections
Poverty rates in Scotland declined during the 2000’s but have shown little net change for more than a
decade now. This flat trend comes despite a rise in average incomes recorded in recent years. Since 2010-
13, median incomes (after housing costs) in Scotland have risen by 8%, but this increase has not been felt
equally across all households. Income growth for affluent households has been recorded at 7 to 8 times
higher than that of the lowest 10% of households in Scotland by income during this period.
At the same time, Scottish Government data shows that income growth for households with children
during this period has been lower than for other households. This disparity, driven in part by reductions in
the real value of working age benefits for families for families with children, has resulted in a sustained
increase in child poverty in Scotland in recent years. Following a low of 21% in 2010-13, Child poverty rates
in Scotland have plateaued 24% for the past three reporting periods. Alongside population growth, this has
led to a net additional 20,000 children in Scotland living in poverty over the past five years.
35%
71%
45%
65%
29%
55%
0%
10%
20%
30%
40%
50%
60%
70%
80%
Edinburgh Glasgow Scotland
Income deprived individuals by SIMD rank of area of residence, 2020
20% most deprived Other areas

10
Source: Scottish Government, Poverty and Income Inequality in Scotland 2016-19
In 2016-19, 60% of working-age adults in relative poverty after housing costs across Scotland were living in
working households. In-work poverty for working-age adults continuously increased since 2011-14, and in
the most recent period, it continues to be at its highest since reporting began. These rates are higher again
for families with children where 65% of all those in poverty are living in working households. This trend
alone marks a significant change in the character of poverty in Scotland in recent years. At the beginning of
this decade worklessness could be said to be a principle driver of poverty, with more than half of all
children in poverty growing up in workless households. At the end of the decade – when working families
account for almost two thirds of children in poverty – it is clear that work alone is not sufficient to keep a
family out of poverty.
The terms 'working' and 'in-work poverty' here refer to paid employment only. In-work poverty refers to
people living in households where at least one member of the household is in either full or part-time paid
work, but where the household income is below the relative poverty threshold.
No official data is available to show comparable
after housing cost trends in poverty at the local
authority level in Scotland, but the best available
sources do suggest that trends in Edinburgh are
likely to closely follow those observed for
Scotland as a whole. Recent experimental data
of child poverty (before housing costs) published
by DWP estimates that the number of children
in poverty in Edinburgh rose by 28% from 2015-
2019, closely matching the 26% growth estimated across Scotland as a whole from the same sourcevii.
Projections
Pre-covid projections
0%5%
10%15%20%25%30%35%
Poverty in Scotland, 1994-2019
All ages Children
0%
10%
20%
30%
40%
50%
60%
70%
In Work Poverty, Scotland, 1994-2019
Children working age
80
100
120
140
2014/15 2015/16 2016/17 2017/18 2018/19
Child poverty (BHC) index, 2014/15 to 2018/19
Edinburgh Scotland
11
Even before the onset of the coronavirus outbreak Scottish Government projections were anticipating a
long term increase in poverty in Scotland over the next decade. In the absence of policy changes at the UK
and Scottish Government levels, these projections estimated that child poverty in Scotland could rise
steadily throughout the 2020’s to reach a level of just under 38% by 2028/29 – representing an increase
from roughly 1 in 4 children in Scotland at baseline to well over 1 in 3 children by the end of the coming
decadeviii.
These increases, the analysis suggests, would be driven by an assumed continuation of substantial cuts to
social security for families with children, in particular the freeze in benefits payments and the 2-child limit
for Housing Benefit, tax credit and Universal Credit claims.
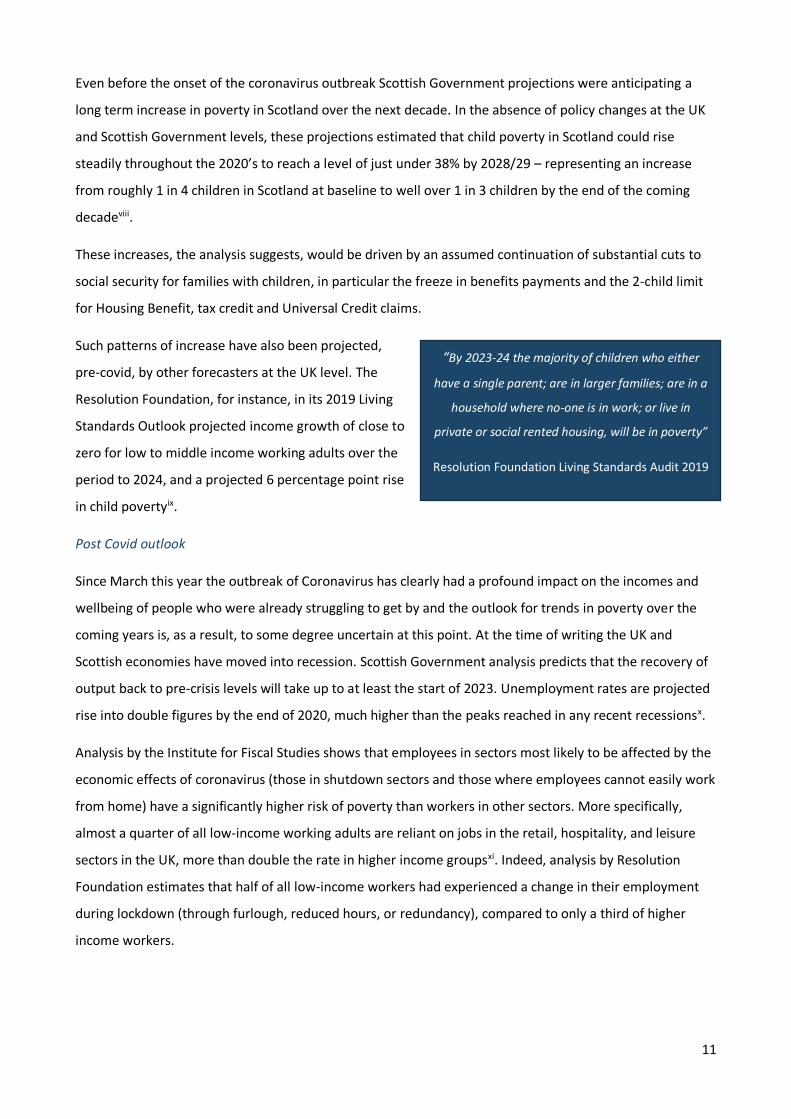
Such patterns of increase have also been projected,
pre-covid, by other forecasters at the UK level. The
Resolution Foundation, for instance, in its 2019 Living
Standards Outlook projected income growth of close to
zero for low to middle income working adults over the
period to 2024, and a projected 6 percentage point rise
in child povertyix.
Post Covid outlook
Since March this year the outbreak of Coronavirus has clearly had a profound impact on the incomes and
wellbeing of people who were already struggling to get by and the outlook for trends in poverty over the
coming years is, as a result, to some degree uncertain at this point. At the time of writing the UK and
Scottish economies have moved into recession. Scottish Government analysis predicts that the recovery of
output back to pre-crisis levels will take up to at least the start of 2023. Unemployment rates are projected
rise into double figures by the end of 2020, much higher than the peaks reached in any recent recessionsx.
Analysis by the Institute for Fiscal Studies shows that employees in sectors most likely to be affected by the
economic effects of coronavirus (those in shutdown sectors and those where employees cannot easily work
from home) have a significantly higher risk of poverty than workers in other sectors. More specifically,
almost a quarter of all low-income working adults are reliant on jobs in the retail, hospitality, and leisure
sectors in the UK, more than double the rate in higher income groupsxi. Indeed, analysis by Resolution
Foundation estimates that half of all low-income workers had experienced a change in their employment
during lockdown (through furlough, reduced hours, or redundancy), compared to only a third of higher
income workers.
“By 2023-24 the majority of children who either
have a single parent; are in larger families; are in a
household where no-one is in work; or live in
private or social rented housing, will be in poverty”
Resolution Foundation Living Standards Audit 2019

12
Sources: Institute for Fiscal Studies, Resolution Foundationxii
The responses made by UK and Scottish Governments during the first stages of the Coronavirus outbreak
have mitigated the worst impacts of lockdown and its economic effects for people on low incomes. In
Edinburgh alone an estimated 75,000 people have been supported by the Job Retention Scheme, and
12,600 supported through the SEIS. At the same time temporary increases to the value of Universal Credit,
Working Tax Credits and the uplifts made to Local Housing Allowances have amounted to a £9billion boost
to the incomes of people who have found themselves struggling to get by during the crisis.
It seems fair to conclude that without these schemes more people would have been made redundant, and
more families would be struggling to cope. Indeed, some analyses suggest that the incomes of people in the
poorest quintile have dropped by 1% in the year to May 2020, but that without the support of the
temporary social security changes made during the summer, incomes for the same households would have
dropped by 8%.
The impact of these changes make it likely that relative poverty rates as defined in this report have fallen
during lockdown, particularly for those families with children who have benefitted most from the boost in
welfare payments. The risk in the short to medium term, therefore, is that the planned removal of
temporary measures introduced in response to Coronavirus result in a new wave of people experiencing
poverty and low income in the early months of 2021. Under current policies basic levels of Universal Credit
support for a single male adult, for instance, are expected to drop from £410 per month in summer of 2020
to £324 per month by April 2021 – a 22% cut in real terms.
When combined with the rollback of other benefits changes, Local Housing Allowance rates most
particularly, Resolution Foundation analysis suggests that 6 million households across the UK could lose
over £1,000 per annum, and the number of people living in relative poverty could rise by more than 1
million people by spring of 2021xiii. On a conservative estimate (based on share of population), these
models imply that without a continuation of the temporary welfare uplifts introduced in 2020 an additional
4,500 people could fall into relative poverty in Edinburgh by April 2021, representing a 1 percentage point
increase in the city’s overall poverty rate.
23% 22%17%
11% 9%
0%5%
10%15%20%25%
1st(poorest)quintile
2ndquintile
3rdquintile
4thquintile
5th(richest)quintile
% of in work adults employed in retail, hospitality, and leisure sectors, UK

13
2. People
Over the last two years, the central focus of the Commission’s work has been to listen to and learn from
people in Edinburgh direct lived experience of poverty in this city. This part of the Commission’s inquiry has
been taken forward through four routes:
• By ensuring that the Commission’s membership of 12 independent individuals included citizens of
Edinburgh with direct experience of living with poverty and living among people experiencing
poverty in the city;
• By inviting citizens with experience of poverty, and community groups directly supporting people in
poverty to provide evidence and to lead the Commission in discussions on the issues that matter to
them. During the course of the inquiry, over 100 such sessions were held in communities across
Edinburgh.
• By issuing a series of public calls for evidence for Edinburgh citizens to submit their thoughts and
experiences on poverty, its causes, and solutions. During 2019 three online calls for evidence were
published by the Commission, with over 100 detailed written responses received by citizens and
organisations across the city.
• By commissioning specific additional research into the experiences, causes, and solutions to
poverty in Edinburgh. During the Commission’s inquiry we were supported by the Poverty Alliance
and the Scottish Poverty and Inequality Research Unit in carrying out three discrete research
projects. These projects included one to one interviews with people in poverty from different
groups and areas in the city, a series of citizen focus groups, and an online survey on attitudes and
understanding of poverty in Edinburgh which received over 800 completed submissions.
Full details of the published findings from commissioned research activities can be found online at:
• Citizen’s Perspectives on poverty in Edinburghxiv, and
• Poverty in Edinburgh – the key issuesxv.
In addition to these research projects and inquiry activities, the work of the Commission also benefitted
from research carried out by other partner organisations in the city. Most notably, in 2018 Edinburgh
Voluntary Organisations’ Council [EVOC] and the Third Sector Strategy Group [TSSG] launched a new
initiative, titled ‘Mind the Craic’, aiming to gather evidence of the lived experience of poverty, prevention
and early intervention of citizens across Edinburgh. This research involved conversations with 475
individual and 66 organisations in Edinburgh, culminating in a final report published in September 2020xvi.

14
3. Pockets
Incomes and income inequality
• Median weekly household incomes in Scotland have showed slow growth in recent years, rising by
only 6% over the last decade.
• Income growth trends vary considerably across household types and income groups. Pensioner
groups saw the strongest growth over the last decade, with incomes rising by 11%. Households in
the lowest income groups showed the slowest change, with incomes rising by only 3% - less than
half the average for the median household.
Income trends in Scotland
Source: Scottish Government, Poverty and Income Inequality in Scotland 2016-19xvii
Source: Scottish Government, Poverty and Income Inequality in Scotland 2016-19
• Across Scotland, 64% of median household incomes come from earnings, with 23% sourced from
social security payments. Even in the lowest income decile earnings from employment account for
45% of all income, with a further 45% sourced from social security transfers.
200250300350400450500
1994
-97
1996
-99
1998
-01
2000
-03
2002
-05
2004
-07
2006
-09
2008
-11
2010
-13
2012
-15
2014
-17
2016
-19
£ p
w, a
fter
ho
usi
ng
cost
s
Median household income, Scotland
6%
3%
11%
0%
5%
10%
15%
Familes with childrenWorking age adults Pensioners
% change in income by household type, 2006-09 to 2016-19
£192 £2
74
£334
£399
£464
£535
£614 £7
19 £912
0
200
400
600
800
1000
1st
dec
ile
2n
d d
ecile
3rd
dec
ile
4th
dec
ile
5th
dec
ile
6th
dec
ile
7th
dec
ile
8th
dec
ile
9th
dec
ile
£ p
w, a
fter
ho
usi
ng
cost
s
Income by decile, 2016-19, Scotland
2%
5% 5% 6% 6%5%
5%4% 3%
0%
2%
4%
6%
8%
1st
dec
ile
2n
d d
eci
le
3rd
de
cile
4th
dec
ile
5th
dec
ile
6th
dec
ile
7th
dec
ile
8th
dec
ile
9th
dec
ile
% change in income 2006-09 to 2016-19

15
Source: Scottish Government, Poverty and Income Inequality in Scotland 2016-19
Income patterns in Edinburgh
• Income levels in Edinburgh are typically higher than the average for Scotland as a whole across all
income groups, but data for the city show evidence of high inequality. Lowest decile income levels
across Scotland are estimated at 41% of those in the median income group. In Edinburgh, the same
group shows income levels at only 32% of the city median.
Average annual household income (before housing costs) for Edinburgh, 2018
Income Edinburgh
Lowest 10% of households £11,628
Median £35,678
Highest 10% of households £87,492
Source: CACI Paycheck 2018
• Income levels vary considerably across Edinburgh’s geography. Average income levels in
Sighthill/Gorgie are estimated at only 55% of those of average households in Inverleith.
• Overall, 25% of households in areas such as SIghthill/Gorgie are estimated to live on less than
£15,000 per annum, compared to only 9% in more affluent areas, such as Morningside.
• Significant levels of income inequality are also evident within discrete areas of the city. Even in the
most equal ward in Edinburgh, Leith, households in the highest income decile are estimated to earn
7 times that of those in the lowest income decile.
0%
20%
40%
60%
80%
100%
1st 2nd 3rd 4th 5th 6th 7th 8th 9th 10th
% o
f al
l ico
me
Sources of income by decile, Scotland
Earnings Social security payments Occupational pensions Investments Other sources

16
Source: CACI Paycheck 2018
Source: CACI Paycheck 2018
Source: CACI Paycheck 2018
£25,
405
£28,
321
£29,
856
£30,
272
£32,
055
£32,
781
£34,
625
£35,
738
£37,
804
£37,
927
£38,
794
£40,
404
£43,
298
£44,
565
£44,
786
£44,
826
£46,
103
010,000
20,00030,00040,00050,000
Sigh
thill
/ G
org
ie
Fort
h
Po
rto
bel
lo /
Cra
igm
illar
Lib
ber
ton
/ G
ilmer
ton
Cra
igin
tin
ny
/…
Leit
h
Lei
th W
alk
Sou
thsi
de
/ N
ewin
gto
n
Fou
nta
inb
rid
ge /
…
Dru
mb
rae
/ G
yle
Cit
y C
entr
e
Pen
tlan
d H
ills
Co
rsto
rph
ine
/…
Alm
on
d
Mea
do
ws
/…
Co
llin
gto
n /
Fai
rmile
Inve
rlei
th
£ p
er a
nn
um
Median income, Edinbugh by ward
25%
24%
21%
21%
18%
17%
15%
14%
13%
13%
13%
12%
11%
10%
9% 9% 9%
0%
5%
10%
15%
20%
25%
30%
Sigh
thill
/ G
org
ie
Fort
h
Po
rto
bel
lo /
…
Lib
ber
ton
/…
Cra
igin
tin
ny
/…
Leit
h
Sou
thsi
de
/…
Lei
th W
alk
Dru
mb
rae
/ G
yle
Pen
tlan
d H
ills
Fou
nta
inb
rid
ge /
…
Cit
y C
entr
e
Co
llin
gto
n /
Fai
rmile
Co
rsto
rph
ine
/…
Alm
on
d
Inve
rlei
th
Mea
do
ws
/…
% o
f h
ou
seh
old
s
% of households with income <£15,000
6.2
8
6.3
8
6.58
6.7
0
6.7
8
6.79
6.8
1
6.9
3
6.9
3
7.07 7.3
6
7.4
8
7.49 7.
80
7.8
9
8.0
3 8.7
6
4.04.55.05.56.06.57.07.58.08.59.0
Lei
th W
alk
Mea
do
ws
/…
Alm
on
d
Inve
rlei
th
Cit
y C
entr
e
Co
rsto
rph
ine
/…
Fou
nta
inb
rid
ge /
…
Sigh
thill
/ G
org
ie
Dru
mb
rae
/ G
yle
Leit
h
Cra
igin
tin
ny
/…
Sou
thsi
de
/…
Pen
tlan
d H
ills
Co
llin
gto
n /
Fai
rmile
Lib
ber
ton
/…
Po
rto
bel
lo /
…
Fort
h
90:
10
rat
io
income inequality, 90:10 ratio by ward

17
Earnings from employment
• On average, Edinburgh is a high employment, high wage economy. Median earnings from
employment in Edinburgh in 2019 were higher than in any other major UK city outside London.
• But not all workers benefit from high wages. Data show wide levels of inequality in pay levels, with
the lowest paid 20% of all workers earning a third less than the median, and 60% less than the
highest paid 20%.
• This inequality is seen also in hourly pay levels. The lowest paid 10% of workers in Edinburgh earn
on average an hourly rate of only £8.62, fully 68p per hour below the Living Wage level set by the
Scottish Living Wage Foundation.
• Overall an estimated 38,650 workers were estimated to be working for wages below the Living
Wage level in Edinburgh in 2019, almost 60% of whom were women.
Source: Annual Survey of Hours and Earnings 2019xviii
Source: Annual Survey of Hours and Earnings 2019
Out of work benefits claimants and crisis funds
• Pre-Covid Edinburgh recorded one of the lowest claimant rates for out of work benefits in Scotland.
During the past few months, however, claimant rates have risen dramatically. By August 2020 some
19,100 people in Edinburgh were claiming out of work benefits due to unemployment, an increase
£2,6
80
£2,5
30
£2,4
50
£2,4
00
£2,4
00
£2,3
70
£2,2
90
£2,2
10
£2,1
70 £3,0
70
£2,5
30
£2,5
00
Average Monthly Pay for full-time residents in UK Cities 2019
£1,780£2,340
£2,680£3,100
£4,350
20percentile
40percentile
Medium 60percentile
80percentile
Monthly Earnings from employment in Edinburgh by percentiles
£8.6
2
£9.
45
£1
0.70
£12
.59
£17
.10
£20
.22
£24
.31
£32.
27
0
10
20
30
40
1st
dec
ile
2nd
dec
ile
3rd
dec
ile
4th
dec
ile
6th
dec
ile
7th
dec
ile
8th
dec
ile
9th
dec
ile
£ p
er h
ou
r
Hourly pay by decile, Edinburgh, 2019
Workers paid at hourly rates below Living Wage Foundation levels, Edinburgh, 2019
No workers
Women paid under £9.30ph
22,600
Men paid under £9.30ph
16,050
Total paid under £9.30ph
38,650

18
from only 6,400 claimants during the same month in 2019. This represents a trebling of the number
of unemployed benefits claimants in Edinburgh over the past 12 months, a faster rate of growth
than any other area in Scotland.
• The same period has also seen rapid increase in eligibility for and use of important crisis funds such
as the Scottish Welfare Fund. In April 2020 over 3,500 applications to Scottish Welfare Fund were
made by Edinburgh residents, more than three times the highest level recorded in any month
during the past three years.
Source: ONS Claimant Count Statisticsxix
Source: ONS Claimant Count Statistics
0
5,000
10,000
15,000
20,000
25,000
Jan
uar
y 20
00
Aug
ust
200
0
Mar
ch 2
001
Oct
ob
er 2
001
May
200
2
Dec
emb
er…
July
200
3
Feb
ruar
y 20
04
Sep
tem
ber
…
Apr
il 20
05
No
vem
ber…
Jun
e 20
06
Jan
uar
y 20
07
Aug
ust
200
7
Mar
ch 2
008
Oct
ob
er 2
008
May
200
9
Dec
emb
er…
July
201
0
Feb
ruar
y 20
11
Sep
tem
ber
…
Apr
il 20
12
No
vem
ber…
Jun
e 20
13
Jan
uar
y 20
14
Aug
ust
201
4
Mar
ch 2
015
Oct
ob
er 2
015
May
201
6
Dec
emb
er…
July
201
7
Feb
ruar
y 20
18
Sep
tem
ber
…
Apr
il 20
19
No
vem
ber…
Jun
e 20
20
Edinburgh Claimant Count Change Over Time
37
% 57
%
59
%
66
%
66
%
78
%
78%
80%
83
%
89
%
90
%
94
%
96
%
97
%
10
2%
10
6%
11
4%
11
6%
11
8%
11
9%
13
2%
132%
138%
14
0%
14
2%
14
7%
15
1%
15
2%
15
6%
15
8%
16
6% 20
0%
0%
50%
100%
150%
200%
250%
Inve
rcly
de
Du
nd
ee C
ity
No
rth
Ayr
shir
e
East
Ayr
shir
e
Cla
ckm
ann
ansh
ire
Wes
t D
un
bar
ton
shir
e
Fife
Ang
us
Du
mfr
ies
and
Gal
low
ay
Sou
th A
yrsh
ire
No
rth
Lana
rksh
ire
Falk
irk
Ren
frew
shir
e
Sou
th L
anar
kshi
re
Gla
sgo
w C
ity
Mo
ray
Wes
t Lo
thia
n
Stir
ling
East
Lo
thia
n
Sco
ttis
h B
ord
ers
Arg
yll a
nd
Bu
te
Mid
loth
ian
East
Du
nbar
tons
hir
e
Abe
rdee
nsh
ire
Abe
rdee
n C
ity
East
Ren
frew
shir
e
Hig
hla
nd
Shet
land
Isla
nd
s
Pert
h a
nd
Kin
ross
Ork
ney
Isla
nd
s
Na
h-Ei
lean
an S
iar
Cit
y of
Edi
nb
urg
h
% change in Claimant Count, Aug 19-Aug20

19
Source: City of Edinburgh Council
• Across the UK, DWP data shows that an estimated £8.1bn of available key income related benefits
were not taken up by eligible families in 2017/18. No official estimates are available for this data at
local authority level but, using share of population and/or Edinburgh’s share of UK Housing Benefits
claimants as a guide, it is likely that Edinburgh residents account for some £70-80m of these
unclaimed benefits.
• On average, DWP estimates show that average unclaimed amounts by family are highest for those
not fully claiming Income Support/Employment Support Allowance, but that take up rates are
lowest among pension credit eligible households.
Source: DWP, Income-related benefits: estimates of take-up: financial year 2017 to 2018xx
0
500
1,000
1,500
2,000
2,500
3,000
3,500
4,000
Approved Social Welfare Fund applications in Edinburgh April 2017 to April 2020
£2,000
£2,900
£4,100
Pension Credit
Housing Benefit
Income SupportEmployment Support
Allowance
Average unclaimed amount per year for entitled family, Great Britain
1,200,000
1,000,000
400,000
Pension Credit
Housing Benefit
Income SupportEmployment Support
Allowance
Families entitled to benefits that were not recieving them, Great Britain

20
5. Prospects
Gaps in attainment and progression
• The ‘poverty related’ attainment gap is the percentage point difference between the level achieved
for students living in the least deprived areas and those living in the most deprived areas. Reducing
this gap is a key national and local priority.
• Analysis of the attainment gap uses the Scottish Index of Multiple Deprivation (SIMD) for each
student. SIMD is often divided into deciles (i.e. ten bandings from the 10% most deprived to the
10% least deprived) or quintiles (i.e. five bandings from the 20% most deprived to the 20% least
deprived). The bandings are numbered with, for example, quintile 1 being the most deprived and
quintile 5 the least deprived.
• Data show that attainment gaps in Edinburgh schools have been narrowing in recent years for all
measures of literacy and numeracy, other than among P1 pupils.
Gap in attainment between SIMD Q1 and Q5 2018-19 in Edinburgh Schools
(attainment gap moved up / down / same on 2017/18)
Reading Writing Listening and talking
Numeracy
P1 22% (up) 25% (same) 11% (down) 18% (same)
P4 22% (down) 24% (down) 17% (down) 22% (down)
P7 22% (down) 24% (down) 18% (down) 23% (down)
S3 (3rd level) 10% (down) 9% (down) 10% (down) 10% (down)
S3 (4th level) 31% (down) 32% (down) 31% (down) 41% (down)
Source: City of Edinburgh Council
• Data on attainment of school leavers shows a similar pattern. The poverty related attainment gap is
estimated at 45 percentage points for S5 pupils achieving 5 or more SCQF at level 6 or above. Only
17% of pupils from areas in Edinburgh ranked among the 20% most deprived in Scotland achieve
this level, compared to 61% of pupils from more affluent areas.
• Data also show that while attainment gaps have been closing slowly across Scotland, for this cohort
in Edinburgh the past few years have seen little change.

21
Source: City of Edinburgh Council
• Overall, attainment data shows that Edinburgh schools do better than the Scottish average for
pupils from the more affluent areas of the city, but less well than average for pupils from deprived
areas.
• The city ranks as the third best performing local authority in Scotland for pupils from SIMD Quintile
5 (least deprived) areas, but only 19th best performing for pupils from SIMD Quintile 1 (most
deprived) areas.

22
Source: Improvement Service, Local Government Benchmarking Frameworkxxi
• Data on school rolls in Edinburgh show a significant degree of polarisation by income group. Six
state schools in the city account for more than half of all pupils who live in the most deprived (first
SIMD quintile) areas of the city, but only 2% of those from more affluent (fifth SIMD quintile) areas.
At the same time, a group of seven other schools account for two thirds of all pupils from affluent
areas, but only 10% of those from more deprived areas.
% of School roll resident in high deprivation (Q1) or low deprivation (Q5) areas, City of Edinburgh Secondary Schools, 2019
School SIMD Quintile 1 (20% most deprived in Scotland)
SIMD Quintile 5 (20% least deprived in Scotland)
Balerno Community High School 3% 53%
Boroughmuir High School 1% 84%
Broughton High School 28% 37%
Castlebrae Community High School 76% 0%
Craigmount High School 4% 53%
Craigroyston Community High School
67% 1%
Currie Community High School 9% 62%
0 200 400 600 800 1000 1200 1400 1600
East RenfrewshireEast Dunbartonshire
Edinburgh CityNorth Lanarkshire
Glasgow CityWest LothianArgyll & Bute
StirlingRenfrewshire
South AyrshireInverclyde
Orkney IslandsSouth Lanarkshire
ScotlandFalkirk
Dumfries & GallowayPerth & KinrossNorth Ayrshire
East AyrshireWest Dunbartonshire
East LothianClackmannanshire
FifeScottish Borders
MidlothianAberdeen City
Dundee CityHighland
AberdeenshireAngusMoray
Average tariff scores - 20% most deprived (Q1) and 20% least deprived (Q5) datazones, 2018/19
Q5 Q1

23
% of School roll resident in high deprivation (Q1) or low deprivation (Q5) areas, City of Edinburgh Secondary Schools, 2019
School SIMD Quintile 1 (20% most deprived in Scotland)
SIMD Quintile 5 (20% least deprived in Scotland)
Drummond Community High School 19% 19%
Firrhill High School 9% 50%
Forrester High School 23% 13%
Gracemount High School 53% 7%
Holy Rood Roman Catholic High School
47% 8%
James Gillespie’s High School 3% 69%
Leith Academy 29% 10%
Liberton High School 23% 4%
Portobello High School 15% 41%
Queensferry Community High School
6% 47%
St Augustine’s Roman Catholic High School
50% 6%
St Thomas of Aquin’s Roman Catholic High School
10% 46%
The Royal High School 7% 66%
Trinity Academy 18% 39%
Tynecastle High School 25% 17%
Wester Hailes Education Centre 82% 1%
All secondary schools 21% 39%
Source: City of Edinburgh Council
• Further inequality in progression routes is apparent in the proportion of students from the most
deprived areas in Edinburgh who are able to access higher education opportunities in the city’s
universities and colleges.
• In 2018/19 some 1,500 students from areas ranked among the 20% most deprived in Scotland
entered under graduate courses at Edinburgh’s Universities and Further Education Colleges. This
represented a 50% increase in intake from such areas over the past five years.
• Despite this increase, however, such under graduates only account for 13% of the total new entrant
intake across all Edinburgh’s higher and further education institutes, well below the Scottish
average of 19% and a full ten percentage points below the comparable figure for Glasgow.

24
Source: Scottish Funding Council Report on Widening Access, 2018-19
Progression through work
• Pre-Covid, an estimated 266,600 jobs were located in Edinburgh – a figure which had shown steady
growth of almost 20% over the past decade. Throughout this period, the city has recorded
employment rates at or above the Scottish average, with an estimated 75% of all residents in
employment as at March 2020.
• Other datasets, however, demonstrate the precariousness of some jobs in the city. Some 7.5% of
all jobs in Edinburgh are described as ‘non-permanent’, indicating jobs which are seasonal, casual,
zero-hour contracts, or temporary/fixed term employment. This is a level of non-permanence well
above the Scottish average, and above the level recorded by most other major cities in the UK.
• At the same time, almost 37% of all residents in Edinburgh were described in a recent Office for
National Statistics release as being ‘not in quality jobs’. This is a composite measure, bringing
together the number of employees who are not working the number of hours they would like,
working for low pay, or not working under the contract conditions they are looking for. On this
measure the proportion of Edinburgh workers who are not able to find work that meets their needs
is significantly higher than any other major UK city, excluding London.
1,090 1,160 1,1051,275 1,310
1,505
2013-14 2014-15 2015-16 2016-17 2017-18 2018-19
Number of Under Graduate Entrants to Higher Education at Edinburgh Further
and Higher Education Institutions
13
%
23
%
6%
18
%
19
%
15
%
36
%
7%
23
%
25
%
11
% 17
%
6%
16
%
15
%
Edinburgh Glasgow Aberdeen Dundee Scotland
Proportion of entrants from 20% most deprived areas in Scotland into HE by sector type, Scottish Cities 2018/19
All From FEI From HEI
0
50000
100000
150000
200000
250000
300000
Dec
04
Feb
06
Apr
07
Jun
08
Aug
09
Oct
10
Dec
11
Feb
13
Apr
14
Jun
15
Aug
16
Oct
17
Dec
18
Feb
20
Jobs in Edinburgh
60
65
70
75
80
Dec
04
Feb
06
Apr
07
Jun
08
Aug
09
Oct
10
Dec
11
Feb
13
Apr
14
Jun
15
Aug
16
Oct
17
Dec
18
Feb
20
% residents in employment
Edinburgh Scotland

25
Sources: Annual Population Survey & ONS, Job quality indicators in the UK – hours, pay and contracts: 2018xxii
• Data on Edinburgh’s economic performance during the Covid outbreak is limited at present, but
some key indicators do provide evidence of the scale of impact.
• The number of vacancies available in Edinburgh has dropped to almost half the level recorded in
2019 – a rate of decline almost twice that seen across the UK as a whole.
• Overall, as at July 2020 almost 90,000 jobs in Edinburgh were being supported by the UK
Government’s furlough schemes. 75,000 jobs were being supported by the Coronavirus Job
Retention Scheme, with a further 12,600 supported by the Self Employment Support Schemexxiii.xxiv
Source: Institute for Employment Studies, Monthly vacancy analysis: Vacancy trends to week-ending 13 September
2020xxv
Job Retention Scheme claims received up to the end of 31 May 30 June 31 July
Edinburgh 58,400 69,500 75,000
Scotland 628,200 736,500 779,500
UK 8,696,000 9,373,900 9,601,700
Source: Coronavirus Job Retention Scheme statistics: August 2020
4.2%4.6%4.6%4.7%4.7%
5.7%5.8%
6.2%6.2%
7.5%7.5%
Bradford
Liverpool
Scotland
Leeds
United Kingdom
Birmingham
Glasgow
Bristol
Manchester
Sheffield
Edinburgh
Non-permanent employment as % of all jobs (annual average 2018-2020)
36.8%
27.9%
27.1%
25.5%
23.5%
23.4%
22.5%
20.7%
20.3%
Edinburgh
Bradford
Sheffield
Glasgow
Manchester
Birmingham
Liverpool
Bristol
Leeds
Proportion of residents in Employment not in quality work, UK Cities 2018
-41%
-47.20%
-20%-25%
-50%
-40%
-30%
-20%
-10%
0%
since 15th March since August 2019
Change in new vacancies notified, August 2020 vs March 2020 & August 2019
Edinburgh UK

26
Self-Employment Income Support Scheme claims
received up to the end of
31 May 30 June 31 July 31 Aug
Edinburgh 14,200 15,000 15,300 12,600
Scotland 146,000 155,000 157,000 126,000
UK 2,380,000 2,553,000 2,604,000 2,019,000
Source: Self-Employment Income Support Scheme statistics: August 2020

27
6. Places
• In September 2020, the City of Edinburgh Council published a second iteration of its Rapid
Rehousing Transition Planxxvi. This plan provides detailed analysis of housing, homelessness, and
temporary accommodation trends in the city and is the source of all data presented in this section.
Housing need in Edinburgh
• The latest Housing Need and Demand Assessment (HNDA2) states that there is demand for at least
38,000 to 46,000 new homes in Edinburgh over ten years, over 60% of these need to be affordable.
The Council has committed to building 10,000 social and affordable homes over the next five years
with a plan to build 20,000 by 2027. The latest Strategic Housing Investment Plan (SHIP) 2020 -
2025 sets out a programme which would deliver 9,500 homes over the next five years.
Housing tenure and social housing
• Edinburgh has one of the lowest proportions of social housing in Scotland with only 14% of homes
in Edinburgh being social housing compared to a Scottish average of 23%. Owner occupier is the
most prevalent tenure in Edinburgh with 59% of homes in this category and 25% Private Rented
Homes in Edinburgh, compared to a Scottish average of 14%. There is high demand for social
housing in the city with just under 24,000 applicants registered on EdIndex (the Council’s common
housing register) as at the end of March 2020. There was an average of 203 bids for every property
advertised for rent in 2019/20.
• Over 72% of Council homes in Edinburgh are allocated to homeless households, compared with the
national average is 41%. 51% of Registered Social Landlords (RSLs) Choice Partner homes are
allocated to homeless households, higher than the national average of 40%.
• There are on average 3,130 additional households every year whom the Council has a statutory
duty to provide settled accommodation to, compared to an annual average of approximately 2,500
social lets available from the Council and RSL’s. Even with all the social lets made available to
homeless applicants, there would still be a shortfall to meet the needs of all homeless households
and would mean no available properties for other households with a priority need for housing
including those in the reasonable preference categories as defined in Housing (Scotland) Act 2014.
Private Rented sector and Short Term Lets
• Edinburgh has a buoyant Private Rented Sector with 25% of all homes in the city being in this
sector. However, affordability in this sector remains a challenge. The gap between the Local
Housing Allowance (LHA) and the average private rent in the city has been increasing year on year.
Prior to COVID -19 data from Citylets indicated that the average advertised rent in the city was
£1,148 per month (Citylets data hub Q3 2019). Glasgow had the next highest advertised rent at
£803 per month.

28
Sources: Citylets, Scottish Monthly Rent Analysis; Office for National Statistics, Annual Survey of Hours and Earnings
• As part of the UK Government’s response to COVID-19 LHA rates were increased in April 2020 and
will remain at this rate until the end of March 2021.The Edinburgh LHA rate is part of the Lothian
Broad Rental Market Area (BRMA), which is made up of Edinburgh, East Lothian and Midlothian. All
LHA rates for this year are now equivalent to the 30th percentile rate. This has increased the
amount of LHA a household will receive and will therefore reduce the gap between LHA and rent
levels in the city. However, households who are benefit dependent may be subject to benefit
capping so private rented accommodation may still be unaffordable.
• The most recent Citylets data is only available at present up to the end of March 2020 so does not
reflect any changes to the private rented property market arising from the COVID-19 pandemic.
However, even at this time the average rent price in Quarter 1 of 2020 had dropped slightly from
£1,148 in Quarter3 to £1,142. Desktop research has found that it is currently possible to get a one
bedroom property in Edinburgh within the LHA rate. Citylets also report that there has been an
increase in the availability of stock in Edinburgh, with many short term let landlords, such as AirBnB
landlords, seeking to market their property on a longer term basis. Whilst this is positive, it is not
-10%
0%
10%
20%
30%
40%
50%
60%D
iffe
ren
ce fr
om
Ind
ex 2
010
Q1
Average Rent prices in Edinburgh (all beds) versus inflation & earnings
Edinburgh Wage Edinburgh Rent CPI
20%
25%
30%
35%
40%
45%
2008 2009 2010 2011 2012 2013 2014 2015 2016 2017 2018 2019
Rent affordability, % of monthly pay spent on rent
Edinburgh Scotland

29
yet clear what the impact will be of the easing of lockdown measures and it is as yet unclear as to
what LHA rates will be set at after March 2021.
• Local authorities can apply to Scottish Ministers to have an area designated as a Rent Pressure Zone
(RPZ) if they can prove that rents are rising by too much; the rent rises are causing undue hardship
to tenants; and there is increasing pressure to provide housing or subsidise the cost of housing as a
consequence of the rent rises with the proposed zone.
• Private rents in an RPZ can only be increased once a year and are capped at CPI + 1% + n%, where n
is to be agreed by the Ministers. Under the current legislation and guidance, designation of RPZ will
only affect rent rises once tenancies have started. Initial rents for new tenancies are not affected by
the cap and will continue to be market-led.
• The increased popularity of Short Term Lets (STLs) is considered to have an adverse impact on the
housing supply and private rent levels in the city. It is estimated that there is a loss of around 10%
of traditional private lets to STLs in recent years. Between 2014 and 2017 the city saw 2,700 more
properties per year listed as available on Airbnb, while private rented stock fell by 560 per annum.
Homelessness assessments
• There were 3,355 households assessed as homeless, or threatened with homelessness in 2019/20,
a rise of 5% on the previous year (3, 207). Of these 3,310 households were assessed as
unintentionally homeless or threatened with homelessness. A total of 3,535 homeless assessments
were completed in 2019/20.
Homelessness by Cause, Edinburgh, 2018/19-2019/20 Number
% of total
2018/19 2019/20 2018/19 2019/20
Domestic ejection 1140 1172 34% 34%
Dispute, violent or non-violent 743 849 22% 24%
Tenancy loss - LA 102 91 3% 3%
Tenancy loss - RSL 163 138 5% 4%
Tenancy loss PRS 710 648 21% 19%
Institution 157 161 5% 5%
Other 325 431 10% 12%
Total 3340 3490 100% 100%
Source: City of Edinburgh Council, Rapid rehousing transition plan – second iteration
• In 2019/20, 96% of all homeless assessments in Edinburgh were assessed as unintentionally
homeless or threatened with homelessness, compared with 81% across Scotland.
• As of 31st March 2020 there were 4,135 cases where the Council had a duty to provide settled
housing. This is an increase from 2019 when there were 3,454 cases where the Council had a duty
to provide settled housing.
• In 2019/20 the three main reasons given as the reason for presenting as homeless were domestic
ejection (34%), dispute violent or non – violent (24%) and tenancy loss (20%).

30
• The length of time to close a case has been steadily increasing since 2012/13. This has led to both
an increase in the number of open cases at the end of a year and in the average time to close a
homeless case. In 2019/20 the average time taken to close a case for applications assessed as
homeless or threatened with homelessness now stands at 379 days, a rise of 7% on 2018/219 when
the average was 354 days.
• Data for 2019 /20 shows that the percentage of households rough sleeping prior to having a
homeless assessment has fallen to 9% of households having slept rough at least once in the 3
months prior to assessment, and 5% having slept rough the night before they presented as
homeless. It should be noted that the Council does not see all rough sleepers; as some are reluctant
to approach the local authority for help and others have no recourse to public funds. Prior to Covid-
19 it was estimated that there were between 80 – 120 rough sleepers on any one night in
Edinburgh.
Temporary Accommodation
• For the past two years 58% of people having a homeless assessment have accessed temporary
accommodation. Additionally, the average length of stay in temporary accommodation has
increased from 278 days in 2018 /19 to 282.5 days in 2019/208.
• The demand for temporary accommodation in Edinburgh has been steadily rising over recent years.
The number of households in temporary accommodation on 1st of each year has risen from 1,205
in 2015/16 to 2,098 in 2019/20, an increase of 74%. In addition, there are approximately 1,300
households in Private Sector Leasing (PSL) properties at any one time.
• The percentage of people who have had a homeless assessment and have been provided with
temporary accommodation has remained static over the past two years, at 58% in 2018/19 and
2019/20. This followed a steady rise from 2015/16 (51%) to 2017/18 (59%).

31
Appendix 1 – Methodology and target setting
Summary
• No single externally published dataset is available to provide robust and annually updatable
estimates of baseline poverty in Edinburgh and lower geographies
• As such, estimates of poverty in Edinburgh have been based on analysis of available Scottish
Government and DWP/HMRC published datasets.
• Using this approach, it is estimated that 76,700 people live in poverty in Edinburgh in 2016-19,
including 14,600 children. These imply an all ages poverty rate of 15% slightly lower than the
Scotland average of 19%, and a child poverty rate of 18%, lower than the Scottish average of 24%.
• Edinburgh Poverty Commission targets:
o Target 2: to ensure no one in Edinburgh is destitute by 2030 the city needs to aim to
remove 7,000-9,000 people in Edinburgh out of destitution, or 580-750 people per annum
o Target 3: to ensure that fewer than one in ten people are in poverty at any given time by
2030 the city needs to remove 20,900 people from poverty, or 2,100 per annum
o Target 4: to ensure that no one in Edinburgh lives in persistent poverty by 2030 the city
needs to remove 9,970 from persistent poverty, or some 1,000 people per annum.
Introduction
This background note provides an approach to quantifying the four core targets set out in A Just Capital:
Actions to End Poverty in Edinburgh. In doing so it aims to: contextualise the targets, put in place
quantifiable metrics to describe the scale of the challenge, provide a focus for efforts to end poverty in
Edinburgh, and provide a basis for measuring the success of changes implemented in response to the
commission’s work.
The approach taken to quantification is built on a basic set of principles:
• Measurement draws from publicly available published datasets.
• Where possible, the approach uses datasets which are current, and updated on a regular,
predictable schedule.
• Where modelling, assumptions or estimation approaches are required, these are transparent and
easily replicable.
The targets
A Just Capital: Actions to End Poverty in Edinburgh sets out four targets for the city over the next ten years,
stating that ‘by 2030 we want to see achievable, measurable progress towards a city where:
• No-one in Edinburgh feels stigmatised because of their income

32
• No-one in Edinburgh has to go without the basic essentials they need to eat, keep clean and stay
warm and dry
• Fewer than one in ten children and fewer than one in ten adults are living in relative poverty at
any given time, and
• No-one lives in persistent poverty
Baseline poverty levels in Edinburgh
Appraisal of source datasets
The first step in setting measurable targets involves establishing a robust baseline level of poverty in
Edinburgh. This has historically been a challenging task given that no official statistics are published on
levels of relative poverty below the national/regional level. Previous estimates have traditionally relied on
either one off bespoke models and surveys, analysis of commercial datasets and surveys (such as Experian
Mosaic, or CACI Paycheck), or modelling based on SIMD or local income related benefits recipient data.
For this analysis an appraisal of 5 available datasets providing analysis of poverty in Scotland shows that:
• Poverty and Income Inequality in Scotland 2016-19 – published by the Scottish Government,
provides an annual wide ranging, comprehensive analysis of poverty and income inequality data for
Scotland both before and after housing costs. Based on and consistent with HMRC’s annual
Households Below Average Income (HBAI) dataset. No estimates are provided for local authority or
lower geographies. Last published March 2020 with data reporting to 2019.
• Children in low income families. This new publication from DWP and HMRC provides official
experimental statistics on the number of children living in low income families across the UK. Data
is published on an annual basis, providing estimates broken down to region, local authority, and
electoral ward across Scotland and the rest of the UK. Main drawbacks are that the dataset focuses
on Child Poverty only, provides a different estimate of Child poverty to that published in the HBAI
based datasets, and is published on a before housing costs basis only. Last published in March 2020
with data reporting to 2019.
• Local indicators of child poverty. Commissioned by End Child Poverty Coalition and produced by
Juliet Stone and Donald Hirsch of Loughborough University Centre for Research in Social Policy. This
analysis provides modelled estimates of child poverty in all UK regions, including analysis by local
authority and electoral ward, though no estimates of poverty amongst other age groups were
provided. The analysis is provided before and after housing costs and, until 2019 was published on
an annual basis. Since the release of the new DWP/HMRC data noted above it is understood that
this analysis will not be continued. Last published in May 2019 with data reporting to 2017/18.

33
• Small Area income estimates. Commissioned by the Scottish Government and produced by I-
SPHERE at Heriot-Watt University in association with David Simmonds Consultancy. The analysis
provides local income and relative poverty estimates for local authorities and datazones in all areas
of Scotland. Only before housing cost estimates are provided, no age breakdown is provided, and
poverty estimates are not constrained to any national estimates to allow comparison with HBAI
derived datasets. Last published in 2017 with data reporting to 2014.
• Children in families with limited resources 2014-2017. Based on data drawn from the Scottish
Household Survey, this Scottish Government analysis provides experimental statistics on children in
combined low income and material deprivation. The data provides estimates of relative income
poverty and material deprivation for all local authority areas in Scotland, both before and after
housing costs. The analyses are based on relatively small sample sizes, however, so confidence
intervals are very wide on these estimates. Estimates are not constrained to other national
datasets, so do not allow comparison with other HBAI derived estimates. Last published in 2019
with data reporting to 2014-17.
Setting the baseline
Based on this analysis, the approach taken to setting a baseline assumes that no single dataset is available
that provides a robust estimate of poverty in Edinburgh and meets all the needs of this analysis (current,
annually updated, available at local authority level and below). As such, a composite approach is needed
which combines available dataset alongside some limited modelling or assumptions.
The approach used in this analysis to meet this requirement is as follows:
1. Poverty estimates for Scotland are taken from the Scottish Government’s Poverty and Income
Inequality in Scotland 2016-19 dataset. As the most up to date and most reliable regularly updated
source, it is proposed that all Edinburgh based estimates are constrained to be comparable against
this dataset.
2. From this national baseline, it is assumed that the spatial distribution of poverty before housing
costs (across local authorities, and to electoral wards) for all age poverty follows the pattern
suggested by estimates of child poverty (i.e. if Edinburgh accounts for 6% of all children in poverty
in Scotland, then the city will account for roughly 6% of all adults in poverty). This is a simplifying
assumption which may under- or overstate the full level of poverty in the city, but it provides a
simple method to use datasets available at local authority level and below to generate an annual
estimate of all age poverty before housing costs at all geographies. Data on spatial distribution of
child poverty before housing costs across Scotland is taken from the new DWP/HMRC estimates of
Children in low income families.

34
3. Since Step 2 only provides a breakdown of before housing cost poverty, a further step is required to
generate an estimate of local poverty after housing costs. To do this, the before housing costs
estimate generated in step 2 is adjusted using an estimate of the ratio of AHC:BHC poverty in
Edinburgh. This ratio is derived from the SHS based Scottish Government analysis of Children in
families with limited resources.
Applying this approach derives the estimates provided in table 1. Overall, the analysis suggests an
estimated of 54,100 people in poverty in Edinburgh before housing costs, and 76,700 in poverty after
housing costs. The analysis assumes that AHC poverty rates are 40% higher than BHC rates in Edinburgh,
compared to an 11% uplift estimated across Scotland as a whole. Poverty rates after housing costs are
estimated at 15% of all individuals, compared to a Scotland average of 19%.
Overall, this analysis suggests that some 22,000 in Edinburgh are in poverty as a result of housing costs (i.e.
are in poverty AHC but not BHC). This is some 10,000 people more than would be in poverty in the city if
the ratio of AHC:BHC in the city were equal to the Scottish average.
Table 1 Setting an Edinburgh poverty baseline, 2016-19
Col Children in low income families, before housing costs (DWP/HMRC estimates), 2016-19a
1 Scotland 161,923
2 Edinburgh 9,733
3 Edinburgh as % of Scotland 6.0%
All age poverty, before housing costs, 2016-19 Number Rate (% of population)
4 Scotlandb 900,000 17%
5 Edinburgh (row4 * row3) 54,096 10%
Ratio of AHC:BHC poverty estimates
6 Edinburghc 1.4
All age poverty, after housing costs Number Rate (% of population)
7 Scotlandb 1,020,000 19%
8 Edinburgh (row5*row6) 76,674 15% Sources:
a – Children in low income families, 2019, DWP/HMRC b – Poverty and Income inequality in Scotland, 2016-19, Scottish Government
c– Children in families with limited resources, 2019 Scottish Government
An extension of this approach implies the breakdown of poverty by electoral ward and age group in
Edinburgh (again, relying on spatial distributions at the ward level implied by DWP/HMRC analysis).

35
Setting the targets
Target 1: No-one in Edinburgh feels stigmatised because of their income
Establishing baselines and quantified metrics for this indicator has been particularly challenging. No data
sources for the UK or Scotland are available which estimate the number of people who feel ‘stigma’ due to
their income or wealth. The closest available proxies this analysis has found have focused on the number of
people who feel stigma associated with claiming benefits1. While useful as contextual analysis, it is not felt
that these sources provide a strong enough basis for a metric against this target. As such it is proposed that
no quantifiable measure or baseline can be set for this target.
Target 2: No-one in Edinburgh has to go without the basic essentials they need to
eat, keep clean and stay warm and dry
Fitzpatrick et al (2016)2 provide a valuable analysis on the spatial distribution and causes of destitution in
the UK. In their analysis people are considered destitute if they are in relative poverty (with equivalised
incomes less than 60% of the UK median after housing costs) and they or their children have lacked two or
more of six essentials over the past month because they cannot afford them (shelter, food, heating,
lighting, clothing, or basic toiletries).
Within Edinburgh, Bramley et al estimate that 2.1-2.7% of all households experienced destitution in 2015.
With the average size of a destitute household estimated at some 1.38 persons, this implies that destitution
affected 1.3-1.7% of the total population of the city in 2015.
Applying this rate to 2019 population data finds a destitute population of 7,000-9,000 people in Edinburgh
at baseline. To meet the target of no-one destitute by 2030 implies a policy target of removing 580-750
people out of destitution each year from 2020-2030.
1 Baumberg, B. (2016). The stigma of claiming benefits: a quantitative study 2 Suzanne Fitzpatrick, Glen Bramley, Filip Sosenko, Janice Blenkinsopp, Sarah Johnsen, Mandy Littlewood, Gina Netto and Beth Watts (2016), Destitution in the UK

36
Table 2 Target 2: number of people to remove from destitution each year 2020-2030
Low High
Destitution Ratea % households, 2015 2.1% 2.7%
All Householdsb HH Population 2015 229,650 229,650
Destitute Households (est) 2015 4,823 6,201
Destitute Persons (est) 2015 6,655 8,557
All personsb Population 2015 498,810 498,810
Destitution as % of persons (est) 2015 1.3% 1.7%
Population, 2019b
524,930 524,930
Destitution 2019 (est) 7,004 9,005
Target Number of people to remove from destitution each year
2020-2030
584 750
Sources:
a: Fitzpatrick et al (2016), Destitution in the UK
b: National Registers of Scotland Population estimates
Target 3: Fewer than one in ten people are living in relative poverty at any given
time
The analysis above estimated baseline poverty levels in Edinburgh after housing costs at 76,700 people, or
15% of the total population. As table 3 shows, given projected population increases, by 2030 a poverty rate
of 1 in 10 of the population would imply a total of 55,800 people living in poverty. As such, to meet the
target implies the removal of 20,900 people from poverty over the next ten years, or an average of 2,100
per year.
Table 3 Target 3: Fewer than 10% of people in poverty at any given time by 2030
Edinburgh
2019 Poverty at baseline rate 76,674
2030 population (National Register of Scotland projection) 558,219
Poverty at 10% in 2030 55,822
No. removed from poverty 20,852
Per annum 2,085
Target 4: No-one lives in persistent poverty
Scottish Government analysis suggests that an individual is in persistent poverty if they have been in
poverty for three or more of the last four years. This measure is important because the longer someone is
in poverty, the more it impacts on their health, well-being, and overall life chances.

37
Latest estimates show that some 13% of all people in poverty in Scotland are in ‘persistent poverty’. No
estimates are published for lower geographies, but applying the same rate to Edinburgh suggests that an
estimated 9,970 people are in persistent poverty in the city in 2016-19. As such, meeting the target
assumes a policy framework aimed at removing almost 1,000 people from persistent poverty each year
over the ten year period 2020 to 2030.
Table 4 Target 4: No-one lives in persistent poverty
Persistent Poverty, Scotlanda 13%
Edinburgh all age poverty 76,674
Persistent poverty, Edinburgh 9,968
Target
no. to be removed from persistent poverty 2020-30 9,968
no. to be removed from persistent poverty per annum 997
Sources: a- Persistent Poverty in Scotland 2010-2018, Scottish Government

38
References and sources
i Scottish Government, Poverty and Income Inequality in Scotland 2016-19, available via https://www.gov.scot/publications/poverty-income-inequality-scotland-2016-19/ ii Brook, Paul et al (2019), Framing Toolkit: Talking About Poverty, Joseph Rowntree Foundation & Frameworks Institute, available via https://www.jrf.org.uk/blog/five-doodles-help-make-sense-uk-poverty iii All statistics in this section are sourced from Scottish Government, Poverty and Income Inequality in Scotland 2016-19, available via https://www.gov.scot/publications/poverty-income-inequality-scotland-2016-19/ iv DWP and HMRC, Children in low income families: local area statistics 2014/15 to 2018/19, available via https://www.gov.uk/government/statistics/children-in-low-income-families-local-area-statistics-201415-to-201819 v See appendix 1 vi Scottish Government, Scottish Index of Multiple Deprivation 2020, available via http://www.gov.scot/collections/scottish-index-of-multiple-deprivation-2020/ vii DWP and HMRC, Children in low income families: local area statistics 2014/15 to 2018/19, available via https://www.gov.uk/government/statistics/children-in-low-income-families-local-area-statistics-201415-to-201819 viii Scottish Government, Tackling child poverty delivery plan: forecasting child poverty in Scotland, available via https://www.gov.scot/publications/tackling-child-poverty-delivery-plan-forecasting-child-poverty-scotland/pages/0/ ix Resolution Foundation, Living Standards Outlook 2019, available via https://www.resolutionfoundation.org/publications/the-living-standards-outlook-2019/ xScottish Government, State of the Economy, September 2020, available via https://www.gov.scot/publications/state-economy/ xi Institute for Fiscal Studies Coronavirus research, available via https://www.ifs.org.uk/coronavirus xii Resolution Foundation, Living Standards, Poverty and Inequality in the UK, available via https://www.ifs.org.uk/publications/14901 xiii ibid xiv The Poverty Alliance and Scottish Poverty and Inequality Research Unit, Citizen’s Perspectives on Poverty in Edinburgh, available via https://edinburghpovertycommission.org.uk/2020/09/23/what-people-in-edinburgh-think-about-poverty/ xv The Poverty Alliance, Poverty in Edinburgh: the Key issues, available via https://edinburghpovertycommission.org.uk/2019/12/19/report-calls-for-action-to-loosen-the-grip-of-poverty-in-edinburgh/ xvi EVOC, Mind the Craic, available via https://www.evoc.org.uk/wordpress/wp-content/media/2020/09/EVOC_MIND-THE-CRAIC_AUG20_WEBRES_FINAL.pdf xvii Scottish Government, Poverty and Income Inequality in Scotland 2016-19, available via https://www.gov.scot/publications/poverty-income-inequality-scotland-2016-19/ xviii Annual Survey of Hours and Earnings, available via https://www.nomisweb.co.uk/ xix ONS Claimant Count, available via https://www.nomisweb.co.uk/ xx DWP, Income-Related Benefits: Estimates of Take-up Data for financial year 2017/18
xxi Improvement Service, Local Government Benchmarking Framework, available via https://www.improvementservice.org.uk/benchmarking xxii ONS, Job quality indicators in the UK – hours, pay and contracts: 2018, available via https://www.ons.gov.uk/employmentandlabourmarket/peopleinwork/employmentandemployeetypes/articles/jobqualityindicatorsintheukhourspayandcontracts/2018 xxiii ONS, Coronavirus Job Retention Scheme statistics: August 2020, available via https://www.gov.uk/government/statistics/coronavirus-job-retention-scheme-statistics-august-2020 xxiv ONS, Self-Employment Income Support Scheme statistics: August 2020, available via https://www.gov.uk/government/statistics/self-employment-income-support-scheme-statistics-august-2020 xxv Institute for Employment Research, Monthly vacancy analysis: Vacancy trends to week-ending 13 September 2020, available via https://www.employment-studies.co.uk/resource/monthly-vacancy-analysis-vacancy-trends-week-ending-13-september-2020 xxvi City of Edinburgh Council, Rapid Rehousing Transition Plan – second iteration, available via democracy.edinburgh.gov.uk/documents/s26277/Rapid%20Rehousing%20Transition%20Plan%20Report.pdf