poverty lines around the world: a new methodology and internationally comparable estimates
TRANSCRIPT

International Labour Review
, Vol. 145 (2006), No. 4
Copyright © International Labour Organization 2006
Poverty lines around the world:A new methodology and internationally
comparable estimates
Richard ANKER
*
t the national level, poverty reduction is a major policy goal around
A
the world. At the international level, halving the world povertyrate by 2015 is arguably the most important of the United Nations Mil-lennium Development Goals. The allocation of resources in nationalbudgets and international development aid is therefore affected by theprogress and relative position of countries as regards poverty reduction.
Yet, despite the importance of poverty as a focus of policy, itsmeasurement at the international level remains problematic. The mostwidely used methodology – the World Bank’s poverty lines of US$1 aday and US$2 a day – raises serious problems, and even the WorldBank acknowledges that its methodology is not suitable for measuringnational poverty lines and is only appropriate for making regional andglobal estimates (World Bank; Ravallion, 2001). Several researchershave indeed questioned the relevance and accuracy of the WorldBank’s global estimates of poverty (e.g., Deaton, 2001; Reddy andPogge, 2003). And while an increasing number of countries now esti-mate a national poverty line, their estimates are not comparable.
This article describes and uses a new methodology the author hasdeveloped for measuring internationally comparable national povertylines, drawing on several disciplines and online data sources includingon economics, poverty, nutrition, statistics and demography. This newmethodology uses the same approach that many countries use to esti-mate their own national poverty line but does this in a consistent andinternationally comparable manner.
* Political Economy Research Institute (PERI), University of Massachusetts, Amherst, MA.Responsibility for opinions expressed in signed articles rests solely with their authors and
publication does not constitute an endorsement by the ILO.

280
International Labour Review
The proposed new methodology offers a number of advantages,especially compared to the World Bank’s US$1 and US$2 a day povertylines.
●
The methodology has a normative basis.
It starts with the establish-ment of a low-cost nutritious diet – in contrast with the World Bankmethodology based on overall purchasing power parity (PPP),which is not conceptually appropriate for measuring poverty.
●
The methodology uses the same approach as that used by mostcountries to
estimate their own national poverty line
.
●
The methodology is relevant for all countries
and not just for low-income and lower middle-income countries as is the case with theWorld Bank’s methodology. This is important because povertyoccurs in all countries.
●
Estimates are easy to understand.
Poverty lines are based on modeldiets, food costs and non-food costs. This means that laypersonscan understand what poverty means in terms of living standards.This contrasts with the World Bank US$1 and US$2 a day PPPmethodology, which makes it very difficult for people to knowwhat the PPP of US$1 a day means, or what it means to express thisPPP for a particular year. For example, being poor in India accord-ing to the new methodology means only being able to afford a cupof milk every fourth day, an egg every ninth day, a serving of meatevery twelfth day, and only about US$16 at the official exchangerate each month (approximately US$100 in World Bank PPP) forall non-food needs for a household of four.
●
The basis for estimates is transparent.
The assumptions used to cal-culate national poverty lines in the new methodology are clearlystated. World Bank PPPs, by contrast, are based on complex calcu-lations and assumptions that are not readily available.
●
The assumptions used can be easily modified
, because estimates aremade in electronic spreadsheets. This also makes it possible toobserve how sensitive estimates are to changes in assumptions.
●
National estimates can be made for approximately 100 countries usingonline data
.
●
The methodology is relatively inexpensive to employ
, since the re-quired national data are available online for free, and
estimates canbe updated regularly at minimal cost
, because the necessary onlinedata are updated regularly. This contrasts with the World Bankmethodology that relies on PPPs that are not available for manycountries. In addition, because PPPs are expensive to estimate, theyare generally benchmarked only every several years and updatedannually using national consumer price indices (CPIs), which isproblematic especially in high-inflation countries. Also, PPPs are

Poverty lines around the world: A new methodology
281
subject to substantial changes when new benchmark estimates aremade.It is important to recognize that poverty measurement necessarily
involves subjectivity and judgment. In addition, the international com-parability of poverty line estimates is complicated by some unavoidableand difficult issues (such as differences across countries in the availabil-ity and value of free public goods and services, value of self-consump-tion of home production, taxes paid by the poor, and intra-countrydifferences in the prices paid by the poor and the non-poor). Althoughconsiderable effort was made to base assumptions in the new method-ology on empirical evidence (see Anker, 2005), improvements andrefinements are always possible, especially as additional relevant cross-national data become available.
The remainder of this article is structured into five sections. The firstis concerned with poverty line definitions, the necessary subjectivity in-volved in setting a poverty line, and sensitivity of the poverty rate to thesetting of a given poverty line. The second describes conceptual andmeasurement limitations of the World Bank poverty lines. The third sec-tion describes the new methodology proposed here for measuring inter-nationally comparable national poverty lines, including some limitations.The fourth section uses this methodology to estimate national povertylines for 12 countries and evaluates these estimates by comparing them tothe corresponding national poverty lines estimated by the World Bankand the poverty lines estimated by the countries themselves. The fifth sec-tion provides conclusions. For reasons of parsimony, reference is some-times made to a recent ILO working paper by the author (that can beobtained from the ILO) in which the new methodology and its applica-tion are described in detail (Anker, 2005).
Definition of poverty line, necessary subjectivity,and effect on reported poverty rate
Measurement of poverty dates back at least to the famous 1899study of the city of York in northern England by B. Seebohm Rowntree(1908). Definitions of poverty commonly refer to the need for a min-imum standard of living, and are generally measured by the resourcesor income required to achieve this. These are money- or consumption-based definitions of poverty. Typical definitions thus include:
●
“Earnings insufficient to obtain the minimum necessaries for themaintenance of merely physical efficiency.” (Rowntree, 1908)
●
“The inability to obtain a minimum standard of living.” (World Bank,1990).
A similar definition of poverty is used in the new methodology describedin this article, namely:

282
International Labour Review
●
Income necessary to be able to afford a low-cost nutritious dietand non-food necessities at levels considered acceptable for thecountry.It is important to recognize that estimating a national poverty line
requires assumptions and judgment
(see below for a description of howthis is typically done by countries). Subjectivity
has
to be present,because every society has its own view of what constitutes an accept-able minimum standard of living. At the same time, national consensusis forever changing. This implies that what is considered acceptablechanges over time within countries and differs across countries. Forexample, television, recreation and high-tech medical care may be seenas necessary in high-income countries in the twenty-first century, butnot in low-income countries today or in high-income countries in themid-twentieth century. Also, some expenses may become necessary asa country develops and urbanizes. For example, it may be possible andacceptable to live in makeshift or mud housing in poorer countries butnot in higher-income countries. Even what is considered an acceptablediet in a given country changes over time with increasing per capitaincome, as people come to feel that greater quantities of higher-costfoods such as milk and meat are required.
The need for judgment also plays out when establishing inter-nationally comparable poverty lines. For example, it is necessary to estab-lish acceptable model diets for poor persons in countries at differentdevelopment levels and the amount of money the poor need for non-foodnecessities.
An important issue for the international comparability of nationalpoverty lines is whether or not they should have the same real value forall countries. The approach taken in this article is based on the view thatthe real value of national poverty lines should increase with economicdevelopment and per capita income, because social norms change withdevelopment. For this reason, the proposed new methodology esti-mates national poverty lines using the same principles for all countries,with some parameters varying by development level to reflect changingsocietal norms.
1
Thus, as long as a country stays at the same develop-ment level, its poverty line would change over time along with changesin food costs. But if the country changes its development level, therewould be an adjustment to its poverty line to reflect changes in themodel diet and non-food needs that are consistent with the norms of itsnew development level.
Countries face a similar dilemma about whether or not to use thesame real poverty line over time. While measuring the current povertyrate requires an up to date poverty line that reflects current norms about
1
The four development levels used in the new methodology are as defined by the WorldBank on the basis of per capita income.

Poverty lines around the world: A new methodology
283
basic needs, monitoring changes in the poverty rate over time requires afixed poverty line in real terms that only changes with inflation so thatsuccess in reducing poverty is not judged against a moving target (see, forexample, Deaton, 2001). Countries have faced this dilemma in differentways.
The United States and India, for example, have opted to setnational poverty lines that are increased over time by inflation, therebyleaving them unchanged in real terms over time. The official povertyline in the United States was first accepted in 1969,
2
based on informa-tion from 1955 and 1961, and India’s official poverty line was firstaccepted in 1979,
3
based on information from 1972-73. Indonesia, incontrast, changes its poverty line over time based on new data andobserved behaviour. Analysis from the United States and India demon-strate the large impact that changing the poverty line to reflect currentnorms would have on the poverty line itself and on the observedpoverty rate. According to the National Academy of Science, theUnited States poverty line would have been between 14 and 33 per centhigher than the official poverty line in 1992 (Fisher, 1999). IndianNational Sample Survey (NSS) data reported in Joshi (1997) show thatadjusting the diet and the food/non-food expenditure ratio to changesin observed behaviour would have raised India’s poverty line byapproximately 49 per cent in rural areas and 23 per cent in urban areascompared to the official poverty lines between 1973-74 and 1993-94.This, in turn, would have increased the poverty rate in India from 42 percent to 75 per cent in urban areas and from 42 per cent to 58 per cent inrural areas.
There is clear evidence that the national poverty rate is sensitiveto changes in the value of the national poverty line (see Anker, 2005).For a large increase in the poverty line of around 50 per cent, elasticitiesrange from about 1.4 for India to about 2 for Armenia and China, forexample.
4
For a small increase in the poverty line of about 3 per cent,elasticities range from around 3 in the United States to about 4 in Egypt,for example.
2
The poverty line food basket originally used in the United States was based on a food plandeveloped in 1961 by the Department of Agriculture for emergency purposes (Cofer, Grossmanand Clark, 1962), and the ratio between food and non-food expenditures was based on results froma 1955 expenditure survey.
3
The official poverty line in India, which was originally established on the basis of behav-iour observed in a 1972-73 National Sample Survey (NSS), was set at the income level of house-holds which consumed the number of calories per capita that was felt to be required (2,400 caloriesper day for rural areas and 2,100 calories per day for urban areas). This definition of poverty is notequivalent to having low income. For example, according to 1999-2000 NSS data, 38 per cent ofhouseholds in the top income quintile in West Bengal do not have sufficient calories. One reasonfor this is that the 2,400 calorie requirement used for rural areas was probably too high.
4
Elasticity is the ratio of the percentage change in one variable (e.g. poverty rate) to thepercentage change in another variable (e.g. poverty line).

284
International Labour Review
Conceptual and empirical problems with the World Bank methodology
Before describing the new methodology, it is useful to discuss someof the conceptual and empirical issues and problems that arise withnational poverty lines based on the World Bank definitions of US$1 PPPa day and US$2 PPP a day in light of their widespread use. The WorldBank’s original definition of US$1 PPP a day was selected by “eyeball-ing” a graph (i.e. using visual approximation) with only six poverty linesfor “poor” countries in 1985 PPP (World Bank, 1990).Values rangedfrom US$0.61 PPP to US$1.14 PPP. The current US$1 PPP a day defin-ition is expressed in 1993 PPP and was estimated by taking the median ofthe ten lowest national poverty lines of the 33 countries for which datawere available to the World Bank in 1999 (Chen and Ravallion, 2004).The US$2 a day definition in both instances was obtained in an ad hocmanner simply by multiplying US$1 per day by 2 (World Bank, 2001).
First, the most fundamental problem with the World Bank meth-odology is that it is inappropriate conceptually to use PPPs to estimatenational poverty lines. According to Ravallion (2001) of the WorldBank, “... at the country level, poverty monitoring is based on povertylines considered appropriate in each country. The PPP rates arerequired only for forming regional or global aggregates. …
PPPexchange rates were not designed for the purpose of making internation-ally comparable poverty lines, but rather for making comparisons ofaverage national income and consumption”
.
5
Deaton (2003) elaborateson this:
“PPPs price a representative bundle of goods in each countryand compare the local cost of the bundle with the U.S. dollar cost of thesame bundle. ... Although it might be argued that changes in the pricesof beans and rice ought to change the relative poverty lines of Brazil-ians and Indians, it is much harder to make the case for changes in theworld price of oil. Even in theory, PPP exchange rates as currentlydefined are not designed to convert poverty bundles”. This means thatit would be wrong to place confidence in particular national povertyline estimates based on the World Bank’s PPP methodology. This isconsistent with the World Bank observation that national poverty linesof low-income countries vary greatly around an approximate US$1 PPP
average
(World Bank, 1990).Second, as mentioned already, the World Bank’s current definition
of US$1 at 1993 PPP reflects the median of ten poverty lines. Yet it is diffi-
5
(Italics added for emphasis.) Although, as indicated in this quote, the World Bank feelsthat its PPP methodology is appropriate for making regional and international estimates becauseUS$1 PPP and US$2 PPP are supposedly correct on average, relying on counterbalancing over-estimates and underestimates of national values for making regional and global estimates isundesirable in my opinion.

Poverty lines around the world: A new methodology
285
cult to understand the appropriateness of basing an international povertyline on an average of official national poverty lines when these povertylines are not comparable because they are based on different methodol-ogies – and some of them are clearly wrong (e.g. China’s) – and the tencountries used are at different development levels. Also, it is not clearwhy the ten countries with the lowest official poverty lines in 1993 PPPwere used and not some other number of countries, or why the povertylines of countries that were not poor were included (e.g. the poverty linesof Thailand and Tunisia were used while those of Burundi and Kenyawere not).
Third, when national PPPs are revised as improved data becomeavailable, changes in values are common and sometimes inexplicablylarge. In addition, when a national PPP is updated over time using theCPI (as is done between PPP benchmark years), errors may be intro-duced since the inflation rates of goods and services consumed by thepoor and the non-poor may differ. This is most likely to be a problemin high-inflation countries. National PPP values for specific historicalyears often differed even between World Bank sources (
World Devel-opment Report
and
World Development Indicators
database); andnational PPP values for historical years often changed over time in theWorld Bank’s
World Development Indicators
online database. Whilesuch discrepancies were generally small, several were quite large.
Fourth, while the World Bank’s poverty lines of US$1 a day andUS$2 a day are superficially compelling for communicating to the pub-lic about poverty, they lack the transparency and ease of understandingthat statistics on poverty should have for this purpose. For example,World Bank estimates use 1993 PPP and this is not the same as 1985PPP (original poverty line) or the current 2006 PPP. Moreover, theWorld Bank actually uses US$1.08 PPP and US$2.15 PPP and not theUS$1 PPP and US$2 PPP referred to in the media. Indeed, it is not easyto understand what US$1 PPP can actually buy. Furthermore
,
fewknow that a 1993 PPP does not have the same value as the current PPPeven though most might naturally assume that they are the same, giventhat PPP is supposed to provide a measure of relative purchasing powerunaffected by exchange rates.
Fifth, it is surprising to find that the national poverty rates estimatedby countries and reported in the 2004
World Development Report
areconsistently higher than those estimated by the World Bank in the samesource. The national sources give higher poverty rates for over 80 per centof the countries in figure 1 (44 out of 53 countries), and for approximately90 per cent of low-income countries (25 out of 28 countries). On average,
poverty rates were approximately one-third lower according to the WorldBank than according to countries.
This consistent and large underestima-tion of poverty rates around the world by the World Bank is due to a con-sistent underestimation of national poverty lines.

286
International Labour Review
Azer
baija
n
Ban
gla-
deshB
ur-
kina
Faso C
am-
bodi
a
Cam
eroo
nEthi
opia
Geo
rgia
Gha
naIn
dia
Keny
a
Lao
PDR
Mad
a-ga
scar M
alaw
i
Mal
i
Mau
ritan
ia
Mol
-do
va Mon
-go
lia
Moz
ambi
que
Nepal
Nic
arag
ua
Paki
stanSe
nega
l
Tanz
ania Ukr
aine
Uzb
eki-
stan
Yem
en R
ep.
Zam
biaAlba
nia
Alge
ria
Arm
enia
Bel
arus
Bol
ivia
Bul
gariaC
hina Col
ombi
aDom
inic
anR
ep.
Ecua
dorEg
ypt
Gua
tem
ala
Guy
ana
Morocco
Peru
Philip
pine
s
Sri L
anka
Trin
idad and
Toba
go
Chi
le Hun
gary
Pana
ma
Tuni
sia
Estonia
–60
–40
–200204060
Figu
re 1
. D
iffer
ence
bet
wee
n po
vert
y ra
tes
accc
ordi
ng to
Wor
ld B
ank
and
natio
nal s
ourc
es, 5
3 de
velo
ping
cou
ntrie
s (p
erce
ntag
e po
ints
)Percentage point difference
Sou
rce:
Wor
ld B
ank,
200
4a.
Not
e: C
olou
r of
bar
indi
cate
s de
velo
pmen
t lev
el: l
ow-in
com
e
, lo
wer
mid
dle-
inco
me
,
and
uppe
r m
iddl
e-in
com
e
. E
stim
ates
for
high
-inco
me
coun
trie
s ar
e no
t pro
vide
d in
the
sour
ce.
JamaicaJordan
Kyr
gyz
Rep
.

Poverty lines around the world: A new methodology
287
The proposed new methodology
The methodology developed in this article for estimating inter-nationally comparable national poverty lines is described briefly in thissection. A general description is followed by discussions on how foodand non-food costs are estimated. Also discussed briefly are somelimitations of the new methodology. For more detail, readers arereferred to Anker (2005). Before beginning, it is useful to point out thatas with any new methodology and its application, refinements andimprovements in parameters are always possible and desirable.
General description of the methodologyand estimation of food costs
There is a traditional and generally agreed approach in the pov-erty literature and in national practice on how to measure and estimatenational poverty lines. This is the approach used in this article anddescribed below.
6
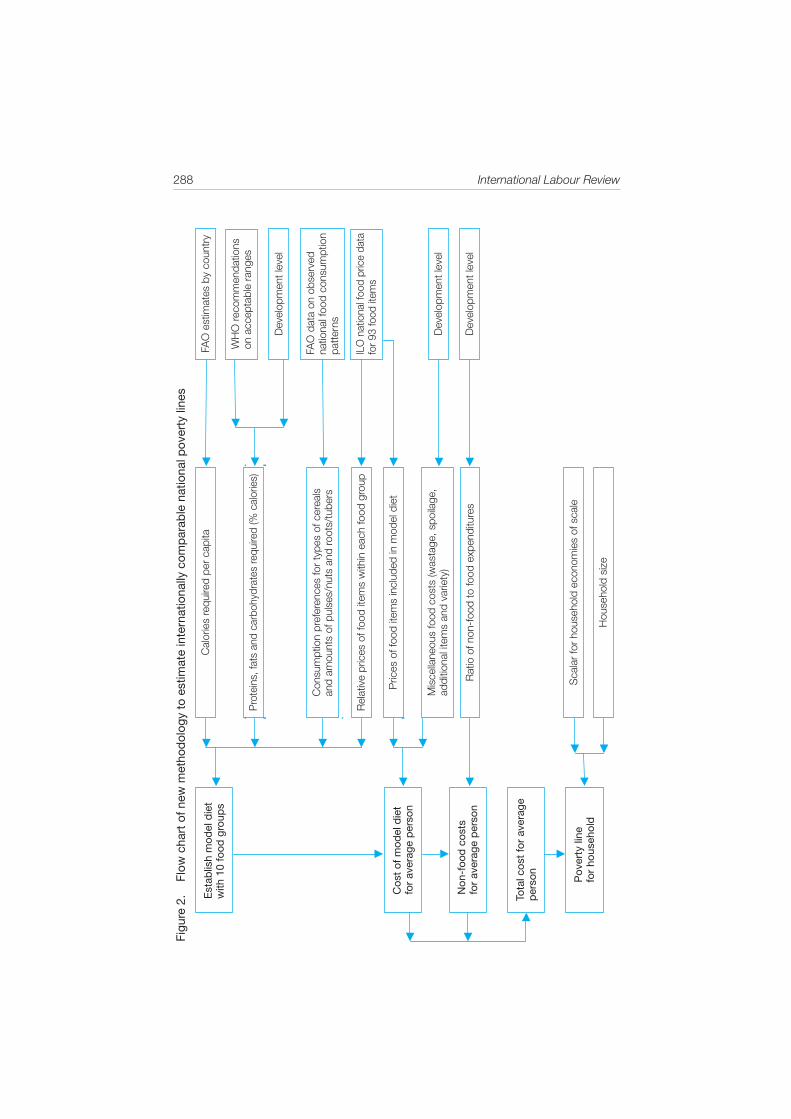
Figure 2 illustrates the new methodology schematically. In the firststep, food costs are estimated by establishing and then costing a modeldiet that: (i) is acceptable nutritionally, (ii) is low cost, (iii) includes tenmajor food groups, and (iv) includes specific food items within eachmajor food group that are consistent with national food preferences andrelative unit food prices.
In the words of Rowntree (1908), one wants “astandard diet that gives adequate nutrition at the lowest practical cost”.WHO/FAO (2003) recommendations on diets are used to ensure thatnational model diets are acceptable nutritionally (i.e. 10-15 per cent oftotal calories from proteins, 15-30 per cent from fats, and 55-75 per centfrom carbohydrates). Unpublished FAO estimates of per capita calorierequirements for an average person in each country – a function of aver-age body size and the age distribution of the population – are used to setcalorie requirements. The FAOSTAT database on observed nationalfood consumption is used to help determine quantities of the major foodgroups to be included in model diets where considerable variation in con-sumption is known to occur across countries (cereals, roots/tubers, andpulses/nuts); in this way, national food preferences are taken into ac-count. Official national food prices for 93 food items reported in an ILO
6
There are other approaches. Some developing countries especially in Asia (such as India,Bangladesh and Indonesia) set their national poverty line at the income level of households thatconsume just above the required number of calories per capita (see below); major problems withthis approach are that it does not consider whether other nutritional requirements or non-foodneeds are met (Ravallion, 1992). Some European countries generally use a relative poverty lineset at a certain percentage (often 50 per cent) of national median disposable income equalized forequivalent consumers (Everaers, 1998); major problems with this approach are that there is dis-agreement about what percentage to use, and that a relative poverty line makes it difficult toobserve progress in reducing poverty.
288
International Labour ReviewFi
gure
2.
Flo
w c
hart
of n
ew m
etho
dol
ogy
to e
stim
ate
inte
rnat
iona
lly c
omp
arab
le n
atio
nal p
over
ty li
nes
Est
ablis
h m
odel
die
tw
ith 1
0 fo
od g
roup
s
Cos
t of
mod
el d
iet
for
aver
age
per
son
Non
-foo
d c
osts
for
aver
age
per
son
Tota
l cos
t fo
r av
erag
ep
erso
n
Pov
erty
line
for
hous
ehol
d
Cal
orie
s re
quire
d pe
r ca
pita
Pro
tein
s, fa
ts a
nd c
arbo
hydr
ates
requ
ired
(% c
alor
ies)
Con
sum
ptio
n pr
efer
ence
s fo
r ty
pes
of c
erea
lsan
d am
ount
s of
pul
ses/
nuts
and
root
s/tu
bers
Rel
ativ
e pr
ices
of f
ood
item
s w
ithin
eac
h fo
od g
roup
Pric
es o
f foo
d ite
ms
incl
uded
in m
odel
die
t
Mis
cella
neou
s fo
od c
osts
(was
tage
, spo
ilage
,ad
ditio
nal i
tem
s an
d va
riety
)
Rat
io o
f non
-foo
d to
food
exp
endi
ture
s
Sca
lar
for
hous
ehol
d ec
onom
ies
of s
cale
Hou
seho
ld s
ize
FAO
est
imat
es b
y co
untr
y
WH
O re
com
men
datio
nson
acc
epta
ble
rang
es
Dev
elop
men
t lev
el
FAO
dat
a on
obs
erve
dna
tiona
l foo
d co
nsum
ptio
npa
tter
ns
ILO
nat
iona
l foo
d pr
ice
data
for 9
3 fo
od it
ems
Dev
elop
men
t lev
el
Dev
elop
men
t lev
el

Poverty lines around the world: A new methodology
289
database are used to ensure that model diets are low in cost. The least ex-pensive food item in each major food group is selected for the model diet.Variation in model diets by development level is introduced by takinginto account differences in food consumption that are known to be associ-ated with income level. In the new methodology, the percentage of totalcalories from proteins (especially from animal-based foods) and thequantities of vegetables, fruits, oils and sugar are assumed to increasewith development level, and the percentage of calories from carbohy-drates (especially cereals) is assumed to decrease with development level.
The national model diet established in the first step shown in fig-ure 2 is then costed using the prices reported in an ILO food price dataset. A rough estimate of miscellaneous food costs is then added, as istypically done by countries when they estimate their own poverty lines.This allows for minimal wastage and spoilage, purchase of typical mis-cellaneous foods (such as coffee, tea, spices, condiments, sauces, salt),and variation in diet beyond the one (and sometimes two) food item(s)included in each major food group in the model diets. Miscellaneousfood costs are assumed to increase with development level in keepingwith observed national practices as regards model diets (for evidenceon this, see Anker, 2005).
7
Non-food costs are estimated by multiplying food costs by a non-food “multiplier” that increases with development level in keeping withknowledge about the relationship between non-food expenditures andfood expenditures (see below).
The poverty line for a household is then estimated by multiplyingthe sum of estimated food cost and non-food cost for an average indi-vidual by a household size “scalar”. This is necessary, because povertyis a household concept and food and non-food costs up to this pointhave been estimated per person.
Estimating non-food costs
The cost of non-food needs is estimated using a ratio of non-foodcosts to food costs. For example, if the poor spend 75 per cent of theirtotal expenditure on food, then non-food costs would represent one-thirdof food costs, and the poverty line would consequently equal 1.33 timesfood costs. This is the most common approach used at the nationallevel to account for non-food costs in the poverty line, because the cost of
7
Wastage and spoilage is assumed to increase from 1 per cent of food costs in low-incomecountries to 10 per cent in high-income countries. Cost for typical miscellaneous foods such as cof-fee, tea, spices, condiments and salt is assumed to increase from 3 per cent in low-income countriesto 10 per cent in high-income countries. Allowance for additional variety within major food groupsis assumed to increase from 4 per cent in low-income countries to 23 per cent in high-income coun-tries. For the empirical evidence on which these reasonably conservative percentages are based,see Anker (2005).

290
International Labour Review
non-food items is known to increase as a percentage of household in-come along with increases in household income at the country level andwith increases in national income per capita at the international level.“The poorer is a family, the greater is the proportion of the total outgo[family expenditures] which must be used for food. … The proportion ofthe outgo used for food, other things being equal, is the best measureof the material standard of living of a population” (Ernst Engel quoted inZimmerman, 1932, p. 80).
To help decide on appropriate non-food multipliers for countriesat different levels of development, information was collected on theassumptions that countries make with regard to the percentage of totalexpenditure for food when they estimate their national poverty line(15 countries) and when they estimate their CPI (75 countries). Table 1presents median values by development level (for national values, seeAnker, 2005). As expected, the values are negatively and stronglyrelated to development level. Also, the values used to estimate CPI areconsistently lower than those used to estimate the poverty line (byaround 10-15 per cent on average). This is what one would expect asCPI is concerned with consumption by the entire population whereasthe poverty line is concerned with consumption by the poor for whomfood expenditures are more important.
The values used in the new methodology for the four developmentlevels are shown in table 1 (last column). They are the median nationalvalues used to estimate poverty lines in table 1 (column 3) after twoadjustments. The food share for low-income countries was increasedfrom 65 to 70 per cent, because this is approximately the median value(71 per cent) found in a much larger sample of 19 low-income countries(Kakwani, 2004) than the four low-income countries on which themedian value in table 1 is based; it also helps create a smooth progres-sion in the food share of expenditure across the four developmentlevels. The food share of expenditure in high-income countries wasreduced from 33 to 25 per cent, because 25 per cent is more consistentwith the much more complete and up to date CPI data for high-incomecountries. Note that the 33 per cent value for high-income countriesshown in the poverty-line column of table 1 is based on a 1955 expend-iture survey in the United States.
Conceptually, the approach used in this article to estimate non-food costs is obviously inconsistent with the normative approach usedto estimate food costs (see, for example, Streeten, 1994). This approachis, however, practical; it provides a reasonable approximation of non-food costs and is sufficiently robust that it is the most commonapproach countries themselves use to estimate their own poverty lines.Nonetheless, the assumed ratio of non-food to food costs has such animportant effect on poverty line estimates that this question deservesfurther thought and empirical investigation in the future.

Poverty lines around the world: A new methodology
291
There are other approaches to measuring non-food costs that aresometimes used at the national level. A basic needs approach establishesand costs a list of essential non-food needs (see Boltvinik, 1994, for a gen-eral discussion; and Martins and Maritz, 2002, for an application to SouthAfrica). The basic needs approach has the virtue of being normative andsimilar to that used to estimate food costs. Unfortunately, the basic needsapproach is difficult to use in practice, especially internationally, becauseit is hard to agree on what items, what quantities and what quality levelsshould be considered essential. Another approach sometimes used bycountries – e.g. India and Indonesia – sets non-food costs at the level actu-ally observed in a household income and expenditure survey amonghouseholds that consume the required number of calories per capita (orhave the income needed to purchase the required calories). But while thisapproach may be practical when the required data exist, it presents anumber of conceptual problems (Ravallion and Sen, 1996). One has toaccept on faith that observed non-food expenditures are sufficient (againdeparting from a normative approach); assume that people are highly ef-ficient in how they buy, store and prepare nutritious food; and live withthe fact that the poverty line would become a moving target changingover time along with changing behaviour. Besides, regardless of their
Table 1. Percentage of expenditure on food used by countries to estimate nationalCPIs and national poverty lines, and values used in new methodology,by development level
Development level (per capita income) Percentage of expenditure spent on food
Used by countries Used in new methodology
CPI weights
a
Poverty line
b
Low 58 65 70
(1.43)
c
Lower middle 45 60 60 (1.67)
Upper middle 34 50 50 (2.00)
High 19 33.3
d
25
e
(4.00)
a
Medians of national values for CPI weights in recent years reported in Anker (2005) based on data for 12 low-income countries, 17 lower middle-income countries, 18 upper middle-income countries, and 28 high-incomecountries.
b
Medians of national values for poverty line reported in Anker (2005), based on data for four low-income countries, seven lower middle-income countries, three upper middle-income countries, and one high-income country. Although values are drawn from different years, they are consistent within each developmentlevel.
c
Value for low-income countries was set at 70 per cent for the reasons noted in the section on estimatingnon-food costs.
d
The United States provides the only value for high-income countries – based on data from anoutdated 1955 household expenditure survey that remains the assumption for official poverty line estimates inthe United States. European Union countries generally estimate relative national poverty lines as a proportion ofnational income per equivalent consumer (often one-half).
e
Value for high-income countries was set at 25 percent, because this is more consistent with the much more complete and up to date CPI data for high-incomecountries.
Sources: For CPI weights: Unpublished ILO data drawn from official national sources.For country poverty lines: Tabatabai (1996) for two low-income countries, three lower middle-income countries,and one upper middle-income country; Joshi (1997) for India; Erdogan (1997) for Turkey; Cervera (1997) for Mex-ico; Rama and Fernandez (1997) for Uruguay; Ravallion and Sen (1996) for Bangladesh; Sangui (2004) for China;Martins and Maritz (2002) for South Africa; Orshansky (1965) for the United States.

292
International Labour Review
possible merits, neither of these alternative approaches is practical for aninternational methodology such as that presented in this article becausethe required data are not regularly available for a sufficient number ofcountries.
Limitations of the proposed methodology
The methodology developed and used in this article necessarilyinvolves assumptions. This section briefly discusses two possible limita-tions – that the poor might pay different prices, and that the poor mightpay taxes. Readers are referred to Anker (2005) for in-depth discus-sions on these and other issues such as self-consumption of home pro-duction, private cost of typical free public goods and services, and debtand interest payment.
The poor might pay different food prices
The food prices used in the new methodology to estimate nationalpoverty lines are almost always based on retail establishment surveysand are the prices that governments use to estimate the official CPI. Yetthe poor might shop in establishments that charge different prices (e.g.informal shops or street markets). There is evidence that the poor paylower prices in urban – but not rural – India, for example (Deaton andTarozzi, 1999).
If the poor do pay different prices, this would affect poverty lineestimates. But this problem cannot be systematically addressed in aninternational methodology as few countries report food prices specific-ally for the poor.
8
Furthermore, it is unusual for countries to take thisinto consideration when estimating their own poverty lines. All consid-ered then, the ILO food price data set should therefore be generallyreasonable for the purposes of the new methodology.
A related problem is that the poor might tend to purchase var-ieties of food items not included in the ILO data set. For example, onlylong-grain rice is included in the ILO data set, although many of thepoor eat less expensive varieties of rice. According to a small-scaleinquiry in urban India and Bangladesh, the least expensive variety ofrice costs approximately one-half of the price of long-grain rice (seeAnker, 2005, for details). Based on this result and a desire to be con-servative in estimating poverty lines, the prices of long-grain ricereported in the ILO food price data set are reduced by one-half forIndia and Bangladesh and by one-third for other study countries
.
In the
8
The poor could pay higher or lower prices than those used to estimate the CPI. While onthe one hand neither they nor the informal establishments where they might shop would get lowerprices by buying in bulk, on the other hand informal establishments have lower overheads andmarkups.

Poverty lines around the world: A new methodology
293
future, it is hoped that the ILO will collect data on the prices of differ-ent varieties of rice.
The poor might pay taxes
Poverty lines estimated by countries generally ignore taxes. Arationale for this is that poor people do not pay income tax either becauseof a progressive tax schedule or because of poor enforcement. The poorin some countries, however, often pay sales taxes and payroll taxes, andthis reduces cross-country comparability because the extent to which thepoor pay these taxes varies greatly across countries.
9
In the future, itwould be worthwhile collecting information on sales and payroll taxespaid by the poor and incorporating these taxes into the methodology.
Applying the new methodology: Poverty lineestimates for 12 countries
Given the complexity of developing and applying a methodology forestimating internationally comparable poverty lines, testing it is import-ant. National poverty lines have therefore been estimated for 12 coun-tries drawn from all development levels and regions so as to ensure that awide range of situations are covered.
10
The poverty lines are estimatedfor a household of four (two adults and two children). Although anyhousehold size could have been used, four approximately ensures popu-lation reproduction and represents a reasonable compromise betweenthe smaller sizes found in most higher income countries and the largersizes found in many developing countries.
11
This section of the article is divided into two parts. The first sub-section describes and evaluates the national model diets established forthe 12 countries using the new methodology. The second subsectionpresents and discusses the new national poverty line estimates. Each ofthese is compared to the poverty line used by the country as well as thecorresponding poverty line estimated by the World Bank using its US$1
9
In the United States, for example, sales and payroll taxes combined account for approxi-mately 13 per cent of wages for low-wage employees.
10
The countries selected for this article are mainly countries included in Bescond,Châtaignier and Mehran (2003) where median wage rates are reported for selected countries. Thereason for using this selection of countries was that one of the main objectives of Anker (2005) wasto evaluate national living wage rate estimates using the new methodology by comparing them tothe median wage rate in the country. Four important countries were added to increase regionaldiversity: China, Egypt, India and the United States.
11
Since a good argument can be made for allowing household size to vary across countriesalong with observed differences in the number of children per household, this is done in theauthor’s other article in this issue of the
International Labour Review
. Poverty lines increase onaverage by approximately 24 per cent in the three low-income countries; decrease by approxi-mately 15 per cent in the two transition-economy countries; decrease by 10 per cent in Switzerland;decrease by 6 per cent in China; increase by 2 per cent in the United States; and increase byapproximately 14 per cent in the remaining four developing countries.

294
International Labour Review
PPP a day for low-income countries and US$2 PPP a day for lower mid-dle-income countries.
National model diets and food cost estimates
This subsection reports the new model diets established and evalu-ates them by analysing: (i) the composition of the model diets in termsof calories, proteins, fats and carbohydrates as well as in terms of quan-tities in each of ten major food groups; and (ii) the composition of eachmodel diet compared to that used by the country to estimate its ownpoverty line.
Composition of national model diets
Figure 3 indicates the percentages of calories in the model dietsthat come from proteins, fats and carbohydrates by development level.The established national model diets appear generally reasonable.Readers interested in how each model diet was established and the spe-cific food items selected are referred to Anker (2005).
12
Percentages of total calories from proteins, fats and carbohydrateschange with development level as expected. The percentage of caloriesderived from proteins increases with development from 10 per cent onaverage in the low-income countries to 16 per cent in the high-incomecountries studied; this is consistent with people’s increased ability toafford preferred, but expensive, animal-based protein-rich foods suchas milk, eggs and meat. The percentage of total calories derived fromfats increases from 17 per cent on average in the low-income countriesto approximately 24 per cent on average in other countries; this is con-sistent with the patterns observed worldwide. The percentage of totalcalories derived from carbohydrates decreases from 73 per cent onaverage in low-income countries to 60 per cent on average in high-income countries, which is again consistent with the patterns observedmore generally (WHO/FAO, 2003).
Other aspects of the model diets are worth mentioning as well. Thequantity of animal-based foods in the model diets increases substantiallywith development level. This is reasonable, because these foods are ex-pensive per calorie; indeed, the poor in lower-income countries cannotoften afford them. Thus, while the model diets for low-income countriestypically contain around a quarter of a cup of milk per day, one egg everyother week, and one serving of meat every other week, the model dietsfor high-income countries typically contain around one-and-a-half cups
12
A few adjustments were made in how model diets were established and food costs esti-mated compared to those reported in Anker (2005): the percentage of total calories from pulsesin Bangladesh was increased; vegetable/fruit consumption in middle-income countries was slightlyreduced; and the distribution of animal-based foods was changed, with meat consumption in-creased and milk and egg consumption reduced.

Poverty lines around the world: A new methodology
295
of milk a day, an egg five times a week, and a serving of lean meat ten timesper week.
The quantities of roots/tubers (potatoes) and pulses/nuts in themodel diets vary considerably across countries. This results from thesubstantial differences in national food preferences reflected in FAO na-tional food consumption data. For example, Armenia, China, Lithuania,Switzerland and the United States have relatively high consumption ofpotatoes. Pulses/nuts consumption is relatively high in China, Costa Rica,India, the United States and Zimbabwe, with the specific varieties in-cluded in the model diets varying across countries: dhal in Bangladeshand India, bean curd in China, chickpeas in Egypt, and beans in otherstudy countries.
Comparing the new model diets to the diets used by countriesto estimate national poverty lines
Another way to evaluate the national model diets established bythe new methodology is to compare them to the model diets that coun-tries use to estimate their own national poverty lines. A country’s ownmodel diet should provide a good benchmark in terms of local foodhabits and preferences. Although one would not expect the proposed
Figure 3. Percentages of calories from proteins, fats and carbohydrates in newmodel diets by development level (12 study countries)
10
17
73
12
20
68
14
21
66
16
24
60
0
10
20
30
40
50
60
70
80
% from proteins % from fats % from carbohydrates
Per
cent
age
Source: Author’s calculations.
Note: Colour of bar indicates development level: low-income , lower middle-income , upper middle-income ,and high-income .

296
International Labour Review
new model diet for a given country to be identical to the country’s ownmodel diet, the two should tend to be similar. Table 2 indicates the dif-ference between the internationally comparable model diet and thecountry’s own model diet for ten major food groups across the ninestudy countries for which the countries’ own model diets could befound.
13
First, the same ten major food groups used in the internationallycomparable model diets are used by the study countries in establishingtheir own model diets. Second, the composition of the two diets is simi-lar overall; average daily quantities vary within a range of +/– 17 gramsexcept for meats and vegetables (last row in table 2). Furthermore, alarge difference for a specific country and food group can usually beexplained. The large differences for China on almost every major foodgroup reflect the fact that China’s own model diet was nutritionallyunacceptable, since rice supplied approximately 90 per cent of calories.The model diets used by Ecuador and Costa Rica include much higherquantities of oil and sugar than the model diet of any other study coun-try, hence the more reasonable (smaller) quantities specified in theinternationally comparable model diets for these countries. The largeramount of fruit in the United States’ own recommended model diet ismainly due to the large amount of orange juice that Americans drink.Also for the United States, the large difference in the quantity ofpulses/nuts may be due to the constraints of the linear programmingroutine used to establish USDA model diets.
14
The model diets established by the new methodology do, however,display some consistent differences for four major food groups (milk,eggs, meat and vegetables) as well as some variability (cereals and roots/tubers) compared to the model diets used by the countries themselves.These differences appear for the most part reasonable given that the totalcost of the new model diets tends to be lower than the cost of the modeldiets used by countries and that systematic biases in quantities are oftencounterbalancing in nature. Thus, a higher quantity of cereals in a newmodel diet tends to be associated with a lower quantity of potatoes;higher amounts of milk are associated with lower quantities of meat;higher amounts of vegetables are associated with lower amounts of fruit.Also, the systematic underestimate of meat in the new model diets helps
13
Anker (2005) provides details of the internationally comparable model diets for all12 study countries and of the model diets used by the nine study countries for which such dietscould be found.
14 The United States Thrifty Food Plan is established using a linear programming routinewhere total food cost must remain constant in real terms over time. Since pulses/nuts are an in-expensive source of protein, it would not be surprising if this caused quantities of pulses/nuts toincrease over time in this food plan. It is worth noting that the 1961 Economy Food Plan usedto estimate the United States original poverty line contains substantially fewer grams of pulses/nuts than the 1999 Thrifty Food Plan used in table 2.

Poverty lines around the world: A new methodology 297
to reduce total food cost, which is not a bad thing when trying to be con-servative in estimating poverty lines;15 and the systematic upward bias forvegetables – compared to the countries’ own model diets – still leavesvegetable consumption well below the amount recommended by WHO/FAO (2003).
In summary, the model diets established by the new methodologytend to be similar to those established by the study countries them-selves. Both include the same major food groups, and quantities aresimilar on average for most major food groups. This means that the newmodel diets have the desirable attributes of generally reflectingnational food preferences, meeting nutritional needs, being relativelylow in cost, and being comparable across countries.
15 The lower average total cost of the internationally comparable model diets is mainly dueto the fact that they include fewer grams of meat. According to a sensitivity analysis in Anker(2005), total food cost is indeed sensitive to the percentage of total calories derived from proteinbecause a considerable part of this is provided by relatively expensive animal products.
Table 2. Difference in quantity by major food group (in grams) betweenthe proposed model diet and country’s own model diet(percentages)
Country Cereal Potato Pulses/nuts
Milk Eggs Meat Vege-tables
Fruit Oil Sugar
Bangladesh –34 25 0 52 8 –49 39 43 8 –5
Zimbabwe 2 57 19 –6 3 –42 31 63 –4 –4
Armenia –46 53 8 126 10 –33 44 –29 8 12
Ecuador 124 –108 12 18 11 –70 32 –95 –20 –45
Egypt 40 4 4 170 –1 –106 –37 –22 0 –22
Chinaa –184 171 71 –2 18 62 34 61 20 32
South Africa 15 –14 –33 –111 3 12 –55 59 –8 –26
Costa Rica 144b –14 –10 17 3 0 10 –11 –23 –67
United States 81b –73 –34 –71 –20 –79 112 –227 9 20
Mean 16 11 4 21 4 –34 23 –18 –1 –12
Medianc 15 4 4 17 3 –42 32 –11 –0 –5
a Differences for China are large because ChinaÕs own model diet is nutritionally unacceptable. India, Lithuaniaand Switzerland are not included in this table because these countries’ model diets were not available to theauthor. b It is assumed in the methodology that wheat is taken in the form of flour in low-income and lower mid-dle-income countries and in equal quantities of flour and bread in upper middle-income and high-income coun-tries. This partly explains the higher quantity of cereals in the internationally comparable model diets compared tocountry’s own model diet for Costa Rica and the United States. Because bread has approximately two-thirds asmany calories as flour, more bread is needed compared to flour to obtain the same number of cal-ories. c Median values are given in bold, because the country value for some foods (e.g. rice for China, sugarfor Costa Rica and Ecuador) are clearly inappropriate and this has a major effect on the mean for all countries.
Sources: Author’s calculations for proposed model diet values. Country’s own model diet values: Ravallion andSen (1996) for Bangladesh; Hamdok (1999) for Zimbabwe; Armenia (2004) for Armenia; World Bank (2002) forEgypt; Sangui (2004) for China; Martins and Maritz (2002) for South Africa; USDA (1999) for the United States;Costa Rica (2004) for Costa Rica; ILO (2004) for Ecuador.

298 International Labour Review
National poverty line estimatesThis section presents poverty line estimates for the 12 study coun-
tries using the new methodology (see table 3). The focus is on the extentto which the new poverty lines are consistent across development levels,and on how they compare with the poverty lines estimated by the coun-tries themselves and those estimated using the World Bank PPP method-ology. This analysis helps to evaluate the methodology and sheds newlight on the level of poverty in the world.
As expected, the values expressed in PPP tend to increase with de-velopment level (column 5 of table 3). Average 1993 PPP values increasefrom approximately US$2.3 per day for the three low-income countries,to US$3.0 for the five lower middle-income countries, to US$4.6 for thetwo upper middle-income countries, and to US$16 for the two high-income countries.
Estimated poverty lines in PPP, however, sometimes unexpectedlyoverlap with estimates for countries at a higher development level. Forexample, Zimbabwe’s estimated poverty line is higher than that of sev-eral of the lower middle-income countries; and China’s poverty line issimilar to Bangladesh’s. Interestingly, the poverty lines for the two Afri-can countries and the two transition-economy countries are especiallyhigh for their respective development levels. While these anomaliescould reflect real differences, they could also be due to problems with thepoverty line estimates and/or to problems with the PPPs in which they areexpressed. In this regard, it is important to remember (as noted above)that PPPs are often imprecise especially in high-inflation countries, andthis is believed to be a problem for Armenia, Ecuador, South Africaand Zimbabwe (see Anker, 2005, for a detailed discussion).
The average difference between the new poverty lines for the low-income and lower middle-income countries (around 30 per cent) ismuch smaller than the 100 per cent ad hoc difference assumed by theWorld Bank.16 This is an important result. It is due in part to differencesin the ratio of food to non-food costs at different development levels.As the poor spend a high percentage of their income on food, an argu-ment can be made to the effect that cross-national comparisons of pov-erty lines should not use overall PPPs as is done by the World Bank butshould instead use PPPs based on food prices only. Accordingly, Anker(2005) estimated food PPPs for study countries based on a typical lowermiddle-income country model diet. These food PPPs were found tobe consistently higher than the overall PPPs, because food prices are
16 It is worth noting that the differences estimated with the new methodology are consistentwith the data and discussion in Ravallion (1998) who reports that the elasticity of the national pov-erty line to national income per capita in PPP is close to zero at low per capita income levels andthat this elasticity remains low up to the income levels of lower middle-income countries. It is onlyfor upper middle-income and high-income countries that the elasticity is reported to be aroundone.

Poverty lines around the world: A new methodology 299
relatively low in the United States (the comparator country) relative tothe prices of other goods and services. While these food PPPs wereapproximately double the overall PPP for the low-income studycountries on average, they were only 1.2 times greater for the lowermiddle-income countries and 1.1 times greater for the upper middle-and high-income countries (Anker, 2005). Also worth noting is that allof the new poverty lines are consistent across development levels whenexpressed in food PPPs. There are no longer any overlaps in nationalvalues across development levels; values range from US$1.3 to US$1.4food PPP for the three low-income countries, from US$2.7 to US$2.9for the five lower middle-income countries, from US$4.5 to US$5.7 forthe two upper middle-income countries, and from US$16.4 to US$17.4for the two high-income countries.
The new poverty line estimates tend to be similar to the povertylines that the study countries use themselves, albeit with a slight upwardbias (figure 4 and column 6 in table 3). Just as important, almost all ofthe differences between the new poverty line and the country’s ownpoverty line are reasonable, given the inexact nature of estimating apoverty line. Differences are between –9 and –2 per cent for four of thecountries and between +17 and +39 per cent for six of the countries.Only Egypt and China are outside this range. Also reassuring is that thedirection of the difference between the newly estimated poverty lineand the country’s own poverty line is often consistent with how the newpoverty lines were estimated (see Anker, 2005, for details). For example,the estimate for India could be expected to be higher because it is basedon Mumbai food prices, which are higher than food prices in other partsof urban India; the poverty line estimate for Egypt was also likely to behigher partly because it is based on prices which the government usesto estimate the CPI) that are higher than the prices people actually payaccording to the World Bank (2002). The much higher poverty line esti-mated for China – which is similar to the World Bank’s – is traceable tothe unrealistically low level of the official Chinese poverty line.17
Figure 5 and column 7 in table 3 indicate that the new poverty lineestimates are much higher than those of the World Bank, especially forthe low-income study countries. Estimated poverty lines for the threelow-income countries are between 77 and 161 per cent higher than theWorld Bank’s. Even though this differential is partly due to the facturban prices were used for Bangladesh and India, it is clear that the new
17 As explained above, the model diet that China used to estimate its poverty line prior to1998 was clearly unhealthy because rice provided around 90 per cent of total calories. When thenational authorities improved the model diet used for estimating the poverty line in 1998, theysimultaneously reduced the non-food share of total expenditure from a realistic 40 per cent in 1997to a very unrealistic 11 per cent in 1998. In this way, China’s official poverty line and poverty rateremained basically unchanged between 1997 and 1998, with the poverty line changing only from630 to 635 yuan and the official poverty rate changing only from 30.1 to 29.3 per cent (Sangui,2004).

300 International Labour ReviewTa
ble
3.
New
pov
erty
line
(PL)
est
imat
es c
omp
ared
to
coun
trie
s’ o
wn
PLs
and
Wor
ld B
ank
PLs
of U
S$1
a d
ay a
nd U
S$2
a d
ay,
12 s
tud
y co
untr
ies
(per
cap
ita p
er d
ay)
Cou
ntry
(1)
New
PL
(in lo
cal c
urre
ncy)
(2)
Cou
ntry
’s o
wn
PL
(in lo
cal c
urre
ncy)
a
(3)
Wor
ld B
ank
PL
(in 1
993
PP
P)b
(4)
New
PL
(in 1
993
PP
P)c
(5)
New
PL
rela
tive
to c
ount
ry’s
own
PL
(2)/(
3)(6
)
New
PL
rela
tive
to W
orld
Ban
kP
Lc
(5)/(
4)(7
)
Ban
glad
esh
25.
52U
21.
77U
d1.
08 2
.20
1.1
72.
04e
Indi
a 2
0.25
U 1
5.14
Uf
1.08
1.9
1 1
.34
g1.
77e,
g
Zim
babw
e 2
2.55
23.
411.
08 2
.82
c 0
.96
2.61
c
Low
-inc
om
e av
erag
e1.
08 2
.31
1.1
6g
2.14
c,e,
g
Arm
enia
554.
8940
0.63
2.15
3.1
3c
1.3
91.
46c
Ecu
ador
1
.25U
0
.94
h2.
15 2
.66
c 1
.33
1.24
c,e
Egy
pt
4.4
1U
2.8
0 m
etro
i2.
15 2
.55
1.5
71.
18e
Chi
na
5.6
0j
1
.71
k2.
15 2
.34
3.2
8k
1.09
Sou
th A
frica
10.
68U
11.
16U
(Bla
cks)
2.15
4.3
6 0
.96
2.03
e
Low
er m
idd
le-i
nco
me
aver
age
2.15
3.0
1 1
.71
(1.3
1 ex
clud
ing
C
hina
)k
1.42
c,e
Lith
uani
a
8.6
5
8.8
3l
n.a.
4.8
9 0
.98
n.a.
Cos
ta R
ica
741.
72U
810.
97U
mn.
a. 4
.38
0.9
1n.
a.
Upp
er m
iddl
e-in
com
e av
erag
e 4
.63
0.9
5n.
a.
Sw
itzer
land
40.
97 3
2.91
nn.
a.18
.37
1.2
4n.
a.
Uni
ted
Sta
tes
16.
35o
12.
4p
n.a.
13.5
2o
1.3
2o,
pn.
a.
Hig
h-in
com
e av
erag
e15
.95
o 1
.28
o,p
n.a.
Tota
l ave
rag
e 1
.37
g
(1.2
0 ex
clud
ing
C
hina
)k
1.50
c,e,
g

Poverty lines around the world: A new methodology 301N
otes
: U in
dica
tes
urba
n; n
.a. i
ndic
ates
not
app
licab
le.
Valu
es in
col
umns
2-5
are
per
cap
ita p
er d
ay. A
vera
ge is
unw
eigh
ted
aver
age
of n
atio
nal v
alue
s. D
ata
year
s ar
e: 2
001
for A
rmen
ia, E
gypt
, Lith
uani
a, S
outh
Afri
ca, S
witz
erla
nd a
nd th
eU
nite
d S
tate
s; 2
000
for
Chi
na, C
osta
Ric
a, E
cuad
or a
nd In
dia;
199
9 fo
r Zi
mba
bwe;
199
6 fo
r B
angl
ades
h. D
ata
year
was
det
erm
ined
by
year
of t
he m
edia
n w
age
rate
dat
a pr
ovid
edby
Bes
cond
, Châ
taig
nier
and
Meh
ran
(200
3) e
xcep
t for
Chi
na, E
gypt
, Ind
ia a
nd th
e U
nite
d S
tate
s, w
hich
are
not
incl
uded
in th
eir s
tudy
, and
Ecu
ador
whe
re la
test
yea
r in
ILO
Oct
ober
Inqu
iry d
atab
ase
was
use
d be
caus
e of
pro
blem
s fo
r th
e da
ta y
ear
incl
uded
in B
esco
nd, C
hâta
igni
er a
nd M
ehra
n (2
003)
, whi
ch a
re p
roba
bly
due
to h
igh
infla
tion,
dol
lariz
atio
n of
the
curr
ency
and
unu
sual
cha
nges
in P
PP
ove
r tim
e (d
iscu
ssed
in A
nker
, 200
5). F
or e
xam
ple,
acc
ordi
ng to
the
Wor
ld B
ank,
Ecu
ador
’s P
PP
dec
reas
ed fr
om 0
.47
in 1
993
to 0
.38
in 2
000
befo
re in
crea
sing
to 0
.48
in 2
001,
des
pite
ann
ual i
nflat
ion
rate
s th
at r
ange
d fro
m 2
1 to
120
per
cen
t ove
r th
is p
erio
d.aTo
cal
cula
te a
cou
ntry
’s o
wn
per
capi
ta p
over
ty li
ne w
hen
its p
over
ty li
ne w
as r
epor
ted
for
a sp
ecifi
c ho
useh
old
size
, th
e re
port
ed p
over
ty li
ne w
as d
ivid
ed b
y re
port
ed h
ouse
hold
size
. Whe
n a
coun
try’
s ow
n po
vert
y lin
e w
as re
port
ed fo
r se
vera
l hou
seho
ld s
izes
, a h
ouse
hold
siz
e of
four
was
use
d to
incr
ease
com
para
bilit
y.b
Wor
ld B
ank
pove
rty
lines
are
US
$1.0
8 19
93 P
PP
for
low
-inco
me
coun
trie
s an
d U
S$2
.15
1993
PP
P f
or lo
wer
mid
dle-
inco
me
coun
trie
s. T
here
is n
o gu
idan
ce f
or u
pper
mid
dle-
inco
me
coun
trie
s or
for
high
-inco
me
coun
trie
s.cP
PP
s ar
e im
prec
ise,
whi
ch m
akes
com
paris
ons
with
Wor
ld B
ank
pove
rty
lines
als
o im
prec
ise.
PP
Ps
are
espe
cial
ly im
prec
ise
for Z
imba
bwe,
Arm
enia
and
Ecu
ador
(ver
y hi
gh in
flatio
nco
untr
ies)
, and
to a
less
er e
xten
t for
Sou
th A
frica
(see
Ank
er, 2
005)
.d
Ban
glad
esh’
s ur
ban
pove
rty
line
is u
sed
for
com
paris
on, b
ecau
se th
e ne
w p
over
ty li
ne w
as e
stim
ated
usi
ng fo
od p
rices
for
Dha
ka re
port
ed in
the
ILO
dat
abas
e. T
he u
rban
pov
erty
line
for
1991
-92
repo
rted
in R
aval
lion
and
Sen
(199
6) w
as u
pdat
ed to
dat
a ye
ar 1
996
by in
flatio
n. N
ote
that
the
1996
rur
al p
over
ty li
ne c
alcu
late
d in
this
way
was
19.
10.
eTh
e ne
w p
over
ty li
ne is
pro
babl
y ov
eres
timat
ed re
lativ
e to
Wor
ld B
ank’
s, b
ecau
se it
is e
stim
ated
for
urba
n ar
eas.
f Indi
a ha
s se
para
te o
ffici
al r
ural
and
urb
an p
over
ty li
nes.
For
com
paris
on, t
he G
over
nmen
t’s u
rban
pov
erty
line
was
use
d be
caus
e IL
O fo
od p
rice
data
wer
e fo
r M
umba
i. In
dia’
s ru
ral
pove
rty
line
was
12.
09.
gR
atio
is o
vere
stim
ated
bec
ause
the
new
pov
erty
line
for
Indi
a is
bas
ed o
n M
umba
i pric
es th
at a
re h
ighe
r th
an p
rices
in o
ther
Indi
an c
ities
(see
Ank
er, 2
005)
.hE
cuad
or’s
pov
erty
line
for
2001
as
repo
rted
in W
orld
Ban
k (2
004b
) was
redu
ced
by re
port
ed in
flatio
n in
200
1.i P
over
ty li
ne fo
r m
etro
polit
an E
gypt
is u
sed
for
com
paris
on w
ith t
he n
ew p
over
ty li
ne, b
ecau
se fo
od p
rices
in t
he IL
O d
atab
ase
are
for
urba
n ar
eas.
Egy
pt’s
ow
n po
vert
y lin
e is
2.4
0fo
r ru
ral a
reas
and
2.5
6 fo
r ot
her
urba
n ar
eas.
j The
new
pov
erty
line
for
Chi
na w
as e
stim
ated
usi
ng p
rices
for
Shi
jazh
uang
, whi
ch a
ppea
rs to
hav
e re
ason
ably
typi
cal p
rices
for
Chi
na (A
nker
, 200
5).
kTh
e of
ficia
l pov
erty
line
for
Chi
na is
muc
h to
o lo
w b
ecau
se it
is b
ased
on
an u
nacc
epta
ble
diet
(see
tabl
e 2)
. For
this
reas
on, t
he a
vera
ge w
as a
lso
calc
ulat
ed w
ithou
t Chi
na.
l Lith
uani
a’s
own
pove
rty
line
diffe
rs fr
om th
e ot
her p
over
ty li
nes
in th
is ta
ble
in th
at it
is a
rela
tive
pove
rty
line.
It e
qual
s 50
per
cen
t of a
vera
ge c
onsu
mer
exp
endi
ture
for a
n eq
uiva
lent
cons
umer
.m
Cos
ta R
ica’
s ur
ban
pove
rty
was
use
d fo
r co
mpa
rison
, bec
ause
the
new
pov
erty
line
was
est
imat
ed u
sing
ILO
food
pric
e da
ta fo
r ur
ban
area
s. C
osta
Ric
a’s
own
rura
l pov
erty
line
was
649
.37.
nS
witz
erla
nd d
oes
not
have
an
offic
ial p
over
ty li
ne. I
t ha
s a
“sem
i-offi
cial
” po
vert
y lin
e fo
r a
sing
le a
dult
hous
ehol
d fro
m C
SIA
S (S
wis
s C
onfe
dera
tion
of S
ocia
l Ins
titut
ions
). Th
is w
asco
nver
ted
to a
per
cap
ita v
alue
for
a ho
useh
old
of fo
ur u
sing
a C
SIA
S h
ouse
hold
siz
e sc
alar
and
then
upd
ated
to 2
001
usin
g re
port
ed in
flatio
n.o
Bot
h th
e ne
w p
over
ty li
ne a
nd t
he o
ffici
al p
over
ty li
ne f
or t
he U
nite
d S
tate
s w
ould
hav
e be
en a
ppro
xim
atel
y U
S$1
.35
high
er if
tax
es (s
ales
and
pay
roll)
had
bee
n co
nsid
ered
and
betw
een
US
$1.3
5 an
d U
S$4
hig
her
if he
alth
car
e ex
pens
es h
ad b
een
cons
ider
ed fo
r th
e m
any
Am
eric
ans
not c
over
ed b
y st
ate
or e
mpl
oyer
med
ical
ben
efits
acc
ordi
ng to
est
imat
esin
Ank
er (2
005)
. On
the
othe
r ha
nd, t
he e
arne
d in
com
e ta
x cr
edit
that
ben
efits
low
-wag
e w
orke
rs w
ith a
fam
ily w
ould
hav
e re
duce
d th
e po
vert
y lin
e ha
d it
been
take
n in
to a
ccou
nt.
pTh
e U
nite
d S
tate
s of
ficia
l pov
erty
line
is w
idel
y ac
know
ledg
ed t
o be
an
unde
rest
imat
e. A
ccor
ding
to
the
Nat
iona
l Aca
dem
y of
Sci
ence
, it
was
bet
wee
n 14
and
34
per
cent
too
low
in 1
992
(Citr
o an
d M
icha
el, 1
995)
.S
ourc
es:
Aut
hor’s
est
imat
es a
nd c
alcu
latio
ns fo
r th
e ne
w p
over
ty li
ne a
nd W
orld
Ban
k po
vert
y lin
e as
des
crib
ed in
tex
t. Th
e fo
llow
ing
sour
ces
wer
e us
ed fo
r na
tiona
l pov
erty
line
s:R
aval
lion
and
Sen
(199
6) fo
r Ban
glad
esh;
Indi
a (2
004)
for I
ndia
; Zim
babw
e (2
004)
for Z
imba
bwe;
Arm
enia
(200
4) fo
r Arm
enia
; Wor
ld B
ank
(200
4b) f
or E
cuad
or; W
orld
Ban
k (2
002)
for
Egy
pt; S
angu
i (20
04) f
or C
hina
; Mar
tins
and
Mar
itz (2
002)
for S
outh
Afri
ca; L
ithua
nia
(200
1) fo
r Lith
uani
a; C
osta
Ric
a (2
004)
for C
osta
Ric
a; R
omer
o an
d To
rres
(200
3) fo
r Sw
itzer
land
;U
nite
d S
tate
s C
ensu
s B
urea
u (2
003)
for
the
Uni
ted
Sta
tes.

302 International Labour Review
poverty lines for the low-income countries are substantially higher thanthe Bank’s.
Comparison with the World Bank poverty lines for the lower mid-dle-income countries produces a mixed picture, although the newly esti-mated poverty lines are still consistently higher than the Bank’s US$2.15a day at 1993 PPP. They are around 10 per cent higher for China, 20 percent higher for Egypt and Ecuador, 50 per cent higher for Armenia, and100 per cent higher for South Africa.
There are no World Bank poverty lines for upper middle-income orhigh-income countries, as the Bank has not extended its PPP method-ology to such countries. Reassuringly, however, the new poverty line esti-mates for these countries display a reasonable progression compared toestimates for the low-income and lower middle-income countries – aver-
17
34 3933
57
228
2432
-4 –4 –9–2
–50
0
50
100
150
200
250
BangladeshIndia
Zimbabwe
Armenia
Ecuador
Egypt
China
South AfricaLithuania
Costa RicaSwitzerland
United
StatesP
erce
ntag
e di
ffere
nce
Note: Colour of bar indicates development level: low-income , lower middle-income , upper middle-income ,and high-income .
The new estimate for India is probably too high relative to India’s own urban poverty line, because it is based on foodprice data from Mumbai where prices are higher than in other urban areas of India. The United States’ own national poverty line is underestimated according to the United States National Academy of Science (Citro and Michael, 1995).
Source: Table 3, column 6.
Figure 4. Differences between the new poverty line estimates and the poverty linesused by countries (percentages)

Poverty lines around the world: A new methodology 303
aging approximately US$4.6 and US$16 in 1993 PPP for upper middle-income and high-income countries, respectively.
In summary, the poverty lines estimated on the basis of the newmethodology for the 12 study countries appear reasonable: they aregenerally consistent with the poverty lines used by national authoritiesas well as internally consistent. The fact that the new estimates arehigher than the World Bank’s, especially for the low-income countries,suggests that the World Bank poverty lines are too low in the light ofthe very basic model diets specified for the low-income and lower mid-dle-income countries in the new methodology (e.g. around one cup ofmilk every four day, one egg every nine days, and one 85-gram servingof meat or fish every 12 days for low-income countries). Such resultslend support to the new methodology’s feasibility and usefulness – evenif specific country values and the methodology itself could be improved.
Note: Colour of bar indicates development level: low-income , and lower middle-income .
World Bank does not use its PPP methodology to estimate poverty lines for upper middle-income or high-income countries.
* Comparisons for Armenia, Ecuador and Zimbabwe are especially imprecise because of the difficulty of estimating 1993PPP in high-inflation countries and, therefore, the World Bank poverty line.
The new poverty lines for Bangladesh, India, Ecuador and Egypt are probably overestimated relative to the World Bank’s,because they are based on urban price data. See country notes in column 7, table 3.
Source: Table 3, column 7.
Figure 5. Percentage difference between the new poverty line estimatesand the World Bankís poverty lines for the low-incomeand lower middle-income study countries
104
77
161
46
24
9
103
18
0
20
40
60
80
100
120
140
160
Bangladesh India Zimbabwe* Armenia* Ecuador* Egypt China South Africa
Per
cent
age
diffe
renc
e

304 International Labour Review
They also imply that there is considerably more poverty in the worldthan is currently believed based on the World Bank’s estimates.
Concluding remarksDrawing on a detailed ILO working paper (Anker, 2005), this art-
icle has described a new methodology for estimating internationallycomparable national poverty lines. The development of this new meth-odology should be seen in the present context wherein the most com-mon way to measure poverty internationally – the World Bank’spoverty lines of US$1 and US$2 a day – poses recognized problems andis, in any case, based on a methodology that is inappropriate for esti-mating national poverty lines.
The new methodology has a number of advantages. It is: (i) norma-tively based, with the underlying concept of poverty and food and non-food needs clearly reflected and measured; (ii) usable for all countries anddevelopment levels, which is important because poverty exists in all coun-tries; (iii) transparent, as the assumptions used to estimate national pov-erty lines are specified; (iv) inexpensive to use and update regularly for alarge number of countries as the required data are available online forfree; and (v) flexible, with calculations done in computer spreadsheets sothat underlying assumptions can be easily changed. It also can be used tocommunicate the meaning of being poor to the public in terms of food con-sumption and non-food expenses. The new methodology uses the sameapproach that most countries use to estimate their own national povertyline, namely, the traditional approach to the measurement of a nationalpoverty line which has been used at least since Rowntree’s classic study of1899 York. It involves establishing and costing an acceptable low-costnutritious model diet and then adding the cost of non-food necessities.What sets the new methodology described in this article apart fromearlier work on poverty line measurement is that the traditional ap-proach used at the national level has been replicated at the internationallevel in order to estimate comparable national poverty lines.
The new methodology was used to estimate national poverty linesfor 12 countries representing all regions and development levels in orderto examine how well the methodology works in practice and to providefresh insights into poverty around the world. This exercise included com-paring the new model diets and poverty line estimates to those of theWorld Bank and the countries themselves. The model diets establishedusing the new methodology were found to be acceptable in terms of cal-ories, proteins, carbohydrates and fats; to display reasonable patterns ofchange by development level; and to be generally similar to the modeldiets that the countries themselves use. The newly estimated nationalpoverty lines also tended to be similar to the poverty lines used by coun-tries, although they were somewhat higher. However, the new poverty

Poverty lines around the world: A new methodology 305
lines were much higher than those of the World Bank, especially for thethree low-income study countries. These results indicate that there ismuch more poverty in the world than is currently estimated by the WorldBank. There is also considerable poverty in upper middle-income andhigh-income countries – something which the World Bank does not con-sider with its US$1 and US$2 a day poverty lines.
Despite some limitations and possibilities for improvement – andthe inexact nature of all poverty line estimations – the new methodologydescribed in this article appears to provide a useful approach to measur-ing reasonably comparable national poverty lines. From the resultsobtained with this approach, it also appears that poverty in the world ismuch higher than is currently estimated by the World Bank and that pov-erty is common in all countries of the world.
ReferencesAnker, Richard. 2005. A new methodology for estimating internationally comparable poverty
lines and living wage rates. Policy Integration Department, Working Paper No. 72.Geneva, ILO. Available from: http://www.ilo.org/public/english/bureau/integration/download/publicat/4_3_378_wp-72.pdf [visited 29 Nov. 2006].
Armenia, Government of the Republic of. 2004. Poverty Reduction Strategy Paper. Availablefrom: www.gov.am.
Bescond, David; Châtaignier, Anne; Mehran, Farhad. 2003. “Seven indicators to measuredecent work: An international comparison”, in International Labour Review (Geneva),Vol. 142, No. 2, pp. 179-211. [The full wage data set, supplied personally to the author, isavailable on request from David Bescond at [email protected].]
Boltvinik, Julio. 1994. “Poverty measurement and alternative indicators”, in Rolph van derHoeven and Richard Anker (eds.): Poverty monitoring: An international concern. NewYork, NY, St Martin’s Press, pp. 57-83.
Cervera, Miguel. 1997. Measurement of population’s living standards by applying differentmethodologies: The Mexican experience. Paper presented to the Seminar on PovertyStatistics organized by the United Nations Economic Commission for Latin Americaand the Caribbean, held in Santiago, 7-9 May.
Chen, Shaohua; Ravallion, Martin. 2004. How have the world’s poorest fared since the early1980s? Policy Research Working Paper No. 3341. Washington DC, World Bank.
Citro, Constance F.; Michael, Robert T. 1995. Measuring poverty: A new approach. Washing-ton DC, National Academy Press.
Cofer, Eloise; Grossman, Evelyn; Clark, Faith. 1962. Family food plans and food costs. HomeEconomics Research Report No. 20. Washington DC, USDA, Agricultural ResearchService.
Costa Rica, Government of/INEC. 2004. “Costo de la canasta básica de alimentos”, in BoletínMensual, Vol. 5 (May), Year 10.
Deaton, Angus.2003. Measuring poverty in a growing world (or measuring growth in a poorworld). NBER Working Paper No. 9822. Cambridge, MA, National Bureau of Eco-nomic Research.
—.2001. “Counting the world’s poor: Problems and possible solutions”, in The World BankResearch Observer (Washington, DC), Vol. 16, No. 2, pp. 125-147.
—; Tarozzi, Alessandro. 1999. Prices and poverty in India. Unpublished mimeo. Universityof Princeton, Princeton, NJ.
Erdogan, Guzin. 1997. Poverty definitions and poverty in Turkey. Paper presented to theSeminar on Poverty Statistics organized by the United Nations Economic Commis-sion for Latin America and the Caribbean, held in Santiago, 7-9 May.

306 International Labour Review
Everaers, Pieter. 1998. EC approach to poverty measurement. Paper presented to the ThirdMeeting of the Expert Group on Poverty Statistics, held in Lisbon, 26-27 Nov.
Fisher, Gordon M. 1999. An overview of developments since 1995 relating to a possible newU.S. poverty measure. Poverty Measurement Working Paper. Washington, DC, UnitedStates Census Bureau.
Hamdok, Abdalla A. 1999. “A poverty assessment exercise in Zimbabwe”, in African Devel-opment Review (Oxford), Vol. 11, No. 2 (Dec.), pp. 290-306.
ILO. Various years. Statistics on occupational wages and hours of work and on food prices:October Inquiry results. Geneva.
—.2004. Notas acerca de la canasta básica alimentaria utilizada en la medida del poderadquisitivo de los salarios. Multidisciplinary team for Andean Countries. Availablefrom: www.oitandina.org.pe.
India, Government of. 2004. Available from: www.labor.nic.in/annrep [visited 22 Dec. 2006].Joshi, P.D. 1997. Conceptualization, measurement and dimensional aspects of poverty in
India. Paper presented to the Seminar on Poverty Statistics organized by the UnitedNations Economic Commission for Latin America and the Caribbean, held in San-tiago, 7-9 May.
Kakwani, Nanak. 2004. “New global poverty counts”, in In Focus (Brasilia), Sep. Availablefrom: www.undp.org/povertycentre/newsletters/infocus4sep04eng.pdf [visited 22 Dec.2006].
Lithuania, Government of. 2001. Social Report 2001. Vilnius, Ministry of Social Security andLabour.
Martins, J.H.; Maritz, M.E. 2002. Minimum and supplemented living levels in the main andother selected urban areas of the RSA, March 2002. Bureau of Market ResearchReport No. 307. Pretoria, University of South Africa.
Orshansky, Mollie. 1965. “Counting the poor: Another look at the poverty profile”, in SocialSecurity Bulletin (Washington, DC), Vol. 28, No. 1 (Jan.), pp. 3-29. Reprinted in Vol. 51,(1988), No. 10 (Oct.), pp. 25-51.
Rama, Marcia; Fernandez, Maria Dolores. 1997. Measurement of poverty in Uruguay. Paperpresented to the Seminar on Poverty Statistics organized by the United Nations Eco-nomic Commission for Latin America and the Caribbean, held in Santiago, 7-9 May.
Ravallion, Martin. 2001. “Comment on ‘Counting the World’s Poor’”, in The World BankResearch Observer (Washington DC), Vol. 16, No. 2, pp. 149-156.
—.1998. Poverty lines in theory and practice. Living Standards Measurement Study WorkingPaper No. 133. Washington DC, World Bank.
—.1992. Poverty comparisons: A guide to concepts and methods. Living Standards Measure-ment Study Working Paper No. 88. Washington DC, World Bank.
—; Sen, Binayak. 1996. “When method matters: Monitoring poverty in Bangladesh”, in Eco-nomic Development and Cultural Change (Chicago, IL), Vol. 44, No. 4, pp. 761-792.
Reddy, Sanjay; Pogge, Thomas W. 2003. How not to count the poor. Draft paper. New York,NY, Columbia University.
Romero, Ana Teresa; Torres, Raymond. 2003. Social dimensions of globalisation: Switzer-land. Geneva, ILO.
Rowntree, B. Seebohm. 1908. Poverty: A study of town life. 4th edition. London, Macmillan.Sangui, Wang. 2004. Poverty targeting in the People’s Republic of China. ADB Institute Dis-
cussion Paper No. 4. Tokyo, Asian Development Bank. Jan.Streeten, Paul. 1994. “Poverty concepts and measurement” in Rolph van der Hoeven and
Richard Anker (eds.): Poverty monitoring: An international concern. New York, NY,St Martin’s Press, pp. 15-30.
Tabatabai, Hamid. 1996. Statistics on poverty and income distribution: An ILO compendiumof data. Geneva, ILO.
United States Census Bureau. 2003. Statistical Abstract of the United States: 2003. 123rd edi-tion. Washington DC.
USDA (United States Department of Agriculture). 1999. The Thrifty Food Plan, 1999:Administrative Report. CNPP-7. Washington, DC, Center for Nutrition Policy andPromotion. Available from: www.usda.gov/cnpp [visited 13 Dec. 2006].

Poverty lines around the world: A new methodology 307
WHO/FAO. 2003. Diet, Nutrition and the Prevention of Chronic Diseases. Report of a JointWHO/FAO Expert Consultation. WHO Technical Report Series 916. Geneva, WHO.
World Bank. 2004a. World Development Report. Oxford, Oxford University Press.—.2004b. Ecuador Poverty Assessment. Report No. 27061-EC. April.—.2002. Arab Republic of Egypt Poverty Reduction in Egypt: Diagnosis and Strategy. Report
number 24234-EGT, Social and Economic Group Middle East and North AfricanRegion and Ministry of Planning Government of Arab Republic of Egypt. June 29.
—.2001. 2000/2001 World Development Report. Oxford, Oxford University Press.—.1990. 1990 World Development Report. Oxford, Oxford University Press.Zimbabwe, Government of. 2004. Available from: www.mofed.go.zw. September.Zimmerman, Carle C. 1932. “Engel’s law of expenditures for food”, in Quarterly Journal of
Economics (Cambridge, MA) Vol. 47, No. 1, pp. 78-101.