poverty, social divisions and conflict in nepal · poverty, social divisions and conflict in nepal...
TRANSCRIPT

1 7 3 7 C A M B R I D G E S T R E E T • C A M B R I D G E , M A 0 2 1 3 8 • T E L 6 1 7. 4 9 5 . 4 4 2 0 • F A X 6 1 7. 4 9 5 . 8 2 9 2 pub l i cat ions@wcf ia .harvard .edu • ht tp : //www.wcf ia .harvard .edu
Work ing Paper Ser ies
No. 07-02
Poverty, Social Divisions and Conflict in Nepal
by Quy-Toan Do and Lakshmi Iyer

Poverty, Social Divisions and Conflict in Nepal
by
Quy-Toan Do and Lakshmi Iyer
Paper No. 07-02
April 2007
About the Authors:
Quy-Toan Do is an economist for the Poverty Team of the Development Research Group at the World Bank. Email: [email protected]. Lakshmi Iyer is assistant professor of business administration at the Harvard Business School. Email: [email protected].

Published by the Weatherhead Center for International Affairs, Harvard University. Copyright by the author.
The author bears sole responsibility for this paper. The views expressed here are those of the author and do not necessarily represent the views of the WCFIA or Harvard University. Beth Simmons Steven B. Bloomfield Director Executive Director [email protected] [email protected] Robert Paarlberg Amanda Pearson Publications Chair Director of Publications [email protected] [email protected] Sofía Jarrín-Thomas Publications Assistant [email protected] Submission procedures: Weatherhead Center affiliates are encouraged to submit papers to the Working Paper Series. Manuscripts are assessed on the basis of their scholarly qualities—the extent of original research, the rigor of the analysis, the significance of the conclusions—as well as their relevance to contemporary issues in international affairs. Manuscripts should range between 25 and 80 double-spaced pages and must include an abstract of no more than 150 words. Authors should submit their paper as an e-mail attachment in a standard word processing application (Microsoft Word or Word Perfect) to the Publications Department at [email protected].
WEATHERHEAD CENTER FOR INTERNATIONAL AFFAIRS HARVARD UNIVERSITY
1737 CAMBRIDGE STREET CAMBRIDGE, MA 02138
TEL: 617-495-4420 FAX: 617-495-8292
www.wcfia.harvard.edu
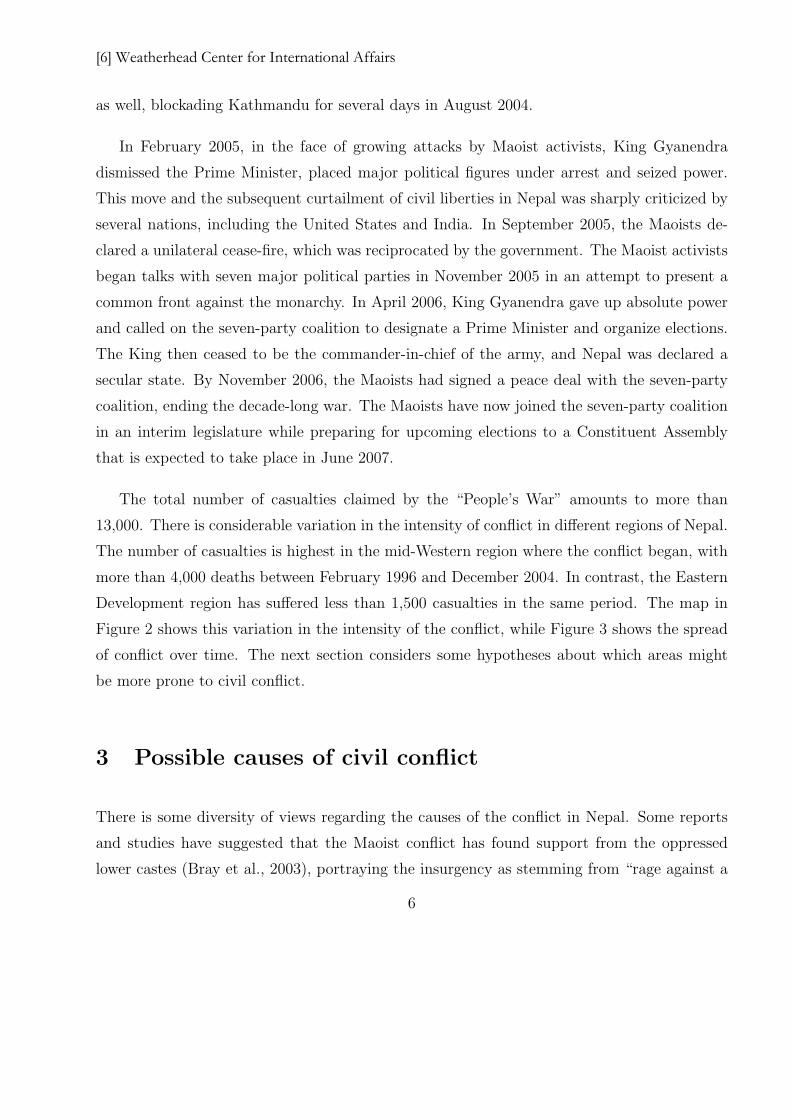
Abstract
We conduct an econometric analysis of the economic and social factors which
contributed to the spread of violent conflict in Nepal. We find that conflict intensity is
significantly higher in places with greater poverty and lower levels of economic
development. Violence is higher in locations that favor insurgents, such as mountains and
forests. We find weaker evidence that caste divisions in society are correlated with the
intensity of civil conflict, while linguistic diversity has little impact.
Keywords: violent conflict, poverty, social polarization
Acknowledgments
We thank the Informal Sector Service Centre (INSEC, Nepal) for data on conflict-related
deaths. We thank Shawn Cole, Elena Glinskaya, Simon Johnson, Miguel Messmacher,
Eric Werker, Hassan Zaman and seminar participants at the World Bank, Harvard
Business School, the Workshop on Endogenous Institutions and Political Conflict (UC
Berkeley) and NEUDC 2006 for comments and suggestions. Tripti Thapa provided
outstanding research assistance. The findings, interpretations, and conclusions expressed
in this paper are entirely those of the authors. They do not necessarily reflect the views of
the World Bank, its Executive Directors, or the countries they represent.
1 Introduction
Since 1945, more than 70 civil wars have occurred around the world, resulting in approximately
20 million deaths and displacing more than 67 million people.1 Understanding the causes of
the onset and continuation of such conflicts is therefore of great importance, and the analysis
of the determinants of civil conflict has been the subject of a recent and growing literature
in economics.2 There have been several cross-country studies of the proximate correlates of
civil war: Collier and Hoeffler (2004) and Fearon and Laitin (2003) both find that poorer
countries face a greater risk of civil conflict. Miguel et al. (2004) use instrumental variable
analysis to corroborate this view that lower economic growth leads to more conflict. However,
this finding is subject to varying interpretations: while Collier and Hoeffler (2004) interpret
poverty as proxying for the opportunity cost of rebel recruitment, Fearon and Laitin (2003)
emphasize the lack of state capacity in poor countries. These studies also differ in their
findings on the impact of other factors: Collier and Hoeffler find that civil conflicts are more
likely in countries which are dominated by one ethnic group and which have a larger stock of
easily expropriated primary commodities, while the other two studies find no impact of ethnic
divisions or primary commodities on the likelihood of conflict.
The results from cross-country studies are subject to the caveat that civil conflict in one
country might have very different causes and characteristics than conflict in another.3 Further,
the data on civil conflicts and other variables may not be strictly comparable across countries
(Sambanis, 2004). There have been a few within-country studies of civil conflict. Barron
et al. (2004) examine village-level conflicts in Indonesia, while Deininger (2004) examines
the causes and consequences of civil strife in Uganda. However, both these studies focus
on a local level of conflict and construct measures of conflict based on subjective interviews.
They do not study organized conflict like insurgencies or civil wars, and hence are not strictly
comparable to the cross-country studies. The set of case studies in Collier and Sambanis (2005)
1Collier and Sambanis (2005) pp xiii.2See Humphreys (2003) for a review of this literature.3Sambanis (2001) analyses ethnic and non-ethnic conflicts separately and finds that they have somewhat
different causes.
1

provide richer and more detailed within-country qualitative studies to complement the cross-
country large-sample studies; however, they are not strictly comparable to the cross-country
regression-based analyses.
Our study examines violent conflict within one country, Nepal, and applies the cross-
country regression methodology to a within-country context. This approach mitigates many
of the concerns regarding cross-country analysis: first, since we are able to study the spread of
the same conflict to different parts of the country, several variables which differ across countries
such as the existing political system, the aims of the rebel movement or the involvement of
other countries, are held constant in such a study. One implication of such approach is that
we are not able to examine the impact of these factors, which can be quite important in many
contexts. However, these variables are typically not controlled for in many cross-country
analyses of conflict.4 Second, we are able to construct finer measures of conflict intensity
based on the number of casualties and other human rights abuses, rather than just using a
dummy variable for whether an area experiences conflict or not. Third, we are also able to
separately analyze conflict-related deaths caused by activist forces and by the state, and study
the evolution of the conflict intensity over time (cross-country studies usually do not go further
than dating the onset and end of civil wars). Fourth, we go beyond existing empirical analyses
of the conflict in Nepal (Murshed and Gates, 2005; Bohara et al., 2006; Acharya, 2007) by
constructing detailed measures of social divisions, based both on caste and linguistic diversity
in the country, and by focusing on the role of poverty.
Starting in 1996, Nepal was affected by the “People’s War” started by Maoist activists,
whose main aim was to establish a republic and change the Constitution. The activists used
guerilla warfare techniques to attack government facilities and officials. This conflict spread
to all parts of the country, and resulted in a death toll of more than 13,000 people nation-
wide. Large parts of rural Nepal were under the control of the activists, though the district
headquarters remained under the control of the state. In 2006, the Maoists began peace talks
with the government.
4An exception is Sambanis (2001), which examines the role of neighboring country characteristics on civil
war incidence.
2
[2] Weatherhead Center for International Affairs

In our empirical analysis, we consider a wide range of economic and social variables which
are hypothesized to affect the likelihood of violent conflict, including geographic characteris-
tics, economic development, social diversity and government investment in infrastructure. We
find that geographic conditions (presence of mountains and forests) explain a quarter of the
cross-district variation in conflict intensity. Controlling for geography, the lack of economic
opportunities, measured by higher poverty or lower literacy rates, is significantly and robustly
associated with a higher intensity of violent conflict: a 10 percentage point increase in poverty
is associated with 23-25 additional conflict-related deaths. Poverty is significantly associated
both with the onset of the conflict, as well as its continuation. However, this relationship is
not constant over time: both state forces and Maoist activists inflict the greatest casualties in
the poorest areas in 2002, when the conflict escalated. As the activists gained control of the
poorest areas over time, the highest levels of conflict-related deaths were experienced in the
somewhat better-off areas. There is some evidence that greater social polarization (measured
by the caste diversity of Nepalese society) is associated with higher levels of conflict. How-
ever, this relationship is much less robust than the relationship with poverty; in fact, part of
this relationship appears to be due to the fact that social polarization contributes to greater
poverty, perhaps by limiting access to economic opportunities for the lower castes. Measures
of linguistic polarization or fractionalization have no significant impact on conflict intensity.
The paper is structured as follows: Section 2 provides a brief description of the “People’s
War” in Nepal, section 3 describes the main hypotheses we examine and the related litera-
ture on the Nepalese conflict. Section 4 describes our data and empirical strategy, section 5
summarizes our findings and section 6 concludes.
2 The Maoist “People’s War” in Nepal
Nepal is a poor country with a population of 27 million and a per capita GDP of $270 in
2005. As of 2004, 31% of the population lived under the poverty line. The country is located
between India and China, is land-locked and has few natural resources. Agriculture is the
3
[3] Do & Iyer

major driver of the economy, contributing 40% of GDP in 2005, and employing two-thirds
of the workforce.5,6 A large number of Nepalis have migrated to other countries in search of
economic opportunities and remittances constituted 12% of GDP in 2004. Politically, Nepal
was a monarchy till 1990, when widespread protests led to the establishment of a multi-party
democracy. The first parliamentary elections were held in 1991, and two further general
elections were conducted in 1994 and 1999. Even though the Nepalese Congress obtained a
majority in the elections of 1991 and 1999, Nepal has faced considerable political instability
and governments have been short-lived. Since 1991, there have been 12 governments in as
many years.
The Maoist insurgency was started on February 13, 1996, by members of the Communist
Party of Nepal-Maoist (CPN-M), with an attack on a police post at Halleri in Rolpa district
of Western Nepal. The genesis of the insurgency in the districts of Rolpa and Rukum has
been attributed to several factors, including the poverty and general underdevelopment of the
area, long-standing grievances against the government (for banning the cultivation of hashish
in the 1970s, and the crackdown on CPN-M activists during 1994, among other issues), and
a long-standing presence of Communist activists in the area (Gersony, 2003). Since 1996,
this “People’s War” has spread to most other districts of Nepal, with 73 out of 75 districts
reporting casualties in 2004. The Maoists have carried out several attacks on army barracks,
police posts, village council buildings and banks.
The chief objectives of the activist movement were to establish a people’s republic and
set up a constituent assembly to draft a new constitution. In particular, this would mean
curtailing some or all of the existing powers of the monarchy. The 75 point manifesto released
by the Maoists in November 2001 listed several other aims, including the distribution of land
to poor and landless people, equal treatment for all castes and languages, and equal rights
for women. Despite being named after Chairman Mao, the activists’ activities have been
condemned by the Chinese government, and there is no evidence that the activists enjoyed any
support from China (Raj, 2004). However, they were believed to have established links with
5Nepal Data Profile 2005, the World Bank.62001 Census.
4
[4] Weatherhead Center for International Affairs

similar activist groups in India; the 75 point manifesto promised to support all groups fighting
against “Indian expansionism”. Estimates of the size of the activist forces varied widely from
7,000-10,000 (Bray et al, 2003) to 10,000-15,000 (BBC report). They were mainly financed by
armed raids on banks, as well as taxes on the local population and remittances from abroad.
The Maoists were reported to have set up local governments and local courts in some of the
areas under their control.
In the first few years of the insurgency, the response from the government was to use the
existing law and order framework to address the problem; more than 1000 people were reported
to have been arrested and tortured by the government in 1999 (INSEC, 1999). In several areas,
the state attempted to suppress activist activity: the graph in Figure 1 shows that in 1998
and 1999, more people were killed by the state than by the Maoist activists. The political
situation changed dramatically in 2001. In June 2001, Crown Prince Dipendra allegedly killed
his father King Birendra and most members of his immediate family, including himself. His
uncle, Gyanendra, succeeded to the throne. The then Prime Minister Sher Bahadur Deuba
declared a truce with the Maoists and a first round of talks was held. However, the Maoists
unilaterally broke the cease-fire in November 2001, when they simultaneously attacked army
barracks in the mid-western region (Dang) as well as the eastern region (Salleri). Deuba then
imposed a state of emergency, declared the Maoists to be a terrorist group, and mobilized the
Royal Nepal Army to counter the insurgency. The intensity of the conflict escalated sharply
after this, with more than 3,000 people being killed by the state forces in the next year (see
Figure 1).
In addition to the insurgency, political instability continued throughout 2002: Prime Min-
ister Deuba dissolved the House of Representatives in May 2002 when he could not get their
support to extend the state of emergency. He was in turn dismissed by King Gyanendra
in October 2002, for failing to hold fresh elections in the stipulated six-month period after
dissolution of parliament. Another cease-fire agreement with the Maoists was reached in Jan-
uary 2003, and fresh talks began in April. However, the Maoists again broke the cease-fire in
August 2003, citing the government’s failure to consider their demand for a new Constituent
Assembly. Violent conflict resumed, and the Maoists extended their attention to urban areas
5
[5] Do & Iyer
as well, blockading Kathmandu for several days in August 2004.
In February 2005, in the face of growing attacks by Maoist activists, King Gyanendra
dismissed the Prime Minister, placed major political figures under arrest and seized power.
This move and the subsequent curtailment of civil liberties in Nepal was sharply criticized by
several nations, including the United States and India. In September 2005, the Maoists de-
clared a unilateral cease-fire, which was reciprocated by the government. The Maoist activists
began talks with seven major political parties in November 2005 in an attempt to present a
common front against the monarchy. In April 2006, King Gyanendra gave up absolute power
and called on the seven-party coalition to designate a Prime Minister and organize elections.
The King then ceased to be the commander-in-chief of the army, and Nepal was declared a
secular state. By November 2006, the Maoists had signed a peace deal with the seven-party
coalition, ending the decade-long war. The Maoists have now joined the seven-party coalition
in an interim legislature while preparing for upcoming elections to a Constituent Assembly
that is expected to take place in June 2007.
The total number of casualties claimed by the “People’s War” amounts to more than
13,000. There is considerable variation in the intensity of conflict in different regions of Nepal.
The number of casualties is highest in the mid-Western region where the conflict began, with
more than 4,000 deaths between February 1996 and December 2004. In contrast, the Eastern
Development region has suffered less than 1,500 casualties in the same period. The map in
Figure 2 shows this variation in the intensity of the conflict, while Figure 3 shows the spread
of conflict over time. The next section considers some hypotheses about which areas might
be more prone to civil conflict.
3 Possible causes of civil conflict
There is some diversity of views regarding the causes of the conflict in Nepal. Some reports
and studies have suggested that the Maoist conflict has found support from the oppressed
lower castes (Bray et al., 2003), portraying the insurgency as stemming from “rage against a
6
[6] Weatherhead Center for International Affairs
long legacy of oppression based on caste and ethnicity” (Sengupta, 2005). Deraniyagala (2005)
and Murshed and Gates (2005) focus on landlessness and relative deprivation as proximate
correlates of the conflict, while Macours (2006) documents the relationship between increasing
inequality and the number of abductions by the Maoists.7 However, other accounts such as
Thapa and Sijapati (2004) attribute the conflict mostly to poverty and underdevelopment
of the country. In an interview-based approach, Gersony (2003) finds that caste and ethnic
divisions are not a major contributor to the conflict. There is also the possibility that gov-
ernment repression might have generated further grievances which led to greater support for
the Maoist activists. Examples include the crackdown against CPN-M political activists as
part of a highly contentious police operation (Operation Romeo) in the districts of Rolpa and
Rukum in 1994.
Collier and Hoeffler (1998) suggest an economic framework for the general causes of civil
conflict: in their view, conflict is most likely where economic gains are high, and opportunity
costs are low. This framework suggests the following hypotheses: first, a higher per capita
income or better job prospects should reduce the risk of insurgency, since these increase the
opportunity costs of joining the activists, and hence the wages activists need to pay to recruit
people to their ranks. Second, conflict is higher where there are easily expropriable resources
such as low-weight high-value primary commodities (metals, drugs, precious stones) or where
rents from immovable assets (e.g. oil resources) can be easily extracted. They find some sup-
port for their framework in cross-country regression analysis; however, the pure “opportunity
cost” view of natural resources has been challenged and further refined both by case studies
(Collier and Sambanis, 2005) and by more detailed regression analysis (Humphreys, 2005).
Fearon (2005) presents an alternative model of insurgency and state response, in which the
link with poverty happens through much more indirect channels, since a lower opportunity
cost also means lower gains from winning the conflict. Fearon and Laitin (2003) focus on
7Deraniyagala (2005) is a descriptive study without systematic empirical analysis at the district level.
Murshed and Gates (2005) documents the differences in income across various caste categories, but does not
investigate the impact of these social divisions on conflict intensity. The estimates in this study also suffer
from multicollinearity, since the authors include schooling, life expectancy and the Human Development Index
in the same regression.
7
[7] Do & Iyer

the conditions which specifically favor insurgency. Since insurgents are usually numerically
weak compared to the governments they are fighting against, they must be able to hide from
government forces and be able to garner local support for their activities. This suggests a
number of testable hypotheses: first, the presence of mountainous or forested terrain, poorly
served by roads, should increase insurgency. Second, insurgency should be more common in
rural areas with low migration, where the rebels can easily punish people who do not support
them. Third, the need to form a cohesive fighting force implies that insurgencies should be
less common in areas of greater linguistic diversity and fewer means of communication.
Several cross-country studies have suggested that diverse societies are more prone to con-
flict (Easterly and Levine, 1997; Horowitz, 1985). Collier and Hoeffler (2004) also lay out
a “grievance” framework, where the presence of different ethnic groups is likely to lead to
the presence of significant animosity between groups; this is especially likely when one ethnic
group tends to dominate over the others. Lee et al. (2004) find that the impact of democratiza-
tion on human rights is limited by the presence of ethnic minorities. Several studies including
Alesina, Baqir and Easterly (1999) and Miguel and Gugerty (2005) have also documented the
inability of diverse societies to work together to obtain public goods.
Nepal has a very diverse society in several dimensions. Although the majority of the
population is Hindu, there are deep caste divisions in the Nepalese society. Discrimination and
human rights abuses against the lower castes are not uncommon (Human Rights Watch, 2004).
Hence, in the Nepalese context, the grievance hypothesis suggests that areas with greater
caste diversity or a greater dominance of high castes should have more conflict. Nepal also
has considerable linguistic diversity, with only 60% of the population speaking Nepali. While
other empirical analyses of the Nepal conflict (Bohara et al, 2006; Acharya, 2007) focus on the
proportion of people who speak Nepali as a measure of social diversity, they do not construct
polarization or fractionalization measures similar to the cross-country studies of civil war.8
These prior studies also do not examine the role of caste divisions at all.
8Duclos, Esteban and Ray (2004) discuss the concept, measurement and estimation of polarization in detail.
8
[8] Weatherhead Center for International Affairs
4 Data sources
We conduct our analysis using district-level data. Nepal has 5 major regions and 75 districts.
A district can be thought of as being comparable to a county in the US in the sense that
it is administratively below the region level. The average area of a district was 1948 square
kilometers in 2001, and the average population was 309,000. Our measures of conflict intensity
are based on data provided in the annual Human Rights Yearbooks published by the Informal
Sector Service Centre (INSEC), a Nepalese non-governmental organization. INSEC was able
to provide us with data on the number of people killed both by the Maoists and by the state
in this conflict, as well as measures of the number of people abducted by the Maoists and the
number of people arrested by the state. It is difficult to construct a unique reliable measure
of conflict intensity. Our main measure is the number of conflict-related deaths in the district
normalized by the district population. We use population figures from the (pre-conflict) 1991
population census data for this purpose. We also check the robustness of our results to other
measures of conflict intensity, such as a dummy which equals one if more than 100 people
have been killed in the conflict so far.9 Another imperfect measure indicating the intensity
of conflict is the number of people abducted by the Maoists normalized by the 1991 district
population.
We construct our explanatory variables using data from the 1991 and 2001 population
censuses, the Nepal Living Standards Measurement Survey 1995-1996, and the Nepal District
Profiles based on official data. Details of data sources and variable construction are provided
in the Data Appendix. As far as possible, these measures have been constructed using data
collected before the violent conflict began in 1996. This helps to partially mitigate the concerns
regarding backward causality, such as the possibility that the conflict itself has made some
areas poorer or reduced the availability of public goods.
As suggested by the opportunity cost hypothesis, we construct district-level measures of
poverty and literacy to proxy for the opportunity cost of recruiting rebel forces. We also have
9This is similar to the measures of civil war used in cross-country studies such as Fearon and Laitin (2003)
and Miguel et al. (2004).
9
[9] Do & Iyer

measures of district-level infrastructure such as the number of post offices, schools, banks and
health posts. Nepal has very few natural resources which can be easily expropriated (such as
oil or diamonds); the only natural resource which the Maoists have expressed an interest in
controlling is land. To capture geographic characteristics which make insurgency easier, we
use the altitude (elevation) of the district to indicate the presence of hilly territory, as well
as the proportion of district area which is forested. We construct a measure of the presence
of roads as the total kilometers of road length, normalized by the area of the district. We
also construct measures of government investment by looking at the change in the provision
of roads and post offices in the 1990s.
To measure the extent of social divisions, we use information on the caste and language
divisions in Nepalese society. We collected data on the number of people in different caste
groups, as well as speaking different languages from the census of 2001.10 We consider all castes
which constitute more than 1% of the population. This gives us 76 categories, which we use
to construct a diversity index. The index we use is the measure of polarization, proposed by
Esteban and Ray (1994). Montalvo and Reynal-Querol (2005) find that ethnic polarization is
highly correlated with the incidence of civil war in cross-country data.11 This index attains a
maximum value of 1, when the society is divided into two equal-sized groups, thus maximizing
the chances of conflict. The index attains a minimum value of zero, either when the society
is completely homogenous, or when every single person belongs to a different group. We also
compute a measure of caste fractionalization, similar to the ethno-linguistic fractionalization
measures used in several cross-country studies. This fractionalization measure captures the
probability that two randomly selected persons would belong to different caste groups. We
also use two alternative measures for the dominance of upper castes (Brahmins, Chhetris,
Thakuris and Newars) in the district: one is simply the proportion of these castes in the
population, and the second is a dummy which equals one if the proportion of these castes is
between 45% and 90%.
10We were unable to get this at the district level from the pre-conflict 1991 census; however, the nationwide
proportions have changed very little between 1991 and 2001.11See the Data Appendix for the details of the construction of the index.
10
[10] Weatherhead Center for International Affairs

Around 120 different languages are spoken in Nepal, some by very small numbers of people.
We construct a polarization index as well as a fractionalization index of linguistic diversity
(similar to the ones computed for caste divisions), using all languages which are spoken by
more than 1% of the population. Since the national language Nepali is the single most
spoken language, it might be easier to easier to mobilize forces in Nepali-speaking areas. We
thus include the proportion speaking Nepali as another measure of the ease of mobilization.
We should note that caste polarization is highly correlated with the fraction of people who
speak Nepali, since the high castes tend to be Nepali-speaking. On the other hand, caste
polarization is negatively correlated with linguistic polarization, suggesting that these are two
different dimensions of diversity.
Table 1 shows the mean of our variables. We note the large variation across districts both
in the measures of conflict intensity, as well as in the potential explanatory variables. More
than half of all districts have experienced 100 or more conflict-related deaths during 1996-
2004, and one-third of all districts have experienced more than 150 deaths. There are also a
large number of abductions by the Maoists, which probably reflects forced conscription into
their ranks. We also note that, on average, 42% of the population was below the poverty line
in Nepal at the time the conflict began.
Table 2 shows a correlation matrix between our measures of conflict and other variables.
The different measures of conflict are correlated with each other to some extent (Panel A).
Panel B shows that areas with higher literacy and lower poverty have less conflict; areas with
more caste diversity have lower measures of conflict, and areas with a higher proportion of
advantaged castes tend to have higher measures of conflict. Geographical characteristics also
matter: the number of deaths due to the conflict is higher in areas at higher elevations or
areas with more forest cover.
Panel C shows that the district poverty level is significantly correlated with other measures
of under-development, such as infant mortality, the presence of roads and banks, as well as
measures of the change in roads and post offices in the 1990s. Interestingly, poorer places also
have higher measures of caste polarization. Panel D illustrates that the different measures of
11
[11] Do & Iyer
caste diversity are correlated with one another, but these are negatively correlated with mea-
sures of linguistic diversity, suggesting that these are different dimensions of social diversity.
The next section uses regressions to investigate these correlations further.
5 Empirical analysis of conflict
We investigate the proximate correlates of the Maoist conflict in Nepal by running regressions
of the following form:
Conflicti = a + bXi + ei, (1)
in which Conflicti is a measure of the intensity of conflict in district i, while Xi is a vector
of pre-conflict district-level characteristics. As mentioned above, our main measure of conflict
intensity is the number of conflict-related deaths in the district from 1996 to 2004, normalized
by the population of the district. All the specifications shown exclude the districts of Rolpa and
Rukum, where the Maoist insurgency had its beginnings. This is because these districts have
a very large number of deaths compared to other places (i.e. they are statistical outliers), and
because they have other characteristics, including the long-standing presence of Communist
activists, which probably helped to spark the Maoist movement. In this sense, our analysis
focuses not on the onset, but on the spread of the conflict in the other regions of Nepal.
5.1 Main results
Our main results are summarized in Table 3. Geographical factors such as elevation and
the presence of forested area explain 25% of the variation in the intensity of conflict across
districts (column (1)).12 Column (2) shows that the pre-conflict poverty level of the district is
12We also ran specifications including district rainfall and the square of the elevation; these variables are
never significant.
12
[12] Weatherhead Center for International Affairs
a significant predictor of the intensity of conflict. Columns (3)-(5) include measures of social
divisions based on caste and language characteristics. After controlling for poverty, measures
such as the prevalence of advantaged castes, caste or linguistic polarization do not significantly
increase the intensity of conflict. The coefficient on poverty is always significant and fairly
stable across specifications. To have an idea of the magnitude of these results, we note that
a 10 percentage point increase in the district poverty rate is associated with an increase of
23-25 conflict-related deaths.13 Another way to gauge the magnitude is as follows: a one
standard-deviation increase in poverty rate (23 percentage points) is associated with 54-57
additional conflict-related deaths (0.38-0.40 standard deviations).
Re-running these regressions with literacy rates instead of poverty (a measure of current
as well as future earnings potential) yields results confirming that economic backwardness is
associated with higher levels of conflict (columns (6) and (7)). Areas with higher literacy rates
are less prone to conflict; however, now we also find caste polarization to be significantly cor-
related with the incidence of conflict, while the proportion of advantaged castes is marginally
significant. An 11 percentage point (one standard deviation) increase in literacy rates is asso-
ciated with an decrease of 65 conflict-related deaths, while a one standard-deviation increase
in caste polarization is associated with an increase of 34 conflict-related deaths (column (6)
estimates). Replacing poverty by a measure of infrastructure (road length per sq. km) also
yields a similar result: presence of infrastructure is associated with lower conflict (columns
(8) and (9)). It is interesting to note that elevation becomes insignificant when we include the
road length variable, suggesting that part of the correlation with elevation arises because of
the difficulty of building roads in hilly areas.14 We also show results with all these variables
as regressors (though these are highly correlated with each other) in column (10).
Why do poorer areas witness a higher level of conflict-related deaths? There can be
several potential reasons for this: first, consistent with the opportunity-cost view, the rebels
13For instance, using the estimates in column (2), a 10 percentage point increase in poverty results in an
additional 0.1005 deaths per 1000 population; average population of a district in 1991 was 246,548. Multiplying
the two yields the figure of 25 additional deaths. The corresponding figures for the estimates in columns (3),
(4) and (5) are 24, 24 and 23 respectively.14Elevation and road length are significantly negatively correlated.
13
[13] Do & Iyer

find it easier to recruit people to their cause in poorer areas. Second, it could be the case
that the government spends more resources to prevent activist activity in richer areas (through
information-gathering and methods other than killing a lot of suspects), so that the number of
deaths is lower in these areas. Alternatively, it could be that the state has a lower opportunity
cost of violent repression in poorer areas. Third, for the same level of Maoist and state activity,
poorer people are more likely to get killed since they have fewer means to protect themselves
or to move away from the scene of the conflict (the “collateral damage” view).
We are at this stage unable to distinguish fully between these alternatives. Looking at the
number of abductions by the Maoists (presumably to forcibly recruit people for their side),
we find the evidence to be ambiguous: poverty is not significant in explaining the number
of abductions, while literacy is (Table 5, columns (7) and (8)). Table 4 further shows that
the district poverty level is significantly associated with deaths caused both by the Maoists
and by the state. The magnitude of the impact is very similar: a one standard deviation
increase in poverty (23 percentage points) is associated with a 0.36 standard deviation in
both state-caused and Maoist-caused deaths (this works out to 38 additional state-caused
deaths and 17 additional deaths caused by Maoists). This is consistent with Maoists having
greater recruiting success in poorer areas, with the state exerting uniform effort to counter
them in all areas; it is also consistent with the Maoists having uniform recruiting success in all
areas, with the state using more resources in poorer areas. It is also interesting to note that
caste polarization is not significant for Maoist-caused deaths, suggesting that Maoist success
is probably not related to caste-based oppression.
5.2 Robustness checks
Appendix Table A1 runs the specification of Table 3, column (4), replacing the poverty mea-
sure with other measures of under-development and infrastructure availability: infant mor-
tality rates, the number of schools, health posts, post offices and banks (all normalized by
district population), as well as the change in the number of post offices and road length in the
1990’s as a crude measure of government investment in these areas. Our results on poverty
14
[14] Weatherhead Center for International Affairs
appear to be robust in the sense that only the measures which are significantly correlated
with district poverty (infant mortality, number of banks, change in road length and change in
number of post offices) appear to be significant predictors of conflict intensity.15
Appendix Table A2 checks the robustness of our results to different measures of caste and
language divisions: caste and linguistic fractionalization measures, the proportion speaking
Nepali and an advantaged caste dominance dummy (which equals 1 if the proportion of ad-
vantaged castes is between 45% and 90%).16,17 All these measures are statistically insignificant
in predicting the intensity of conflict, except for the proportion speaking Nepali when we use
the literacy rate as a measure of economic opportunities.
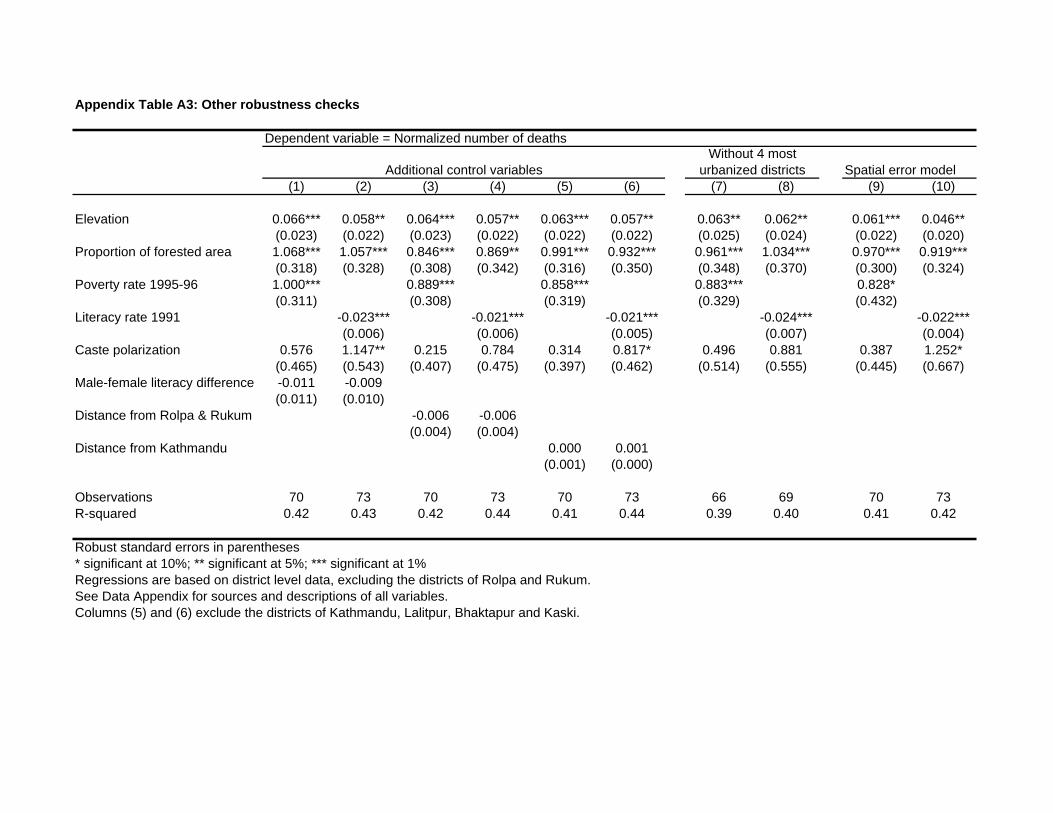
Appendix Table A3 adds additional control variables: the male-female literacy difference
to capture gender differences in society (columns (1) and (2)),18 the average distance of the
district from Rolpa and Rukum where the conflict started (columns (3) and (4)), and the
average distance of the district headquarters from the capital Kathmandu, which might be a
proxy both for remoteness of the district, as well as the strength of the state (columns (5)
and (6)). The results are also robust to dropping the four most urbanized districts from our
sample (columns (7) and (8)).19
Columns (9) and (10) correct our estimates for potential spatial correlation of errors, since
there might be spillover effects from one district to another. The results are very similar
to those obtained without such correction. We also ran specifications controlling for region
fixed effects (the coefficient on poverty becomes statistically insignificant, but literacy remains
15We also tried normalizing the number of schools, health posts, post offices and banks by the area of
the district (rather than the population); in this case, all the infrastructure variables are highly significant
predictors of the conflict. The results are available upon request.16Most of the cross-country literature uses a similar measure of ethno-linguistic fractionalization to capture
social diversity, though the polarization measure is preferred on theoretical and predictive grounds (Esteban
and Ray (2004), Montalvo and Reynal-Querol (2005)).17Collier and Hoeffler (2004) use a similar measure to capture the dominance of a specific group.18There are several accounts of women being actively involved in the insurgency.19These districts are Kathmandu, Lalitpur, Bhaktapur and Kaski. We are unable to control directly for
urbanization since this variable is missing for a large number of districts.
15
[15] Do & Iyer

strongly significant), as well as adjusting the standard errors for region-level clustering (both
poverty and literacy remain significant at the 10% level of significance).20
It is interesting that, in almost all our specifications, the relationship with caste polariza-
tion disappears when we control for poverty measures, but not when we include literacy. One
possibility is that the effect of social divisions works through poverty i.e. all else being equal,
an area with greater social divisions has greater poverty. This could be, for instance, because
of economic opportunities being denied to people of lower castes in a more polarized society, or
because the distribution of assets or incomes is also more unequal in a more polarized society
(resulting in a few rich people and a lot of poor people). Regressing the poverty measure on
the caste polarization measure (Appendix Table A4) reveals a positive relationship, even after
controlling for geography and literacy rates, suggesting that part of the relationship of caste
polarization with conflict can be explained by its impact on poverty.
5.3 Onset versus intensity of conflict
In this section, we separate out the impact of poverty and social diversity on the onset of
conflict, and the intensity of conflict, once it has begun. Esteban and Ray (2007) suggest
that the relationship between polarization, fractionalization and conflict is likely to be highly
non-linear; in particular, the relationship with the onset of conflict is likely to be different
from the relationship with the intensity of conflict, once it has begun. Looking at Table 5,
columns (1) and(2) show results from probit regressions where the dependent variable is a
dummy for whether the district witnessed more than 100 conflict-related deaths. In addition
to a robustness check on our conflict measure, this can also be interpreted as a measure of
the onset of conflict in that district. Columns (3) and (4) show similar regressions for a
dummy which equals one if the district had more than 150 conflict-related deaths. Columns
(5) and (6) regress the log of the number of people killed on the log of total population
as well as other covariates. In all cases, we find that poverty and literacy measures are
strongly and significantly correlated with the incidence of conflict in the direction we expect.
20These results are available upon request.
16
[16] Weatherhead Center for International Affairs
The coefficient on caste polarization is negative and significant for the more-than-100-deaths
dummy, suggesting that very high levels of polarization in fact raise the costs of conflict.
Columns (7) and (8) use a completely different measure of the level of Maoist activity: the
number of people abducted by the Maoists, normalized by the district population. Most of
these abductions are likely to be for the purpose of forced conscription into the activist forces,
and hence this variable can be interpreted as an indication of Maoist recruitment success.
Here we find that the coefficient on poverty is positive but not significant, while the coefficient
on literacy is significant; caste polarization is positive and significantly associated with the
extent of abductions.
Columns (9)-(12) examine the impact of social and economic factors on the intensity of
conflict, once it has started in a given region. We do this by running tobit regressions for the
number of deaths per 1000 population, as well as the log number of deaths, provided these
variables are above a certain threshold.21 We find that poorer areas are not just more likely
to experience conflict: they also experience a higher intensity of conflict, once conflict has
started. We find that the relationship between caste polarization and conflict is non-linear:
polarization is negatively related to the incidence of conflict,but is not significantly associated
with the intensity of the conflict, once it has started.
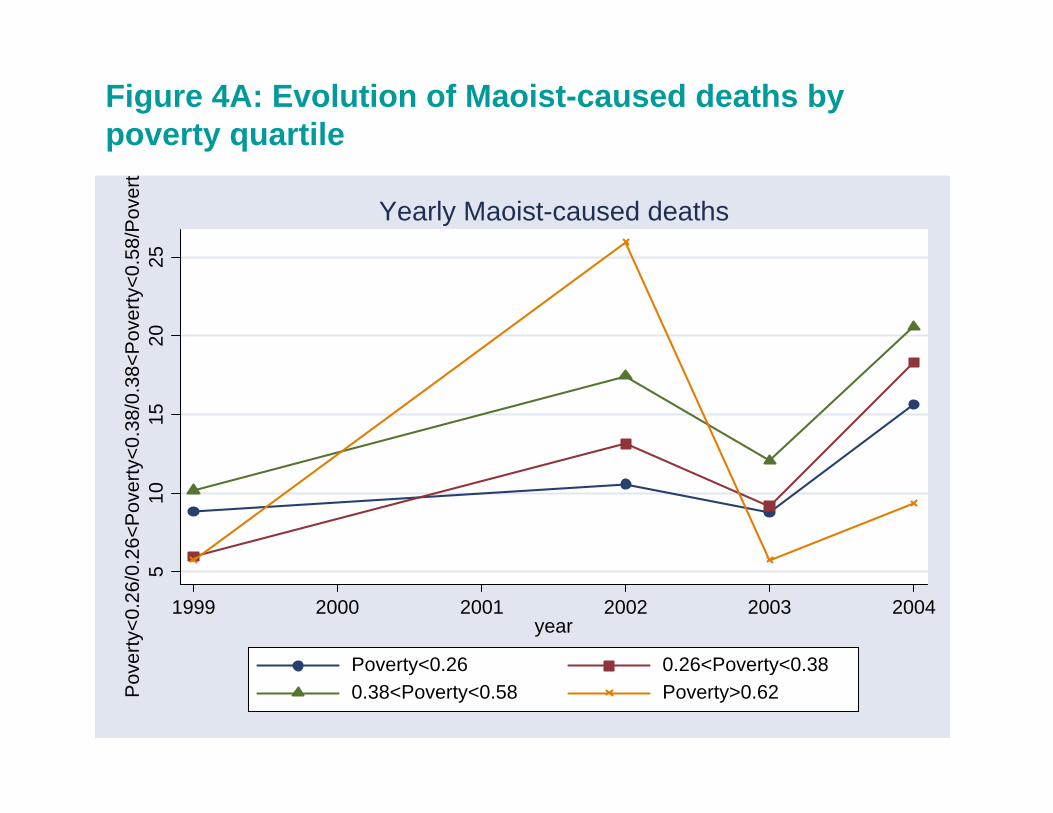
5.4 Relationship between poverty and conflict over time
Since we have annual data on conflict related deaths for 1999, 2002, 2003 and 2004, we can
document the relationship between poverty and conflict intensity over time, and we find that
this does not remain constant. Table 6 regresses year-wise conflict deaths on dummies for the
bottom three quartiles of poverty (i.e. the omitted category is the top quartile or least poor
people), as well as the top three quartiles of literacy (the omitted category is the least literate
people). We find that poverty or literacy rates are not significantly associated with Maoist-
21The threshold for the number of deaths per 1000 population is 0.25, which corresponds to the lowest
quartile of its distribution.The threshold for the number of deaths is 100, which corresponds to the “onset”
dummy in columns (1) and (2).
17
[17] Do & Iyer

caused deaths before 2002 (columns (1) and (2)), while they are significantly associated with
state-caused deaths in 1999 itself (columns (9) and (10)). In 2002, when the conflict escalated,
deaths caused by the Maoists and by the state are highest in the poorest quartile of districts
(columns (3) and (11)); similarly, deaths caused by both sides are highest lower in the most
literate districts, compared to the least literate. This might indicate a timeline in which the
state was repressing Maoist activity more strongly in the poorest areas, which in turn could
have led to greater support for the Maoist movement in those areas, resulting in a very high
number of deaths in 2002, when the conflict intensified strongly.
In 2003, the intensity of conflict is not higher in poorer areas (though high literacy areas
still show significantly lower conflict). It is interesting that by 2004, when the activists had
captured a good deal of territory, we see that the districts in the second quartile of poverty show
slightly higher levels of conflict (columns (7) and (15)). A similar result holds with literacy,
where we see the second and third quartiles of literacy having higher levels of conflict. This
does suggest that the Maoist and state effort in the conflict are moving away from the poorest
areas to the not-so-poor ones. However, these differences are not statistically significant, and
hence these results are indicative and not conclusive. This time path is consistent with the
graphs in Figures 4A and 4B: as we see, the poorest districts have the highest casualties
caused by both Maoists and the state in 2002, while in 2004 it is districts in the third quartile
of poverty who have the highest number of deaths. This changing relationship with poverty
further implies that what we observe is not just “collateral damage” i.e. poor people getting
killed in conflict simply because they cannot protect themselves.
6 Conclusion
We conduct a within-country empirical analysis of the correlates of conflict intensity in Nepal,
analogous to cross-country analyses of civil wars. Our within-country approach enables us to
examine the spread of a single conflict– across different parts of the country and over time.
We find that conflict intensity is higher in places with greater poverty, and in places with
18
[18] Weatherhead Center for International Affairs

geographical characteristics which favor insurgencies. The relationship of conflict intensity
with measures of social diversity is much less robust: there is no significant association with
measures of linguistic diversity, and part of the relationship with caste polarization appears
to be because poverty is higher in more polarized areas, perhaps because social polarization
limits the access to economic opportunities for members of the disadvantaged castes. Both
deaths caused by the Maoists and those caused by the state are significantly higher in the
poorest areas in the initial stages of the conflict. Over time, as Maoists gain control of the
poorest areas, the highest intensity of conflict shifts from the poorest areas to somewhat better
off places. The changing relationship with poverty suggests that we need to take into account
the prior evolution of a conflict in broader analyses of conflict. The within-country analysis of
conflict also raises some interesting questions: how do the parties in a conflict decide where to
devote more resources to the conflict? Will the evolution of conflict always result in a steady
state where one party wins outright? What are the circumstances under which conflict lasts
for a long time? We hope to address these issues in future theoretical and empirical work.
19
[19] Do & Iyer

References
Acharya, Avidit (2007) ‘The causes of insurgency in Nepal.’ Working paper
Alesina, Alberto, Reza Baqir, and William Easterly (1999) ‘Public goods and ethnic divisions.’
Quarterly Journal of Economics 114(4), 1243–1284
Barron, Patrick, Kai Kaiser, and Menno Pradhan (2004) ‘Local conflict in Indonesia: mea-
suring incidence and identifying patterns.’ mimeo, World Bank
Bohara, Alok, Neil Mitchell, and Mani Nepal (2006) ‘Opportunity, democracy and the ex-
change of political violence: a subnational analysis of conflict in Nepal.’ Journal of Con-
flict Resolution 50(1), 108–128
Bray, John, Leiv Lunde, and S. Mansoob Murshed (2003) ‘Nepal: Economic drivers of
the Maoist insurgency.’ In The political economy of armed conflict: Beyond greed and
grievance, ed. Karen Ballentine and Jake Sherman (Boulder, Colorado: Lynne Rienner
Publishers)
Collier, Paul, and Anke Hoeffler (1998) ‘On economic causes of civil war.’ Oxford Economic
Papers 50, 563–573
(2004) ‘Greed and grievance in civil war.’ Oxford Economic Papers (forthcoming) 56, 563–
595
Collier, Paul, and Nicholas Sambanis, eds (2005) Understanding Civil War: Evidence and
Analysis (Washington DC: The World Bank)
Deininger, Klaus (2004) ‘Causes and consequences of civil strife: micro-level evidence from
Uganda.’ mimeo, World Bank
Deraniyagala, Sonali (2005) ‘The political economy of civil conflict in Nepal.’ Oxford Devel-
opment Studies 33(1), 47–62
Duclos, Jean-Yves, Joan Esteban, and Debraj Ray (2004) ‘Polarization: Concepts, measure-
ment, estimation.’ Econometrica 72(6), 1737–1772
20
[20] Weatherhead Center for International Affairs

Easterly, William, and Ross Levine (1997) ‘Africa’s growth tragedy: Policies and ethnic divi-
sions.’ Quarterly Journal of Economics 112(4), 1203–1250
Esteban, Joan, and Debraj Ray (2007) ‘Polarization, fractionalization and conflict.’ Journal
of Peace Research, forthcoming
Esteban, Joan-Maria, and Debraj Ray (1994) ‘On the measurement of polarization.’ Econo-
metrica 62(4), 819–851
Fearon, James (2005) ‘Civil war since 1945: some facts and a theory.’ Working paper
Fearon, James, and David Laitin (2003) ‘Ethnicity, insurgency, and civil war.’ American
Political Science Review 97, 75–90
Gersony, Robert (2003) ‘Sowing the wind: History and dynamics of the Maoist revolt in
Nepal’s Rapti hills.’ Mercy Corps International Report
Human Rights Watch (2004) ‘Discrimination against Dalits in Nepal.’
http://hrw.org/english/docs/2004/02/09/nepal7322.htm
Humphreys, Macartan (2003) ‘Economics and violent conflict.’ Review essay, HPCR Conflict
Prevention Initiative
(2005) ‘Natural resources, conflict and conflict resolution.’ Journal of Conflict Resolution
49(4), 508–537
Informal Sector Service Centre (various issues) Human Rights Yearbook (Kathmandu, Nepal:
INSEC)
Lee, Chris, Ronny Lindstrom, Will H. Moore, and Kursad Turan (2004) ‘Ethnicity and repres-
sion: teh ethnic composition of countries and human rights violations.’ In Understanding
Human Rights Violations: New systematic studies, ed. S.C. Carey and S.C. Poe (Alder-
shot: Ashgate) pp. 186–201
Macours, Karen (2006) ‘Relative deprivation and civil conflict in Nepal.’ Working paper
21
[21] Do & Iyer

Miguel, Edward, and Mary Kay Gugerty (2005) ‘Ethnic diversity, social sanctions and public
goods in Kenya.’ Journal of Public Economics 89(11-12), 2325–2368
Miguel, Edward, Shanker Satyanath, and Ernest Sergenti (2004) ‘Economic shocks and civil
conflict: an instrumental variables approach.’ Journal of Political Economy 112(4), 725–
753
Montalvo, Jose G., and Marta Reynal-Querol (2005) ‘Ethnic polarization, potential conflict
and civil wars.’ American Economic Review 95(3), 796–816
Murshed, Mansoob S., and Scott Gates (2005) ‘Spatial-horizontal inequality and the Maoist
insurgency in Nepal.’ Review of Development Economics 9(1), 121–134
Raj, Prakash A. (2004) Maoists in the land of Buddha: an analytical study of the Maoist
insurgency in Nepal (Delhi: Nirala Publications)
Sambanis, Nicholas (2001) ‘Do ethnic and nonethnic civil wars have the same causes?’ Journal
of Conflict Resolution 45(3), 259–282
(2004) ‘What is a civil war? Conceptual and empirical complexities of an operational
definition.’ Journal of Conflict Resolution 48(6), 814–858
Sengupta, Somini (2005) ‘Where Maoists still matter.’ The New York Times p. 30 October
Thapa, Deepak, and Bandira Sijapati (2004) A Kingdom Under Siege: Nepal’s Maoist Insur-
gency, 1996 to 2003 (Kathmandu: The Printhouse)
22
[22] Weatherhead Center for International Affairs
7 Data Appendix
A. Measures of conflict: These were computed using data obtained from the website of
the Informal Sector Service Center (INSEC), a Nepalese NGO which documents human rights
abuses across all the districts of Nepal. We obtained data on the number of conflict-related
deaths between 13 February, 1996 and 31 December, 2004, caused by the state and by the
Maoists separately. We also obtained annual data on the number of conflict-related deaths for
the years 1999, 2002, 2003 and 2004 from the Human Rights Yearbook published by INSEC
for various years. We use district population data from the 1991 census. The main variables
are defined as follows:
Normalized total killed = Total killed between 1996 and 2004 divided by district population
(in thousands).
Dummy for more than 100 people killed equals one if the total people killed between 1996
and 2004 is greater than 100.
Normalized total abducted = Total number of people abducted by Maoists between 1996
and 2004 divided by district population (in thousands).
B. Geography: Data on latitude, rainfall and maximum elevation of the district was obtained
from Nepal District Profile:1994. Data on proportion of district under forest area dates from
March 2001 and was obtained from Japan Forest Technology Association (JAFTA), Informa-
tion System Development Project For The Management of Tropical Forest: Activity Report of
Wide Area Tropical Forest Resources Survey (Kingdom of Nepal).
C. Development indicators: Poverty figures (indicating the proportion of households in
the districts below the poverty level) were obtained from the Nepal Living Standards Survey
1995-96 (NLSS-I) conducted by the World Bank. Literacy rates for 1991 were obtained from
the 1991 Census. Infant mortality rates come from the Nepal District Profile:1994.
D. Infrastructure: Data on roads, post offices, schools, banks and health posts come from
23
[23] Do & Iyer

Nepal District Profile:1994 and Nepal District Profile : 2002. They are normalized by the
population of the district.
E. Caste and language diversity : Caste polarization and fractionalization measures were
computed using 2001 district level census data on population by caste (the 2001 nationwide
caste proportions are very similar to the pre-conflict 1991 caste proportions; however, we do
not have the latter at the district level). We retained castes which make up more than 1% of the
district population, castes that make up less than 1% of the district population are classified as
“others”. We have 76 distinct categories under this measure. The proportion for each category
is computed by dividing total number of individuals in the district falling under that category
by respective district population. The polarization measures are constructed along the lines
of Montalvo and Reynal-Querol (2005) as 4∑
s2i (1 − si), where si is the proportion of (caste
or linguistic) group i in the population. The caste fractionalization measure is computed as∑si(1 − si) = 1 − ∑
s2i , where si is the proportion of caste group i in the population. This
represents the probability that two randomly drawn persons from the population belong to
different caste groups.
Proportion of advantaged castes is computed as the proportion of district population be-
longing to the Brahmin, Chhetri, Thakuri or Newar castes. High caste dominance is a dummy
which equals one if the proportion of advantaged castes is between 45 and 90 percent of the
district population.
For measures of linguistic diversity, we use data from 2001 census on the number of people
speaking different languages. We retain languages spoken by more than 1% of the population,
and the remaining are put under ”others” category. This gives us 13 different categories.
Linguistic polarization and fractionalization measures are computed similar to the caste po-
larization and fractionalization measures.
24
[24] Weatherhead Center for International Affairs
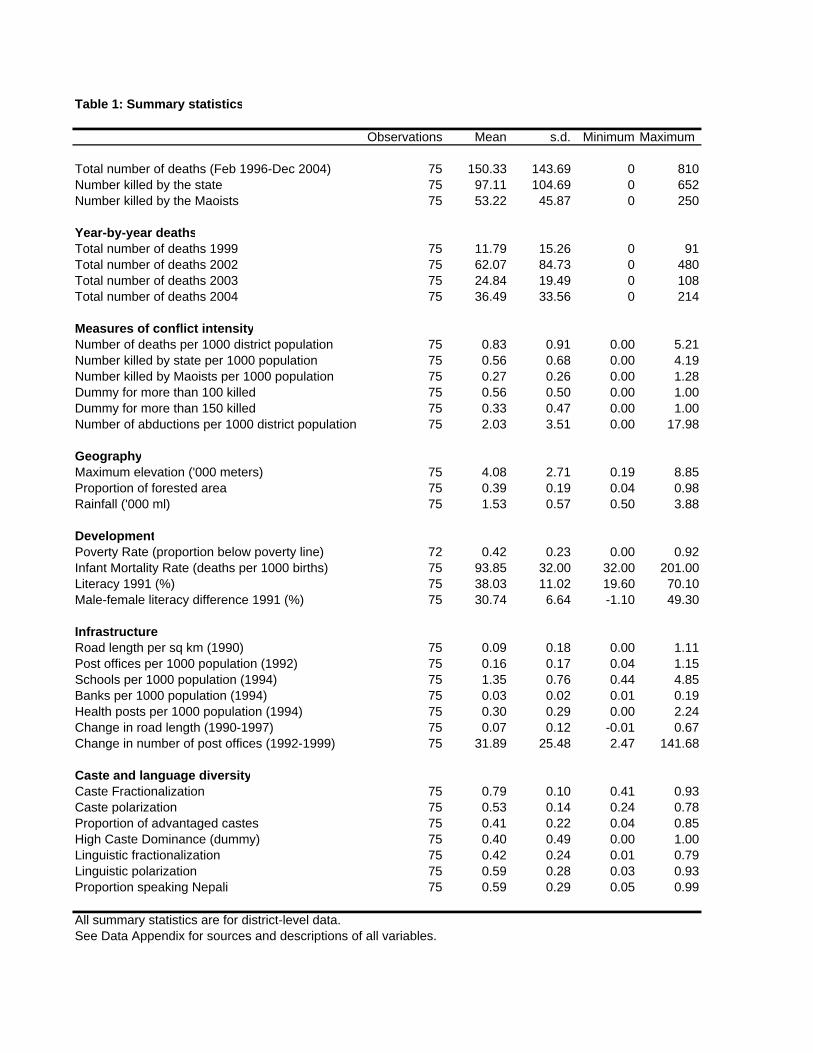
Table 1: Summary statistics
Observations Mean s.d. Minimum Maximum
Total number of deaths (Feb 1996-Dec 2004) 75 150.33 143.69 0 810Number killed by the state 75 97.11 104.69 0 652Number killed by the Maoists 75 53.22 45.87 0 250
Year-by-year deathsTotal number of deaths 1999 75 11.79 15.26 0 91Total number of deaths 2002 75 62.07 84.73 0 480Total number of deaths 2003 75 24.84 19.49 0 108Total number of deaths 2004 75 36.49 33.56 0 214
Measures of conflict intensityNumber of deaths per 1000 district population 75 0.83 0.91 0.00 5.21Number killed by state per 1000 population 75 0.56 0.68 0.00 4.19Number killed by Maoists per 1000 population 75 0.27 0.26 0.00 1.28Dummy for more than 100 killed 75 0.56 0.50 0.00 1.00Dummy for more than 150 killed 75 0.33 0.47 0.00 1.00Number of abductions per 1000 district population 75 2.03 3.51 0.00 17.98
GeographyMaximum elevation ('000 meters) 75 4.08 2.71 0.19 8.85Proportion of forested area 75 0.39 0.19 0.04 0.98Rainfall ('000 ml) 75 1.53 0.57 0.50 3.88
DevelopmentPoverty Rate (proportion below poverty line) 72 0.42 0.23 0.00 0.92Infant Mortality Rate (deaths per 1000 births) 75 93.85 32.00 32.00 201.00Literacy 1991 (%) 75 38.03 11.02 19.60 70.10Male-female literacy difference 1991 (%) 75 30.74 6.64 -1.10 49.30
InfrastructureRoad length per sq km (1990) 75 0.09 0.18 0.00 1.11Post offices per 1000 population (1992) 75 0.16 0.17 0.04 1.15Schools per 1000 population (1994) 75 1.35 0.76 0.44 4.85Banks per 1000 population (1994) 75 0.03 0.02 0.01 0.19Health posts per 1000 population (1994) 75 0.30 0.29 0.00 2.24Change in road length (1990-1997) 75 0.07 0.12 -0.01 0.67Change in number of post offices (1992-1999) 75 31.89 25.48 2.47 141.68
Caste and language diversityCaste Fractionalization 75 0.79 0.10 0.41 0.93Caste polarization 75 0.53 0.14 0.24 0.78Proportion of advantaged castes 75 0.41 0.22 0.04 0.85High Caste Dominance (dummy) 75 0.40 0.49 0.00 1.00Linguistic fractionalization 75 0.42 0.24 0.01 0.79Linguistic polarization 75 0.59 0.28 0.03 0.93Proportion speaking Nepali 75 0.59 0.29 0.05 0.99
All summary statistics are for district-level data.See Data Appendix for sources and descriptions of all variables.

Table 2: Correlations
Panel A: Correlations among conflict intensity measures Deaths per
1000 population
Killed by state per 1000
population
Killed by Maoists per 1000
population
Dummy for more than 100 killed
Killed by state per 1000 population 0.9780*Killed by Maoists per 1000 population 0.8901* 0.7754*Dummy for more than 100 killed 0.4700* 0.4525* 0.4341*Abductions per 1000 population 0.6438* 0.6717* 0.4812* 0.2584*
Panel B: Correlations between conflict intensity and district characteristicsNormalized number of
deaths
Dummy for more than 100
killed
Normalized number of abductions
Elevation 0.3236* -0.0015 0.2016Proportion of forested area 0.3562* 0.3635* 0.2667*Poverty Rate 0.4939* 0.2370* 0.3597*Total Literacy Rate 1991 -0.4285* -0.3370* -0.3029*Road length per sq km 1990 -0.3208* -0.2477* -0.2224Caste Fractionalization -0.2796* 0.1666 -0.3550*Linguistic fractionalization -0.3922* -0.0943 -0.4217*Proportion of advantaged castes 0.3691* -0.0274 0.4117*Proportion speaking Nepali 0.5173* 0.1313 0.4437*
Panel C: Correlations between district poverty rate and other district characteristicsPoverty Rate
Total Literacy Rate 1991 -0.5641*Infant mortality rate 0.6091*Road length per sq km 1990 -0.3188*Post offices per 1000 population (1992) -0.0835Schools per 1000 population (1994) -0.0499Banks per 1000 population (1994) -0.3519*Health posts per 1000 population (1994) -0.0229Change in road length (1990-1997) -0.3317*Change in number of post offices (1992-1999) -0.3509*Caste polarization 0.3162*Proportion of advantaged castes 0.3572*Proportion speaking Nepali 0.4786*
Panel D: Correlations between caste polarization and other diversity measuresCaste polarization
Caste Fractionalization -0.8376*Proportion of advantaged castes 0.6952*High caste dominance dummy 0.5302*Linguistic fractionalization -0.3790*Linguistic polarization -0.2526*Proportion speaking Nepali 0.6386*
See Data Appendix for sources and descriptions of variables. All correlations are computed excluding the districts of Rolpa and Rukum. * indicates a significant correlation at the 5% level of significance.
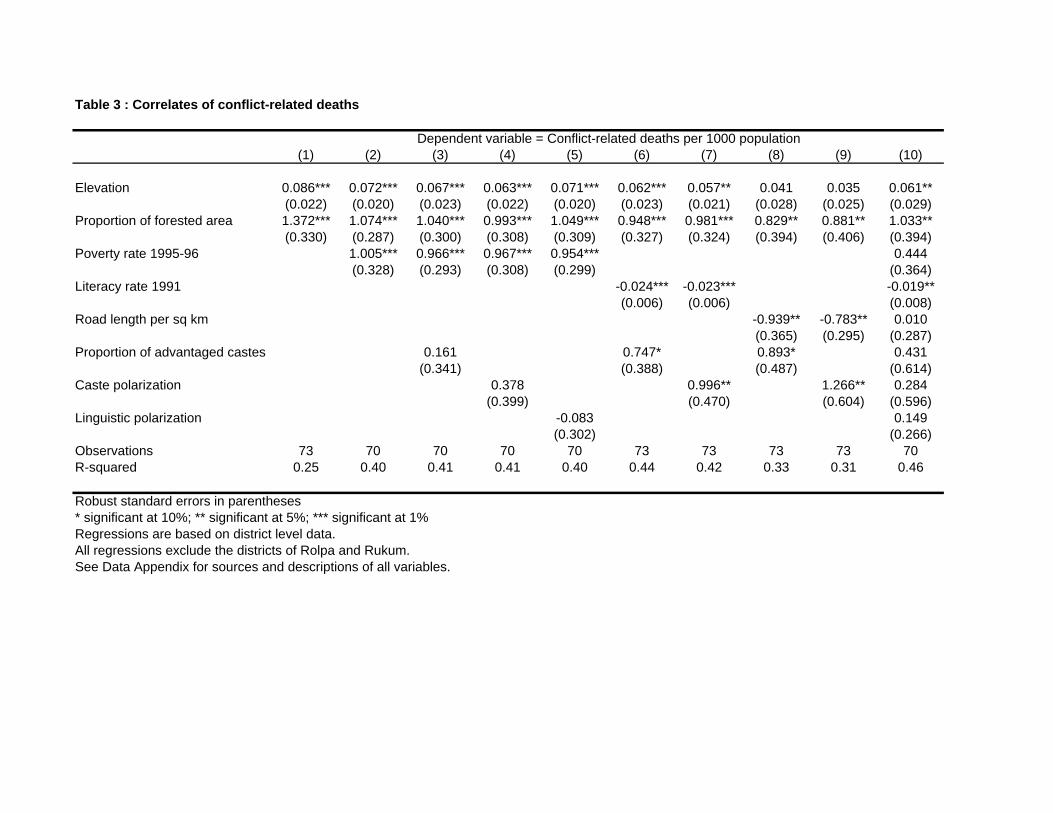
Table 3 : Correlates of conflict-related deaths
(1) (2) (3) (4) (5) (6) (7) (8) (9) (10)
Elevation 0.086*** 0.072*** 0.067*** 0.063*** 0.071*** 0.062*** 0.057** 0.041 0.035 0.061**(0.022) (0.020) (0.023) (0.022) (0.020) (0.023) (0.021) (0.028) (0.025) (0.029)
Proportion of forested area 1.372*** 1.074*** 1.040*** 0.993*** 1.049*** 0.948*** 0.981*** 0.829** 0.881** 1.033**(0.330) (0.287) (0.300) (0.308) (0.309) (0.327) (0.324) (0.394) (0.406) (0.394)
Poverty rate 1995-96 1.005*** 0.966*** 0.967*** 0.954*** 0.444(0.328) (0.293) (0.308) (0.299) (0.364)
Literacy rate 1991 -0.024*** -0.023*** -0.019**(0.006) (0.006) (0.008)
Road length per sq km -0.939** -0.783** 0.010(0.365) (0.295) (0.287)
Proportion of advantaged castes 0.161 0.747* 0.893* 0.431(0.341) (0.388) (0.487) (0.614)
Caste polarization 0.378 0.996** 1.266** 0.284(0.399) (0.470) (0.604) (0.596)
Linguistic polarization -0.083 0.149(0.302) (0.266)
Observations 73 70 70 70 70 73 73 73 73 70R-squared 0.25 0.40 0.41 0.41 0.40 0.44 0.42 0.33 0.31 0.46
Robust standard errors in parentheses* significant at 10%; ** significant at 5%; *** significant at 1%Regressions are based on district level data. All regressions exclude the districts of Rolpa and Rukum.See Data Appendix for sources and descriptions of all variables.
Dependent variable = Conflict-related deaths per 1000 population

Table 4 : Correlates of deaths caused by Maoists and the state
(1) (2) (3) (4) (5) (6) (7) (8) (9) (10)
Elevation 0.027*** 0.021*** 0.022*** 0.019*** 0.020*** 0.059*** 0.046** 0.042** 0.043** 0.037**(0.008) (0.007) (0.007) (0.007) (0.007) (0.016) (0.018) (0.017) (0.018) (0.016)
Proportion of forested area 0.371*** 0.310*** 0.312*** 0.237 0.264* 1.001*** 0.729*** 0.682*** 0.712*** 0.717***(0.140) (0.114) (0.114) (0.143) (0.147) (0.214) (0.208) (0.218) (0.208) (0.204)
Poverty rate 1995-96 0.294*** 0.299*** 0.671*** 0.668***(0.096) (0.102) (0.223) (0.229)
Literacy rate 1991 -0.008*** -0.007*** -0.017*** -0.016***(0.002) (0.002) (0.004) (0.004)
Proportion of advantaged castes 0.027 0.239* 0.134 0.507*(0.101) (0.129) (0.257) (0.281)
Caste polarization 0.020 0.245 0.357 0.751**(0.139) (0.186) (0.286) (0.321)
Observations 73 70 70 73 73 73 70 70 73 73R-squared 0.20 0.38 0.37 0.37 0.34 0.25 0.37 0.37 0.42 0.41
Robust standard errors in parentheses* significant at 10%; ** significant at 5%; *** significant at 1%Regressions are based on district level data. All regressions exclude the districts of Rolpa and Rukum.See Data Appendix for sources and descriptions of all variables.
Deaths caused by Maoists per 1000 population Death caused by the state per 1000 populationDependent variable = Dependent variable =
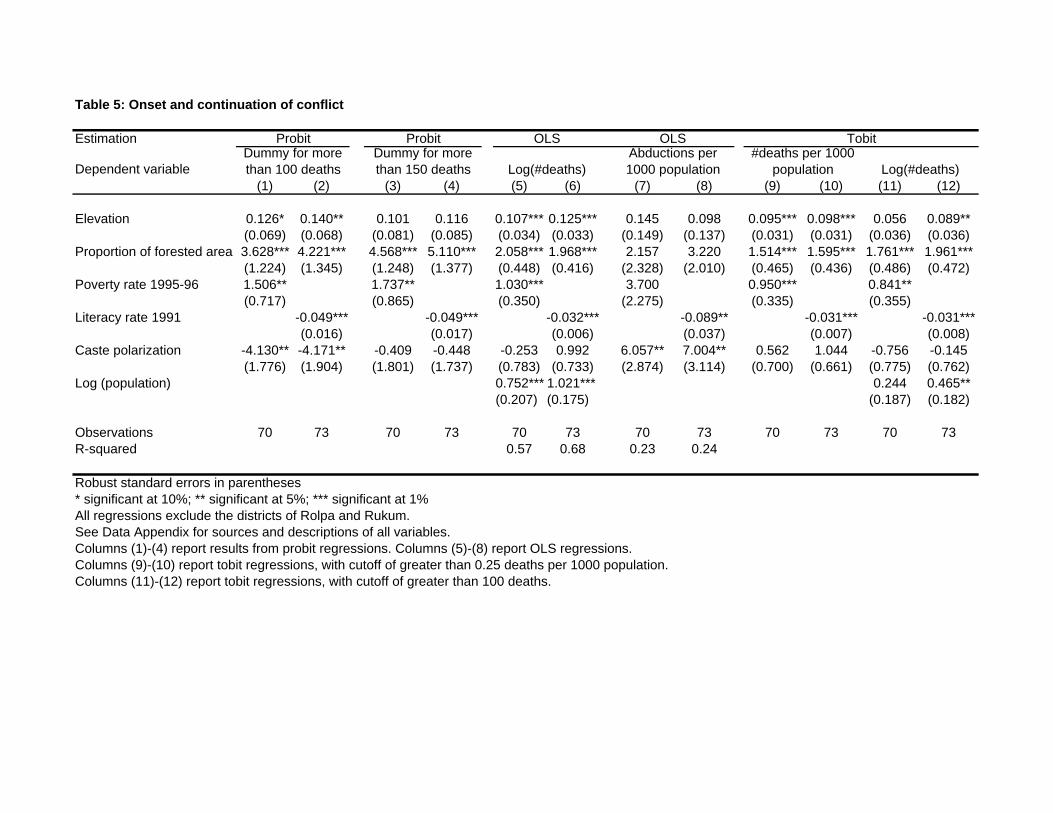
Table 5: Onset and continuation of conflict
Estimation
Dependent variable(1) (2) (3) (4) (5) (6) (7) (8) (9) (10) (11) (12)
Elevation 0.126* 0.140** 0.101 0.116 0.107*** 0.125*** 0.145 0.098 0.095*** 0.098*** 0.056 0.089**(0.069) (0.068) (0.081) (0.085) (0.034) (0.033) (0.149) (0.137) (0.031) (0.031) (0.036) (0.036)
Proportion of forested area 3.628*** 4.221*** 4.568*** 5.110*** 2.058*** 1.968*** 2.157 3.220 1.514*** 1.595*** 1.761*** 1.961***(1.224) (1.345) (1.248) (1.377) (0.448) (0.416) (2.328) (2.010) (0.465) (0.436) (0.486) (0.472)
Poverty rate 1995-96 1.506** 1.737** 1.030*** 3.700 0.950*** 0.841**(0.717) (0.865) (0.350) (2.275) (0.335) (0.355)
Literacy rate 1991 -0.049*** -0.049*** -0.032*** -0.089** -0.031*** -0.031***(0.016) (0.017) (0.006) (0.037) (0.007) (0.008)
Caste polarization -4.130** -4.171** -0.409 -0.448 -0.253 0.992 6.057** 7.004** 0.562 1.044 -0.756 -0.145(1.776) (1.904) (1.801) (1.737) (0.783) (0.733) (2.874) (3.114) (0.700) (0.661) (0.775) (0.762)
Log (population) 0.752*** 1.021*** 0.244 0.465**(0.207) (0.175) (0.187) (0.182)
Observations 70 73 70 73 70 73 70 73 70 73 70 73R-squared 0.57 0.68 0.23 0.24
Robust standard errors in parentheses* significant at 10%; ** significant at 5%; *** significant at 1%All regressions exclude the districts of Rolpa and Rukum.See Data Appendix for sources and descriptions of all variables.Columns (1)-(4) report results from probit regressions. Columns (5)-(8) report OLS regressions.Columns (9)-(10) report tobit regressions, with cutoff of greater than 0.25 deaths per 1000 population.Columns (11)-(12) report tobit regressions, with cutoff of greater than 100 deaths.
Log(#deaths)#deaths per 1000
population
TobitProbit OLS
Log(#deaths)Abductions per 1000 population
OLSProbitDummy for more than 100 deaths
Dummy for more than 150 deaths

Table 6 : Relationship of conflict intensity and poverty over time
(1) (2) (3) (4) (5) (6) (7) (8) (9) (10) (11) (12) (13) (14) (15) (16)
Elevation 0.001 0.001 0.003 0.003 0.001 0.001 0.003 0.002 0.001 0.001 0.011 0.012 0.007* 0.006* 0.024** 0.021*(0.001) (0.001) (0.004) (0.004) (0.001) (0.001) (0.004) (0.003) (0.001) (0.001) (0.009) (0.009) (0.004) (0.004) (0.012) (0.011)
Prop. forested area 0.037* 0.019 0.084 0.152* 0.025 0.028 0.045 0.034 0.054** 0.060* 0.380** 0.504*** 0.086** 0.100** 0.029 0.051(0.019) (0.034) (0.065) (0.078) (0.024) (0.023) (0.037) (0.038) (0.025) (0.032) (0.154) (0.163) (0.042) (0.043) (0.096) (0.083)
Poorest quartile 0.004 0.116** 0.006 -0.022 0.024** 0.235** 0.023 -0.037(0.009) (0.048) (0.010) (0.023) (0.012) (0.106) (0.027) (0.047)
Second-poorest quartile 0.003 0.016 0.008 0.023 -0.001 0.047 -0.011 0.066(0.004) (0.018) (0.009) (0.026) (0.003) (0.056) (0.023) (0.099)
Third-poorest quartile -0.010* 0.010 0.003 0.007 -0.002 -0.017 -0.015 -0.002(0.005) (0.015) (0.007) (0.016) (0.005) (0.050) (0.021) (0.029)
Highest literacy quartile -0.014 -0.113** -0.018*** -0.003 -0.020* -0.267*** -0.045** -0.008(0.012) (0.044) (0.007) (0.012) (0.011) (0.089) (0.019) (0.022)
2nd highest literacy quartile -0.010 -0.073 -0.009 0.035 -0.017 -0.181* -0.023 0.103(0.012) (0.047) (0.008) (0.025) (0.012) (0.096) (0.022) (0.090)
3rd highest literacy quartile -0.014 -0.080 0.002 0.017 -0.018 -0.271*** -0.009 0.032(0.011) (0.052) (0.008) (0.017) (0.015) (0.093) (0.025) (0.029)
Caste Polarization -0.010 0.014 0.061 0.155 0.004 0.000 0.030 -0.019 -0.038 -0.004 0.241 0.473** -0.042 0.010 0.077 -0.066(0.023) (0.031) (0.082) (0.094) (0.027) (0.020) (0.068) (0.049) (0.029) (0.020) (0.206) (0.216) (0.070) (0.059) (0.186) (0.087)
Observations 70 73 70 73 70 73 70 73 70 73 70 73 70 73 70 73R-squared 0.15 0.07 0.23 0.23 0.08 0.18 0.08 0.08 0.23 0.19 0.33 0.37 0.16 0.19 0.12 0.12Robust standard errors in parentheses* significant at 10%; ** significant at 5%; *** significant at 1%Regressions are based on district level data. All regressions exclude the districts of Rolpa and Rukum.See Data Appendix for sources and descriptions of all variables.Poorest quartile of poverty has poverty>0.62; second-poorest has 0.38<poverty<0.58; third quartile has 0.26<poverty<0.38 and richest quartile has poverty<0.26.Highest literacy quartile has literacy>46%; 2nd highest literacy quartile has 39%<literacy<46%; 3rd highest quartile has 30%<literacy<39% and lowest quartile (omitted category) has literacy<30%.
Dependent variable: Maoist-caused deaths per 1000 population Dependent variable: state-caused deaths per 1000 population1999 2002 2003 2004 1999 2002 2003 2004

Appendix Table A1 : Robustness using different measures of underdevelopment and infrastructure
(1) (2) (3) (4) (5) (6) (7)
Elevation 0.052** 0.084*** 0.064** 0.075*** 0.068*** 0.038 0.032(0.023) (0.031) (0.025) (0.025) (0.023) (0.025) (0.024)
Proportion of forested area 0.823** 1.044*** 1.152*** 1.001*** 0.835** 0.978** 0.869**(0.361) (0.345) (0.343) (0.377) (0.364) (0.372) (0.401)
Infant mortality rate 0.008***(0.003)
Schools per 1000 population (1994) -0.139(0.122)
Health posts per 1000 population (1994) -0.028(0.297)
Post offices per 1000 population (1992) -0.510(0.345)
Banks per 1000 population (1994) -7.379***(2.560)
Change in road length (1990-1997) -1.232***(0.374)
Change in number of post offices (1992-1999) -0.007***(0.002)
Caste polarization 0.292 1.112* 0.909* 1.060* 1.098** 1.159** 1.113**(0.422) (0.590) (0.528) (0.572) (0.546) (0.558) (0.547)
Observations 73 73 73 73 73 73 73R-squared 0.37 0.29 0.28 0.29 0.33 0.32 0.34
Robust standard errors in parentheses* significant at 10%; ** significant at 5%; *** significant at 1%Regressions are based on district level data, excluding the districts of Rolpa and Rukum.See Data Appendix for sources and descriptions of all variables.
Dependent variable = Deaths per 1000 population

Appendix Table A2 : Robustness using different measures of caste and language divisions
(1) (2) (3) (4) (5) (6) (7) (8) (9)
Elevation 0.069*** 0.069*** 0.069*** 0.057** 0.074*** 0.073*** 0.079*** 0.047** 0.080***(0.024) (0.021) (0.020) (0.023) (0.024) (0.022) (0.021) (0.022) (0.021)
Proportion of forested area 1.070*** 1.038*** 1.009*** 0.843** 1.185*** 1.056*** 1.111*** 0.553 1.126***(0.294) (0.298) (0.302) (0.356) (0.321) (0.315) (0.323) (0.412) (0.330)
Poverty rate 1995-96 0.980*** 0.961*** 0.899*** 0.886***(0.291) (0.310) (0.295) (0.288)
Literacy rate 1991 -0.022*** -0.022*** -0.021*** -0.023*** -0.021***(0.006) (0.006) (0.006) (0.005) (0.006)
Caste fractionalization -0.236 -0.495(0.790) (0.901)
High caste dominance dummy 0.085 0.264*(0.132) (0.139)
Linguistic fractionalization -0.220 -0.225(0.301) (0.314)
Proportion speaking Nepali 0.326 0.759**(0.278) (0.310)
Linguistic polarization -0.164(0.287)
Observations 70 70 70 70 73 73 73 73 73R-squared 0.40 0.41 0.41 0.41 0.40 0.43 0.40 0.46 0.40
Robust standard errors in parentheses* significant at 10%; ** significant at 5%; *** significant at 1%Regressions are based on district level data, excluding the districts of Rolpa and Rukum.See Data Appendix for sources and descriptions of all variables.
Dependent variable = Deaths per 1000 population
Appendix Table A3: Other robustness checks
Dependent variable = Normalized number of deaths
Spatial error model(1) (2) (3) (4) (5) (6) (7) (8) (9) (10)
Elevation 0.066*** 0.058** 0.064*** 0.057** 0.063*** 0.057** 0.063** 0.062** 0.061*** 0.046**(0.023) (0.022) (0.023) (0.022) (0.022) (0.022) (0.025) (0.024) (0.022) (0.020)
Proportion of forested area 1.068*** 1.057*** 0.846*** 0.869** 0.991*** 0.932*** 0.961*** 1.034*** 0.970*** 0.919***(0.318) (0.328) (0.308) (0.342) (0.316) (0.350) (0.348) (0.370) (0.300) (0.324)
Poverty rate 1995-96 1.000*** 0.889*** 0.858*** 0.883*** 0.828*(0.311) (0.308) (0.319) (0.329) (0.432)
Literacy rate 1991 -0.023*** -0.021*** -0.021*** -0.024*** -0.022***(0.006) (0.006) (0.005) (0.007) (0.004)
Caste polarization 0.576 1.147** 0.215 0.784 0.314 0.817* 0.496 0.881 0.387 1.252*(0.465) (0.543) (0.407) (0.475) (0.397) (0.462) (0.514) (0.555) (0.445) (0.667)
Male-female literacy difference -0.011 -0.009(0.011) (0.010)
Distance from Rolpa & Rukum -0.006 -0.006(0.004) (0.004)
Distance from Kathmandu 0.000 0.001(0.001) (0.000)
Observations 70 73 70 73 70 73 66 69 70 73R-squared 0.42 0.43 0.42 0.44 0.41 0.44 0.39 0.40 0.41 0.42
Robust standard errors in parentheses* significant at 10%; ** significant at 5%; *** significant at 1%Regressions are based on district level data, excluding the districts of Rolpa and Rukum.See Data Appendix for sources and descriptions of all variables.Columns (5) and (6) exclude the districts of Kathmandu, Lalitpur, Bhaktapur and Kaski.
Additional control variablesWithout 4 most
urbanized districts

Appendix Table A4: Relationship between poverty and caste polarization
(1) (2) (3)
Caste polarization 0.540*** 0.386* 0.488***(0.167) (0.219) (0.174)
Elevation 0.002 -0.001(0.010) (0.008)
Proportion of forested area 0.311* 0.192(0.165) (0.130)
Literacy rate 1991 -0.012***(0.002)
Observations 70 70 70R-squared 0.10 0.15 0.45
Robust standard errors in parentheses* significant at 10%; ** significant at 5%; *** significant at 1%Regressions are based on district level data. All regressions exclude the districts of Rolpa and Rukum.See Data Appendix for sources and descriptions of all variables.
Dependent variable = Poverty rate

Figure 1: Number of conflict-related deaths
0
500
1000
1500
2000
2500
3000
3500
1996 1998 2000 2002 2004
Year
Num
ber o
f dea
ths
# killed bystate# killed byMaoists

Figure 2: Map of conflict intensity (number of deaths per 1000 population)

Figure 3: Geographical spread of conflict over time
2001 2002
2003 2004
Districts reporting more than 100 deaths since 1996
510
1520
25P
over
ty<0
.26/
0.26
<Pov
erty
<0.3
8/0.
38<P
over
ty<0
.58/
Pov
ert
1999 2000 2001 2002 2003 2004year
Poverty<0.26 0.26<Poverty<0.380.38<Poverty<0.58 Poverty>0.62
Yearly Maoist-caused deaths
Figure 4A: Evolution of Maoist-caused deaths by poverty quartile

Figure 4B: Evolution of State-caused deaths by poverty quartile
020
4060
Pov
erty
<0.2
6/0.
26<P
over
ty<0
.38/
0.38
<Pov
erty
<0.5
8/P
over
t
1999 2000 2001 2002 2003 2004year
Poverty<0.26 0.26<Poverty<0.380.38<Poverty<0.58 Poverty>0.62
Yearly state-caused deaths