poverty traps and economic growth: evidence from pakistan
TRANSCRIPT

121
Poverty Traps and Economic Growth: Evidence from Pakistan
Farzana Naheed Khan1, M Tariq Majeed2
Abstract
The research on economic growth and poverty has largely considered poverty as an outcome of lower growth performance. In contrary to this commonly held belief that growth is necessary to reduce poverty, in this study we argue that poverty traps create self-perpetuating mechanisms that impede long-run economic growth. Poverty results in forgone growth opportunities because of higher transaction cost. Moreover, the poor people who are financially distress and also distrustful are likely to be excluded from the active and efficient participation in economic activities. This study investigates the impact of poverty on economic growth in Pakistan using annual data for the period 1975 to 2016. The empirical analysis for the effect of poverty on economic growth is based on ARDL approach to cointegration, generalized method of moments, fully modified OLS, and dynamic ordinary least square estimation techniques. The main finding suggests that poverty inhibits economic growth performance of Pakistan and this finding is robust to diverse estimation methods. Therefore, growth policies should be designed not only to enhance economic growth but also should exert an independent influence on poverty reduction, thereby reducing the drag of poverty on growth.
Key Words: Poverty trap, poverty, economic growth, inequality
JEL Classification: I32, O40
1. Introduction
Recently, many theoretical studies have discussed a number of mechanisms which generate vicious cycles of poverty and stagnations-known as poverty trap (Azariadis & Stachurski, 2004; Perry et al., 2006, p. 106). The basic idea given in these studies is that poverty produces poverty and economies do not grow because they are too poor to grow (Kraay and McKenzie, 2014). The poverty-growth link is very critical for Pakistan as growth performance has been disappointing for Pakistan in the last decade whereas, 39% of the population is multi-dimensionally poor (UNDP, 2016).
1 Assistant Professor, School of Economics, Quaid-i-Azam University, Islamabad. E-mail: [email protected] Assistant Professor, School of Economics, Quaid-i-Azam University, Islamabad
Business & Economic Review: Vol. 10, No.4 2018 pp. 121-142DOI: dx.doi.org/10.22547/BER/10.4.6
ARTICLE HISTORY
2 May, 2018 Submission Received 13 Aug, 2018 First Review
7 Oct, 2018 Second Review 29 Nov, 2018 Third Review
9 Dec, 2018 Accepted

Farzana Naheed Khan, M Tariq Majeed122
Besides, Lavopa and Szirmai (2018) warn that Pakistan is at the risk of falling into trap.3
Hence, it is important to investigate the relationship between poverty and economic growth in the context of Pakistan.
The concept of poverty trap generally considers the transmission of intergener-ational socioeconomic status and it may operate at household, regional or national level (Barrett & Carter, 2013; Vauhkonen et al., 2017). Therefore, a household, region or country may be poor for multiple periods because of “any self-rein-forcing mechanism which causes poverty to persist” (Kraay & Raddatz, 2007).4
Whereas, most of the self-reinforcing mechanisms that underlie individual poverty traps provide micro-foundations for the poverty traps at national levels (Banerjee & Newman, 1993). The empirical evidence shows that the majority of the countries that were absolutely and relatively poor in the mid of the 20th century are still poor. According to Kraay and McKenzie, (2014), poverty traps can possibly explain the persistence of poverty along with the low levels of economic growth.
However, the traditional theories of development explain the phenomena of poverty and economic growth separately (Kuznets, 1955; Rostow, 1959). According to these theories, the persistence of poverty in poor countries is due to the absence of economic growth. Moreover, it has been argued that growth will automatically take care of poverty (trickle-down approach) and eventually poor economies will converge unconditionally (Solow, 1956; Majeed and Zhang, 2014). However, by the end of 1970s, the world experienced a significant increase in poverty and it became obvious that it is not possible to observe growth without considering poverty (Skare & Druzeta, 2016).
An alternative approach, that gains attention in the recent time, argues that poverty is itself an explanation for persistent poverty and absence of economic growth (Sachs, 2005; Barrett et al., 2019). This approach has been formalized with the concept of “poverty trap”, and it links economic growth with poverty. Moreover, this approach submits that economic growth does not automatically “trickle down” to the poorest and therefore, unconditional converge is less likely (Skare & Druzeta, 2016).
Lopez and Serven (2009) include poverty measures in a standard growth equa-tion and conduct an empirical analysis to determine the detrimental growth effect of poverty for a larger set of countries. Their findings suggest that the growth impact of poverty is robustly negative in all regressions. The study asserts that poverty causes
3 According to Lavopa and Szirmai (2018), a country is considered trapped if it has been in its cur-rent income classification for a considerably longer period of time than the average time required for the transition.4 Easterly (2006) explains three mechanisms through which poverty persists. These mechanisms are low saving channel, demographic trap and non-convexity in production function.

Poverty Traps and Economic Growth: Evidence from Pakistan 123
foregone investment opportunities, thereby causing lower economic growth. Findings of their study remain consistent to a number of robustness checks.
In a recent study, Lissowska (2014) argues that poverty and inequality are not necessarily beneficial for economic growth. The study follows the line of arguments that existing inequality and poverty, while create pressure for more savings and ef-ficiency, however, may actually obstruct economic growth. She argues that poverty causes deterioration in general trust which, in turn, dismantles lowers cost of smooth cooperation, thereby hindering growth process.
Pakistan is a Lower Middle income developing country where more than 60 million people are living below poverty line. Besides, Pakistan has 147th position out of 188 countries on the basis of Human Development Index ranking (UNDP, 2016).5
Perry et al. (2006) mention that a country can face poverty trap if a large share of its population remains poor. While Glawe and Wagner (2016) warned that Pakistan can be caught in a lower middle income poverty trap because of its large poor population and slow economic growth.6 Although, this discussion suggests that persistence of poverty raises the possibility of economic stagnation and poverty traps, however, ex-isting literature usually focuses on either poverty effects of growth or growth effects of inequality while empirical evidence in the context of growth effects of poverty is largely missing for Pakistan (Majeed, 2016). Therefore, this study empirically determines the growth effect of poverty for Pakistan.
The analysis is based on annual observations and it covers the time period from 1975 to 2016. For empirical analysis, the study employs autoregressive distributed lag (ARDL) model approach to cointegration and provides estimates of long-run as well as short-run elasticities for the poverty-growth models. The study also employs gener-alized method of moments (GMM) to deal with the expected problem of endogeneity in our models. In addition, the study employs fully modified ordinary least squares (FMOLS) to take care of small sample bias. Lastly, dynamic ordinary least squares (DOLS) has been used to test the robustness of the long-run relationships.
The study has a major contribution in the poverty literature of Pakistan as it follows a different line of argument and investigates the growth effect of poverty. The previous literature usually does not focus on this issue and therefore, this previous approach is considered an inadequate approach in formulating proposals for eco-nomic policies (Skare & Druzeta, 2016). However, our study empirically determines
5 Human Development Index (HDI) includes per capita income of the country, expected years of schooling for the population and life expectancy at birth.6 The term lower middle-income trap usually refers to the situation when a country reaches the status of lower middle-income and then failed to achieve further higher levels of growth and living standard.

Farzana Naheed Khan, M Tariq Majeed124
growth effect of poverty for Pakistan and findings of our study are robust to diverse estimation techniques. Therefore, our unified approach towards growth and poverty may prove useful for the formulation of macro-economic policies.
The remainder of the study is planned as follows. Section 2 explains the chan-nels through which poverty affects economic growth. The study discusses the data in Section 3. The models and econometric methodology for the analysis are presented in Section 4 while the results for poverty-growth models are discussed in Section 5. Finally, conclusion with some policy implications is given in Section 6.
2. Theoretical Channels: Economic Growth and Poverty
The relationship between poverty and growth is complex and it has been at the center of economic research even in ancient Greece, Rome and Egypt civilizations (Skare & Druzeta, 2016). However, the theoretical developments of the 1990s sug-gest that poverty begets itself poverty and persistence of poverty raises the possibility of poverty traps (Sachs, 2005; Barrett et al., 2019). Furthermore, it is believed that poverty restricts a large segment of the population being a part of the growth process and this phenomenon may cause multiple equilibria, making poverty self-reinforcing (Azariadis & Stachurski, 2005).
The literature has mentioned various channels through which poverty inhibits growth process of an economy. Easterly (2006) explains three channels of poverty trap which include low saving channel, demographic and threshold effect channels. The low saving channel implies that the poor are excessively poor and are unable to make investment either in human capital or in physical capital which is a prerequisite to set growth in motion. Therefore, poverty causes poverty. The second demographic channel refers to the situation when poor families choose to have lots of children and retard the growth process of the country. Finally, the threshold effect channel refers to the situation when capital stock becomes useful only when it meets a minimum standard otherwise, it does not accelerate economic growth.
Relatedly, another poverty-reinforcing mechanism is risk averse behavior. Stiglitz (1969) argues that risk aversion leads to underinvestment. Similarly, Banerjee (2000) mentions that poor families are characteristically subject to financial constraints and at times even their lives are at stake.Therefore, the poor happen to be more risk averse to avoid financial losses. Likewise, in the absence of developed financial and credit markets, the poor are likely to exclude profitable investment opportunities just to avoid the risk. Thus, poverty seems to lead to higher risk which causes lower economic growth.
Besides, Jalan and Ravallion (2002) mention geographic poverty traps for house-

Poverty Traps and Economic Growth: Evidence from Pakistan 125
hold consumption growth. The study utilizes household panel data for China and finds that geographic capital (area of residence) plays an important role in determin-ing household consumption growth. The study defines geographic poverty traps as a situation in which the household’s consumption cannot rise over time because of his geographical location. The study claims that this finding is in accordance with the presence of poverty traps.
Another important source of poverty traps is institutional set up of an economy. Institutional arrangements of an economy that exclude the poor from economic opportunities which are created in the development process are likely to cause lower growth rates. It is because of the fact that broad participation in entrepreneurship and innovations are important for the growth process of the modern economies. In a similar vein, Engerman and Sokoloff (2004) discuss that poverty in former European colonies has roots into the institutional arrangements which were primarily introduced by the colonial powers.
Another potential channel between poverty and economic growth is an econo-my’s ability to innovate (Perry et al., 2006). Innovations improve the productivity or efficiency of labor, capital, and other factors of production. However, poverty reduces the number of people with sufficient human and physical capital needed to produce innovations. Therefore, poverty is usually associated with low levels of innovations.
The literature also suggests the possibility that poverty and growth interact through an education channel: lower levels of education result in lower growth rates and higher levels of poverty. At the same time, higher poverty levels feed back into the system and result in lower levels of education. Conversely, higher education levels contribute to worker productivity and efficiency (Khan & Majeed, 2018). Moreover, education significantly supplements earning potential, improves life expectancy, expands labor mobility, reduces fertility and child mortality (Majeed & Khan, 2018; Barrett et al., 2019).
Poverty and growth also interact through health channel (Vauhkonen et al., 2017). Poverty is usually associated with poor health status of the people which can negatively affect productive efficiency of the labor force, learning capacity of the children, and life expectancy of the population (Perry et al., 2006). In short, in the presence of poor health status, the depreciation rate of human capital increases, retarding the growth process of the economy.
Kraay and McKenzie (2014) summarize the concept of poverty trap with the help of low savings and investments. The study assumes that aggregate output per capita (y) depends on the state of technology and the level of capital per capita (k). The study

Farzana Naheed Khan, M Tariq Majeed126
further assumes that k depends on the level of investments (I) while investments are financed by the savings (s). Moreover, the study explains that the savings s* are low at lower levels of income, however, the savings s** are high at higher level of income. Lastly, the study assumes that population growth rate (n) and capital depreciation rate (δ) are given for the closed economy.
In diagram 1, the two curved lines show the volume of investment accessible with the saving rates s* and s**. At a low level of income, there is low level of saving and therefore, stable equilibrium is at k* for the country with low saving and low investment. Although, it is considered a stable equilibrium because beyond that level country cannot grow, however, the country can be caught in poverty trap because of low savings and low investments.
On the other hand, if a country can manage high saving rate such that s** > s*, then the country can accumulate capital per capita that is greater than some threshold value z such that k** > k*. It means that the country can move towards high steady-state equilibrium (k**) only with higher savings and higher capital stock which is possible with a higher level of income. Unfortunately, this self-reinforcing mechanism of low savings and low investments can trap a country and present poverty can cause future poverty and stagnation for extended period of times.
Perry et al. (2006) also mention that poverty is likely to be linked with a decline in investment. This finding suggests a potential explanation for poverty’s negative effect on growth: a higher poverty rate leads to a lower saving rate which causes lower investment and ultimately leads to lower economic growth. Moreover, the impact of poverty on saving and investment is more adverse in countries with less developed
Diagram 1
Poverty Traps and Economic Growth: Evidence from Pakistan 127
financial sectors where financial sector is weak and credit constraints are strong. Consequently, poverty causes poverty.
This review of literature suggests that poverty traps can arise through any of the mechanisms reviewed in this section. Unfortunately, the presence of poverty traps constraints the choices made by the individual decision making economic units (households and firms) to exclusively exploit their potential. The likely outcome is a vicious circle of poverty, with no income growth feeding into more poverty, which in turn reduces growth.
Although, there is a large literature discussing the existence of poverty traps (Barrett et al., 2019), yet it provides inconclusive results regarding validity of poverty traps. Azariadis and Stachurski (2004) also mention the difficulty of drawing definite conclusions about the presence of poverty traps. The conclusions may vary among studies when a large sample of countries is focused however, our study is focusing just one developing country Pakistan, therefore, provision of unambiguous conclusion for the country is more likely.
This study has major contribution as it takes an unusual route to determine the negative consequences of poverty on growth. Therefore, this study investigates the relationship between higher levels of poverty and growth process of the Pakistan econ-omy and specifically addresses the question; do higher levels of poverty hampers the growth process of the Pakistan economy. Therefore, the hypothesis to be tested is that:
H0: The existing level of poverty does not inhibit economic growth process of
the economy of Pakistan.
H1: The existing level of poverty inhibits economic growth process of the economy
of Pakistan.
3. Data
The analysis has been conducted over the time period 1975-2016.7 The study includes Head Count Ratio (measure of poverty) to estimate the growth impact of pov-erty. To avoid specification bias, control variables are also added in the growth-poverty relationship. The control variables include: labor, capital, inflation and inequality. While the data on poverty, labor force and inequality has been obtained from Gov-
7 The year 1975 is chosen because the data for some variables before 1975 is not available. In addition, Pakistan was following five years plan in 1970s. The fourth five year plan (1970-1974) comprises Pakistan and Bangladesh as a single country while this study exclusively focuses on Pakistan. Moreover, the series of early 1970s exhibit fluc-tuation as Pakistan and Bangladesh separated in 1971. Likewise, we are unable to get information for some of the variables after 2016. Moreover, there are problems in the compilation of poverty data, as it is not continuous data series. Therefore, it was the maximum available sample at the time of analysis.

Farzana Naheed Khan, M Tariq Majeed128
ernment of Pakistan (various issues).8 The data on capital (gross capital formation), inflation and GDP has been taken from the World Development Indicators.
4. Methodology
The neoclassical growth model is as follows:
Yt=f(L
tK
t) (1)
where, Yt is real income per capita, L
t is labor force and K
t is capital. However,
the poverty-growth model is specified as follows:
Yt=f(L
tK
tP
tF
t) (2)
where, Pt is head count ratio (measure of poverty), and F
t is the inflation rate. The
study considers the log-linear specification of the model because it provides efficient results. The functional form of the poverty-growth model 1 has been developed as follows:
lnYt= β
0+β
1lnL
t+β
2lnK
t+β
3lnP
t+β
4lnF
t+ε
t (3)
The poverty literature also shows that poverty captures the effect of inequality. Hence, the study controls for inequality in a separate regression to assess the exclusive impact of poverty. Therefore, in model 2 an additional variable GINI
t (Gini-coeffi-
cient) has been added for inequality, to capture the true growth effect of poverty. The model 2 has been specified in equation 4 as follows:
lnYt= β
0+β
1lnL
t+β
2lnK
t+β
3lnP
t+β
4lnF
t+β
5lnGINI
t+ε
t (4)
The study estimates equation 3 and 4 to investigate the impact of poverty on growth. For empirical analysis, alternative testing procedures have been applied. It includes ARDL approach to cointegration, generalized method of moments (GMM), fully modified OLS (FMOLS), and dynamic ordinary least squares (DOLS) estimation techniques.
The study uses ARDL approach to cointegration (Pesaran et al., 2001) because it is useful in data generating process through taking sufficient number of lags gener-al-to-specific modeling framework and it can accommodate greater number of variable as compared to other co-integration techniques.
The error correction models (ECMs) consistent with the poverty-growth relation-ship (3) and (4) are given below as equations (5) and (6).
8 The missing values for poverty are generated using linear data interpolation method.

Poverty Traps and Economic Growth: Evidence from Pakistan 129
(5)
where Δ is the change between two consecutive periods or the first difference operator.
(6)
The study uses F-statistics to tests the presence of long-run relationship between these variables. The null hypothesis is that no long-run relationship exists between these variables while the alternative hypothesis is that there is a long-run relationship between these variables.
H0=β
z=0 for all z (where z indicates the coefficients of lagged variables)
H1=β
z≠0 for at least one z
The null hypothesis may be accepted, rejected or the null hypothesis may remain inconclusive depending upon the value of the computed F-statistics. If the computed F-statistics is below the lower-bound critical value of F-statistics then null hypothesis is rejected while if it is greater than the upper-bound critical value of the F-statistics then null hypothesis is accepted. Lastly, if the computed F-statistics lies between the upper and lower bounds of the critical values, then null hypothesis remains inconclusive.
In the next step of analysis, the study applies generalized method of moments estimation technique (Hansen, 1982) to deal with the expected problem of endogene-ity in our models that may arise due to the endogenous nature of poverty. Likewise, fully modified least squares technique (Phillips & Hansen, 1990) has been applied to deal with small sample bias, non-normality, simultaneity, and serial correlation problems that are often found in economic data (Arize et al., 2015). Finally, dynamic dynamic ordinary least squares (Stock & Watson, 1993) is complimented with the FMOLS to test the robustness of our results. The advantage of using FMOLS and DOLS is that they take care of small sample bias and endogeneity bias by taking the leads and lags of the first-differenced regressors.
5. Empirical Results
The first step is to test the order of integration of the variables included in pover-ty- growth models. The study uses Augmented Dickey Fuller (ADF) as well as Phillips Perron (PP) tests to identify the order of integration of the variables (Dickey & Fuller, 1979; Phillips & Perron, 1988). The Table 1 reports the results of unit root tests.
The results of the ADF and PP tests show that all variables are integrated of order one except the variable inflation that is integrated of order zero. The results reported

Farzana Naheed Khan, M Tariq Majeed130
Table 2: Results of Diagnostic Tests
Diagnostic Tests Poverty-Growth Model 1 Poverty-Growth Model 2
F-statistics Probability F-statistics Probability
White test for heteroscedas-ticity
0.87 0.58 2.01 0.07
Ramsey's RESET for func-tional form
1.73 0.22 1.18 0.29
Lagrange multiplier test for serial correlation
1.62 0.21 0.53 0.63
Jarque–Bera test for normal-ity
1.45 0.48 1.19 0.55
Table 1: Results of Unit Root Tests
Variable ADF test statistics PP test statistics I (d) at 5% level of sig-nificance
I (d) at 1% level of sig-nificance
Level Ist differ-ence
Level Ist differ-ence
GDP per capita
-1.84 -5.87* -2.18 -5.88* I(1) I(1)
(0.67) (0.000) (0.49) (0.000)
Capital -2.60 -6.51* -2.62 -6.57* I(1) I(1)
(0.28) (0.000) (0.27) (0.000)
Labor -0.75 -6.21* -0.75 -6.22* I(1) I(1)
(0.96) (0.000) (0.96) (0.000)
Poverty -2.38 -4.57* -2.20 -4.55* I(1) I(1)
(0.39) (0.004) (0.47) (0.004)
Inflation -4.53 -8.89* -4.58** -8.94* I(0) I(0)
(0.004) (0.000) (0.004) (0.000)
Inequality -2.12 -5.59* -2.21 -5.61* I(1) I(1)
(0.51) (0.000) (0.47) (0.000)
in Table 1 provide ground for the application of ARDL analysis.
The study estimates poverty growth models given by equations (3) and (4) to de-termine the long-run relationship between variables. The study uses Schwarz Bayesian Criterion to establish the optimal number of lags in the ARDL model. Moreover, the study applies different diagnostic tests to establish whether the estimated models satisfy different diagnostic checks. The results of these tests are reported in Table 2.
An important assumption of classical linear regression is constant variance of

Poverty Traps and Economic Growth: Evidence from Pakistan 131
error term (homoscedasticity) and if conditional variance varies with independent variable then the problem of heterosecedasticity arises. Our null hypothesis is that there is no heterosecedasticity in our models and the White test for heteroscedasticity confirms that there is no heterosecedasticity problem in our models. Similarly, Ramsey RESET test reports that our model is correctly specified. The LM test for serial cor-relation also confirms that there is no problem of serial correlation in poverty-growth models. Finally, the Jarque-Bera test is applied to test the normality of residuals. It also indicates that the residuals are normally distributed. The study also applies VIF Test for multicollinearity and results are provided in appendix Table A. The results show that there is no problem of multicollinearity in our models as average VIF is less than 10. It implies that poverty-growth models qualify different diagnostic tests.
The study reports the results of bounds test for both models in Table 3. The result for poverty-growth model 1 shows that the calculated F-statistics is greater than the upper bound critical value implying that long-run relationship holds for this model.
Table 3: F-Statistics for Cointegration Relationship
The model Computed F-sta-tistics
Critical F-Statistics* Outcome
Lower bound Upper Bound
Poverty-Growth Model 1 Y
t=f(L
t
Kt P
t F
t)
5.32 2.84 4.29 Cointegration
Poverty-Growth Model 2 Y
t=f(L
t
Kt P
t F
t,GINI
t)
20.51 3.28 4.59 Cointegration
*The critical values are taken from Pesaran et al. (2001).
Hence, the null hypothesis of no co-integration among variables is rejected and it is concluded that there exists long-run relationship among variables in model 1. Likewise, in poverty-growth model 2 where Gini-coefficient has been added to capture the effect of inequality, similar evidence has been provided that shows the rejection of null hypothesis and presence of long-run relationship.
In the next step, the study examines the long-run relationships among variables and the empirical estimates are reported in Table 4. The coefficient of poverty is neg-atively significant. It indicates that poverty significantly hinders the growth process of the economy of Pakistan. Moreover, it implies that poverty itself is an explanation for the absence of high economic growth in Pakistan. It means that a country does not grow because it is too poor to grow (Lopez & Serven, 2009).

Farzana Naheed Khan, M Tariq Majeed132
There are different mechanisms through which poverty can obstruct economic growth. For example, poverty results in lower saving rates, dismal education and un-desirable health outcomes. These constraints on human and physical capital hinder the growth process of an economy. Similarly, there are several market imperfections such as imperfect information, absence of well-defined property rights, poor access to credit and incomplete insurance markets. Besides, these market imperfections are supplemented with the risks of crop failures, floods, droughts, and eventually with high conflict rates (Jalan & Ravallion, 2002; Sachs, 2005; Easterly, 2006; Lavopa & Szirmai, 2018).
Table 4 also shows that when we add inequality as an additional control variable then sign, significance and magnitude of the poverty impact remain essentially similar implying that the base line model captures true effect of poverty instead of inequality effect, whereas inequality positively affects economic growth in Pakistan. Banerjee and Duflo (2003) reveal that the relationship between growth and inequality can be explained with an inverted U-shaped curve. It suggests that inequality may affect growth in different directions depending on the country’s level of income. Table 4 also shows that labor and capital positively contributes to growth in both models (Solow, 1956; Azariadis & Stachurski, 2005; Kraay & McKenzie, 2014). It means Pakistan should focus on these variables for its economic growth
The results for short-run relationship are reported in Table 5. The results for both
Table 4: Estimates of Long-run Relationships
Variables Poverty-Growth Model 1 Poverty-Growth Model 2
Coefficient Std. Error Prob. Coefficient Std. Error Prob.
Labor 0.7379 0.0237 0.0000 0.8061 0.0256 0.0000
Capital 0.3104 0.0901 0.0016 0.2636 0.0749 0.0013
Poverty -0.1027 0.0385 0.0117 -0.0634 0.0331 0.0643
Inflation -0.0004 0.0014 0.7800 -0.0010 0.0012 0.4066
Inequality 0.2181 0.0532 0.0003
Constant -7.0651 0.6698 0.0000 -8.0018 0.5964 0.0000
R-squared 0.9789 0.9862
Adjusted
R-squared 0.9763 0.9841
F-statistic 383.006 456.385
Prob.(F-sta-tistic)
0.0000 0.0000

Poverty Traps and Economic Growth: Evidence from Pakistan 133
Table 5: Estimates of Short-run Relationships
Variable Poverty-Growth Model 1 Poverty-Growth Model 2
Coefficient Std. Error Prob. Coefficient Std. Error Prob.
ΔGDPt-1 -0.2989 0.1845 0.1178 -0.2941 0.1898 0.1343
ΔLabor -0.0293 0.1295 0.8229 -0.0236 0.1351 0.8626
ΔLabor t-1 0.0524 0.1548 0.7380 0.0499 0.1584 0.7553
ΔCapital 0.2054 0.0588 0.0018 0.2018 0.0628 0.0037
ΔCapital t-1 0.0345 0.0486 0.4844 0.0370 0.0512 0.4766
ΔCapital t-2 -0.0072 0.0499 0.8864 -0.0077 0.0510 0.8814
ΔPoverty -0.0022 0.0012 0.0910 -0.0022 0.0013 0.0972
ΔInflation -0.0003 0.0008 0.6680 -0.0003 0.0008 0.6768
ΔInequality -0.0238 0.1206 0.8454
Constant 0.0298 0.0081 0.0012 0.0295 0.0084 0.0018
ECMt-1 -0.3229 0.0967 0.0026 -0.3248 0.0991 0.0032
R-squared 0.5586 0.5593
Adjusted R-squared
0.3997 0.3757
F-statistic 3.5149 3.0457
Prob (F-sta-tistic)
0.0062 0.0123
Durbin-Wat-son Stat
1.9822 1.9640
Akaike info Criterion
-5.3400 -5.2845
Schwarz criterion
-4.8956 -4.7957
models show that the coefficient of poverty is negatively significant in the short-run as well. The negative effect is consistent with the theoretical studies on poverty and growth (Easterly, 2006).
The study also estimates error correction models (ECM) to identify the short-run relationships and check the stability of the long-run parameters. Table 5 shows that the coefficient of ECM term is -0.32 and it is also statistically significant in model 1. It suggests that that 32% adjustment takes place towards equilibrium within one year. We find similar evidence for model 2, indicating that adjustment towards equilibrium

Farzana Naheed Khan, M Tariq Majeed134
Figure 1: CUSUM Test (Model 1)
Figure 2: CUSUM Square Test (Model 1)
takes place with moderate speed of adjustment.
The study applies the cumulative sum of recursive residual (CUSUM) and the cumulative sum of square of recursive residual (CUSUMSQ) tests to check the stability of the model. Besides, it checks for the possibility of structural breaks in the models. The figures 1 and 2 display the plots for CUSUM and CUSUMSQ for model 1 while the figures 3 and 4 show the plots for CUSUM and CUSUMSQ for model 2.

Poverty Traps and Economic Growth: Evidence from Pakistan 135
Figure 3: CUSUM Test (Model 2)
Figure 4: CUSUM Square Test (Model 2)
It is evident from Figures 1 to Figure 4 that the estimated graphs are inside the critical limits for both models. Hence, it can be concluded that there is no structural break in our models. Moreover, these figures show that our models are reliable and statistically stable for the estimated period and there is no evidence of miss-specifica-tion. Therefore, these models can be used for forecasting as well as for other policy purposes.
The relationship between growth and poverty is complex and the poverty-growth nexus opens the door for the presence of poverty trap where higher poverty leads to lower growth and lower growth produces higher poverty. The study employs GMM technique to deal with the expected problem of endogenity in our models. Table 6
Farzana Naheed Khan, M Tariq Majeed136
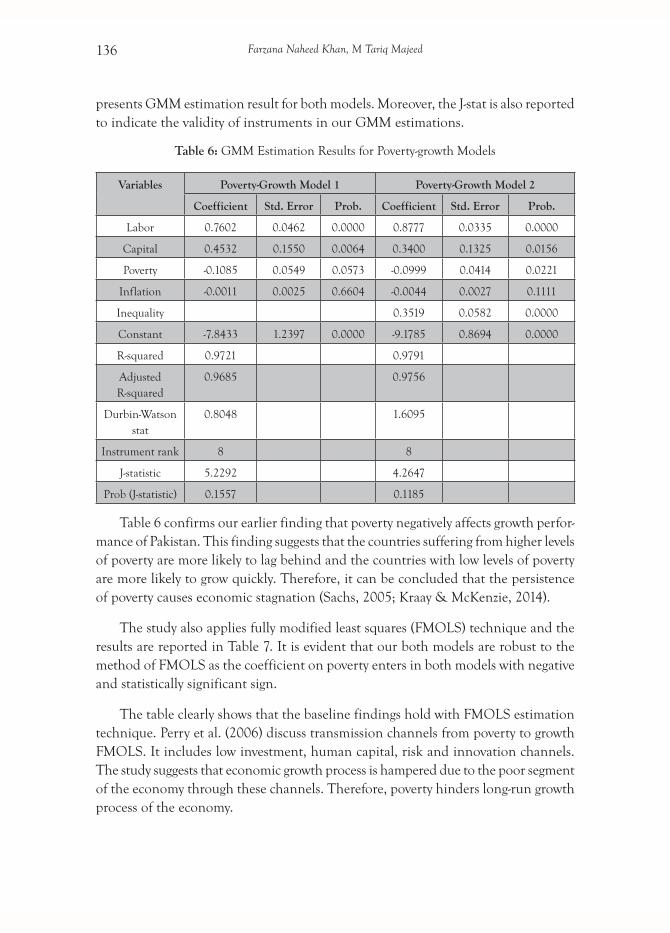
Table 6: GMM Estimation Results for Poverty-growth Models
Variables Poverty-Growth Model 1 Poverty-Growth Model 2
Coefficient Std. Error Prob. Coefficient Std. Error Prob.
Labor 0.7602 0.0462 0.0000 0.8777 0.0335 0.0000
Capital 0.4532 0.1550 0.0064 0.3400 0.1325 0.0156
Poverty -0.1085 0.0549 0.0573 -0.0999 0.0414 0.0221
Inflation -0.0011 0.0025 0.6604 -0.0044 0.0027 0.1111
Inequality 0.3519 0.0582 0.0000
Constant -7.8433 1.2397 0.0000 -9.1785 0.8694 0.0000
R-squared 0.9721 0.9791
Adjusted R-squared
0.9685 0.9756
Durbin-Watson stat
0.8048 1.6095
Instrument rank 8 8
J-statistic 5.2292 4.2647
Prob (J-statistic) 0.1557 0.1185
presents GMM estimation result for both models. Moreover, the J-stat is also reported to indicate the validity of instruments in our GMM estimations.
Table 6 confirms our earlier finding that poverty negatively affects growth perfor-mance of Pakistan. This finding suggests that the countries suffering from higher levels of poverty are more likely to lag behind and the countries with low levels of poverty are more likely to grow quickly. Therefore, it can be concluded that the persistence of poverty causes economic stagnation (Sachs, 2005; Kraay & McKenzie, 2014).
The study also applies fully modified least squares (FMOLS) technique and the results are reported in Table 7. It is evident that our both models are robust to the method of FMOLS as the coefficient on poverty enters in both models with negative and statistically significant sign.
The table clearly shows that the baseline findings hold with FMOLS estimation technique. Perry et al. (2006) discuss transmission channels from poverty to growth FMOLS. It includes low investment, human capital, risk and innovation channels. The study suggests that economic growth process is hampered due to the poor segment of the economy through these channels. Therefore, poverty hinders long-run growth process of the economy.

Poverty Traps and Economic Growth: Evidence from Pakistan 137
Table 7: Fully Modified Least Squares Estimation Results for Poverty-growth Models
Variables Poverty-Growth Model 1 Poverty-Growth Model 2
Coefficient Std. Error Prob. Coefficient Std. Error Prob.
Labor 0.7425 0.0317 0.0000 0.8252 0.0298 0.0000
Capital 0.4087 0.1189 0.0017 0.3001 0.0845 0.0013
Poverty -0.1137 0.0489 0.0267 -0.0683 0.0358 0.0663
Inflation -0.0026 0.0022 0.2449 -0.0026 0.0016 0.1145
Inequality 0.2741 0.0579 0.0000
Constant -7.3714 0.8787 0.0000 -8.3464 0.6836 0.0000
R-squared 0.9750 0.9846
Adjusted R-squared
0.9719 0.9821
S.E. of regression
0.0387 0.0309
Long-run variance
0.0021 0.0011
The results for DOLS are reported in Table 8. The parameter estimates on poverty remain consistent and stable in this method as well.
Table 8: Dynamic Ordinary Least Squares Estimation Results for Poverty-growth Models
Variables Poverty-Growth Model 1 Poverty-Growth Model 2
Coefficient Std. Error Prob. Coefficient Std. Error Prob.
Labor 0.7535 0.0311 0.0000 0.8778 0.0123 0.0000
Capital 0.4141 0.1787 0.0297 0.0152 0.0860 0.8617
Poverty -0.1029 0.0496 0.0497 -0.0469 0.0151 0.0079
Inflation -0.0035 0.0023 0.1466 -0.0032 0.0007 0.0007
Inequality 0.3874 0.0380 0.0000
Constant -7.5741 1.0119 0.0000 -8.3266 0.3211 0.0000
R-squared 0.9908 0.998652
Adjusted R-squared
0.9861 0.996726
S.E. of regression
0.0262 0.012466
Long-run variance
0.0014 6.93E-05

Farzana Naheed Khan, M Tariq Majeed138
These findings suggest that poverty obstruct economic growth in Pakistan. In addition, Lavopa and Szirmai (2018) also verify the existence of several development traps for Pakistan.
Although, conclusions regarding poverty-growth relationship may vary among alternative models and estimation techniques. However, our poverty-growth relation-ship remains consistent in both models and for all estimation techniques. It means poverty results in forgone growth opportunities because of higher transaction cost.
The identification of the relationship between economic growth and poverty is also an issue given that independent variables in the model are closely related to each other. Disentangling the effect of one from the other is quite challenging especially when all variables are included in the regression together. Although, VIF tests have confirmed that the growth effect of poverty is not driven by other variables, however, we started with only poverty as the right-hand side variable and then introduced the rest of the variables one by one to make sure that the effect of poverty is not driven by other variables. The results reported in Table B in appendix indicate that growth effect of poverty is not driven by other growth factors. The effect of poverty remains negative and significant in all models. It implies that the coefficient on poverty has its own effect on economic growth.
This direction of causality from poverty to economic growth in turn reminds us the possibility of the existence of poverty traps where poverty obstructs economic growth. Our study provides an important finding that economic growth and poverty are not separated phenomena and poverty negatively affects economic growth in Pa-kistan. Therefore, our policy makers should frame policies according to this finding and make sure that Pakistan does not fall into poverty trap as warned by Lavopa and Szirmai (2018).
6. Conclusion
A growing body of the literature has developed a variety of channels through which poverty may inhibit growth and create self-perpetuating poverty traps. How-ever, empirical literature has largely ignored the growth effects of poverty. This is in contrast with the ample attention that has been devoted to closely related issues such as poverty effects of growth or the impact of inequality on growth.
Poverty leads to deterioration in trust levels in the society. The lower levels of trust negatively affect smooth cooperation with lower transactions costs that, in turn, negatively affect economic growth. Poverty results in forgone growth opportunities because of the difficulty and higher cost of contracting. Poor people who are finan-cially distress and are also distrustful are likely to be excluded from active and efficient

Poverty Traps and Economic Growth: Evidence from Pakistan 139
participation in economic activity.
The empirical findings of this study suggest a consistently negative and strongly significant impact of poverty on growth. Particularly, our empirical estimates suggest that a 10 percentage-point increase in poverty reduces annual economic growth by 1 percentage point. When inequality is added as a control variable even then sign, significance and magnitude of the poverty impact remain essentially similar implying that the base line model captures the true effect of poverty instead of representing indirect effect of inequality. Thus, the negative growth impact of poverty is a pure poverty effect. Our study concludes that poverty exerts a significant negative influence on growth.
As far as possible scope of future extension of the study is concerned, it is im-portant that poverty should be focused in the same manner as inequality is modeled in growth analysis. This research focuses on poverty as a drag on growth while future research can focus on ‘social exclusion’ as a barrier to growth. This research can be extended for the growth analysis of SAARC countries. This research is limited to ‘absolute poverty’ analysis whereas future research can extend it for the analysis of ‘multidimensional poverty’.
The empirical finding that poverty acts to inhibit growth also has implications for the choice of growth-oriented policies. In particular, the study suggests that the largest impact on growth is likely to result from polices which not only enhance growth but also exert an independent influence on poverty reduction, thereby reducing the drag of poverty on growth.
References
Arize, A. C., Malindretos, J., & Ghosh, D. (2015). Purchasing power parity-symmetry and proportionality:
Evidence from 116 countries. International Review of Economics & Finance, 37(C), 69-85.
Azariadis, C., & Stachurski, J. (2004). A forward projection of the cross country income distribution. Mimeo,
Universite Catholique of Louvain.
Azariadis, C., & Stachurski, J. (2005). Handbook of economic growth. Edited by Aghion, P., & Durlauf,
S., Elsevier, Amsterdam.
Banerjee, A. (2000). The two poverties. Working Paper No. 01-16. Massachusetts Institute of Technology.
Banerjee, A., & Duflo, E. (2003). Inequality and growth: What can the data say?. Journal of Economic
Growth, 8 (3), 267-299.
Banerjee, A., & Newman, A. (1993). Occupational choice and the process of development. Journal of
Political Economy, 101, 274-298.

Farzana Naheed Khan, M Tariq Majeed140
Barrett, C., & Carter, M. (2013). The economics of poverty traps and persistent poverty: Empirical and
policy implications. The Journal of Development Studies, 49(7), 976-990.
Barrett, C., Carter, M., & Jean-Paul, C. (2019). The Economics of Poverty Traps. University of Chicago
press, Chicago.
Dickey, D., & Fuller, W. A. (1979). Distribution of the estimators for autoregressive time series with a
unit root. Journal of the American Statistical Association, 74, 427-431.
Easterly, W. (2006). The big push Deje Vu: A review of Jeffrey Sachs’s the end of poverty: Economic
possibilities for our time. Journal of Economic Literature, 44, 96-105.
Engerman, S., & Sokoloff, K. (2004). The persistence of poverty in the Americas: The role of institutions,
in poverty traps. In S. Bowless, S. Durlauf, and K. Hoff (Eds.) Poverty traps. Princeton University
Press, New Jersey: USA.
Glawe, L., & Wagner, H. (2016). The middle-income trap-definitions, theories and countries concerned: A literature
survey. MPRA Working Paper No. 71196.
Government of Pakistan (2016). Economic survey of Pakistan. Ministry of Finance, Islamabad, Pakistan.
Hansen, L. P. (1982). Large sample properties of generalized method of moments estimators. Economet-
rica, 50 (4), 1029-1054.
Jalan, J., & Ravallion, M. (2002). Geographic poverty traps? A micro model of consumption growth in
rural China. Journal of Applied Econometrics, 17(4), 299-314.
Kraay, A., & McKenzie, D. (2014). Do poverty traps exist? Assessing the evidence. Journal of Economic
Perspectives, 28(3), 127-148.
Kraay, A., & Raddatz, C. (2007). Poverty traps, aid, and growth. Journal of Development Economics, 82,
315–347.
Kuznets, S. (1955). Economic growth and income inequality. The American Economic Review, 45(1), 1-28.
Khan, F. N., & Majeed, M. T. (2018). Education levels and life expectancy of males and females: Empirical
evidence from Pakistan. Journal of Arts and Social Sciences, 5(1), 96-114.
Lavopa, A., & Szirmai, A. (2018). Structural modernisation and development traps. An empirical ap-
proach. World Development, 112, 59-73.
Lissowska, M. (2014). Is poverty and inequality actually good for growth? Forum for Social Economics,
44(2), 133-158.
Lopez, H., & Serven, L. (2009). Too poor to grow. World Bank Working Paper No. 5012, Washington, DC.
Majeed, M. T. (2016). Economic growth and income inequality nexus: An empirical analysis for Pakistan.
Kashmir Economic Review, 25(1), 1-12.

Poverty Traps and Economic Growth: Evidence from Pakistan 141
Majeed, M. T., & Khan, F. N. (2018). Do information and communication technologies (ICTs) contribute
to health outcomes? An empirical analysis. Quality and Quantity, 1-24.
Majeed, M. T., & Zhang, G. (2014). Inequality, trade and economic development: Evidence from devel-
oping countries. Pakistan Journal of Applied Economics, 24(1), 39-73.
Perry, E., Arias, O., Lopez, J., Humberto, M., William, F., & Serven, L. (2006). Pverty reduction and
growth: Virtuous and vicious circles. World Bank Latin American and Caribbean Studies. World Bank,
Washington, DC.
Pesaran, M. H., Shin, Y., & Smith, R.J. (2001). Bounds testing approaches to the analysis of level rela-
tionships. Journal of Applied Econometrics, 16, 289-326.
Phillips, P., & Hansen, B. (1990). Statistical inference in instrumental variables regression with I(1)
processes. Review of Economic Studies, 57, 99-125.
Phillips, P., & Perron, P. (1988). Testing for a unit root in time series regression. Biometrika, 75, 335-346.
Rostow, W. (1959). The stages of economic growth. The Economic History Review, 12(1), 1-16.
Sachs, J. (2005). The end of poverty: Economic possibilities for our time. Penguin books, New York.
Skare, M., & Druzeta, R. (2016). Poverty and economic growth: A review. Technological and Economic
Development of Economy, 22(1), 156-175.
Solow, R. (1956). A contribution to the theory of economic growth. Quarterly Journal of Economics,
70 (1), 65–94.
Stiglitz, J. (1969). The effects of income, wealth and capital gains taxation on risk taking. The Quarterly
Journal of Economics, 83, 263-283.
Stock, J. H. & Watson, M. (1993). A simple estimator of cointegrating vectors in higher order integrated
systems. Econometrica, 61(4),783-820.
United Nations Organization (2016). Human development report. United Nations Development Programme,
United Nations.
Vauhkonen, T., Kallio, J., Kauppinen, T. M., & Erola, J. (2017). Intergenerational accumulation of
social disadvantages across generations in young adulthood. Research in Social Stratification and
Mobility, 48, 42-52.
World Bank (2016). World development indicators 2016. World Bank, Washington D. C.

Farzana Naheed Khan, M Tariq Majeed142
Appendix
Table A: VIF Test for Poverty-growth Models
Variable Poverty-growth model 1 Poverty-growth model 2
VIF 1/VIF VIF 1/VIF
Labor 1.76 0.5688 3.02 0.3314
Capital 1.60 0.6232 1.63 0.6119
Poverty 1.46 0.6856 1.60 0.6236
Inflation 1.01 0.9854 1.03 0.9705
Inequality 2.34 0.4272
Mean VIF 1.46 1.39
Table B: OLS Results for Poverty-growth Models
Variable Coef Prob. Coef Prob. Coef Prob. Coef Prob. Coef Prob.
Constant 8.22 0.00 -4.94 0.00 -7.06 0.00 -7.07 0.00 -8.00 0.00
Poverty -0.60 0.00 -0.17 0.00 -0.09 0.01 -0.10 0.01 -0.06 0.06
Labor - - 0.68 0.00 0.73 0.00 0.74 0.00 0.81 0.00
Capital - - - - 0.34 0.00 0.31 0.00 0.26 0.00
Inflation - - - - - - 0.00 0.78 0.00 0.41
Inequality - - - - - - - - 0.22 0.00
R-squared 0.21 0.96 0.97 0.97 0.99
Adjusted R2
0.19 0.96 0.97 0.97 0.98
F-stat 10.0 569 547 383 456
Prob. (F-stat)
0.00 0.00 0.00 0.00 0.00