power coking coal india coal market -...
TRANSCRIPT

INDIA
COAL MARKETWATCHVol X | Issue XII | October 31, 2018
Non coking coal
Spot thermal coal offers move in narrow range…2India’s Aug coal & lignite production up 2.2% y-o-y…7CIL’s coal inventory dips to multi-year low…8NLC’s lignite production slips 22% in Sept…10India’s Sept captive coal production at 3.39 mt…10India’s Oct coal & coke imports up 4% m-o-m…12Global steam coal demand to rise 77 mt in 2018…13Indonesian 4700 NAR coal in short supply…13
Power
No power capacity addition in August…19Coal stock at thermal plants down 11% in Oct…20Dues from gencos to CIL at Rs 7,573 cr…21CIL signs MoU with NLC for generation…21
Coking coal
Chines, Indian demand boost Oct offers…22CIL’s coking coal production at 15.5 mt in H1…22India’s coking coal imports down 22% in Sept…26Port wise coking coal imports…27
Met coke
Domestic met coke prices unchanged in Oct…29India’s met coke imports down 66% in Sept…29
Pet coke
Reliance pet coke prices up Rs 200 for Oct loading…32India’s pet coke imports up 62% in Sept…33
Cement
India’s cement production in Aug up 14.4% y-o-y…35Port wise import of gypsum…36
Sponge iron
Sponge iron Sept production down y-o-y…38
Others
CIL achieves 21.9% of capex spend target till Sept…39India’s natural gas output dips in Apr-Aug…40Promotional drilling stays below target till Sept…40
Logistics
Traffic handled by major ports up 5% in Apr-Sept…42Deendayal Port’s coal handling spurts 68% in Sept…43Railway’s Sept coal handling up almost 3%...44
E-auction
CIL Sept allotment on coaljunction up 10%...45SCCL’s Sept coaljunction spot auction sees good demand…47Spot allotment via other platforms up 69% in Sept…48Summary table for various CIL e-auctions in Sept…51Details of spot e-auctions held in Sept…52Details of spot e-auctions held in Sept…59Details of special forward e-auctions held in Sept…60
Data
Coal stock position at thermal power plants as on Oct 25…62Company wise coal production and despatch…66Details of non-coking coal imports in Sept…67Details of anthracite coal imports in Sept…79Details of coking coal imports in Sept…81Details of PCI imports in Sept…85Details of met coke imports in Sept…86Details of pet coke imports in Sept…88Details of gypsum imports in Sept…89Details of limestone imports in Sept…95Coal & coke import data through major ports…109
Contact us: Have a question or comment about our coverage? A news tip or input on coal markets or prices? Don’t hesitate to contact ICMW and Coal Insights to share your thoughts. Email : [email protected]

October 31, 2018 | 2
Thermal coal offers from key shippers such as South Africa, Indonesia and Australia moved in a narrow range in October
2018 owing to low demand from China and an increase in gas availability in that country, industry sources said.
Prices of South African coal (6,000 kcal/kg NAR) were marginally up to $99 per ton FOB as of October 30, 2018 as against $96 per ton FOB on September 28, 2018. The Australian coal (6,300 kcal/kg GAR) was quoted at $107.50 per ton FOB on October 30, 2018 as against $112 per ton on September 28, 2018, according to information available with ICMW.
Indonesian coal (5,900 kcal/kg GAR) prices stood at $70.75 per ton FOB on October 30, 2018, against $72.25 per ton on September 28, 2018. Prices of Indonesian coal (5,000 kcal/kg GAR) stood at $52.25 per ton FOB on October 30, 2018, unchanged from the rate quoted for September 28, 2018.
Asia-Pacific benchmark Newcastle prices have fallen to five-month lows on relatively weak Chinese import demand and abundant supply. Price offers were even coming down to $107 per ton.
Thermal coal future contracts in China’s domestic market for delivery next month settled lower. The sources said that the country was not buying anything, impacting the sentiment. Going forward, they said, China demand is likely to remain weak for the rest of the year. Gas availability in China will likely rise 15-20 percent this winter, compared with the previous winter, resulting in lower coal demand. Overall, the analysts see more supply than demand at the moment.
Meanwhile, BHP’s thermal coal production in the July-September quarter slipped 1 percent year-on-year and 26 percent from April-June to 6.64 million tons (mt), but the miner maintained its production guidance for fiscal 2018-19.
From its Australian operations, BHP produced 3.98 mt in the September quarter, down 6 percent from a year earlier and 36 percent lower from the June quarter. It produced 2.66 million tons in Colombia, a 6 percent rise year-on-year but a 4 percent drop from April-June.
The company’s guidance for thermal coal production remains unchanged at 28-29 mt, compared with the actual production of 29.16 mt in the previous fiscal year. BHP produces thermal coal from its Mt Arthur coal mine as part of its New South Wales Energy Coal business in Australia, and its Cerrejon mine in Colombia.
In the Indian market, a shortfall in domestic supply will likely keep import demand buoyant, mainly for lower-grade material, according to sources. Inventories at 123 Indian coal-fired plants monitored by the Central Electricity Authority (CEA) have fallen to a fresh 11-month low of 10.2 mt, which is sufficient for just six days’ generation. Despite rising domestic production, coal supplies to power plants in India cannot keep up with strong demand from the power sector, they said.
While state-run producer Coal India had managed to ramp up its output by 4 percent on the month in September, its sales were down by 3 percent due to “logistical bottlenecks”, sources said.
With no sign of easing in power demand, Indian coal imports are likely to rise in the coming weeks, they added.
According to industry estimates, in 2018-19, thermal coal imports would be around 160 mt, while in 2019-20 the figure may go up further.
The country’s thermal coal imports are up in the first six months of 2018-19, to 82.47 mt from 70.20 mt recorded for the same period last year.
India’s 12 major ports reported thermal coal handling by the major ports was up 24 percent during April-September, 2018. Movement of thermal coal through these ports increased to 51.45 mt during April-September, 2018, compared to 41.47 mt achieved in the corresponding period of the previous fiscal.
Among the major ports, Paradip had the distinction of handling the highest volume of thermal coal, at around 16 mt, during April-September, 2018. The port had handled 12.11 mt during April-September, 2017.
NON COKING COAL
Spot thermal coal offers move in narrow range

October 31, 2018 | 3
R² = 0.0453
45.00
52.50
60.00
67.50
75.00
82.50
90.00
97.50
105.00
112.50
120.00
1-M
ar-1
2
30-M
ay-1
2
28-A
ug-1
2
26-N
ov-1
2
24-F
eb-1
3
25-M
ay-1
3
23-A
ug-1
3
21-N
ov-1
3
19-F
eb-1
4
20-M
ay-1
4
18-A
ug-1
4
16-N
ov-1
4
14-F
eb-1
5
15-M
ay-1
5
13-A
ug-1
5
11-N
ov-1
5
9-Fe
b-16
9-M
ay-1
6
7-Au
g-16
5-No
v-16
3-Fe
b-17
4-M
ay-1
7
2-Au
g-17
31-O
ct-1
7
29-Ja
n-18
29-A
pr-1
8
28-Ju
l-18
26-O
ct-1
8
24-Ja
n-19
Aus (6300 GAR) Log. (Aus (6300 GAR))
Strike at Drummond'sColumbia mines
ICMW estimate
High price $123 (19/07/2018)
Strike in Glencore's Hunter Valley mine in Australia's NSW
Freight rates down
Low price $48.75 (02/02/2016)
China imposes 3% tax on low CV coal
China devalues yuan
RECENt PRICE tREND & fORECASt fOR NOVEMbER 2018
Australian Non Coking Coal (6300 Kcal/kg GAR)
The trend lines are chosen based on the value of R2 as depicted in the charts. The best fit lines are extended to show short term forecasts for prices/freight rates. The forecasts are based only on past data and do not take into account any other variable or
changes in market dynamics.
R² = 0.7364
45.00
50.00
55.00
60.00
65.00
70.00
75.00
80.00
85.00
90.00
95.00
100.00
105.00
1-M
ar-1
2
30-M
ay-1
2
28-A
ug-1
2
26-N
ov-1
2
24-F
eb-1
3
25-M
ay-1
3
23-A
ug-1
3
21-N
ov-1
3
19-F
eb-1
4
20-M
ay-1
4
18-A
ug-1
4
16-N
ov-1
4
14-F
eb-1
5
15-M
ay-1
5
13-A
ug-1
5
11-N
ov-1
5
9-Fe
b-16
9-M
ay-1
6
7-Au
g-16
5-No
v-16
3-Fe
b-17
4-M
ay-1
7
2-Au
g-17
31-O
ct-1
7
29-Ja
n-18
29-A
pr-1
8
28-Ju
l-18
26-O
ct-1
8
24-Ja
n-19
SA (6000 NAR) Poly. (SA (6000 NAR))
Short covering in paper market
Strike at Drummond's Columbia mines
ICMW estimate
Low price $48.80 (22/10/2015)
Cerrejon union withdraws strike call
China imposes 3% tax on low CV coal
China devalues yuan
High price $105.00 (27/7/2018)
South African Non Coking Coal (6000 Kcal/kg NAR)
NON COKING COAL

October 31, 2018 | 4
R² = 0.0013
40.00
45.00
50.00
55.00
60.00
65.00
70.00
75.00
80.00
85.00
90.00
95.00
100.00
1-M
ar-1
2
30-M
ay-1
2
28-A
ug-1
2
26-N
ov-1
2
24-F
eb-1
3
25-M
ay-1
3
23-A
ug-1
3
21-N
ov-1
3
19-F
eb-1
4
20-M
ay-1
4
18-A
ug-1
4
16-N
ov-1
4
14-F
eb-1
5
15-M
ay-1
5
13-A
ug-1
5
11-N
ov-1
5
9-Fe
b-16
9-M
ay-1
6
7-Au
g-16
5-No
v-16
3-Fe
b-17
4-M
ay-1
7
2-Au
g-17
31-O
ct-1
7
29-Ja
n-18
29-A
pr-1
8
28-Ju
l-18
26-O
ct-1
8
24-Ja
n-19
ID 5900 GAR Power (ID 5900 GAR)
High price $95.5 (2/3/2012)
Low China stock pile
Chinese buyers back off on Indonesian cargoes
Strike at Drummond's Columbia mines
ICMW estimate
Low price $44.20 (20/04/16)
Port congestion at Kalimantan
China imposes 3% tax on low CV coal
Chinese, Indian holidays
China devalues yuan
Indonesian Non Coking Coal (5900 Kcal/kg GAR)
RECENt PRICE tREND & fORECASt fOR NOVEMbER 2018
R² = 0.0012
35.00
39.00
43.00
47.00
51.00
55.00
59.00
63.00
67.00
71.00
75.00
1-M
ar-1
2
30-M
ay-1
2
28-A
ug-1
2
26-N
ov-1
2
24-F
eb-1
3
25-M
ay-1
3
23-A
ug-1
3
21-N
ov-1
3
19-F
eb-1
4
20-M
ay-1
4
18-A
ug-1
4
16-N
ov-1
4
14-F
eb-1
5
15-M
ay-1
5
13-A
ug-1
5
11-N
ov-1
5
9-Fe
b-16
9-M
ay-1
6
7-Au
g-16
5-N
ov-1
6
3-Fe
b-17
4-M
ay-1
7
2-Au
g-17
31-O
ct-1
7
29-Ja
n-18
29-A
pr-1
8
28-Ju
l-18
26-O
ct-1
8
24-Ja
n-19
ID 5000 GAR Power (ID 5000 GAR)
Strike at Drummond's Columbia mine
Chinese,Indian holidays
High price $73.75 (2/3/2012)
China backsoff on Indonesia cargo
Low Chinese stockpile
ICMW estimate
Low price $36.25 (11/02/2016)
China imposes 3% tax on low CV coal
Oort congestion at Kalimantan
China devalues yuan
Indonesian Non Coking Coal (5000 Kcal/kg GAR)
NON COKING COAL

October 31, 2018 | 5
INDIA’S JULY-SEPtEMbER NON COKING COAL IMPORt PRICE tRENDNON COKING COAL IMPORtS tHROUGH SELECtED PORtS DURING JULY’18 - SEPtEMbER’18
PORT
September-18 August-18 July-18
Quantity(in tons.)
Weighted Average Price (Rs./ton)
Quantity (in tons.)
Weighted Average Price (Rs./ton)
Quantity (in tons.)
Weighted Average Price (Rs./ton)
DAHEJ* 5,73,713 5,768 8,83,568 5,581 5,93,156 5,410
CHENNAI 208 19,974 806 17,836 1,102 17,062
COCHIN - - - -
ENNORE 5,15,748 3,748 4,83,002 4,239 4,38,452 5,125
GANGAVARAM 5,64,801 6,277 11,14,268 6,089 14,71,753 6,093
KAKINADA* - - 1,98,200 5,236 1,92,295 4,764
KANDLA 14,80,920 6,087 13,40,065 6,581 10,65,829 6,431
KARAIKAL* 2,46,333 4,900 1,14,410 5,593 4,68,745 4,716
KOLKATA 2,23,682 5,897 3,77,945 6,611 2,44,785 6,249
KRISHNAPATNAM* 22,10,145 5,516 15,09,608 5,550 12,88,445 6,009
MAGDALLA* 4,04,161 3,918 7,98,288 5,588 5,30,148 6,160
MARMAGOA 2,58,406 6,899 1,58,430 10,706 2,11,332 8,614
MUMBAI 2,12,362 6,559 1,48,903 6,378 2,06,644 6,258
MUNDRA 26,63,576 4,764 26,39,530 4,410 25,43,754 4,601
NEW MANGALORE 1,19,116 5,491 2,34,152 5,102 3,04,131 6,366
PARADIP 4,08,972 5,760 5,19,661 6,200 4,75,015 6,276
PIPAVAV* - - 88,000 8,743 28,998 8,218
TUTICORIN / VOC* 7,29,997 4,018 3,33,535 5,103 4,41,756 4,418
VIZAG 5,83,200 5,946 6,14,180 5,182 10,94,831 5,713
HAZIRA 3,70,256 4,554 7,30,790 4,934 6,27,473 4,642
Total Quantity Imported 1,15,65,596 1,22,87,342 1,22,28,643
*Only EDI figures
3200
3380
3560
3740
3920
4100
4280
4460
4640
4820
5000
Oct
1 -
Oct
15
Oct
16
- Oct
31
Nov
1 -
Nov
15
Nov
16
- Nov
30
Dec
1 -
Dec
15
Dec
16
- Dec
31
Jan
1 - J
an 1
5
Jan
16 -
Jan
31
Feb
1 - F
eb 1
5
Feb
16 -
Feb
28
Mar
1 -
Mar
15
Mar
16
- Mar
31
Apr
1 -
Apr
15
Apr
16
- Apr
30
May
1 -
May
15
May
16
- May
31
Jun
1 - J
un 1
5
Jun
16 -
Jun
30
Jul 1
- Ju
l 15
Jul 1
6 - J
ul 3
1
Aug
1 -
Aug
15
Aug
16
- Aug
31
Sep
1 -
Sep
15
Sep
16
- Sep
30
Pric
e (in
Rs.
/ton)
Period
W. Avg Price
Non Coking Coal Imports from Indonesia during October’17 - September’18
0
1000
2000
3000
4000
5000
6000
7000
8000
9000
10000
0
1000000
2000000
3000000
4000000
5000000
6000000
Oct
1 -
Oct
15
Oct
16
- Oct
31
Nov
1 -
Nov
15
Nov
16
- Nov
30
Dec
1 -
Dec
15
Dec
16
- Dec
31
Jan
1 - J
an 1
5
Jan
16 -
Jan
31
Feb
1 - F
eb 1
5
Feb
16 -
Feb
28
Mar
1 -
Mar
15
Mar
16
- Mar
31
Apr 1
- Ap
r 15
Apr 1
6 - A
pr 3
0
May
1 -
May
15
May
16
- May
31
Jun
1 - J
un 1
5
Jun
16 -
Jun
30
Jul 1
- Ju
l 15
Jul 1
6 - J
ul 3
1
Aug
1 - A
ug 1
5
Aug
16 -
Aug
31
Sep
1 - S
ep 1
5
Sep
16 -
Sep
30
Pric
e (in
Rs.
/ton)
Qua
ntity
(in
tons
)
Period
Quantity in Tons Open High Low Close
Non Coking Coal Imports from Indonesia during October’17 - September’18
Note: Understanding the Graph.On the X axis is the time period, the left Y-axis shows quantities imported and the right Y-aixs depicts FOB prices in rupess per ton. The bars in pink reflects the amount of quantites imported during the said periodThe black and white bars which are known as THE BODY represents the opening and closing price for the said period. If the bar is white, that reflects the closing price is higher than the opening price, and if the bar is black, it means the closing price is lower than the opening priceThe thin lines above and below THE BODY are known as TAILS and represent the highest and the lowest price for the said period
NON COKING COAL

October 31, 2018 | 6
NON COKING COAL PRICE MOVEMENtS
fOb PRICES ($/ton)
Date South African Coal (6,000 kcal/kg NAR)
Australian Coal (6,300 kcal/kg
GAR)
Indonesian Coal (5,900 kcal/kg
GAR)
01-Aug-18 103.00 118.00 80.50
02-Aug-18 103.00 118.00 80.00
03-Aug-18 102.00 119.00 79.50
06-Aug-18 101.50 119.00 79.00
07-Aug-18 101.00 118.50 78.75
08-Aug-18 100.00 118.00 78.75
09-Aug-18 100.00 118.00 78.50
10-Aug-18 100.00 118.00 78.50
13-Aug-18 100.00 118.00 78.50
14-Aug-18 99.50 118.00 78.50
15-Aug-18 99.00 117.50 78.25
16-Aug-18 99.00 117.50 78.25
17-Aug-18 99.00 117.50 78.25
20-Aug-18 98.00 116.50 77.75
21-Aug-18 98.00 116.00 77.50
22-Aug-18 98.00 115.00 77.25
23-Aug-18 97.00 115.00 77.00
24-Aug-18 96.50 114.50 76.25
27-Aug-18 96.00 114.50 76.25
28-Aug-18 96.00 116.50 76.00
29-Aug-18 97.00 118.50 75.50
30-Aug-18 97.00 118.50 75.25
31-Aug-18 96.50 118.50 75.25
03-Sep-18 96.50 118.50 75.25
04-Sep-18 96.00 119.00 75.25
05-Sep-18 96.00 117.00 75.25
06-Sep-18 96.00 117.00 75.25
07-Sep-18 96.00 117.00 75.25
10-Sep-18 97.25 116.00 75.00
11-Sep-18 97.50 116.00 75.00
12-Sep-18 98.00 116.00 75.00
13-Sep-18 98.50 116.50 74.75
14-Sep-18 99.00 116.50 74.50
17-Sep-18 99.00 117.00 74.25
18-Sep-18 98.00 116.00 74.25
19-Sep-18 97.00 114.00 73.75
20-Sep-18 97.00 112.50 73.00
21-Sep-18 97.00 112.50 72.75
24-Sep-18 97.00 112.50 72.75
25-Sep-18 96.00 112.00 72.50
26-Sep-18 96.00 112.00 72.50
27-Sep-18 96.00 112.00 72.50
28-Sep-18 96.00 112.00 72.25
01-Oct-18 97.00 112.50 72.25
02-Oct-18 97.50 112.50 72.25
03-Oct-18 97.50 113.00 72.25
04-Oct-18 98.00 113.50 72.25
05-Oct-18 98.00 114.50 72.00
08-Oct-18 99.00 114.50 72.00
09-Oct-18 99.00 114.50 72.00
10-Oct-18 99.50 113.50 72.00
11-Oct-18 99.75 113.00 72.00
12-Oct-18 99.00 110.00 72.00
19-Oct-18 99.00 108.00 72.00
22-Oct-18 98.00 107.00 71.75
23-Oct-18 98.00 107.00 71.75
24-Oct-18 98.00 107.50 71.75
25-Oct-18 98.00 107.50 71.75
26-Oct-18 98.00 107.50 71.50
Date South African Coal (6,000 kcal/kg NAR)
Australian Coal (6,300 kcal/kg
GAR)
Indonesian Coal (5,900 kcal/kg
GAR)
$40
$49
$58
$67
$76
$85
$94
$103
$112
$121
$130
2-O
ct-1
7
26-O
ct-1
7
19-N
ov-1
7
13-D
ec-1
7
6-Ja
n-18
30-J
an-1
8
23-F
eb-1
8
19-M
ar-1
8
12-A
pr-1
8
6-M
ay-1
8
30-M
ay-1
8
23-J
un-1
8
17-J
ul-1
8
10-A
ug-1
8
3-Se
p-18
27-S
ep-1
8
21-O
ct-1
8
PR
ICE
($
/to
n)
South African Coal (6,000 kcal/kg NAR) Australian Coal (6,300 kcal/kg GAR)
Indonesian Coal (5,900 kcal/kg GAR)
$15
$21
$27
$33
$39
$45
$51
$57
$63
$69
$75
2-O
ct-1
7
26-O
ct-1
7
19-N
ov-1
7
13-D
ec-1
7
6-Ja
n-18
30-Ja
n-18
23-F
eb-1
8
19-M
ar-1
8
12-A
pr-1
8
6-M
ay-1
8
30-M
ay-1
8
23-Ju
n-18
17-Ju
l-18
10-A
ug-1
8
3-Se
p-18
27-S
ep-1
8
21-O
ct-1
8
PR
ICE
($
/to
n)
Indonesian Coal (5,000 kcal/kg GAR) Indonesian Coal (4,200 kcal/kg GAR)
Indonesian Coal (3,800 kcal/kg GAR)
NON COKING COAL PRICE tRENDS_fObNON COKING COAL PRICE tRENDS_fOb
NON COKING COAL

October 31, 2018 | 7
India’s Aug coal & lignite production up 2.2% y-o-y
India’s coal and lignite production was up by 2.24 percent to 47.7 million tons (mt) in August 2018, compared to 46.6 mt
recorded for the same month last year, according to official data.
However, on a monthly basis, the country’s coal and lignite production was down from 49.7 mt achieved in July 2018, the data show.
This was the third consecutive month of a decline in the current fiscal. August 2018 production was also the lowest in last 11 months.
Of the total production in August 2018, Coal India Ltd had a share of 38.8 mt, Singareni Collieries 4.38 mt, captive production 2.75 mt and NLC India 1.72 mt.
During the first 5 months of 2018-19, India’s coal and lignite production stood at 264.9 mt, about 10.3 percent increase over 240.1 mt achieved during the same period last year.
The following table gives India’s month-wise coal and lignite production for 2017-18 and 2018-19:
Month 2018-19 2017-18
Apr 54.98 47.4
May 57.63 51.4
Jun 55.16 49.5
Jul 49.7 45.3
Aug 47.7 46.6
Sep 47.4
Oct 54.9
Nov 61.3
Dec 65.5
Jan 68.7
Feb 65.8
Mar 85.0
Total 264.9 688.8
Source: Union Ministry of Commerce & Industry
Coal India production up 3.8% y-o-y in September
Total coal production by Coal India Ltd (CIL) stood at 40.24 million tons (mt) in September 2018, up 3.8 percent as
compared to 38.76 mt achieved in September 2017, according to data released by the company.
There was an increase of 3.71 percent on a month-on-month basis, compared to 38.80 mt achieved in August 2018.
For the period April-September, FY18-19, total production was 256.47 mt, about 10.6 percent increase as compared to around 231.88 mt achieved during the same period last year.
Out of 8 mining subsidiaries of CIL, 6 have recorded an increase in production and 2 have recorded a decrease during September 2018 on a year-on-year basis.
The following chart provides details of CIL’s monthly coal production in FY19, FY18, FY17 and FY16 (in million tons):
Month 2018-19 2017-18 2016-17 2015-16
April 44.84 38.44 40.35 41.52
May 47.14 40.74 42.58 40.97
June 44.88 39.66 42.72 38.83
July 40.56 36.64 36.74 34.83
August 38.80 37.63 32.43 36.21
September 40.24 38.77 35.24 37.17
October 46.14 43.51 44.37
November 51.29 50 47.47
December 54.63 54.2 52.07
January 56.69 55.99 52.86
February 54.46 54.3 51.01
March 72.28 66.07 59.19
Total (April-March)# 216.22 567.37 554.13 536.5
# Updated figures may not tally due to revision
Detailed coal production in September 2018
Subsidiary co
Coal production fig in million tons (September 2018)
Coal Production growth y-o-y (April-September
2018) in %
Actual This Year
Actual Same Period Last
Year% Growth (y-o-y)
ECL 3.35 2.89 16 22.4
BCCL 2.37 2.33 1.8 7.5
CCL 4.14 3.81 8.7 9.3
NCL 7.99 7.16 11.5 13
WCL 3.10 2.67 16.2 9.5
SECL 9.84 10.13 -2.9 17.9
MCL 9.41 9.74 -3.4 -0.3
NEC 0.04 0.03 32 51.7
CIL 40.24 38.76 3.8 10.6
NON COKING COAL
October 31, 2018 | 8
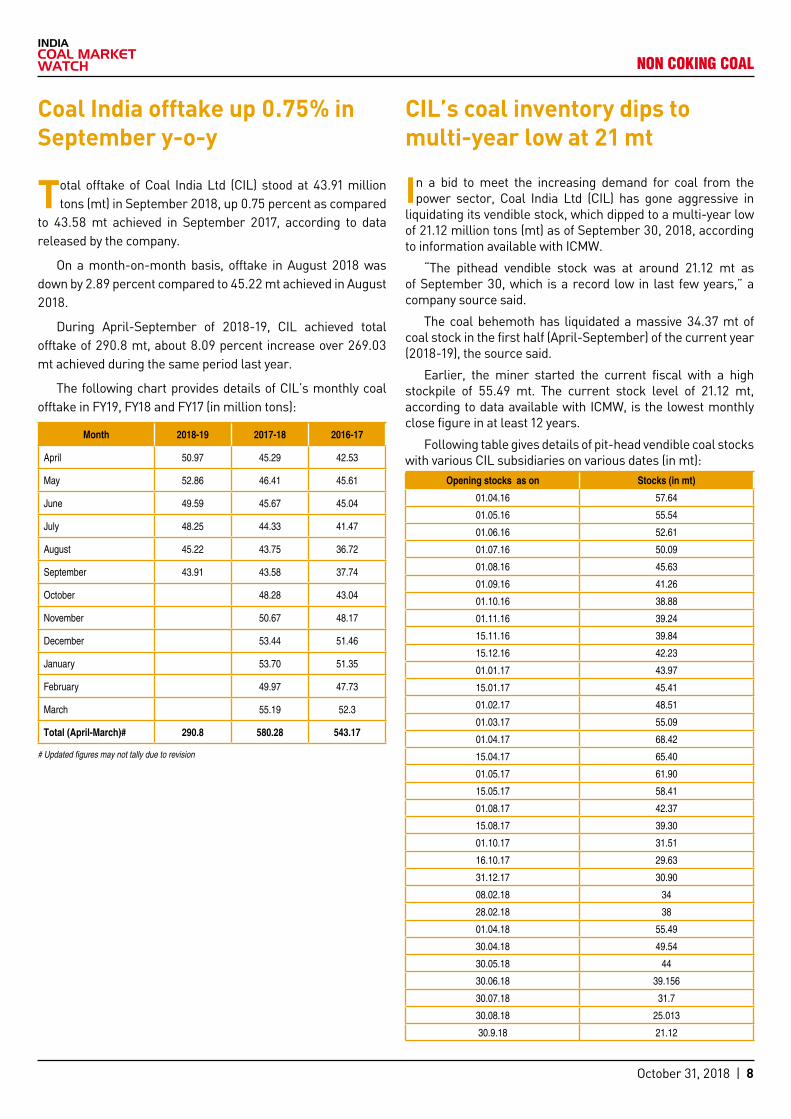
Coal India offtake up 0.75% in September y-o-y
Total offtake of Coal India Ltd (CIL) stood at 43.91 million tons (mt) in September 2018, up 0.75 percent as compared
to 43.58 mt achieved in September 2017, according to data released by the company.
On a month-on-month basis, offtake in August 2018 was down by 2.89 percent compared to 45.22 mt achieved in August 2018.
During April-September of 2018-19, CIL achieved total offtake of 290.8 mt, about 8.09 percent increase over 269.03 mt achieved during the same period last year.
The following chart provides details of CIL’s monthly coal offtake in FY19, FY18 and FY17 (in million tons):
Month 2018-19 2017-18 2016-17
April 50.97 45.29 42.53
May 52.86 46.41 45.61
June 49.59 45.67 45.04
July 48.25 44.33 41.47
August 45.22 43.75 36.72
September 43.91 43.58 37.74
October 48.28 43.04
November 50.67 48.17
December 53.44 51.46
January 53.70 51.35
February 49.97 47.73
March 55.19 52.3
Total (April-March)# 290.8 580.28 543.17
# Updated figures may not tally due to revision
NON COKING COAL
CIL’s coal inventory dips to multi-year low at 21 mt
In a bid to meet the increasing demand for coal from the power sector, Coal India Ltd (CIL) has gone aggressive in
liquidating its vendible stock, which dipped to a multi-year low of 21.12 million tons (mt) as of September 30, 2018, according to information available with ICMW.
“The pithead vendible stock was at around 21.12 mt as of September 30, which is a record low in last few years,” a company source said.
The coal behemoth has liquidated a massive 34.37 mt of coal stock in the first half (April-September) of the current year (2018-19), the source said.
Earlier, the miner started the current fiscal with a high stockpile of 55.49 mt. The current stock level of 21.12 mt, according to data available with ICMW, is the lowest monthly close figure in at least 12 years.
Following table gives details of pit-head vendible coal stocks with various CIL subsidiaries on various dates (in mt):
Opening stocks as on Stocks (in mt)
01.04.16 57.64
01.05.16 55.54
01.06.16 52.61
01.07.16 50.09
01.08.16 45.63
01.09.16 41.26
01.10.16 38.88
01.11.16 39.24
15.11.16 39.84
15.12.16 42.23
01.01.17 43.97
15.01.17 45.41
01.02.17 48.51
01.03.17 55.09
01.04.17 68.42
15.04.17 65.40
01.05.17 61.90
15.05.17 58.41
01.08.17 42.37
15.08.17 39.30
01.10.17 31.51
16.10.17 29.63
31.12.17 30.90
08.02.18 34
28.02.18 38
01.04.18 55.49
30.04.18 49.54
30.05.18 44
30.06.18 39.156
30.07.18 31.7
30.08.18 25.013
30.9.18 21.12

October 31, 2018 | 9
NON COKING COAL
SCCL’s September production up 12.6% y-o-y
Singareni Collieries Company Ltd (SCCL) coal production in September 2018 was up 12.66 percent to 5.12 million tons
(mt) in September 2017, compared to 4.54 mt reported for the same month last year, according to data released by the company.
Similarly, the August production was 14.28 percent lower than 4.48 mt of production achieved in the previous month (August 2018), the data show.
During the first 6 months (April-September) of 2018-19, SCCL production stood at 28.5 mt, 2.56 percent increase compared to 27.78 mt achieved during the same period last fiscal.
SCCL’s production during the first 6 months of 2018-19 achieved 94 percent of the target set for the period at 30.17 mt.
After a flat growth in coal production in 2017-18, SCCL has fixed a steep growth target of 9.7 percent for the current fiscal (2018-19).
The Telangana-based miner, which achieved 62.01 mt of production in 2017-18, is aiming at a yearly output of 68 mt in 2018-19, company sources said.
The following table gives month-wise coal production by SCCL during 2017-18 and 2018-19 (in mt):
Month 2018-19 2017-18 Y-o-Y growth (%)
April 4.51 4.48 0.56
May 5.10 5.05 1.00
June 4.96 4.81 03.26
July 4.43 4.40 0.88
August 4.38 4.51 -2.9
September 5.12 4.54 12.66
October 4.04
November 4.49
December 5.68
January 6.39
February 6.26
March 7.37
Apr-Sept 28.50 27.78 2.56
Total 28.50 62.01
Note: The aggregate may not tally with monthly entries due to rounding off.
SCCL despatches up 9.3% in September
Singareni Collieries Company Ltd (SCCL) has suffered a 9.26 percent increase in coal despatches to 5.13 million tons (mt)
in September 2018, compared to 4.7 mt reported for the same month last year, according to data released by the company.
On a month-on-month basis, despatches by SCCL were also higher by 14.25 percent, against 4.49 mt reported for the previous month (August 2018), the data show.
During the first 6 months (April-September) of 2018-19, total despatches stood at 31.05 mt, about 3.74 percent higher than 29.93 mt recorded for the same period last fiscal.
Total despatches for the first 6 months of 2018-19 almost achieved the 31.18 mt targeted for the period.
The Telangana-based miner had put up a great show in its offtake performance in 2017-18, achieving 64.62 mt, a 6.23 percent increase over 60.83 mt achieved during 2016-17.
The following table gives month-wise coal despatches by SCCL during 2017-18 and 2018-19 (in mt):
Month 2018-19 2017-18 Y-o-Y growth (%)
April 4.51 4.48 0.56
May 5.10 5.05 1.00
June 4.96 4.81 03.26
July 4.43 4.40 0.88
August 4.38 4.51 -2.9
September 5.12 4.54 12.66
October 4.04
November 4.49
December 5.68
January 6.39
February 6.26
March 7.37
Apr-Sept 28.50 27.78 2.56
Total 28.50 62.01
Note: The aggregate may not tally with monthly entries due to rounding off.

October 31, 2018 | 10
NON COKING COAL
NLC’s lignite production slips 22% in September
Lignite production by NLC India during September 2018 stood at 2.35 mt, down 22.42 percent as against 3.03 mt
produced in September 2017, according to official data.The September production was lower than the monthly
target of 2.44 mt set for the month, the data showed.Lignite production for April-September, 2018 stood at 9.94
mt, down 1.83 percent as against 10.12 mt recorded in the corresponding period of the previous year. The target set for April-September, 2018 stood at 10.2 mt.
Earlier, Lignite production by NLC India during 2017-18 stood at 24.73 mt, down 10.26 percent as against 27.56 mt produced in 2016-17.
Meanwhile, total power generation by NLC was down by 8.21 percent to 1,562.34 million units (MU) in September 2018, compared to 1,690.49 MU in the corresponding month of last year.
The September generation was lower than the month’s target of 1,547 MU.
The following table gives month-wise lignite production in 2018-19, 2017-18 and 2016-17 (in mt):
Month 2018-19 2017-18 2016-17
April 0.13 0.38 0.4
May 0.673 0.88 1.41
June 2.81 2.52 2.26
July 2.24 0.85 1.95
August 1.71 2.44 2.06
September 2.35 2.65 2.91
October 1.82 1.98
November 1.73 2.21
December 2.74 2.78
January 2.63 3.14
February 2.55 2.78
March 3.54 3.68
Total 24.73 27.56
Source: Ministry of Coal
NLC posts 17% increase in OBR in September
NLC India (formerly Neyveli Lignite Corporation) has posted a 17.15 percent decline in overburden removal (OBR) during
September 2018 over the same month last year, according to official data.
Total OBR during September 2018 stood at around 14.61 million cubic metre (mcm), compared to 12.47 mcm achieved in the same period of last year, the data show.
On a month-on-month basis, total OBR in September 2018 increased 5.48 percent over 13.85 mcm during August 2018. Meanwhile, the target set for September 2018 stood at 12.6 mcm.
During the April-September, 2018, OBR stood at 86.55 mcm, down 9.7 percent over 95.8 mcm during the corresponding period of the previous year. Meanwhile, the target set for the period stood at 75.35 mcm.
India’s September captive coal production at 3.39 mt
India’s coal production from the allocated captive coal blocks stood at 3.392 million tons (mt) (provisional) in September
2018, according to official data.
Of the total output, production from coal blocks which have not been cancelled by the Supreme Court (viz. Tasra, Pakri Barwadih, Moher and Moher Amlori Extn.) stood at 1.886 mt (provisional), the data show.
Earlier, total production from captive blocks dropped to around 37 mt in 2017-18 from 45.97 mt achieved a year ago.
CIL eyes 681 mt of despatch in FY19
Notwithstanding a lower growth in production during the monsoon, Coal India Ltd (CIL) is aiming to achieve a 100
million tons of increase in coal despatch during the current fiscal (2018-19), Company chairman and managing director A K Jha said.
Addressing the Global Mining Summit 2018, which is being organised by Confederation of Indian Industry, Jha said that the miner is pursuing an aspirational target of 650 mt of production and 681 mt of despatch in FY 2018-19.
CIL had achieved a production of around 567 mt and despatch of 580 mt in 2017-18.
Jha further said that the coal mining sector needs to adopt state-of-the-art technology in extraction of coal to augment production and achieve sustainable mining.
He also stressed on foreign collaboration in mining equipment sector and on increasing exploration activities.
HNL extends date for steam coal tender
Hindustan Newsprint Limited (HNL) extended the bid submission date for the tender floated to procure 10,000
tons (+/-10 percent) of 5500 Kcal/Kg steam (non-coking) coal to be delivered on FOR Newsprint Nagar (HNL siding – PNPS) basis.
The last date for submission of bids was extended to October 17, 2018 from October 3, 2018.
The technical specifications (norms) were: GCV (ADB) 5500 Kcal/Kg, ash (ADB) up to 6%, total moisture up to 34 percent, Sulphur (ADB) up to 1 percent, volatile matter 35-45 percent.
October 31, 2018 | 11
NON COKING COAL
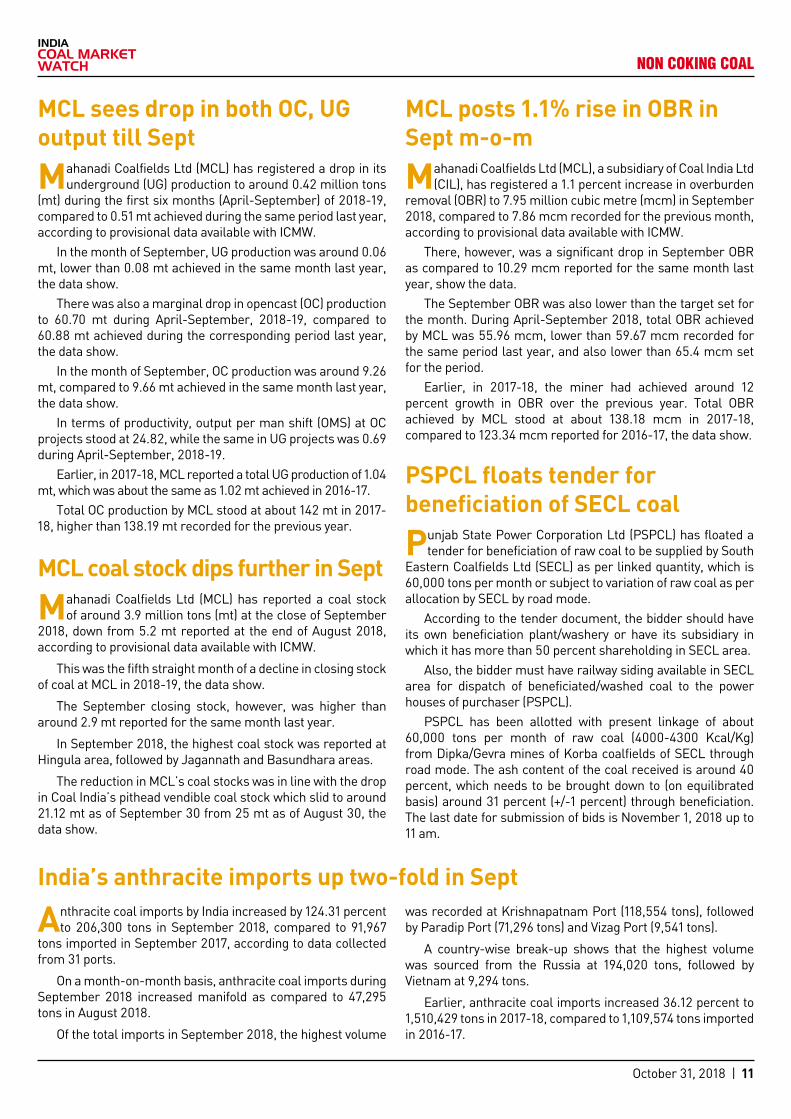
MCL sees drop in both OC, UG output till Sept
Mahanadi Coalfields Ltd (MCL) has registered a drop in its underground (UG) production to around 0.42 million tons
(mt) during the first six months (April-September) of 2018-19, compared to 0.51 mt achieved during the same period last year, according to provisional data available with ICMW.
In the month of September, UG production was around 0.06 mt, lower than 0.08 mt achieved in the same month last year, the data show.
There was also a marginal drop in opencast (OC) production to 60.70 mt during April-September, 2018-19, compared to 60.88 mt achieved during the corresponding period last year, the data show.
In the month of September, OC production was around 9.26 mt, compared to 9.66 mt achieved in the same month last year, the data show.
In terms of productivity, output per man shift (OMS) at OC projects stood at 24.82, while the same in UG projects was 0.69 during April-September, 2018-19.
Earlier, in 2017-18, MCL reported a total UG production of 1.04 mt, which was about the same as 1.02 mt achieved in 2016-17.
Total OC production by MCL stood at about 142 mt in 2017-18, higher than 138.19 mt recorded for the previous year.
MCL coal stock dips further in Sept
Mahanadi Coalfields Ltd (MCL) has reported a coal stock of around 3.9 million tons (mt) at the close of September
2018, down from 5.2 mt reported at the end of August 2018, according to provisional data available with ICMW.
This was the fifth straight month of a decline in closing stock of coal at MCL in 2018-19, the data show.
The September closing stock, however, was higher than around 2.9 mt reported for the same month last year.
In September 2018, the highest coal stock was reported at Hingula area, followed by Jagannath and Basundhara areas.
The reduction in MCL’s coal stocks was in line with the drop in Coal India’s pithead vendible coal stock which slid to around 21.12 mt as of September 30 from 25 mt as of August 30, the data show.
MCL posts 1.1% rise in OBR in Sept m-o-m
Mahanadi Coalfields Ltd (MCL), a subsidiary of Coal India Ltd (CIL), has registered a 1.1 percent increase in overburden
removal (OBR) to 7.95 million cubic metre (mcm) in September 2018, compared to 7.86 mcm recorded for the previous month, according to provisional data available with ICMW.
There, however, was a significant drop in September OBR as compared to 10.29 mcm reported for the same month last year, show the data.
The September OBR was also lower than the target set for the month. During April-September 2018, total OBR achieved by MCL was 55.96 mcm, lower than 59.67 mcm recorded for the same period last year, and also lower than 65.4 mcm set for the period.
Earlier, in 2017-18, the miner had achieved around 12 percent growth in OBR over the previous year. Total OBR achieved by MCL stood at about 138.18 mcm in 2017-18, compared to 123.34 mcm reported for 2016-17, the data show.
PSPCL floats tender for beneficiation of SECL coal
Punjab State Power Corporation Ltd (PSPCL) has floated a tender for beneficiation of raw coal to be supplied by South
Eastern Coalfields Ltd (SECL) as per linked quantity, which is 60,000 tons per month or subject to variation of raw coal as per allocation by SECL by road mode.
According to the tender document, the bidder should have its own beneficiation plant/washery or have its subsidiary in which it has more than 50 percent shareholding in SECL area.
Also, the bidder must have railway siding available in SECL area for dispatch of beneficiated/washed coal to the power houses of purchaser (PSPCL).
PSPCL has been allotted with present linkage of about 60,000 tons per month of raw coal (4000-4300 Kcal/Kg) from Dipka/Gevra mines of Korba coalfields of SECL through road mode. The ash content of the coal received is around 40 percent, which needs to be brought down to (on equilibrated basis) around 31 percent (+/-1 percent) through beneficiation. The last date for submission of bids is November 1, 2018 up to 11 am.
Anthracite coal imports by India increased by 124.31 percent to 206,300 tons in September 2018, compared to 91,967
tons imported in September 2017, according to data collected from 31 ports.
On a month-on-month basis, anthracite coal imports during September 2018 increased manifold as compared to 47,295 tons in August 2018.
Of the total imports in September 2018, the highest volume
was recorded at Krishnapatnam Port (118,554 tons), followed by Paradip Port (71,296 tons) and Vizag Port (9,541 tons).
A country-wise break-up shows that the highest volume was sourced from the Russia at 194,020 tons, followed by Vietnam at 9,294 tons.
Earlier, anthracite coal imports increased 36.12 percent to 1,510,429 tons in 2017-18, compared to 1,109,574 tons imported in 2016-17.
India’s anthracite imports up two-fold in Sept

October 31, 2018 | 12
India’s October coal & coke imports up 4% m-o-m
India’s coal and coke imports during October 2018 through 31 major and non-major ports are estimated to have increased
by 3.55 percent over September 2018, according to a provisional compilation by ICMW, based on monitoring of vessels’ positions and data received from shipping companies.
Imports during October 2018 stood at 18.42 million tons (mt) (provisional) as compared to 17.79 mt (revised) imported in September 2018. The provisional figure for the month of September 2018 was 21.16 mt.
Earlier, coal and coke imports in October 2017 stood at 19.77 mt, according to ICMW’s compilation.
Of the total imports during October 2018, non-coking coal was at 13.24 mt, against 13.48 mt imported in September 2018. Coking coal imports were at 3.94 mt in October 2018, up against 3.15 mt imported a month ago.
Metallurgical coke imports during the month were at 0.39 mt, while 0.36 mt was imported in the previous month. Petroleum coke imports were at 0.34 mt in October 2018, against 0.21 mt imported in September 2018.
PCI coal imports were at 0.39 mt in October 2018, while the figure was 0.37 mt in September 2018.
Anthracite coal import was 0.11 mt in October 2018, and the figure was 0.21 mt in September 2018.
The following table provides comparison of imports of various types of coal in India (in million tons):
India’s coal & coke import (in mt)
Coal Type Oct'18* Sep'18 Oct'17 Apr-Oct'18*
Apr-Oct'17
Coking Coal 3.94 3.15 3.86 29.18 27.84
Non Coking Coal 13.24 13.48 13.24 94.49 83.45
Anthracite Coal 0.11 0.21 0.08 0.80 0.87
PCI Coal 0.39 0.37 0.97 3.89 2.96
Met Coke 0.39 0.36 0.40 2.76 2.31
Pet Coke 0.34 0.21 1.22 3.34 7.14
Total 18.42 17.79 19.77 134.46 124.57
* The data is provisional
MONtHLY tOtAL IMPORtS IN INDIA (in tons)
PRODUCT Jul-18 Aug-18 Sep-18 "Apr-Sep 2017-18"
"Apr-Sep 2016-17"
Y-O-Y %
Growth (+/-)
NON COKING COAL
1,37,82,076 1,40,06,792 1,34,82,427 8,12,51,228 7,02,09,616 15.73
COKING COAL
42,91,647 48,32,729 31,54,056 2,52,41,168 2,39,87,357 5.23
ANTHRACITE COAL
68,217 47,295 2,06,300 6,89,234 7,87,305 -12.46
PCI COAL 6,25,452 5,73,060 3,70,179 34,97,424 19,92,480 75.53
MET COKE 4,07,232 4,90,405 3,60,011 23,71,958 19,07,564 24.34
PET COKE 4,93,042 6,47,053 2,12,288 29,93,435 59,23,572 -49.47
GYPSUM 4,17,964 2,53,271 5,21,851 23,89,515 13,07,325 82.78
LIMESTONE 13,48,852 13,71,629 13,91,247 82,21,478 62,20,298 32.17
NON COKING COAL
The following charts give month-on-month imports of CC, NCC, Anthracite, PCI, Pet and Met coke through the east and west coast of India (in mt):
East vs West coast, coking and non coking coal import, m-o-m
East vs West coast, met and pet coke import, m-o-m
East vs West coast, anthracite and PCI coal import, m-o-m
October 31, 2018 | 13
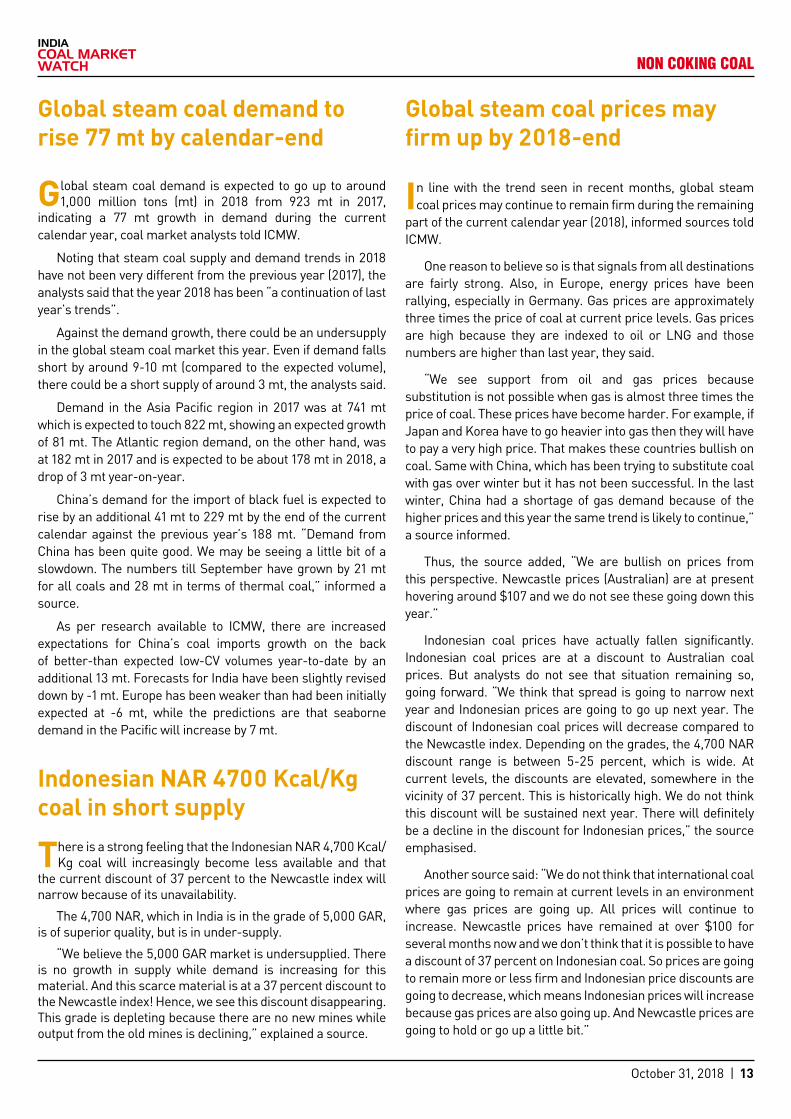
Global steam coal prices may firm up by 2018-end
In line with the trend seen in recent months, global steam coal prices may continue to remain firm during the remaining
part of the current calendar year (2018), informed sources told ICMW.
One reason to believe so is that signals from all destinations are fairly strong. Also, in Europe, energy prices have been rallying, especially in Germany. Gas prices are approximately three times the price of coal at current price levels. Gas prices are high because they are indexed to oil or LNG and those numbers are higher than last year, they said.
“We see support from oil and gas prices because substitution is not possible when gas is almost three times the price of coal. These prices have become harder. For example, if Japan and Korea have to go heavier into gas then they will have to pay a very high price. That makes these countries bullish on coal. Same with China, which has been trying to substitute coal with gas over winter but it has not been successful. In the last winter, China had a shortage of gas demand because of the higher prices and this year the same trend is likely to continue,” a source informed.
Thus, the source added, “We are bullish on prices from this perspective. Newcastle prices (Australian) are at present hovering around $107 and we do not see these going down this year.”
Indonesian coal prices have actually fallen significantly. Indonesian coal prices are at a discount to Australian coal prices. But analysts do not see that situation remaining so, going forward. “We think that spread is going to narrow next year and Indonesian prices are going to go up next year. The discount of Indonesian coal prices will decrease compared to the Newcastle index. Depending on the grades, the 4,700 NAR discount range is between 5-25 percent, which is wide. At current levels, the discounts are elevated, somewhere in the vicinity of 37 percent. This is historically high. We do not think this discount will be sustained next year. There will definitely be a decline in the discount for Indonesian prices,” the source emphasised.
Another source said: “We do not think that international coal prices are going to remain at current levels in an environment where gas prices are going up. All prices will continue to increase. Newcastle prices have remained at over $100 for several months now and we don’t think that it is possible to have a discount of 37 percent on Indonesian coal. So prices are going to remain more or less firm and Indonesian price discounts are going to decrease, which means Indonesian prices will increase because gas prices are also going up. And Newcastle prices are going to hold or go up a little bit.”
NON COKING COAL
Global steam coal demand to rise 77 mt by calendar-end
Global steam coal demand is expected to go up to around 1,000 million tons (mt) in 2018 from 923 mt in 2017,
indicating a 77 mt growth in demand during the current calendar year, coal market analysts told ICMW.
Noting that steam coal supply and demand trends in 2018 have not been very different from the previous year (2017), the analysts said that the year 2018 has been “a continuation of last year’s trends”.
Against the demand growth, there could be an undersupply in the global steam coal market this year. Even if demand falls short by around 9-10 mt (compared to the expected volume), there could be a short supply of around 3 mt, the analysts said.
Demand in the Asia Pacific region in 2017 was at 741 mt which is expected to touch 822 mt, showing an expected growth of 81 mt. The Atlantic region demand, on the other hand, was at 182 mt in 2017 and is expected to be about 178 mt in 2018, a drop of 3 mt year-on-year.
China’s demand for the import of black fuel is expected to rise by an additional 41 mt to 229 mt by the end of the current calendar against the previous year’s 188 mt. “Demand from China has been quite good. We may be seeing a little bit of a slowdown. The numbers till September have grown by 21 mt for all coals and 28 mt in terms of thermal coal,” informed a source.
As per research available to ICMW, there are increased expectations for China’s coal imports growth on the back of better-than expected low-CV volumes year-to-date by an additional 13 mt. Forecasts for India have been slightly revised down by -1 mt. Europe has been weaker than had been initially expected at -6 mt, while the predictions are that seaborne demand in the Pacific will increase by 7 mt.
Indonesian NAR 4700 Kcal/Kg coal in short supply
There is a strong feeling that the Indonesian NAR 4,700 Kcal/Kg coal will increasingly become less available and that
the current discount of 37 percent to the Newcastle index will narrow because of its unavailability.
The 4,700 NAR, which in India is in the grade of 5,000 GAR, is of superior quality, but is in under-supply.
“We believe the 5,000 GAR market is undersupplied. There is no growth in supply while demand is increasing for this material. And this scarce material is at a 37 percent discount to the Newcastle index! Hence, we see this discount disappearing. This grade is depleting because there are no new mines while output from the old mines is declining,” explained a source.

October 31, 2018 | 14
NON COKING COAL
Russia September coal production at 35.964 mt
Russia’s coal production during the September 2018 stood at 35.964 million tons (mt) going up by 2.20 percent on a
year-on-year basis as compared to 35.189 mt in September 2017, according to provisional data available with ICMW.
The country’s coal production during September 2018 went down by 0.98 percent on a month-on-month basis (m-o-m), from 36.320 mt in August 2018.
The world’s sixth-largest coal producer had produced 407.733 mt of coal during (January-December) of 2017.
Russia’s coal supply on a year-on-year basis during September 2018 up by 0.33 percent as against 29.529 mt in the corresponding month of 2017.
The country’s coal supply during September 2018 went down by 2.44 percent on a month-on-month basis (m-o-m), from 30.371 mt in August 2018.
Russia supplied 356.129 mt of coal during (January-December) of 2017.
Russia’s coal production and supply for September 2018:
MonthRussia coal production Russia coal supply
2017 (mt) 2018 (mt) 2017 (mt) 2018 (mt)
January 33.688 34.301 31.212 32.004
February 32.301 34.620 28.980 30.595
March 33.852 36.326 30.357 32.898
Q3 99.84 105.247 90.54 95.497
April 33 35.326 27.8 30.449
May 33 35.330 28.6 30.267
June 32.19 33.283 27.052 28.230
Q2 98.19 103.939 83.4 88.946
July 33.105 34.600 27.851 29.448
August 33.436 36.320 28.906 30.371
September 35.189 35.964 29.529 29.629
Q3 101.73 106.884 86.28 89.448
October 36.478 31.772
November 35.399 31.294
December 36.096 32.843
Q4 107.973 95.909
TOTAL 407.733 356.129
Russia’s coal exports up 4.97% y-o-y in September
Russia’s coal exports during September 2018 were up by 4.97 percent at 16.408 million tons (mt) as compared to
15.631 mt in September 2017, according to provisional data available by ICMW.
The country’s coal exports during September 2018 went down 4.67 percent on a month-on-month basis (m-o-m), from 17.212 mt in August 2018.
The world’s sixth-largest coal producer had exported 185.106 mt of coal during (January-December) of 2017.
Russia’s coal export for September 2018:
Russia Coal Export
Month 2017 (MT) 2018 (MT)
January 14.475 14.903
February 13.626 14.142
March 15.207 15.527
Q1 Total 43.308 44.572
April 14.871 15.346
May 16.255 16.597
June 16.007 16.218
Q2 Total 47.042 48.161
July 16.406 16.858
August 16.341 17.212
September 15.631 16.408
Q3 Total 48.37 50.478
October 16.458
November 15.339
December 14.589
Q4 Total 46.386
TOTAL (Jan-Dec) 185.106

October 31, 2018 | 15
SA coal prices to stay firm for rest of calendar
Notwithstanding the low demand for South African thermal coal, the spot prices are hovering at relatively high levels
and are difficult to predict the future movements, a global coal analyst told ICMW.
“South African (thermal) coal prices are following a pattern that is difficult to predict. For instance, demand in South Africa is at its lowest point, but prices are very high,” the analyst said.
The RB1 (6,000 kcal/kg NCV) exports from the Richards Bay Coal Terminal (RBCT), which were hovering around $102 per ton, are expected to hover around $101/ton by calendar-end. The analyst expects RB1 NAR FOB RBCT to be not below $100/ton. The discount for RB3 to range from $24/ton to $30/ton.
Currently, the source revealed that prices are thus – RB1 at $99.13/ton, RB3 at $72.55/ton, the 4800 Kcal/Kg variety at $53.90/ton.
Where the pricing outlook for 2019 is concerned, he said, the rates would probably be at $102/ton (RB1), or between $101-$102/ton. Discounts for RB3 might increase to $30-$35/ton. “The factors behind such movements are unknown. There is a growing trend to export to new destinations, like RB3 to some EU countries,” he added.
US coal production estimated decline 2 percent in 2018
Coal production in US is estimated to decline by 2 percent to 756 million short tons (MMst) in 2018 compared despite
an increase in 12 percent (11 MMst) in US coal exports over the same period, the US Energy Information Agency (EIA) noted in its latest short-term energy outlook report.
The EIA report further said that the production decrease is largely attributable to a forecast decline of 4 percent (26 MMst) in domestic coal consumption in 2018. EIA expects coal production to decline by 2 percent (13 MMst) in 2019 because coal exports and coal consumption will decrease by 7 percent and 5 percent, respectively decrease.
EIA expects the share of US total utility-scale electricity generation from natural gasfired power plants to rise from 32 percent in 2017 to 35 percent in both 2018 and 2019. EIA’s forecast electricity generation share from coal averages 28 percent in 2018 and 27 percent in 2019, down from 30 percent in 2017. The nuclear share of generation was 20 percent in 2017 and EIA forecasts that it will be slightly below 20 percent in 2018 and in 2019. Wind, solar, and other nonhydropower renewables provided slightly less than 10 percent of electricity generation in 2017, and EIA expects them to provide more than 10 percent in 2018 and nearly 11 percent in 2019.
The generation share of hydropower was 7 percent in 2017 and EIA forecasts that it will be about the same in 2018 and 2019. In 2017, EIA estimates that U.S. wind generation averaged 697,000 megawatthours per day (MWh/d). EIA forecasts that wind generation will rise by 8 percent to 750,000 MWh/d in 2018 and by a further 6 percent to 793,000 MWh/d in 2019.
Solar power generates less electricity in the United States than wind power but continues to grow at a faster rate.
EIA expects solar generation will rise from 211,000 MWh/d in 2017 to 267,000 MWh/d in 2018 (an increase of 26 percent) and to 305,000 MWh/d in 2019 (an increase of 14 percent).
NON COKING COAL

October 31, 2018 | 16
Port wise non coking coal import, m-o-m & y-o-y comparison (in mt)
PORT Sep'17 Aug'18 Sep'18
CHENNAI 0.000 0.001 0.000
COCHIN - - -
ENNORE 0.295 0.483 0.516
GANGAVARAM 0.321 1.114 0.565
KANDLA 0.447 1.340 1.481
KOLKATA / HALDIA 0.127 0.378 0.224
GOA / MARMAGOA 0.374 0.158 0.258
MUMBAI 0.289 0.149 0.212
MUNDRA 2.619 2.640 2.664
NEW MANGALORE 0.289 0.234 0.119
PARADIP 0.472 0.520 0.409
VIZAG 0.451 0.614 0.583
TUTICORIN / VOC 0.221 0.334 0.730
NAVLAKHI 0.111 0.668 0.610
PORBANDAR 0.027 0.026 0.023
BHAVNAGAR 0.037 0.061 0.032
PIPAVAV 0.055 0.088 0.071
BEDI 0.486 0.234 0.222
MAGDALLA 0.374 0.798 0.404
DAHEJ 0.475 0.884 0.574
KRISHNAPATNAM 1.189 1.510 2.210
KARAIKAL 0.311 0.114 0.246
OKHA 0.038 0.030 0.028
KAKINADA 0.083 0.198 0.188
JAIGARH 0.212 0.354 0.405
JAFRABAD 0.031 0.017 0.014
JAKHAU 0.040 0.021 0.020
MULDWARKA 0.029 0.028 0.025
SIKKA 0.021 0.023 0.022
HAZIRA 0.454 0.731 0.370
DHAMRA 0.384 0.257 0.253
NON COKING COAL

October 31, 2018 | 17
Port wise non coking coal import during October-September’17 & ’18 (in mt)
PORT Oct-Sep'17 Oct-Sep'18 % Growth (+/-)
CHENNAI 0.002 0.005 NA
COCHIN - 0.087 #DIV/0!
ENNORE 7.277 6.979 -4.1%
GANGAVARAM 4.624 11.527 NA
KANDLA 10.739 14.167 31.9%
KOLKATA / HALDIA 2.013 2.472 22.8%
GOA / MARMAGOA 3.592 2.587 -28.0%
MUMBAI 2.438 2.426 -0.5%
MUNDRA 30.637 29.380 -4.1%
NEW MANGALORE 5.280 5.364 1.6%
PARADIP 4.858 7.248 49.2%
VIZAG 3.753 8.218 NA
TUTICORIN / VOC 8.120 6.228 -23.3%
NAVLAKHI 2.950 3.360 13.9%
PORBANDAR 0.297 0.289 -2.7%
BHAVNAGAR 0.562 0.483 -14.0%
PIPAVAV 0.839 0.860 2.6%
BEDI 5.033 2.646 -47.4%
MAGDALLA 5.436 7.134 31.2%
DAHEJ 5.040 6.193 22.9%
KRISHNAPATNAM 14.698 18.295 24.5%
KARAIKAL 3.878 4.793 23.6%
OKHA 0.485 0.379 -21.8%
KAKINADA 0.594 1.298 NA
JAIGARH 2.656 3.470 30.7%
JAFRABAD 0.369 0.281 -23.7%
JAKHAU 0.473 0.321 -32.2%
MULDWARKA 0.332 0.348 4.9%
SIKKA 0.258 0.290 12.5%
HAZIRA 4.356 5.600 28.5%
DHAMRA 3.767 3.303 -12.3%
NON COKING COAL
October 31, 2018 | 18
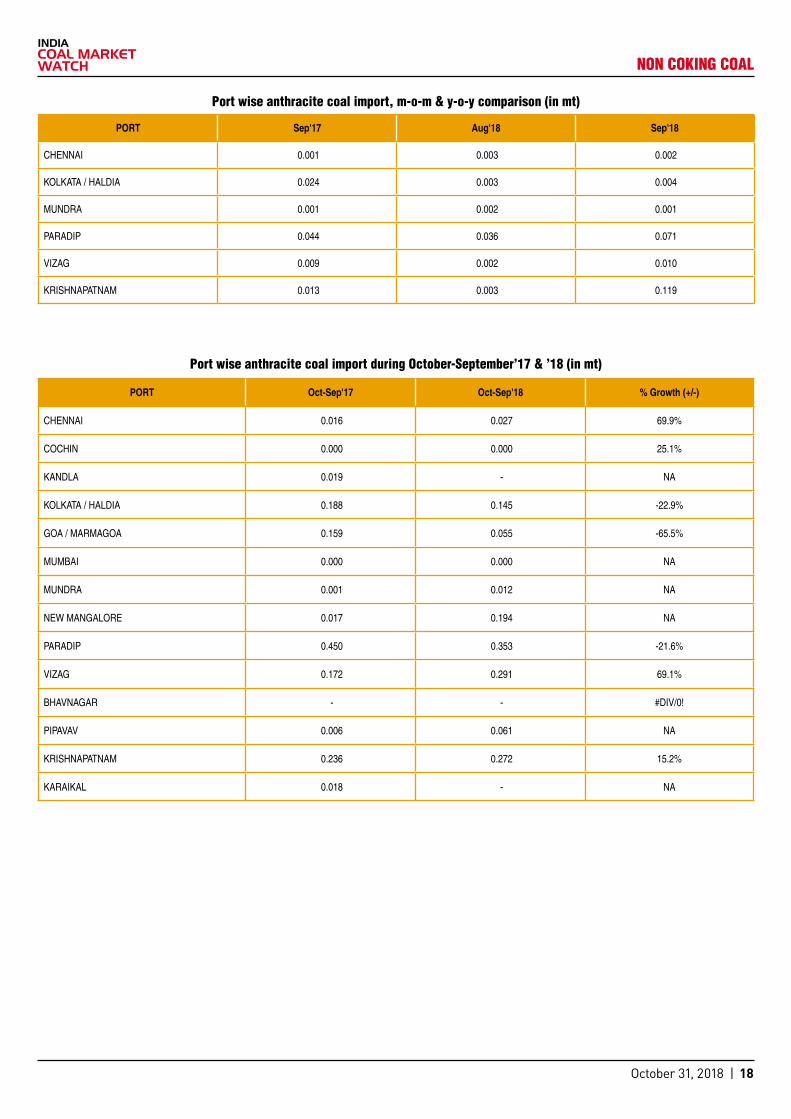
Port wise anthracite coal import, m-o-m & y-o-y comparison (in mt)
Port wise anthracite coal import during October-September’17 & ’18 (in mt)
PORT Sep'17 Aug'18 Sep'18
CHENNAI 0.001 0.003 0.002
KOLKATA / HALDIA 0.024 0.003 0.004
MUNDRA 0.001 0.002 0.001
PARADIP 0.044 0.036 0.071
VIZAG 0.009 0.002 0.010
KRISHNAPATNAM 0.013 0.003 0.119
PORT Oct-Sep'17 Oct-Sep'18 % Growth (+/-)
CHENNAI 0.016 0.027 69.9%
COCHIN 0.000 0.000 25.1%
KANDLA 0.019 - NA
KOLKATA / HALDIA 0.188 0.145 -22.9%
GOA / MARMAGOA 0.159 0.055 -65.5%
MUMBAI 0.000 0.000 NA
MUNDRA 0.001 0.012 NA
NEW MANGALORE 0.017 0.194 NA
PARADIP 0.450 0.353 -21.6%
VIZAG 0.172 0.291 69.1%
BHAVNAGAR - - #DIV/0!
PIPAVAV 0.006 0.061 NA
KRISHNAPATNAM 0.236 0.272 15.2%
KARAIKAL 0.018 - NA
NON COKING COAL

October 31, 2018 | 19
POWER SECtOR
There was no power generation capacity addition during August 2018, according to a report released by the Central
Electricity Authority (CEA).
A year ago, power generation capacity addition during August 2017 stood at 66 megawatts (MW). However, there was power generation capacity addition during July 2018.
Previously, power generation capacity addition during the 2017-18 fiscal was down 30 percent at 9,383 MW (provisional),
compared to 13,466 MW (provisional) recorded for the corresponding period of 2016-17.
Of the total installed capacity of 344,688.61 MW in the country as of August 31, 2018, thermal power generation capacity stood at 221,802.59 MW (196,097.5 MW coal-fired, 24,897.46 MW gas-fired and 837.63 MW diesel-fired). Nuclear power generation capacity stood at 6,780 MW, while hydro generation stood at 45,457.42 MW and renewables at 70,648.61 MW.
Monthly capacity addition during FY13 to FY19 (in MW):
Months 2018-19 2017-18 2016-17 2015-16 2014-15 2013-14 2012-13
April - 2,256 1,260 965 535* 282 1,760
May 110 1,056 250 - 2,716 1,570 1,070#
June - 170 65 2,315 979 660 2,376
July - NA 540 500 769 - 950
August NA 406 871 3,320 921 550
September NA 730 1,951 660 1,365 870
October NA NIL 1,444 600 530 1,400
November 157 1,535 - 364 1,635 803
December: - 1,960 2,280 669 1,765 15
January 850 1,112 2,296 2,020 700 877
February 1,154 1,154 660 2,305 2,711 2,864
March 3,740 4,454 9,795 6,631 5,286 7,028
Total 110 9,383 13,466++ 23,976* 21,566 17,425 20,563
# Figures may not tally due to revision of data by CEA. *As per CEA data, the total capacity addition in April-November was 8,346 MW. *As per CEA data, the total capacity addition in April-July, 2016 was 2,340 MW. ++As per CEA data, the total capacity addition in April-January, 2016 was 7,858 MW.+++As per CEA data, the total capacity addition in April-November, 2015 was 8346 MW.
No power capacity addition in August
India’s total power generation increased by 2.9 percent at 105.698 billion units (BU) during August 2018 over 102.671
BU recorded in the corresponding month of the previous year, according to CEA data. Total power generation target set for the month was 110.174 BU.
On a month-on-month (m-o-m) basis India’s total power generation during August 2018 was up 3.68 percent compared to 101.937 BU in July 2018.
On a m-o-m basis, India’s thermal power generation during August 2018 was up 1.5 percent to 83.43 BU, compared to 82.18 BU in July 2018. Hydro power generation was up 18.12 percent at 18.64 BU in August 2018, compared to 15.78 BU in July 2018. Nuclear power generation in August 2018 stood at 2.68 BU, down 22.76 percent as against 3.47 BU in July 2018.
On a year-on-year basis India’s thermal power generation during August 2018 (83.43 BU) was up 1.5 percent compared to 83.85 BU in August 2017. Hydro power generation (18.64 BU)
was up 18.12 percent in August 2018 (18.64 BU) compared to 15.56 BU in August 2017. Nuclear power generation in August 2018 (2.68 BU) was up 17 percent over 2.29 BU in the year-ago month.
Previously, the country’s total power generation stood at 1,201.543 BU during 2017-2018, compared to 1,155.085 BU in 2016-17.
Power generation for select months in 2017 and 2018:
Type Monthly generation (in billion units)
Aug-18 July-18 Aug-17
Thermal 83.43 82.18 83.85
Hydro 18.64 15.78 15.56
Nuclear 2.68 3.47 2.29
Bhutan Import 0.945 0.886 0.981
All India 105.698 102.324 102.671
Aug power generation up 3% y-o-y

October 31, 2018 | 20
POWER SECtOR
Coal stock at thermal power plants down 11% m-o-m
Coal stocks at about 100 thermal power plants (TPS) monitored by the Central Electricity Authority (CEA) were
down by 11 percent on a month-on-month (m-o-m) basis as of October 29, 2018.
Of the total 100 plants, 30 power plants were facing shortage of coal as of Oc-tober 29, 2018, the data show.
The stocks of coal at the 100 TPS stood at 9.842 mt on October 29, 2018, down 3.8 percent from 9.481 mt on October 22, 2018, on a w-o-w basis, and were up by 27.53 percent as compared to 7.717 mt recorded a year ago, on October 29, 2017. Coal stocks at these power plants as on October 29, 2018 was down by 11 percent compared to 11.006 mt recorded a month ago, on September 29, 2018.
Of the total stocks at the TPS as on October 29, 2018 domestic coal stocks stood at 9.421 mt, up 3.33 percent from 9.117 mt as on October 22, 2018, on a w-o-w basis. The stocks as on October 29, 2018 was up by 27.28 percent from 7.368 mt as on October 29, 2017 on year-on-year (y-o-y) basis, and down by 11.45 percent from 10.64 mt as on September 29, 2018 on a month-on-month (m-o-m) basis.
The stocks of imported coal at the TPS were up 15.38 percent at 0.42 mt as on October 29, 2018 against 0.364 mt as on October 22, 2018. On a y-o-y basis stocks were up 20.34 percent from 0.349 mt as on October 29, 2017. The im-ported stocks on October 17, 2018 were up 14.44 percent from 0.367 mt on September 29, 2018 m-o-m.
The number of plants facing critical coal stocks position of less than 7 days stood at 10, 9, 9 and 9 as on October 29, 2018, October 22, 2018, September 29, 2018 and October 29, 2017, respectively. The number of plants facing su-per critical coal stocks position of less than 4 days stood at 20, 22, 13 and 14 as on October 29, 2018, October 22, 2018, September 29, 2018 and October 29, 2017, respectively.
In terms of days, stocks of coal on October 29, 2018, October 22, 2018, Sep-tember 29, 2018 and October 29, 2017, respectively were 6, 6, 7 and 6, respec-tively.
Following table shows coal stocks position at power plants on various days:
Date Oct 29, 2018
Oct 22, 2018
Sept 29, 2018
Oct 29, 2017
Stock (in mt) 9.842 9.481 11.006 7.717
Days 6 6 7 6
Imported (in mt) 0.42 0.364 0.367 0.349
Domestic (in mt) 9.421 9.117 10.64 7.368
Critical plants (no. of plants) 10 9 9 9
Super critical plants (no. of plants) 20 22 13 14
Critical plants pit head (no. of plants) 0 0 0 0
Super critical plants pit head (no. of plants)
0 0 0 0
PLF of thermal plants down y-o-y
The plant load factor (PLF) of thermal power plants in August 2018 was 56.39 percent, against 57.33 percent in the same
month of the previous fiscal, as per provisional CEA data.
PLF for August 2018 was higher than July 2018, which was at 55.45 percent. Sector-wise break-up of August 2018 stood at 66.64 percent for central, 49.64 percent for states and 63.22 percent for private plants.
A month ago during July 2018, sector-wise break-up stood at 67.6 percent for central, 49.44 percent for states and 60.94 percent for private plants.
Meanwhile, a year ago, during August 2017, sector-wise break-up stood at 69.2 percent for central, 50.2 percent for states and 64.25 percent for private plants.
All India month-wise PLF data (in %).
Month 2018-19 2017-18 2016-17
April 64.9 64.93 66.81
May 65.34 63.55 62.15
June 59.17 56.72 73.24
July 55.45 53.7 67.21
August 56.39 57.33 69.91
September 60.69 57.93
October 59.69 59.93
November 59.47 60.5
December 59.05 59.97
January 62.47 60.14
February 62.59 61.53
March 65.33 63.13
CIL’s coal supply to power plants down 1% in Sept y-o-y
Coal despatches to the power sector by Coal India (CIL) was down by 0.9 percent during September 2018 over the
corresponding month of the previous year.
According to ministry data, total coal supply to the power plants by CIL stood at 35.1 million tons (mt) during September 2018, against 35.4 mt recorded in September 2017.
On a month on month basis, CIL’s coal supplies to power plant during September 2018 decreased 4.35 percent as against 36.7 mt during August 2018.
Meanwhile, coal despatches to power units of the country stood at 231.3 mt during April-September, 2018, up 9.6 percent as against 211.1 mt recorded in the corresponding period of the previous fiscal.
Earlier, coal despatches to power units of the country stood at 454.1 mt during April-March, 2018, up 7 percent over 425.4 mt recorded in the corresponding period of the previous fiscal.

October 31, 2018 | 21
POWER SECtOR
ReNew Power bags solar PV project at Vishakhapatnam
Renewable energy company ReNew Power has won a tender for developing a 3 megawatts (MW) floating solar
photovoltaic (PV) project to be set up in Visakhapatnam, Andhra Pradesh.
This would be among the largest floating solar PV projects in India and is estimated to generate around 4.2 million units of power annually, offsetting over 3,960 tons of carbon emissions every year, the company said in a statement.
“Floating solar is an emerging technology trend with huge potential and we are proud to be associated with this project at the Meghadrigedda reservoir, Visakhapatnam. We believe floating solar power plants can play a critical role in a country like India which has abundant water bodies,” said Prabhat Kumar Mishra, head - distributed solar & offtake, ReNew Power.
The company said it had won the project after a bidding process conducted by the Greater Visakhapatnam Municipal Corporation (GVMC). The project would be financed by GVMC through a grant received from the Asian Development Bank under their Urban Climate Change Resilience Trust Fund.
Multiple factors including higher efficiency and lower installation time have contributed to floating solar gaining momentum, with Solar Energy Corporation of India (SECI) inviting an Expression of Interest to generate 10,000 MW through this channel, Mishra said.
Industry estimates suggest floating solar panels can generate up to 300 gigawatt of power if only 10-15 percent of India’s water resources are utilised for the purpose.
SCCL’s coal supply to power plants up 6.9% in Sept y-o-y
Coal despatches to the power sector by Singareni Collieries Company (SCCL) was up by 6.9 percent during September
2018 over the corresponding month of the previous year.
According to ministry data, total coal supply to the power plants by SCCL stood at 4.2 million tons (mt) during September 2018, against 4 mt recorded in September 2017.
Meanwhile, coal despatches to power units of the country stood at 25.4 mt during April-September, 2018, up by 1.7 percent over 25 mt recorded in the corresponding period of the previous fiscal.
On a month on month basis, SCCL’s coal supplies to power plant during September 2018 was up 16.66 percent as against 3.6 mt recorded in August 2018.
Outstanding dues from gencos to CIL up at Rs 7,573.48 cr
Total outstanding dues from power generating units payable to Coal India Ltd (CIL) stood at around Rs 7,573.48 crore
(provisional) as of September 30, 2018, according to official data.
The September data show a rise in outstanding dues from the level of Rs 7,343.87 crore as of August 31, 2018. Previously, the outstanding dues had declined in July to Rs 7,218.96 crore from 7,714.66 crore as of June 30, 2018. There has been a steady drop in outstanding dues from Rs 8,724.38 crore as of May 31, 2018, Rs 9,426.11 crore as of March 31, 2018, and Rs 10,136.14 crore as of February 28, 2018.
Earlier, total outstanding dues from power gencos to CIL had touched Rs 12,028 crore as of March 31, 2017, following which the top management of CIL subsidiaries had written letters to the chairmen/directors of the power houses for timely recovery.
CIL signs MoU with NLC for power generation
Coal India Limited (CIL) entered into a pact with NLC India Ltd (NLCIL) to set up a joint venture for power generation.
“Coal India Ltd (CIL) and NLCIL have signed a memorandum of understanding (MoU) for formation of a joint venture for solar power generation of 3,000 megawatt (MW) and thermal power projects of 2,000 MW capacity,” the company said in a BSE filing.

October 31, 2018 | 22
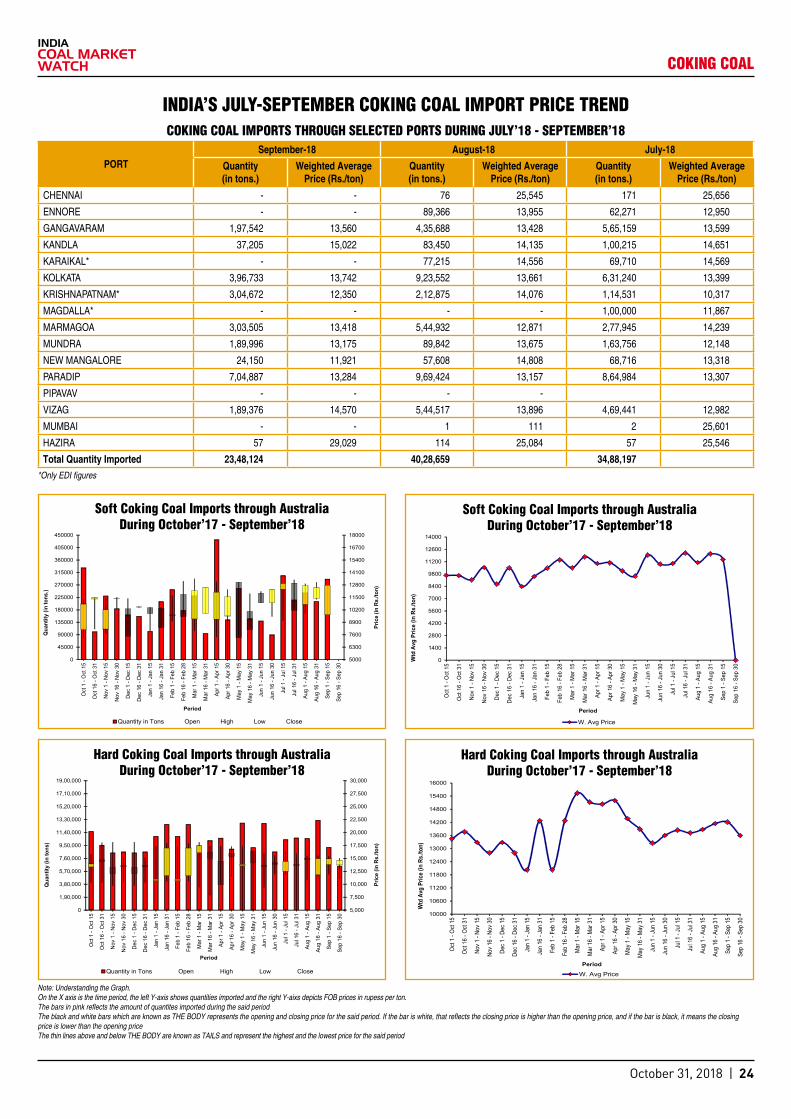
Chinese, Indian demand boost Oct coking coal offers
The seaborne coking coal market rose in October 2018 on firm demand from China and India and tighter supply,
according to market sources.
According to information available with ICMW, the premium variety was quoted higher at $221 per ton FOB Australia on October 30, 2018 as against $199 per ton FOB Australia on September 28, 2018. Peak Down prices were quoted at $222 per ton FOB Australia on October 30, 2018 as compared to $200 per ton FOB Australia on September 28, 2018.
Chinese coking coal futures climbed as Beijing’s flexible approach to industrial production curbs helped fuel demand in the country. Also, supply restrictions supported the steel-making raw material. China has opted not to put a blanket curtailment on production by industrial plants this winter, including steel mills. Instead, it is allowing provinces to set their own output restrictions based on respective emission levels. It’s the second straight winter that China is implementing the curbs as part of its battle against pollution.
This implies that overall demand for coking coal will be more than expected. Such market expectations are providing some upside for prices.
On the supply front, coking coal supply in China is also tighter as winter approaches. This is so because, the transport of thermal coal is being given priority over coking coal, sources said.
There are also seen supply restrictions from Australia and Mozambique. The supply of metallurgical coal in the global seaborne market is quite tight at the moment, they said.
Australian coal miner Peabody Energy has issued force
majeure notices to its customers after it reported a fire in parts of its North Goonyella mine in Queensland last month. Force majeure means a buyer or seller cannot fulfill their obligations because of outside forces.
Chinese rebar prices remained firm, aided by ongoing production curbs in China’s top steel-making city of Tangshan.
Meanwhile, during September 2018, crude steel production was 8.542 mt, a fall of 3.4 percent over the production figure of August, which was at 8.840 mt.
In September 2018, hot metal production was at 5.744 mt, a fall of 3.8 percent over the August 2018 production of 5.969 mt.
This indicates a marginal fall in requirement for coking coal from Indian steel mills in September.
Coking coal imports into India during April-September, 2018 is estimated at around 26.84 mt, marginally up from 23.98 mt in same period last year, according to Coal Insights estimates.
Meanwhile, the 12 major Indian ports handled a total of 26.45 mt of coking coal during April-September, 2018, up 9.69 percent compared to 24.26 mt during the same period last year.
Among the major ports, Kolkata had the distinction of handling the highest volume of coking coal, at around 8.54 mt, during April-September, 2018. The port had handled 5.82 mt during April-September, 2017.
Imports of coking coal into the country are seen rising to 58 million tons (mt) by 2023, appreciating 23 percent over the 47 mt recorded in 2017-18.
Imports of the key steel-making ingredient will be fuelled by growth in production of steel. Also, tightness in domestic supplies is likely to be another factor.
COKING COAL
Coal India Ltd (CIL) has achieved total coking coal production of around 15.46 million tons (mt) during April-September,
2018-19, compared to around 14.40 mt achieved during the same period last year, according to provisional data available with ICMW.
Production during the month of September 2018 stood at around 2.864 mt, higher than around 2.66 mt achieved in the same month last year. The September production was also higher than 2.57 mt reported for August 2018, the data show.
Earlier, CIL achieved a 4.5 percent growth in coking coal production to 7.54 mt in the first quarter (April-June) of 2018-19 over the same period last year.
The increase in production by CIL is attributed to the opening of new patches, mainly in areas under Bharat Coking Coal Ltd (BCCL) this year, company sources said.
Coking coal production by CIL had suffered a significant drop to 33.28 mt in 2017-18 from 54.65 mt in 2016-17. Coking coal production was about 5.9 percent of its total production during the year (2017-18).
With the completion of new washery projects of BCCL, the company expects to see a growth in the volume of washed coking coal this year, the sources said.
CIL’s coking coal production at 15.5 mt in H1
There was strong demand (94.57 percent) for washery grades (W2, W4 and WG4) coking coal offered by CIL subsidiaries
BCCL, and CCL on the e-auction platform of coaljunction in September 2018 as out of the entire quantity of 140,160 tons offered, 132,550 tons got allotted at a weighted average price of Rs 4,748, according to data available with ICMW.
There was poor demand (56 percent) for washery grades offered by CIL subsidiaries BCCL, and CCL on the e-auction platform of coaljunction in August 2018 as the entire quantity of 155,500 tons offered, 58,200 tons got allotted at a weighted average price of Rs 4,788.
Strong demand for coking coal in Sept spot e-auction

October 31, 2018 | 23
R² = 0.0695
70.00
97.00
124.00
151.00
178.00
205.00
232.00
259.00
286.00
313.00
340.00
1-M
ar-1
2
30-M
ay-1
2
28-A
ug-1
2
26-N
ov-1
2
24-F
eb-1
3
25-M
ay-1
3
23-A
ug-1
3
21-N
ov-1
3
19-F
eb-1
4
20-M
ay-1
4
18-A
ug-1
4
16-N
ov-1
4
14-F
eb-1
5
15-M
ay-1
5
13-A
ug-1
5
11-N
ov-1
5
9-Fe
b-16
9-M
ay-1
6
7-Au
g-16
5-N
ov-1
6
3-Fe
b-17
4-M
ay-1
7
2-Au
g-17
31-O
ct-1
7
29-Ja
n-18
29-A
pr-1
8
28-Ju
l-18
26-O
ct-1
8
24-Ja
n-19
Peaks Down (CSR 74%, VM-20.7%, Ash-9.7%, S-0.6%, P-0.03%, TM-9.5%) Log. (Peaks Down (CSR 74%, VM-20.7%, Ash-9.7%, S-0.6%, P-0.03%, TM-9.5%))
Rail strike in NSW
BMA strike
Q3 contract signed at $145
ICMW estimate
Q4 contract signedat $152
Q1 contract signed at $143
Low price $72.80 (30/11/2015)
Q2 contract sighed at $120
Q2 contract sighed at $84
High price $311 (28/11/2016)
Q4 contract sighed at $119
China devalues yuan
branded Coking Coal
RECENt PRICE tREND & fORECASt fOR NOVEMbER 2018
R² = 0.0668
65.00
90.50
116.00
141.50
167.00
192.50
218.00
243.50
269.00
294.50
320.00
1-M
ar-1
2
30-M
ay-1
2
28-A
ug-1
2
26-N
ov-1
2
24-F
eb-1
3
25-M
ay-1
3
23-A
ug-1
3
21-N
ov-1
3
19-F
eb-1
4
20-M
ay-1
4
18-A
ug-1
4
16-N
ov-1
4
14-F
eb-1
5
15-M
ay-1
5
13-A
ug-1
5
11-N
ov-1
5
9-Fe
b-16
9-M
ay-1
6
7-Au
g-16
5-No
v-16
3-Fe
b-17
4-M
ay-1
7
2-Au
g-17
31-O
ct-1
7
29-Ja
n-18
29-A
pr-1
8
28-Ju
l-18
26-O
ct-1
8
24-Ja
n-19
Prem Low Vol (CSR-71%, VM-21.5%, Ash-9.3%, S-0.50%, P-0.045%, TM-9.7%) Log. (Prem Low Vol (CSR-71%, VM-21.5%, Ash-9.3%, S-0.50%, P-0.045%, TM-9.7%))
BMA strike
ICMW estimate
Q4 contract signed
Q1 contract signed
Low price $72.00 (30/11/15)
Q2 contract signed
High price $308(25/11/2016)
Q2 contract signed Q4 contract
signed
Premium Low Vol Coking Coal
COKING COAL
October 31, 2018 | 24
INDIA’S JULY-SEPtEMbER COKING COAL IMPORt PRICE tRENDCOKING COAL IMPORtS tHROUGH SELECtED PORtS DURING JULY’18 - SEPtEMbER’18
PORTSeptember-18 August-18 July-18
Quantity(in tons.)
Weighted Average Price (Rs./ton)
Quantity (in tons.)
Weighted Average Price (Rs./ton)
Quantity (in tons.)
Weighted Average Price (Rs./ton)
CHENNAI - - 76 25,545 171 25,656
ENNORE - - 89,366 13,955 62,271 12,950
GANGAVARAM 1,97,542 13,560 4,35,688 13,428 5,65,159 13,599
KANDLA 37,205 15,022 83,450 14,135 1,00,215 14,651
KARAIKAL* - - 77,215 14,556 69,710 14,569
KOLKATA 3,96,733 13,742 9,23,552 13,661 6,31,240 13,399
KRISHNAPATNAM* 3,04,672 12,350 2,12,875 14,076 1,14,531 10,317
MAGDALLA* - - - - 1,00,000 11,867
MARMAGOA 3,03,505 13,418 5,44,932 12,871 2,77,945 14,239
MUNDRA 1,89,996 13,175 89,842 13,675 1,63,756 12,148
NEW MANGALORE 24,150 11,921 57,608 14,808 68,716 13,318
PARADIP 7,04,887 13,284 9,69,424 13,157 8,64,984 13,307
PIPAVAV - - - -
VIZAG 1,89,376 14,570 5,44,517 13,896 4,69,441 12,982
MUMBAI - - 1 111 2 25,601
HAZIRA 57 29,029 114 25,084 57 25,546
Total Quantity Imported 23,48,124 40,28,659 34,88,197 *Only EDI figures
5,000
7,500
10,000
12,500
15,000
17,500
20,000
22,500
25,000
27,500
30,000
0
1,90,000
3,80,000
5,70,000
7,60,000
9,50,000
11,40,000
13,30,000
15,20,000
17,10,000
19,00,000
Oct
1 -
Oct
15
Oct
16
- Oct
31
Nov
1 -
Nov
15
Nov
16
- Nov
30
Dec
1 -
Dec
15
Dec
16
- Dec
31
Jan
1 - J
an 1
5
Jan
16 -
Jan
31
Feb
1 - F
eb 1
5
Feb
16 -
Feb
28
Mar
1 -
Mar
15
Mar
16
- Mar
31
Apr 1
- Ap
r 15
Apr 1
6 - A
pr 3
0
May
1 -
May
15
May
16
- May
31
Jun
1 - J
un 1
5
Jun
16 -
Jun
30
Jul 1
- Ju
l 15
Jul 1
6 - J
ul 3
1
Aug
1 - A
ug 1
5
Aug
16 -
Aug
31
Sep
1 - S
ep 1
5
Sep
16 -
Sep
30
Pric
e (in
Rs.
/ton)
Qua
ntity
(in
tons
)
Period
Quantity in Tons Open High Low Close
Hard Coking Coal Imports through Australia During October’17 - September’18
10000
10600
11200
11800
12400
13000
13600
14200
14800
15400
16000
Oct 1
- O
ct 15
Oct 1
6 - O
ct 31
Nov 1
- No
v 15
Nov 1
6 - N
ov 3
0
Dec 1
- De
c 15
Dec 1
6 - D
ec 3
1
Jan
1 - J
an 1
5
Jan
16 -
Jan
31
Feb
1 - F
eb 1
5
Feb
16 -
Feb
28
Mar
1 -
Mar
15
Mar
16
- Mar
31
Apr 1
- Ap
r 15
Apr 1
6 - A
pr 3
0
May
1 -
May
15
May
16
- May
31
Jun
1 - J
un 1
5
Jun
16 -
Jun
30
Jul 1
- Ju
l 15
Jul 1
6 - J
ul 31
Aug
1 - A
ug 1
5
Aug
16 -
Aug
31
Sep
1 - S
ep 1
5
Sep
16 -
Sep
30
Wtd
Avg
Pric
e (in
Rs.
/ton)
Period
W. Avg Price
Hard Coking Coal Imports through Australia During October’17 - September’18
0
1400
2800
4200
5600
7000
8400
9800
11200
12600
14000
Oct
1 -
Oct
15
Oct
16
- Oct
31
Nov
1 -
Nov
15
Nov
16
- Nov
30
Dec
1 -
Dec
15
Dec
16
- Dec
31
Jan
1 - J
an 1
5
Jan
16 -
Jan
31
Feb
1 - F
eb 1
5
Feb
16 -
Feb
28
Mar
1 -
Mar
15
Mar
16
- Mar
31
Apr 1
- Ap
r 15
Apr 1
6 - A
pr 3
0
May
1 -
May
15
May
16
- May
31
Jun
1 - J
un 1
5
Jun
16 -
Jun
30
Jul 1
- Ju
l 15
Jul 1
6 - J
ul 3
1
Aug
1 - A
ug 1
5
Aug
16 -
Aug
31
Sep
1 - S
ep 1
5
Sep
16 -
Sep
30
Wtd
Avg
Pric
e (in
Rs.
/ton)
Period
W. Avg Price
Soft Coking Coal Imports through Australia During October’17 - September’18
5000
6300
7600
8900
10200
11500
12800
14100
15400
16700
18000
0
45000
90000
135000
180000
225000
270000
315000
360000
405000
450000
Oct
1 -
Oct
15
Oct
16
- Oct
31
Nov
1 -
Nov
15
Nov
16
- Nov
30
Dec
1 -
Dec
15
Dec
16
- Dec
31
Jan
1 - J
an 1
5
Jan
16 -
Jan
31
Feb
1 - F
eb 1
5
Feb
16 -
Feb
28
Mar
1 -
Mar
15
Mar
16
- Mar
31
Apr 1
- Ap
r 15
Apr 1
6 - A
pr 3
0
May
1 -
May
15
May
16
- May
31
Jun
1 - J
un 1
5
Jun
16 -
Jun
30
Jul 1
- Ju
l 15
Jul 1
6 - J
ul 3
1
Aug
1 - A
ug 1
5
Aug
16 -
Aug
31
Sep
1 - S
ep 1
5
Sep
16 -
Sep
30
Pric
e (in
Rs.
/ton)
Qua
ntity
(in
tons
.)
Period
Quantity in Tons Open High Low Close
Soft Coking Coal Imports through Australia During October’17 - September’18
Note: Understanding the Graph. On the X axis is the time period, the left Y-axis shows quantities imported and the right Y-aixs depicts FOB prices in rupess per ton. The bars in pink reflects the amount of quantites imported during the said periodThe black and white bars which are known as THE BODY represents the opening and closing price for the said period. If the bar is white, that reflects the closing price is higher than the opening price, and if the bar is black, it means the closing price is lower than the opening priceThe thin lines above and below THE BODY are known as TAILS and represent the highest and the lowest price for the said period
COKING COAL
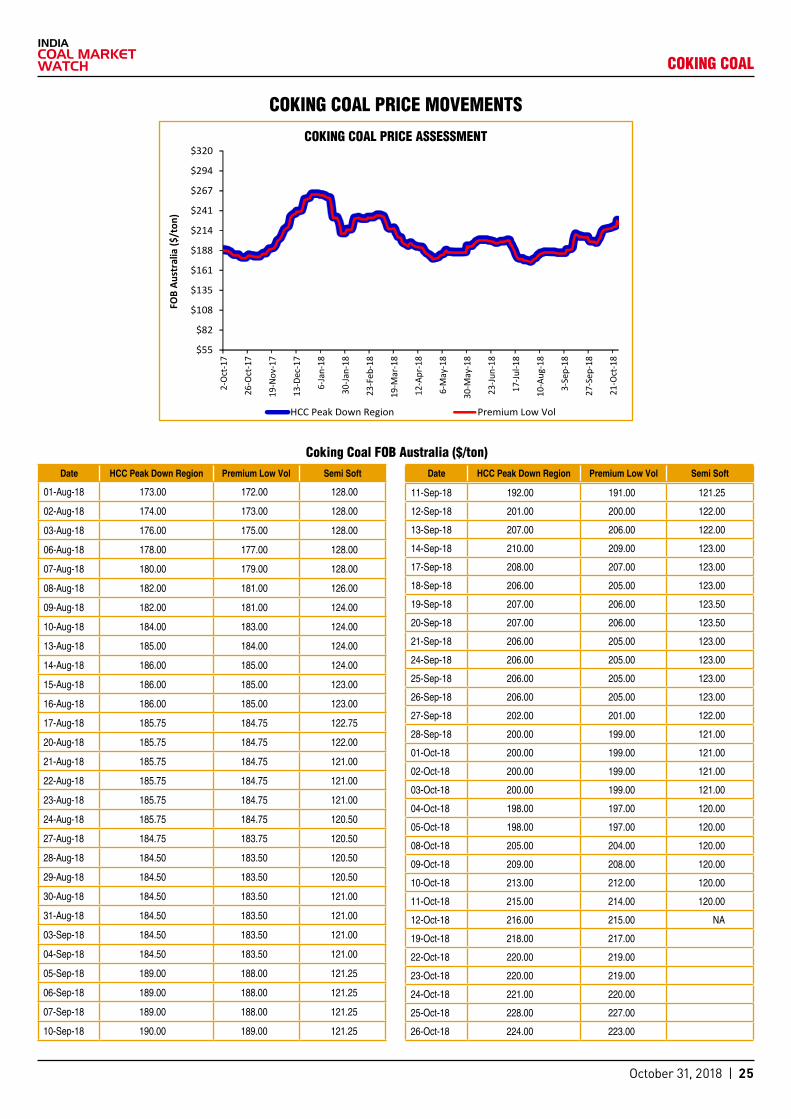
October 31, 2018 | 25
$55
$82
$108
$135
$161
$188
$214
$241
$267
$294
$320
2-O
ct-1
7
26-O
ct-1
7
19-N
ov-1
7
13-D
ec-1
7
6-Ja
n-18
30-Ja
n-18
23-F
eb-1
8
19-M
ar-1
8
12-A
pr-1
8
6-M
ay-1
8
30-M
ay-1
8
23-Ju
n-18
17-Ju
l-18
10-A
ug-1
8
3-Se
p-18
27-S
ep-1
8
21-O
ct-1
8
FOB
Aust
ralia
($/t
on)
HCC Peak Down Region Premium Low Vol
COKING COAL PRICE ASSESSMENt
COKING COAL PRICE MOVEMENtS
Coking Coal fOb Australia ($/ton)Date HCC Peak Down Region Premium Low Vol Semi Soft
01-Aug-18 173.00 172.00 128.00
02-Aug-18 174.00 173.00 128.00
03-Aug-18 176.00 175.00 128.00
06-Aug-18 178.00 177.00 128.00
07-Aug-18 180.00 179.00 128.00
08-Aug-18 182.00 181.00 126.00
09-Aug-18 182.00 181.00 124.00
10-Aug-18 184.00 183.00 124.00
13-Aug-18 185.00 184.00 124.00
14-Aug-18 186.00 185.00 124.00
15-Aug-18 186.00 185.00 123.00
16-Aug-18 186.00 185.00 123.00
17-Aug-18 185.75 184.75 122.75
20-Aug-18 185.75 184.75 122.00
21-Aug-18 185.75 184.75 121.00
22-Aug-18 185.75 184.75 121.00
23-Aug-18 185.75 184.75 121.00
24-Aug-18 185.75 184.75 120.50
27-Aug-18 184.75 183.75 120.50
28-Aug-18 184.50 183.50 120.50
29-Aug-18 184.50 183.50 120.50
30-Aug-18 184.50 183.50 121.00
31-Aug-18 184.50 183.50 121.00
03-Sep-18 184.50 183.50 121.00
04-Sep-18 184.50 183.50 121.00
05-Sep-18 189.00 188.00 121.25
06-Sep-18 189.00 188.00 121.25
07-Sep-18 189.00 188.00 121.25
10-Sep-18 190.00 189.00 121.25
11-Sep-18 192.00 191.00 121.25
12-Sep-18 201.00 200.00 122.00
13-Sep-18 207.00 206.00 122.00
14-Sep-18 210.00 209.00 123.00
17-Sep-18 208.00 207.00 123.00
18-Sep-18 206.00 205.00 123.00
19-Sep-18 207.00 206.00 123.50
20-Sep-18 207.00 206.00 123.50
21-Sep-18 206.00 205.00 123.00
24-Sep-18 206.00 205.00 123.00
25-Sep-18 206.00 205.00 123.00
26-Sep-18 206.00 205.00 123.00
27-Sep-18 202.00 201.00 122.00
28-Sep-18 200.00 199.00 121.00
01-Oct-18 200.00 199.00 121.00
02-Oct-18 200.00 199.00 121.00
03-Oct-18 200.00 199.00 121.00
04-Oct-18 198.00 197.00 120.00
05-Oct-18 198.00 197.00 120.00
08-Oct-18 205.00 204.00 120.00
09-Oct-18 209.00 208.00 120.00
10-Oct-18 213.00 212.00 120.00
11-Oct-18 215.00 214.00 120.00
12-Oct-18 216.00 215.00 NA
19-Oct-18 218.00 217.00
22-Oct-18 220.00 219.00
23-Oct-18 220.00 219.00
24-Oct-18 221.00 220.00
25-Oct-18 228.00 227.00
26-Oct-18 224.00 223.00
Date HCC Peak Down Region Premium Low Vol Semi Soft
COKING COAL

October 31, 2018 | 26
COKING COAL
Indian steel to face challenges going forward
India’s steel industry would face several challenges as the country is poised to become the next driver in regional
economic growth, speakers said at the Indian Steel Association’s inaugural Steel Conclave at New Delhi on October 25, 2018.
Challenges like the high cost of raw materials, including coking coal and thermal coal, transportation networks and infrastructure, and the quality of steel, were brought up by officials of major Indian steel mills.
Anil Chaudhary, Chairman of Steel Authority of India Limited, said that India aims to produce 300 million tons of crude steel capacity by 2030-2031, up 130 percent from the current capacity of around 135 million tons. This was echoed by Naveen Jindal, Chairman of Jindal Steel and Power Limited, who added that India’s per capita steel consumption is merely at 68 kg compared to world’s average of 208 kg.
As India look to increase crude steel production capacity and per capital steel consumption, this would mean greater demand for coking coal. However, India does not have a reserve of coking coal and hence will be depending on imports “Not only is coal expensive, supply is also falling short and we need to work out some alternatives” Chaudhary said.
India would finish 2018 by being the world’s number two steel producer,” Chaudhary Birender Singh, Union Minister of Steel, Government of India said. India surpassed Japan to become the world’s second major steel producer in the first eight months of this year.
He also stressed on production of quality and value added steel for growth of the sector.
India’s coking coal demand is estimated to hit 60-62 mt by 2019. This would mark an increase in metallurgical demand from 2017 levels of 55 mt.
India’s coking coal imports down 22% in Sept
Coking coal imports by India decreased by 22 percent to 3,154,056 tons in September 2018, compared to 4,044,467
tons imported in September 2017, according to data collected from 31 ports.
However, on a month-on-month basis, coking coal imports during September 2018 increased by 34.73 percent as compared to 4,832,729 tons in August 2018.
Of the total imports, the highest volume was recorded at Dhamra Port (805,932 tons), followed by Paradip Port (704,887 tons) and Kolkata/Haldia Port (396,733 tons).
A country-wise break-up shows that the highest volume was sourced from the Australia at 1,854,564 tons, followed by Mozambique at 174,676 tons and Canada at 167,775 tons.
Earlier, coking coal import was up by 12.3 percent to 47,220,074 tons in 2017-18, compared to 42,040,414 tons imported in 2016-17.
India’s PCI imports decreased 14% in Sept
PCI coal imports by India decreased 14 percent to 370,179 tons in September 2018, compared to 430,971 tons
imported in September 2017, according to data collected from 31 ports.
Similarly, on a month-on-month basis, PCI coal imports during September 2018 decreased by 35.4 percent compared to 573,060 tons in August 2018.
Of the total imports in September 2018, the highest volume was recorded at Magdalla Port (88,000 tons), followed by Krishnapatanam Port (87,558 tons) and Kolkata/Haldia Port (86,454 tons).
A country-wise break-up shows that the highest volume was sourced from Australia at (369,773 tons), followed by Columbia at (405 tons).
Earlier, PCI coal imports by India increased by 22.8 percent to 5,913,275 tons in 2017-18, compared to 4,813,054 tons imported in 2016-17.
Moderate demand for coking coal in Sept on MSTC’s spot e-auction
There was moderate demand (92.5 percent) for washery grade (W2, W3 & W4) coking coal offered by CIL subsidiary
BCCL for allotment on spot e-auction through MSTC in September 2018 as out of the entire quantity of 74,000 tons offered, 68,450 tons got allotted at a weighted average price of Rs 5,231 per ton, as per data available with ICMW.
There was moderate demand (53 percent) for washery grade coking coal offered by CIL subsidiaries CCL, ECL and BCCL for allotment on spot e-auction through MSTC in August 2018 as out of the entire quantity of 175,550 tons offered, 92,650 tons got allotted at a weighted average price of Rs 4,058 per ton.
Avg demand for SCCL’s coking coal in Sept spot e-auction
There was average demand (50.4 percent) for washery grade coal offered by SCCL on the e-auction platform of
coaljunction in September 2018 as out of 176,000 tons offered, 88,832 tons got allotted at a weighted average price of Rs 189, according to data available with ICMW.

October 31, 2018 | 27
Port wise coking coal import, m-o-m & y-o-y comparison (in mt)
Port wise coking coal import during October-September’17 & ’18 (in mt)
PORT Sep'17 Aug'18 Sep'18
ENNORE - 0.089 -
GANGAVARAM 0.278 0.436 0.198
KANDLA 0.047 0.083 0.037
KOLKATA / HALDIA 0.642 0.924 0.397
GOA / MARMAGOA 0.536 0.545 0.304
MUNDRA 0.059 0.090 0.190
NEW MANGALORE - 0.058 0.024
PARADIP 1.146 0.969 0.705
VIZAG 0.491 0.545 0.189
MAGDALLA 0.054 - -
KRISHNAPATNAM 0.097 0.213 0.305
KARAIKAL - 0.077 -
DHAMRA 0.695 0.804 0.806
PORT Oct-Sep'17 Oct-Sep'18 % Growth (+/-)
CHENNAI 0.001 0.001 -11.1%
ENNORE 0.022 0.655 NA
GANGAVARAM 4.594 5.155 12.2%
KANDLA 0.458 0.696 51.9%
KOLKATA / HALDIA 5.392 7.434 37.9%
GOA / MARMAGOA 6.740 4.420 -34.4%
MUMBAI 0.000 0.000 -68.8%
MUNDRA 0.960 1.288 34.3%
NEW MANGALORE 0.036 0.518 NA
PARADIP 9.496 9.954 4.8%
VIZAG 4.719 5.658 19.9%
PIPAVAV 0.010 0.041 NA
MAGDALLA 0.862 0.472 -45.2%
KRISHNAPATNAM 1.925 2.982 54.9%
KARAIKAL 0.394 0.531 34.9%
KAKINADA - 0.060 #DIV/0!
JAIGARH 0.058 - NA
HAZIRA 0.001 0.001 93.5%
DHAMRA 8.730 8.606 -1.4%
COKING COAL

October 31, 2018 | 28
Port wise PCI coal import, m-o-m & y-o-y comparison (in mt)
Port wise PCI coal import during October-September’17 & ’18 (in mt)
PORT Sep'17 Aug'18 Sep'18
ENNORE - 0.088 -
GANGAVARAM - 0.080 -
KOLKATA / HALDIA 0.092 0.083 0.086
GOA / MARMAGOA 0.110 0.149 -
MUNDRA 0.025 - -
PARADIP 0.194 0.059 0.033
VIZAG - - 0.075
MAGDALLA 0.010 0.032 0.088
KRISHNAPATNAM - 0.020 0.088
KARAIKAL - 0.063 -
PORT Oct-Sep'17 Oct-Sep'18 % Growth (+/-)
CHENNAI 0.000 0.001 NA
ENNORE - 0.184 #DIV/0!
GANGAVARAM 0.206 0.884 NA
KOLKATA / HALDIA 0.764 1.199 56.9%
GOA / MARMAGOA 0.742 0.622 -16.2%
MUMBAI 0.000 0.000 97.8%
MUNDRA 0.025 0.015 -40.0%
NEW MANGALORE 0.044 0.064 44.0%
PARADIP 1.787 2.118 18.6%
VIZAG 0.412 0.567 37.8%
MAGDALLA 0.010 0.553 NA
DAHEJ - - #DIV/0!
KRISHNAPATNAM 0.395 0.826 NA
KARAIKAL 0.104 0.266 NA
KAKINADA - 0.119 #DIV/0!
COKING COAL

October 31, 2018 | 29
Met coke import offers firm in October
Metallurgical coke import offers remained firm in October 2018, taking a cue from rising coking coal prices
internationally, according to data available with ICMW.
Imported met coke prices rose to $394 per ton CFR India on October 30, 2018 as against $383 per ton on September 28, 2018.
The volatility in met coke offers followed sharp movements in met coal prices, which showed an increase of around $20 per ton during the month under review.
According to market sources, met coke prices are expected to remain strong during the remaining months of the year.
India’s met coke imports down 66% in Sept
Metallurgical coke imports by India decreased by 66 percent to 212,288 tons in September 2018, compared to 625,428
tons imported in September 2017, according to data collected from 31 ports.
Similarly, on a month-on-month basis, met coke imports in September 2018 was down by 67.10 percent, compared to 647,053 tons in August 2018, the data show.
Of the total imports during September 2018, the highest volume was recorded at Krishnapatnam Port (94,653 tons), followed by Kandla Port (66,853 tons) and Vizag Port (50,000 tons).
Earlier, met coke imports decreased marginally by 1.12 percent to 3,990,388 tons in 2017-18, compared to 4,035,950 tons imported in 2016-17.Domestic met coke prices
unchanged in October
Domestic metallurgical coke prices remained unmoved in October 2018 tracking the volatile trends in prices of coking
coal, its main input material, industry sources said.
According to sources, domestic met coke prices stood around Rs 28,000 per ton (ex-plant) in the west coast as on October 31, 2018 as against same prices in September.
In the east coast, prices stood at Rs 26,500 per ton (ex-plant) as on October 31, 2018 as against same prices in September.
Seaborne coking coal prices touched new highs to settle at $220 per ton fob Australia on low procurement from China. However, demand from India remained stable on sustained rise in steel production.
In the international met coke market, prices remained firm tracking the rise in prices of coking coal.
Currently, imported met coke offers are hovering around $394 per ton CFR India on October 31, 2018 as against $391 per ton CFR India at September end.
MEt COKE

October 31, 2018 | 30
R² = 0.7731
110
141
172
203
234
265
296
327
358
389
420
1-M
ar-1
2
30-M
ay-1
2
28-A
ug-1
2
26-N
ov-1
2
24-F
eb-1
3
25-M
ay-1
3
23-A
ug-1
3
21-N
ov-1
3
19-F
eb-1
4
20-M
ay-1
4
18-A
ug-1
4
16-N
ov-1
4
14-F
eb-1
5
15-M
ay-1
5
13-A
ug-1
5
11-N
ov-1
5
9-Fe
b-16
9-M
ay-1
6
7-Au
g-16
5-N
ov-1
6
3-Fe
b-17
4-M
ay-1
7
2-Au
g-17
31-O
ct-1
7
29-J
an-1
8
29-A
pr-1
8
28-J
ul-1
8
26-O
ct-1
8
24-J
an-1
9
Met Coke Poly. (Met Coke)
ICMW estimate
Low price $113.00(24/2/2016)
High price $398.00 (4/1/18)
Met Coke
RECENt PRICE tREND & fORECASt fOR NOVEMbER 2018
R² = 0.0203
55.00
68.50
82.00
95.50
109.00
122.50
136.00
149.50
163.00
176.50
190.00
1-M
ar-1
2
30-M
ay-1
2
28-A
ug-1
2
26-N
ov-1
2
24-F
eb-1
3
25-M
ay-1
3
23-A
ug-1
3
21-N
ov-1
3
19-F
eb-1
4
20-M
ay-1
4
18-A
ug-1
4
16-N
ov-1
4
14-F
eb-1
5
15-M
ay-1
5
13-A
ug-1
5
11-N
ov-1
5
9-Fe
b-16
9-M
ay-1
6
7-Au
g-16
5-No
v-16
3-Fe
b-17
4-M
ay-1
7
2-Au
g-17
31-O
ct-1
7
29-Ja
n-18
29-A
pr-1
8
28-Ju
l-18
26-O
ct-1
8
24-Ja
n-19
Semi Soft Log. (Semi Soft)
ICMW estimate
High price $178 (10/11/2016)
Low price $60.50 (07/10/15)
Semi Soft Coking Coal
MEt COKE

October 31, 2018 | 31
Port wise met coke import, m-o-m & y-o-y comparison (in mt)
Port wise met coke import during October-September’17 & ‘18 (in mt)
PORT Sep'17 Aug'18 Sep'18
CHENNAI 0.003 0.002 0.000
ENNORE - 0.050 -
GANGAVARAM - - 0.066
KANDLA 0.030 - -
KOLKATA / HALDIA 0.018 0.066 0.019
GOA / MARMAGOA - 0.053 -
NEW MANGALORE 0.049 - -
PARADIP 0.024 0.140 0.050
VIZAG 0.013 0.036 0.050
MAGDALLA 0.078 0.066 0.117
KRISHNAPATNAM 0.007 0.077 0.058
PORT Oct-Sep'17 Oct-Sep'18 % Growth (+/-)
CHENNAI 0.006 0.013 NA
COCHIN 0.000 0.000 -33.5%
ENNORE - 0.060 #DIV/0!
GANGAVARAM - 0.159 #DIV/0!
KANDLA 0.075 0.038 -49.7%
KOLKATA / HALDIA 0.339 0.550 62.0%
GOA / MARMAGOA 0.343 0.232 -32.5%
MUMBAI 0.000 0.000 13.4%
MUNDRA 0.000 0.001 NA
NEW MANGALORE 0.341 0.415 21.8%
PARADIP 0.513 0.669 30.5%
VIZAG 0.328 0.488 48.9%
TUTICORIN / VOC 0.006 0.003 -53.7%
PIPAVAV 0.047 0.056 18.6%
MAGDALLA 0.965 1.077 11.6%
KRISHNAPATNAM 0.363 0.694 90.9%
MEt COKE
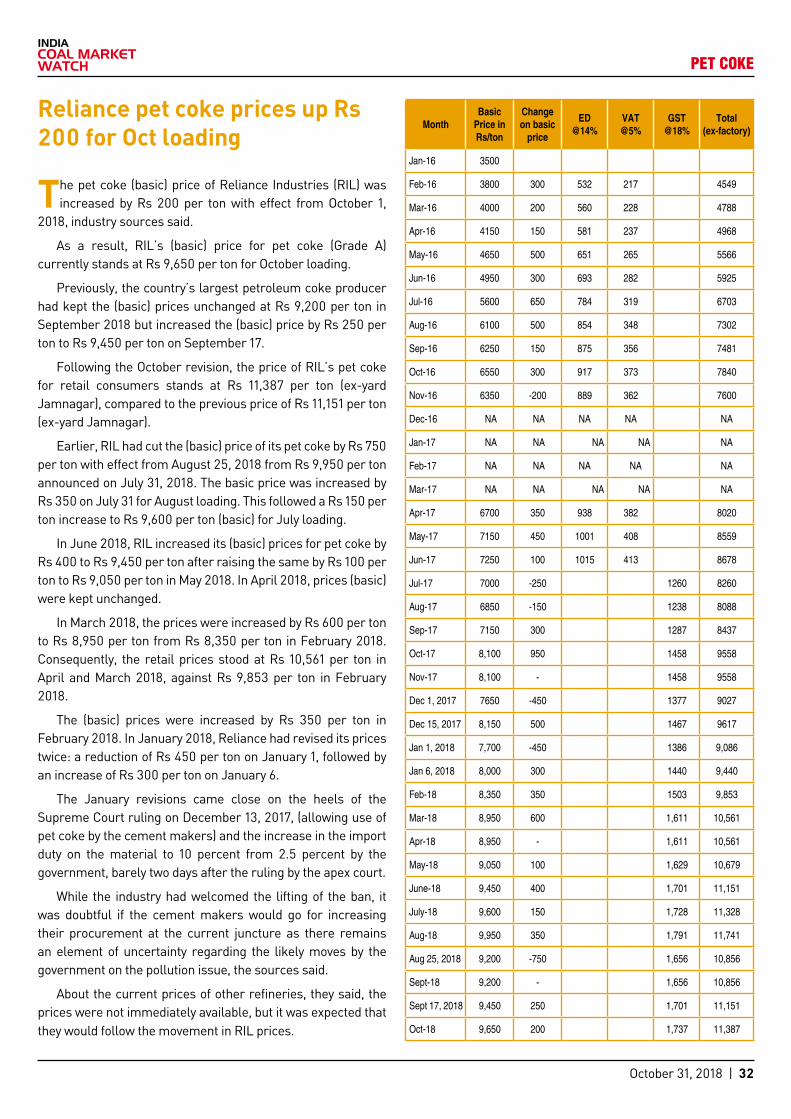
October 31, 2018 | 32
Reliance pet coke prices up Rs 200 for Oct loading
The pet coke (basic) price of Reliance Industries (RIL) was increased by Rs 200 per ton with effect from October 1,
2018, industry sources said.
As a result, RIL’s (basic) price for pet coke (Grade A) currently stands at Rs 9,650 per ton for October loading.
Previously, the country’s largest petroleum coke producer had kept the (basic) prices unchanged at Rs 9,200 per ton in September 2018 but increased the (basic) price by Rs 250 per ton to Rs 9,450 per ton on September 17.
Following the October revision, the price of RIL’s pet coke for retail consumers stands at Rs 11,387 per ton (ex-yard Jamnagar), compared to the previous price of Rs 11,151 per ton (ex-yard Jamnagar).
Earlier, RIL had cut the (basic) price of its pet coke by Rs 750 per ton with effect from August 25, 2018 from Rs 9,950 per ton announced on July 31, 2018. The basic price was increased by Rs 350 on July 31 for August loading. This followed a Rs 150 per ton increase to Rs 9,600 per ton (basic) for July loading.
In June 2018, RIL increased its (basic) prices for pet coke by Rs 400 to Rs 9,450 per ton after raising the same by Rs 100 per ton to Rs 9,050 per ton in May 2018. In April 2018, prices (basic) were kept unchanged.
In March 2018, the prices were increased by Rs 600 per ton to Rs 8,950 per ton from Rs 8,350 per ton in February 2018. Consequently, the retail prices stood at Rs 10,561 per ton in April and March 2018, against Rs 9,853 per ton in February 2018.
The (basic) prices were increased by Rs 350 per ton in February 2018. In January 2018, Reliance had revised its prices twice: a reduction of Rs 450 per ton on January 1, followed by an increase of Rs 300 per ton on January 6.
The January revisions came close on the heels of the Supreme Court ruling on December 13, 2017, (allowing use of pet coke by the cement makers) and the increase in the import duty on the material to 10 percent from 2.5 percent by the government, barely two days after the ruling by the apex court.
While the industry had welcomed the lifting of the ban, it was doubtful if the cement makers would go for increasing their procurement at the current juncture as there remains an element of uncertainty regarding the likely moves by the government on the pollution issue, the sources said.
About the current prices of other refineries, they said, the prices were not immediately available, but it was expected that they would follow the movement in RIL prices.
Month Basic
Price in Rs/ton
Change on basic
price
ED @14%
VAT @5%
GST @18%
Total (ex-factory)
Jan-16 3500
Feb-16 3800 300 532 217 4549
Mar-16 4000 200 560 228 4788
Apr-16 4150 150 581 237 4968
May-16 4650 500 651 265 5566
Jun-16 4950 300 693 282 5925
Jul-16 5600 650 784 319 6703
Aug-16 6100 500 854 348 7302
Sep-16 6250 150 875 356 7481
Oct-16 6550 300 917 373 7840
Nov-16 6350 -200 889 362 7600
Dec-16 NA NA NA NA NA
Jan-17 NA NA NA NA NA
Feb-17 NA NA NA NA NA
Mar-17 NA NA NA NA NA
Apr-17 6700 350 938 382 8020
May-17 7150 450 1001 408 8559
Jun-17 7250 100 1015 413 8678
Jul-17 7000 -250 1260 8260
Aug-17 6850 -150 1238 8088
Sep-17 7150 300 1287 8437
Oct-17 8,100 950 1458 9558
Nov-17 8,100 - 1458 9558
Dec 1, 2017 7650 -450 1377 9027
Dec 15, 2017 8,150 500 1467 9617
Jan 1, 2018 7,700 -450 1386 9,086
Jan 6, 2018 8,000 300 1440 9,440
Feb-18 8,350 350 1503 9,853
Mar-18 8,950 600 1,611 10,561
Apr-18 8,950 - 1,611 10,561
May-18 9,050 100 1,629 10,679
June-18 9,450 400 1,701 11,151
July-18 9,600 150 1,728 11,328
Aug-18 9,950 350 1,791 11,741
Aug 25, 2018 9,200 -750 1,656 10,856
Sept-18 9,200 - 1,656 10,856
Sept 17, 2018 9,450 250 1,701 11,151
Oct-18 9,650 200 1,737 11,387
PEt COKE

October 31, 2018 | 33
Nalco floats tender to procure calcined pet coke
National Aluminium Company Limited (Nalco) has floated a global contract to procure calcined petroleum coke on
‘tender cum auction basis’ for its smelter plant in Angul, Odisha.
The contract shall be valid for a period of 90 days from the date of award of order, which was September 21, 2018. The bid submission closing date is October 15, 2018 before 3.30 PM.
India’s pet coke imports up 62% in Sept
Pet coke imports by India increased by 62.32 percent to 360,011 tons in September 2018, compared to 221,784 tons
imported in September 2017, according to data collected from 31 ports.
However, on a month-on-month basis, pet coke imports in September 2018 was down by 44.36 percent as compared to 647,053 tons in August 2018, the data show.
Of the total imports during September 2018, the highest volume was recorded at Magdalla Port (117,026 tons), followed by Gangavaram Port (65,998 tons) and Krishnapatnam Port (57,636 tons).
Earlier, pet coke imports decreased by 23 percent to 10,981,422 tons in 2017-18, compared to 14,330,593 tons imported in 2016-17.
PEt COKE

October 31, 2018 | 34
Port wise pet coke import, m-o-m & y-o-y comparison (in mt)
Port wise pet coke import during October-September’17 & ‘18 (in mt)
PORT Sep'17 Aug'18 Sep'18
CHENNAI 0.000 0.000 0.001
GANGAVARAM - 0.022 -
KANDLA 0.136 0.030 0.067
KOLKATA / HALDIA - 0.024 0.000
GOA / MARMAGOA 0.038 - -
MUNDRA 0.055 0.000 0.000
NEW MANGALORE 0.053 - -
PARADIP - 0.041 -
VIZAG 0.047 0.209 0.050
PIPAVAV 0.100 0.052 -
KRISHNAPATNAM 0.093 0.156 0.095
KARAIKAL 0.054 - -
KAKINADA - 0.112 -
HAZIRA 0.049 - -
PORT Oct-Sep'17 Oct-Sep'18 % Growth (+/-)
CHENNAI 0.005 0.003 -47.9%
COCHIN 0.000 0.000 -57.8%
GANGAVARAM 0.326 0.880 NA
KANDLA 3.113 0.819 -73.7%
KOLKATA / HALDIA 0.155 0.165 6.8%
GOA / MARMAGOA 0.478 0.116 -75.7%
MUMBAI 0.000 0.000 NA
MUNDRA 0.058 0.406 NA
NEW MANGALORE 0.463 0.513 10.8%
PARADIP 0.424 0.298 -29.7%
VIZAG 1.998 2.071 3.6%
TUTICORIN / VOC 0.225 0.055 -75.4%
BHAVNAGAR 0.179 - NA
PIPAVAV 0.372 0.517 38.8%
BEDI 0.052 - NA
MAGDALLA 0.004 - NA
DAHEJ 0.054 - NA
KRISHNAPATNAM 2.463 1.477 -40.0%
KARAIKAL 0.806 0.462 -42.6%
KAKINADA 0.161 0.161 -0.3%
JAFRABAD 0.022 - NA
MULDWARKA 0.116 - NA
HAZIRA 0.130 0.108 -16.8%
PEt COKE

October 31, 2018 | 35
India’s cement production in Aug up 14.4% y-o-y
India’s cement production during August 2018 stood at 25.65 million tons (mt), up 14.35 percent over 22.43 mt recorded for
August 2017, according to data available with ICMW.
On a month-on-month basis, cement production during August 2018 declined 1.27 percent as compared to 25.98 mt in July 2018.
During April-August, 2018-19, cement production stood at 135.24 mt, an increase of 12.79 percent over 119.90 mt recorded for April-August, 2017-18.
Earlier, cement production stood at 297.56 mt during 2017-18, up 6.34 percent over 279.81 mt recorded in the previous fiscal (2016-17).
The following table shows India’s month-wise cement production in 2018-19, 2017-18, 2016-17 and 2015-16:
MonthProduction (in million tons)
2018-19 2017-18 2016-17 2015-16
April 27.24 24.08 24.69 23.66*
May 25.87 25.39 24.89 24.29*
June 28.58 24.59 26.06 23.62*
First quarter (Q1) 83.61 74.07 75.64 71.57
July 25.98 23.4 23.33 23.01*
August 25.65 22.43 22.28 21.62
September 22.91 22.63 21.44*
Second quarter (Q2) 67.6 68.24 66.09
October 23.61 24.26 22.84*
November 24.07 20.52 20.41*
December 26.31 22 23.89
Third Quarter (Q3) 73.99 66.78 67.14
January 27.15 22.48 25.88
February 26.37 21.45 25.5
March 28.47 27.05 26.82
Fourth Quarter (Q4) 81.99 70.98 78.2
Total (Apr-Mar) 297.56 279.81 283.22
CEMENt
India’s limestone imports up 87% in September
Total imports of limestone by Indian buyers stood at 1,391,247 tons in September 2018, 86.71 percent higher than 745,123
tons imported in September 2017, according to data available with ICMW.
Month-wise, September 2018 imports increased by 1.43 percent over 1,371,629 tons in August 2018.
Of the total imports, the highest volume was recorded at Kolkata Port (236,142 tons), followed by Chennai Port (233,107 tons) and Paradip Port (218,829 tons).
Earlier, total imports of limestone stood at 15,622,464 tons in 2017-18, about 8.8 percent lower than 17,141,633 tons imported in 2016-17.
India’s gypsum imports swell manifold in September
Total imports of gypsum by Indian buyers stood at 521,851 tons in September 2018, up manifold over 66,363 tons
imported in September 2017, according to data available with ICMW.
Similarly, on a month-on-month basis, gypsum imports in September 2018 was up manifold from 91,963 tons in August 2018, the data show.
Of the total imports in September 2018, the highest volume was recorded at Dahej Port (108,029 tons), followed by Hazira Port (58,524 tons) and Mag-dalla Port (56,788 tons).
Earlier, total imports of gypsum stood at 4,050,472 tons in 2017-18, 22.44 percent higher than 3,307,862 tons imported in 2016-17.
Gypsum is mainly imported by the cement sector and used in the cement man-ufacturing process to control the rate of hardening of the final product.

October 31, 2018 | 36
Port wise gypsum import, m-o-m & y-o-y comparison (in mt)
Port wise gypsum import during October-September’17 & ‘18 (in mt)
PORTS Sep'17 Aug'18 Sep'18
KOLKATA 0.023 0.054 0.052
HYDERABAD 0.000 0.000 0.001
VIZAG 0.028 0.113 0.055
KRISHNAPATNAM - 0.055 -
CHENNAI 0.001 0.001 0.056
TUTICORIN / VOC 0.000 0.016 0.011
KATTUPALLI-INKAT1 0.001 0.002 0.003
COCHIN 0.000 0.001 0.001
NEW MANGALORE - - 0.024
MARMAGOA - - 0.028
NHAVA SHEVA 0.011 0.010 0.013
MUNDRA 0.001 0.001 0.001
MAGDALLA - - 0.057
PIPAVAV - - 0.053
HAZIRA 0.000 0.001 0.059
DAHEJ - - 0.108
PORT Oct-Sep'17 Oct-Sep'18 % Growth (+/-)
VIZAG 0.873 0.854 -2.2%
PARADIP 0.723 0.264 -63.5%
CHENNAI 0.231 0.542 NA
KOLKATA 0.172 0.463 NA
HAZIRA 0.099 0.346 NA
NHAVA SHEVA 0.082 0.194 NA
KAKINADA 0.100 0.176 76.9%
PIPAVAV 0.101 0.135 33.8%
NEW MANGALORE 0.111 0.111 0.5%
MARMAGOA 0.104 0.115 10.7%
KANDLA 0.160 0.012 -92.7%
OTHERS 0.179 1.277 NA
CEMENt

October 31, 2018 | 37
Port wise limestone import, m-o-m & y-o-y comparison (in mt)
Port wise limestone import during October-September’17 & ‘18 (in mt)
PORT Sep-17 Aug-18 Sep-18
KOLKATA 0.065 0.172 0.236
PARADIP 0.158 0.321 0.219
VIZAG 0.010 0.043 0.134
GANGAVARAM - 0.116 0.131
KRISHNAPATNAM 0.101 0.153 0.074
KAKINADA - - 0.010
CHENNAI 0.116 0.175 0.233
TUTICORIN / VOC 0.103 0.110 0.116
IRUNGATTUKOTTAI‐ILP ICD - 0.001 0.001
KATTUPALLI-INKAT1 0.001 0.011 0.009
KARAIKAL - - 0.010
COCHIN 0.000 0.001 0.001
NEW MANGALORE - - 0.028
MUMBAI - 0.009 0.011
NHAVA SHEVA 0.006 0.010 0.005
MUNDRA 0.005 0.005 0.008
MAGDALLA 0.109 0.112 0.100
PIPAVAV 0.055 0.110 0.051
ANKLESHWAR 0.000 0.001 0.000
THAR DRY PORT 0.000 0.000 0.001
HAZIRA 0.010 0.016 0.008
GARHI HARSARU 0.002 0.002 0.003
KANPUR - 0.001 0.001
KLPPLPANKI - - 0.001
SONIPAT ICD 0.001 0.000 -
PORT Oct-Sep'17 Oct-Sep'18 % Growth (+/-)
PARADIP 3.303 2.858 -13.5%
KOLKATA 1.763 2.476 40.4%
CHENNAI 0.916 2.113 NA
TUTICORIN / VOC 1.349 1.265 -6.2%
KRISHNAPATNAM 1.733 0.805 -53.6%
GANGAVARAM 0.463 1.782 NA
PIPAVAV 0.849 1.175 38.4%
MAGDALLA 0.734 0.971 32.2%
MARMAGOA 0.448 1.174 NA
VIZAG 0.630 0.923 46.5%
MUNDRA 0.148 0.340 NA
OTHERS 0.522 0.966 85.0%
CEMENt

October 31, 2018 | 38
Sponge iron September production down y-o-y, m-o-m
Sponge iron prices decrease 3.63% in Oct m-o-m
Gross sponge iron production in September 2018 decreased 2 percent to 2.42 million tons (mt) as against 2.47 mt in the
same period last year, according to provisional data from the Joint Plant Committee of the steel ministry.
On a month-on-month basis gross production decreased 0.4 percent from 2.43 mt produced in August 2018.
In the April-September period of 2018-19, gross sponge iron production rose 0.8 percent to 14.84 million tons as against 14.73 million tons in the same period last year.
Among the major producers Essar’s production jumped 23.3 percent to 2.44 million tons in the six month period of current financial year, while JSW’s production rose 8.3 percent to 1.23 million tons. However, JSPL’s sponge iron production fell 8.9 percent to 648,000 tons in the April-September period.
Production by other producers also declined 3.5 percent to 10.52 million tons during the six month period of the current financial year.
Sponge iron offers in India decreased on an average by 3.63 percent month-on-month in October 2018 in the major
markets, according to the data available with ICMW.
Prices decreased in the markets of Raigarh, Raipur and
Rourkela by 5.60 percent, 6.37 percent and 5.19 percent respectively.
However, prices increased in the market of Durgapur by 3.16 percent.
Sponge iron production data (in ‘000 tons)
Production
Sep-18 Sep 2018 vis-à-vis Aug 2018 April-September
2018-19 (prov)
2017-18 (prov) Variation % Sep 2018
(prov)Aug 2018
(prov) Variation % 2018-19 (prov)
2017-18 (prov) Variation %
ESSAR 408 275 48.4 408 418 -2.4 2448 1986 23.3
JSW 198 201 -1.5 198 177 11.9 1231 1137 8.3
JSPL 97 103 -5.8 97 105 -7.6 648 711 -8.9
OTHERS 1722 1895 -9.1 1722 1735 -0.7 10522 10900 -3.5
GROSS PRODUCTION 2425 2474 -2 2425 2435 -0.4 14849 14734 0.8
Source: JPC
Prices of sponge iron in various markets during the past six months (Rs/ton) (Prices are basic, exclusive of taxes)
NAME OF THE MARKETPrice Rs./Ton as on Price Rs./Ton as on Price Rs./Ton as on Price Rs./Ton as on Price Rs./Ton as on
1-Nov-18 31-Oct-18 24-Oct-18 1-Oct-18 4-May-18
MANDI GOVINDGARH - - - - -
DURGAPUR 22,800 23,000 23,300 22,100 22,900
JAIPUR - - - - -
RAIGARH 21,900 22,100 22,400 23,200 21,500
RAIPUR 23,500 23,700 24,100 25,100 23,500
ROURKELA 21,900 22,100 22,500 23,100 21,100
Source: Compilation from various sources & ICMW data
SPONGE IRON

October 31, 2018 | 39
MoC identifies six thrust areas to boost coal sector
In order to cope with the ever-rising coal demand in the country and minimise the dependence on imports, the
Ministry of Coal (MoC) has identified six thrust areas which include quality, technology, safety, environment, evacuation and coal mine methane (CMM) initiatives, according to a top official of the ministry.
“Environmental sustainability and economic growth prescribes identification of energy policies of India and objectives of these policies. Fitting into this objective, the whole industry is trying to cope with its associated problems – from coal offtake to coal production. The ministry has identified six thrust areas in the coal sector that have been delineated by the coal industry and would help to overcome the challenges faced by the sector through increased production from already active coal blocks and increase operations by opening up the mining sector, strengthening and augmentation of the coal evacuation system and infrastructural growth,” the coal ministry official said.
Last year, the country had produced 676 million tons (mt) and this year it is trying to get to 776 mt. The imports last year were to the tune of 188 million tons. The intention is to reduce the imports to the extent possible and increase the in-house capabilities. Coal demand and production levels are quite high and coal companies are struggling to cope with the same.
“The basic challenges faced by the coal sector can be tackled by increasing the use of technology automation, increase production from the already active coal blocks, increasing operations by opening up the mining sector, strengthening and augmentation of the coal evacuation system and infrastructural growth,” the official added.
CIL achieves 21.9% of capex target till September
Coal India Ltd (CIL) has achieved only 21.97 percent of its capital expenditure earmarked for the current financial
year (2018-19) during the first six months (April-September), according to official data.
Total capex achieved till September 2018 stood at Rs 2,087.45 crore, about 21.97 percent of the yearly target of 9,500 crore, the data show. Achievement during the month of September 2018 was Rs 540.93 crore.
Meanwhile, capex achieved by NLC India Ltd during April-September 2018 was Rs 2,150.27 crore, about 28.13 percent of the yearly target of 7,645 crore.
In September 2018, NLC achieved a capex of Rs 100.87 crore.
CIL signs MoU with NLC for power generation
Coal India Limited (CIL) entered into a pact with NLC India Ltd (NLCIL) to set up a joint venture for power generation.
“Coal India Ltd (CIL) and NLCIL have signed a memorandum of understanding (MoU) for formation of a joint venture for solar power generation of 3,000 megawatt (MW) and thermal power projects of 2,000 MW capacity,” the company said in a BSE filing.
CIL’s Prasad given additional charge of Director Finance
The Ministry of Coal (MoC) has entrusted the additional charge of Director Finance, Coal India Ltd (CIL) to S N
Prasad, who presently is Director (Marketing), the company said in a BSE filing.
Prasad will assume the additional charge with effect from October 3, 2018.
Further, the company has also appointed S Sarkar as CFO with effect from October 1, 2018.
OtHERS
MoC invites bids for allocation of mines
The Ministry of Coal (MoC) has invited bids for the allocation of coal mines to companies engaged in specified end uses
of iron and steel, cement and captive power plants (excluding steel (coking) and production of iron and steel), said an official release.
“In exercise of the power conferred by Section 4 (1) of (Special Provisions) Act, 2015 and in accordance with the Rule 8 of Coal Mines (Special Provisions), Rules 2014, the Government of India has directed the Nominated Authority to undertake the 7th Tranche of Auction of identified coal mines to eligible companies,” the release said.
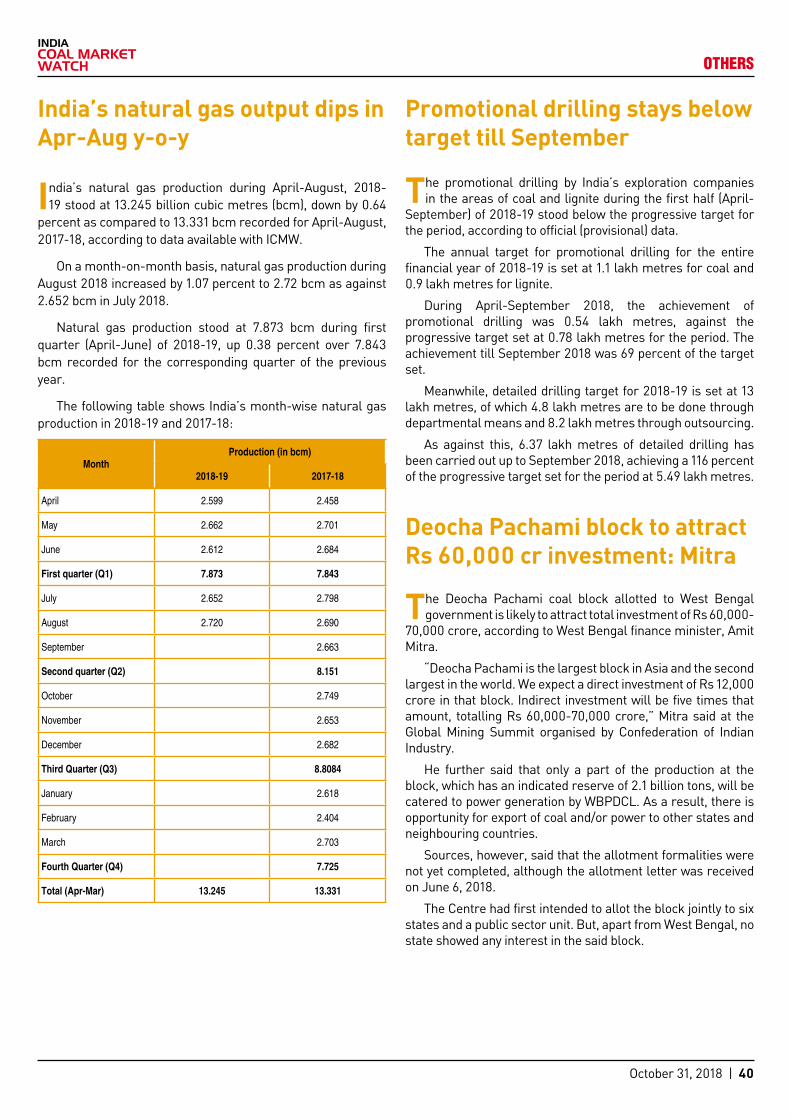
October 31, 2018 | 40
OtHERS
Promotional drilling stays below target till September
The promotional drilling by India’s exploration companies in the areas of coal and lignite during the first half (April-
September) of 2018-19 stood below the progressive target for the period, according to official (provisional) data.
The annual target for promotional drilling for the entire financial year of 2018-19 is set at 1.1 lakh metres for coal and 0.9 lakh metres for lignite.
During April-September 2018, the achievement of promotional drilling was 0.54 lakh metres, against the progressive target set at 0.78 lakh metres for the period. The achievement till September 2018 was 69 percent of the target set.
Meanwhile, detailed drilling target for 2018-19 is set at 13 lakh metres, of which 4.8 lakh metres are to be done through departmental means and 8.2 lakh metres through outsourcing.
As against this, 6.37 lakh metres of detailed drilling has been carried out up to September 2018, achieving a 116 percent of the progressive target set for the period at 5.49 lakh metres.
Deocha Pachami block to attract Rs 60,000 cr investment: Mitra
The Deocha Pachami coal block allotted to West Bengal government is likely to attract total investment of Rs 60,000-
70,000 crore, according to West Bengal finance minister, Amit Mitra.
“Deocha Pachami is the largest block in Asia and the second largest in the world. We expect a direct investment of Rs 12,000 crore in that block. Indirect investment will be five times that amount, totalling Rs 60,000-70,000 crore,” Mitra said at the Global Mining Summit organised by Confederation of Indian Industry.
He further said that only a part of the production at the block, which has an indicated reserve of 2.1 billion tons, will be catered to power generation by WBPDCL. As a result, there is opportunity for export of coal and/or power to other states and neighbouring countries.
Sources, however, said that the allotment formalities were not yet completed, although the allotment letter was received on June 6, 2018.
The Centre had first intended to allot the block jointly to six states and a public sector unit. But, apart from West Bengal, no state showed any interest in the said block.
India’s natural gas output dips in Apr-Aug y-o-y
India’s natural gas production during April-August, 2018-19 stood at 13.245 billion cubic metres (bcm), down by 0.64
percent as compared to 13.331 bcm recorded for April-August, 2017-18, according to data available with ICMW.
On a month-on-month basis, natural gas production during August 2018 increased by 1.07 percent to 2.72 bcm as against 2.652 bcm in July 2018.
Natural gas production stood at 7.873 bcm during first quarter (April-June) of 2018-19, up 0.38 percent over 7.843 bcm recorded for the corresponding quarter of the previous year.
The following table shows India’s month-wise natural gas production in 2018-19 and 2017-18:
MonthProduction (in bcm)
2018-19 2017-18
April 2.599 2.458
May 2.662 2.701
June 2.612 2.684
First quarter (Q1) 7.873 7.843
July 2.652 2.798
August 2.720 2.690
September 2.663
Second quarter (Q2) 8.151
October 2.749
November 2.653
December 2.682
Third Quarter (Q3) 8.8084
January 2.618
February 2.404
March 2.703
Fourth Quarter (Q4) 7.725
Total (Apr-Mar) 13.245 13.331

October 31, 2018 | 41
R² = 0.503
4.00
6.00
8.00
10.00
12.00
14.00
16.00
18.00
20.00
22.00
24.00
1-M
ar-1
2
30-M
ay-1
2
28-A
ug-1
2
26-N
ov-1
2
24-F
eb-1
3
25-M
ay-1
3
23-A
ug-1
3
21-N
ov-1
3
19-F
eb-1
4
20-M
ay-1
4
18-A
ug-1
4
16-N
ov-1
4
14-F
eb-1
5
15-M
ay-1
5
13-A
ug-1
5
11-N
ov-1
5
9-Fe
b-16
9-M
ay-1
6
7-Au
g-16
5-No
v-16
3-Fe
b-17
4-M
ay-1
7
2-Au
g-17
31-O
ct-1
7
29-Ja
n-18
29-A
pr-1
8
28-Ju
l-18
26-O
ct-1
8
24-Ja
n-19
Richards Bay to India (W) Richards Bay to India (E) Poly. (Richards Bay to India (W))
High freight $22 (12/3/2012)
High freight $19.5 (12/3/2012)
Low freight $5.00 (16/02/2016)
Low freight $4.75 (16/02/2016)
ICMW estimate
freight Rate trend - SA to India
RECENt PRICE tREND & fORECASt fOR NOVEMbER 2018
LOGIStICS
R² = 0.3724
2.00
4.00
6.00
8.00
10.00
12.00
14.00
16.00
1-M
ar-1
2
30-M
ay-1
2
28-A
ug-1
2
26-N
ov-1
2
24-F
eb-1
3
25-M
ay-1
3
23-A
ug-1
3
21-N
ov-1
3
19-F
eb-1
4
20-M
ay-1
4
18-A
ug-1
4
16-N
ov-1
4
14-F
eb-1
5
15-M
ay-1
5
13-A
ug-1
5
11-N
ov-1
5
9-Fe
b-16
9-M
ay-1
6
7-Au
g-16
5-N
ov-1
6
3-Fe
b-17
4-M
ay-1
7
2-Au
g-17
31-O
ct-1
7
29-J
an-1
8
29-A
pr-1
8
28-J
ul-1
8
26-O
ct-1
8
24-J
an-1
9
Indonesia to India (W) Indonesia to India ( E) Poly. (Indonesia to India ( E))
Low freight 3.90 (02/02/2016)
High freight $14.1 (15/10/2013)
ICMW estimate
High freight $12.50(15/10/2013)
Low freight $3.00 (02/02/2016)
freight Rate trend - Indonesia to India

October 31, 2018 | 42
The 12 major Indian ports handled 343.36 million tons (mt) of total traffic during April-September, 2018, about
5.15 percent higher than 326.53 mt recorded during the corresponding period of the previous fiscal, according to data released by the Indian Ports Association (IPA).
During September 2018, total traffic handled by the major ports stood at 54.98 mt, up 5.26 percent over 52.23 mt handled during the corresponding month of the previous year.
On a monthly basis, total traffic handled in September 2018 was down marginally by 3.35 percent as against 56.89 mt in August 2018.
Thermal coal handling by the major ports was up 24 percent during April-September, 2018. Movement of thermal coal through these ports increased to 51.45 mt during April-September, 2018, compared to 41.47 mt achieved in the corresponding period of the previous fiscal.
Among the major ports, Paradip had the distinction of handling the highest volume of thermal coal, at around 16 mt, during April-September, 2018. The port had handled 12.11 mt during April-September, 2017.
The major ports handled a total of 26.45 mt of coking coal during April-September, 2018, up 9.69 percent compared to 24.26 mt during the same period last year.
Among the major ports, Kolkata had the distinction of handling the highest volume of coking coal, at around 8.54 mt, during April-September, 2018. The port had handled 5.82 mt during April-September, 2017.
Movement of iron ore through the major ports showed a decline of 10.65 percent during April-September, 2018. The major ports together handled 19.39 mt of iron ore during April-September, 2018 compared to 21.7 mt handled in the corresponding period of 2017.
Paradip Port handled the highest volume of iron ore, at 5.54 mt, during April-September, 2018, almost flat percent against 5.52 mt handled during April-September, 2017.
Movement of container traffic in terms of tonnage increased 9.1 percent to 72 mt during April-September, 2018, compared to 66 mt during the corresponding month of 2017.
Altogether, 9 major ports showed positive growth in traffic handling during April-September, 2018, while the remaining 3 showed negative growth on a year-on-year basis.
In terms of growth, Cochin Port topped the list with 11.5 percent increase in cargo throughput, while Marmagoa saw the highest decline at 27 percent, during April-September, 2018. In terms of traffic volumes, Paradip Port clinched the top rank with POL volumes of 17.81 mt recorded during April-September, 2018.
PortsApril to SeptemberTraffic % variation
against prev. year traffic2018* 2017
KOLKATA
Kolkata Dock System 8920 8592 3.82
Haldia Dock Complex 21049 19124 10.07
TOTAL: KOLKATA 29969 27716 8.13
PARADIP 52898 47605 11.12
VISAKHAPATNAM 31762 30149 5.35
KAMARAJAR (ENNORE) 16570 13847 19.66
CHENNAI 27137 26236 3.43
V.O. CHIDAMBARANAR 16778 17286 -2.94
COCHIN 15906 14264 11.51
NEW MANGALORE 20179 19549 3.22
MORMUGAO 9229 12658 -27.09
MUMBAI 29392 31234 -5.90
JNPT 34814 32704 6.45
DEENDAYAL 58630 53287 10.03
TOTAL 343264 326535 5.12
Traffic handled by major ports up 5% in April-September
LOGIStICS
Handling of imported coal by Paradip Port located in the east coast of India at Jagatsinghpur district of Odisha, during
April-September 2018 increased 48.86 percent to 13,486,383 tons from 9,059,319 tons handled during the corresponding period of the previous fiscal, according to provisional data provided by a source in the port.
Coal handling via the port in September 2018 stood at 1,799,486 tons, up 54 percent over 1,168,342 tons handled during September 2017.
On a month-on-month basis, coal handling by the port in September 2018 decreased by 9.64 compared 1,991,523 tons handled during August 2018.
Following table gives detail of coal handling by HDC (in ton):
Paradip Port Coal Handling (in tons)
Months 2018-19 2017-18
April 2,550,775 1,810,287
May 2,453,958 1,672,178
June 2,365,471 1,421,400
July 2,325,170 1,640,487
August 1,991,523 1,346,625
September 1,799,486 1,168,342
TOTAL 13,486,383 9,059,319
Paradip Port’s April-September coal handling up 49% y-o-y

October 31, 2018 | 43
LOGIStICS
Haldia Port’s Sept coal handling down 14% y-o-y
Handling of imported coal by Haldia Dock Complex (HDC) (under Kolkata Port Trust) located in the eastern state
of West Bengal, during September 2018 decreased 14.37 percent to 661,000 tons from 772,000 tons handled during the same month of 2017, according to provisional data provided by a source in the port.
Similarly, on a month-on-month basis, coal handling by the port in September 2018 decline 32.41 percent compared to 978,000 tons handled during August 2018.
Earlier, traffic handling via the port during April-September 2018 stood at 5,692,000 tons, up 28 percent against 4,459,000 tons recorded in the previous fiscal.
Following table gives detail of coal handling by HDC (in ton):
HALDIA DOCK COMPLEX-SEPTEMBER 2018 (TON)
COMMODITY SEPT’18 SEPT’17 AUG’18 APR-SEPT’18
APR-SEPT’17
THERMAL
COAL 113,000 105,000 61,000 1,087,000 904,000
COKING COAL 523,000 607,000 832,000 4,262,000 3,166,000
MET COKE 25,000 54,000 61,000 252,000 267,000
R P COKE - 6,000 24,000 91,000 122,000
TOTAL 661,000 772,000 978,000 5,692,000 4,459,000
Deendayal Port’s coal handling spurts 68% in September
Handling of imported coal by Deendayal Port formerly Kandla Port, located in Gujarat, during September 2018
was up 68 percent to 1,525,452 tons from 908,223 tons handled September 2017, according to provisional data provided by ICMW.
On a monthly basis, September 2018 coal handling via the port increased by 6.35 percent from 1,434,329 tons in August 2018.
Coal handling for the port during April-September, 2018 stood at 8,525,249 tons, up 50 percent over 5,680,701 tons during corresponding period of the previous fiscal.
Earlier, coal handling via the port during 2017-18 was down 11.38 percent to 13,787,352 tons from 15,559,128 tons handled during 2016-17
Following table give details of coal handling by Deendayal Port in August 2018 and the corresponding month of last year, April-August 2018 and corresponding period of the previous year (in ton):
DEENDAYAL PORt SEPtEMbER 2018 (IN tONS)
Commodity (Imports) September’18 September'17 August'18 Apr-Sept,
2018 Apr-Sept,
Thermal coal 1,488,247 881,420 1,350,879 8,133,057 5,537,534
Coking coal 37,205 26,803 83,450 392,192 143,167
Total 1,525,452 908,223 1,434,329 8,525,249 5,680,701
Tuticorin port’s Sept coal handling up 66% y-o-y
The handing of imported coal by V.O. Chidambaranar port or the Tuticorin port located in Tamil Nadu stood at 965,373
tons in September 2018, up 66 percent compared to 581,892 tons in September 2017, according to provisional data available by .
On a month-on-month basis, coal handling via Tuticorin port in September 2018 increased 7 percent compared to 901,325 tons in August 2018.
During April-September, 2018 coal handled by the port stood at 6,174,889 tons up 25.2 percent against 4,931,704 tons during the corresponding quarter of the previous fiscal.
Earlier, coal handling via the port in during the period 2017-18 stood at 12,480,366 tons, 12.41 percent down compared to 14,250,216 tons during the corresponding period of 2016-17.
Dahej port’s Sept coal handling down 22% m-o-m
Handling of imported coal by Dahej Port, located in Gujarat, during September 2018 stood at 671,972 tons, according to
information available with ICMW.
On a month-on-month basis, coal handled via Dahej port during September 2018 decreased by 22.35 percent compared to 865,474 tons in August 2018.
However, on a year-on-year basis, coal handling during August 2018 increased 107 percent as against 324,467 tons in the corresponding month of the previous year.
Coal handled by the port during Q1 of FY19 stood at 1,675,257 tons, up 18.45 percent as against 1,414,310 tons in the corresponding quarter of the previous fiscal.
Earlier, coal handled via Dahej Port during 2017-18 stood at 6,076,095 tons.

October 31, 2018 | 44
Indian Railways in September 2018 transported 43.99 million tons (mt) of coal, up 2.66 percent from 42.85 mt handled
in September 2017. Revenue earnings of Railways from transportation of coal were up 19.22 percent to Rs 4,298.55 crore in September 2018, compared to Rs 3,605.44 crore in September 2017, as per provisional information available with ICMW.
During April-September, 2018, transportation of coal by Railways stood at 288.37 mt, up 11.47 percent as compared to 258.68 mt clocked during the corresponding period of 2017. Revenue earnings of Railways from transportation of coal during the period stood at Rs 28,394.62 crore, up 25.89 percent compared to Rs 22,555 crore in the corresponding period of 2017.
Meanwhile, Railways transported 94.81 mt of various commodities in September 2018, up 3.67 percent compared to 91.45 mt in September 2017. Revenue earnings of Rs 9,120.65 crore from transportation of these commodities in September 2018 were also up 12 percent from Rs 8,139.49 crore earned in September 2017.
Apart from coal, Railways transported 11.94 mt of iron ore for
exports, steel plants and for other domestic use in September 2018, up 2.66 percent from 11.63 mt in September 2017. Further, revenue earnings of Railways from transportation of iron ore for exports, steel plants and for other domestic use were down 1.36 percent to Rs 709.87 crore in September 2018, compared to Rs 700.33 crore in the corresponding month of last year.
During April-September 2018, transportation of iron ore for exports, steel plants and for other domestic use by Railways stood at 65.83 mt, down 7 percent from 70.86 mt in April-September 2017. Revenue earnings of Railways from transportation of iron ore for exports, steel plants and for other domestic use during April-September 2018 stood at Rs 4,145.21 crore, down 6.69 percent as compared to Rs 4,442.55 crore earned in corresponding period of 2017.
Cement transported through railways stood at 9.17 mt in September 2018, up 13 percent from 8.12 mt in September 2017. Revenue earnings of Railways from transportation of cement were also up 16.33 percent to Rs 694.14 crore in September 2018 from Rs 596.67 crore in September 2017.
LOGIStICS
Indian Railways’ Sept coal handling up almost 3% y-o-y
Commodity-wise revenue earnings of Railways (September 2018)
CommodityTonnage (in million) Earnings (` in cr.)
2017-18 2018-19 2017-18 2018-19
Coal
Total for steel plants 4.50 4.69 326.10 406.38
Coal for washeries 0.02 0.01 0.37 0.18
Total for power houses 17.97 18.28 1,479.78 1,805.63
Total for public use 20.36 21.01 1,799.19 2,086.36
Total 42.85 43.99 3,605.44 4,298.55
Pig iron and finished steel
i) from steel plants 2.52 2.62 395.47 447.36
ii) from other points 1.77 1.73 154.51 168.76
Total 4.29 4.35 549.98 616.12
Iron ore
i) for export 0.92 0.45 74.47 30.13
ii) for steel plants 7.05 7.35 377.4 401.17
iii) for other domestic users 3.66 4.14 248.46 278.57
Total 11.63 11.94 700.33 709.87
Cement 8.12 9.17 596.67 694.14
Foodgrains 3.60 3.58 559.97 610.60
Fertilizers 4.19 4.47 486.27 504.49
Mineral Oil (POL) 3.32 3.24 414.09 409.80
Container Service
i) Domestic containers 0.87 0.94 111.12 114.80
ii) EXIM containers 3.64 4.09 342.13 379.95
iii) Total 4.51 5.03 453.25 494.75
Balance other goods 7.06 7.13 602.25 622.90
Total revenue earning traffic 91.45 94.81 8,139.49 9,120.65
Commodity-wise revenue earnings of Railways (April to September, 2018)
CommodityTonnage (in million) Earnings (` in cr.)
2017-18 2018-19 2017-18 2018-19
Coal
Total for steel plants 27.02 28.58 2,072.02 2,466.79
Coal for washeries 0.14 0.06 2.74 1.47
Total for power houses 114.46 120.07 10,297.08 11,956.30
Total for public use 117.06 139.66 10,183.16 13,970.06
Total 258.68 288.37 22,555.00 28,394.62
Pig iron and finished steel
i) from steel plants 19.57 15.81 2,958.45 2,858.7
ii) from other points 7.37 10.79 799.79 1,045.32
Total 26.94 26.60 3,758.24 3,904.02
Iron ore
i) for export 4.81 1.52 399.45 97.82
ii) for steel plants 41.5 43.23 2,366.06 2,532.81
iii) for other domestic users 24.55 21.08 1,677.04 1,514.58
Total 70.86 65.83 4,442.55 4,145.21
Cement 55.63 57.85 4,587.92 4,765.72
Foodgrains 22.13 18.85 3,963.10 3,491.28
Fertilizers 24.52 25.27 2,927.39 2,956.54
Mineral Oil (POL) 21.79 21.12 2,779.28 2,702.77
Container Service
i) Domestic containers 5.33 5.79 698.19 712.23
ii) EXIM containers 21.21 24.32 2,019.51 2,205.53
Total 26.54 30.11 2,717.70 2,917.76
Balance other goods 41.35 43.33 3,732.58 3,809.01
Total revenue earning traffic 559.23 589.29 52,414.92 58,158.65

October 31, 2018 | 45
The quantities of coal offered by Coal India (CIL) via spot e-auction held on coaljunction in September 2018 increased
5.85 percent compared to the previous month. Similarly, there was a 9.57 percent increase in the allotted quantities, according to provisional data available with ICMW.
In September 2018, the offered quantity stood at 2,084,610 tons as against 1,969,380 tons offered in August 2018, while the allotted quantity was at 2,041,780 tons in September 2018 compared to 1,863,378 tons in August 2018.
During, April-September 2018, offered quantity stood at 14,271,714 tons, of which 12,809,182 tons got allotted.
An analysis of the auction revealed that G3 grade, coal and coke fines were not offered in September 2018.
Quantity-wise, G10 grade was offered in the highest volume (0.482 mt) and allocation-wise also G10 (0.478 mt) was the topmost. Percentage-wise, mixed, ungraded, G17, G16, G15, G14, G13, G8, G6, G5 and G1 grades all had the highest quantity allotted (100 percent).
Following table provides month-wise details of offered and allotted quantities under spot e-auction by CIL subsidiaries on coaljunction in 2018-19 and 2017-18:
Very high seen for G1 (GCV above 7,001 Kcal/kg) grade coal in the spot e-auction of coaljunction in September 2018 by
CIL in the spot e-auction on coaljunction, as the entire quantity of 5,500 tons offered by CIL subsidiary NEC, got allotted at a weighted average price of Rs 8,761, according to provisional data available with ICMW.
However, there was no for G1 grade coal in the spot e-auction of coaljunction in August 2018.
G2 grade There was strong demand for G2 (GCV between 6,700 and 7,000 Kcal/kg) grade coal in the spot e-auction of coaljunction in September 2018, as the entire quantity of 2,500 tons offered by CIL subsidiary NEC, got allotted at a weighted average price of Rs 8,012, according to provisional data available with ICMW.
However, there was no for G2 grade coal in the spot e-auction of coaljunction in August 2018.
G3 grade There was no offer for G3 grade (GCV between 6,401 and 6,700 Kcal/kg) coal by CIL in the spot e-auction on coaljunction in September 2018, according to provisional data available with
ICMW.
However, strong demand was witnessed in August 2018 for G3 grade CIL subsidiary ECL in the spot e-auction on coaljunction as the entire amount of 56,800 tons offered, got allotted at a weighted average price of Rs 5,631 per ton.
G4 grade There was high demand (44 percent) in September 2018 for G4 grade (GCV between 6,101 and 6,400 Kcal/kg) coal offered by CIL subsidiary CCL as out of the entire quantity of 12,150 tons offered, 5,370 tons got allotted at a weighted average price of Rs 4,166 per ton, according to data available with ICMW.
High demand (99.9 percent) in August 2018 for G4 grade offered by CIL subsidiary ECL as out of the entire quantity of 43,200 tons offered, 43,180 tons got allotted at a weighted average price of Rs 5,573 per ton.
G5 gradeThere was high demand (99.8 percent) for G5 grade (GCV range of 5,801 to 6,100 Kcal/kg) coal in the spot e-auction conducted on coaljunction in August 2018 by CIL subsidiaries CCL, SECL and NCL as the entire quantity of 83,500 tons offered, got
Month
2018-19 2017-18
CIL
Qty offered Qty allotted Qty offered Qty allotted
(in tons) (in tons) (in tons) (in tons)
April 2,856,874 2,713,949 2,415,970 1,838,054
May 2,421,550 2,317,904 2,841,140 1,845,503
June 3,011,500 2,086,084 1,578,170 686,769
July 1,927,800 1,786,087 1,022,880 524,066
August 1,969,380 1,863,378 1,645,030 1,466,881
September 2,084,610 2,041,780 2,108,312 1,362,697
October 2,788,450 2,763,150
November 3,621,444 3,229,600
December 5,555,670 4,838,280
January 4,889,480 4,032,070
February 4,167,472 3,460,660
March 4,280,628 3,033,418
Total (Apr-Sept) 14,271,714 12,809,182 11,611,502 7,723,970
Total (Apr-Mar) 14,271,714 12,809,182 36,914,646 29,081,148
Contd. on next Pg
E-AUCtION
CIL Sept allotment on coaljunction up 10% m-o-m
Very high demand for G1 grade in Sept spot e-auction
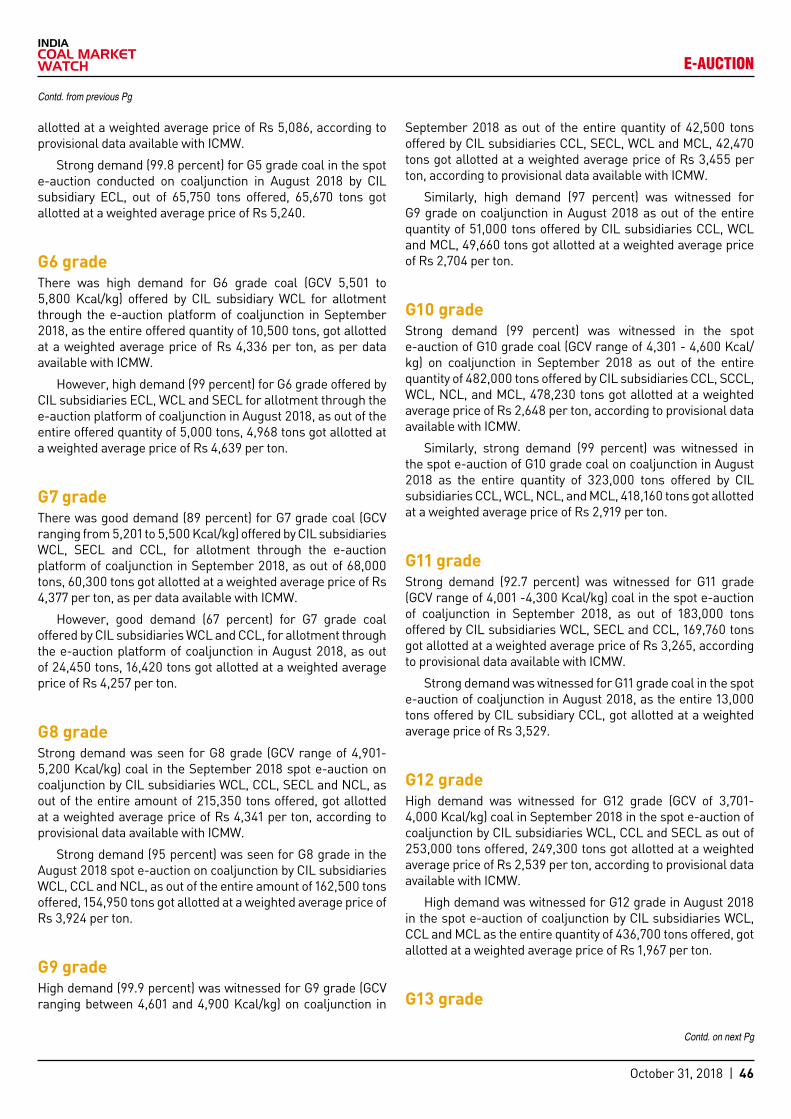
October 31, 2018 | 46
Contd. from previous Pg
allotted at a weighted average price of Rs 5,086, according to provisional data available with ICMW.
Strong demand (99.8 percent) for G5 grade coal in the spot e-auction conducted on coaljunction in August 2018 by CIL subsidiary ECL, out of 65,750 tons offered, 65,670 tons got allotted at a weighted average price of Rs 5,240.
G6 grade There was high demand for G6 grade coal (GCV 5,501 to 5,800 Kcal/kg) offered by CIL subsidiary WCL for allotment through the e-auction platform of coaljunction in September 2018, as the entire offered quantity of 10,500 tons, got allotted at a weighted average price of Rs 4,336 per ton, as per data available with ICMW.
However, high demand (99 percent) for G6 grade offered by CIL subsidiaries ECL, WCL and SECL for allotment through the e-auction platform of coaljunction in August 2018, as out of the entire offered quantity of 5,000 tons, 4,968 tons got allotted at a weighted average price of Rs 4,639 per ton.
G7 grade There was good demand (89 percent) for G7 grade coal (GCV ranging from 5,201 to 5,500 Kcal/kg) offered by CIL subsidiaries WCL, SECL and CCL, for allotment through the e-auction platform of coaljunction in September 2018, as out of 68,000 tons, 60,300 tons got allotted at a weighted average price of Rs 4,377 per ton, as per data available with ICMW.
However, good demand (67 percent) for G7 grade coal offered by CIL subsidiaries WCL and CCL, for allotment through the e-auction platform of coaljunction in August 2018, as out of 24,450 tons, 16,420 tons got allotted at a weighted average price of Rs 4,257 per ton.
G8 gradeStrong demand was seen for G8 grade (GCV range of 4,901-5,200 Kcal/kg) coal in the September 2018 spot e-auction on coaljunction by CIL subsidiaries WCL, CCL, SECL and NCL, as out of the entire amount of 215,350 tons offered, got allotted at a weighted average price of Rs 4,341 per ton, according to provisional data available with ICMW.
Strong demand (95 percent) was seen for G8 grade in the August 2018 spot e-auction on coaljunction by CIL subsidiaries WCL, CCL and NCL, as out of the entire amount of 162,500 tons offered, 154,950 tons got allotted at a weighted average price of Rs 3,924 per ton.
G9 grade High demand (99.9 percent) was witnessed for G9 grade (GCV ranging between 4,601 and 4,900 Kcal/kg) on coaljunction in
September 2018 as out of the entire quantity of 42,500 tons offered by CIL subsidiaries CCL, SECL, WCL and MCL, 42,470 tons got allotted at a weighted average price of Rs 3,455 per ton, according to provisional data available with ICMW.
Similarly, high demand (97 percent) was witnessed for G9 grade on coaljunction in August 2018 as out of the entire quantity of 51,000 tons offered by CIL subsidiaries CCL, WCL and MCL, 49,660 tons got allotted at a weighted average price of Rs 2,704 per ton.
G10 grade Strong demand (99 percent) was witnessed in the spot e-auction of G10 grade coal (GCV range of 4,301 - 4,600 Kcal/kg) on coaljunction in September 2018 as out of the entire quantity of 482,000 tons offered by CIL subsidiaries CCL, SCCL, WCL, NCL, and MCL, 478,230 tons got allotted at a weighted average price of Rs 2,648 per ton, according to provisional data available with ICMW.
Similarly, strong demand (99 percent) was witnessed in the spot e-auction of G10 grade coal on coaljunction in August 2018 as the entire quantity of 323,000 tons offered by CIL subsidiaries CCL, WCL, NCL, and MCL, 418,160 tons got allotted at a weighted average price of Rs 2,919 per ton.
G11 grade Strong demand (92.7 percent) was witnessed for G11 grade (GCV range of 4,001 -4,300 Kcal/kg) coal in the spot e-auction of coaljunction in September 2018, as out of 183,000 tons offered by CIL subsidiaries WCL, SECL and CCL, 169,760 tons got allotted at a weighted average price of Rs 3,265, according to provisional data available with ICMW.
Strong demand was witnessed for G11 grade coal in the spot e-auction of coaljunction in August 2018, as the entire 13,000 tons offered by CIL subsidiary CCL, got allotted at a weighted average price of Rs 3,529.
G12 gradeHigh demand was witnessed for G12 grade (GCV of 3,701-4,000 Kcal/kg) coal in September 2018 in the spot e-auction of coaljunction by CIL subsidiaries WCL, CCL and SECL as out of 253,000 tons offered, 249,300 tons got allotted at a weighted average price of Rs 2,539 per ton, according to provisional data available with ICMW.
High demand was witnessed for G12 grade in August 2018 in the spot e-auction of coaljunction by CIL subsidiaries WCL, CCL and MCL as the entire quantity of 436,700 tons offered, got allotted at a weighted average price of Rs 1,967 per ton.
G13 grade
Contd. on next Pg
E-AUCtION

October 31, 2018 | 47
Contd. from previous Pg
Strong demand was seen for G13 grade (GCV of 3,401 to 3,700 Kcal/kg) coal in September 2018 spot e-auction on coaljunction, as the entire quantity of 44,000 tons offered by CIL subsidiaries SECL and CCL got allotted at a weighted average price of Rs 2,802, according to data available with ICMW.
Likewise, strong demand was seen for G13 grade coal in August 2018 spot e-auction on coaljunction, as the entire quantity of 274,000 tons offered by CIL subsidiaries MCL and CCL got allotted at a weighted average price of Rs 2,662.
G14 grade There was high demand for G14 grade coal (GCV of 3,101 to 3,400 Kcal/kg) in the September 2018 spot e-auction on coaljunction, as out of the entire quantity of 165,000 tons offered by CIL subsidiary CCL got allotted at a weighted average price of Rs 1,372, according to data available with ICMW.
Likewise, there was high demand for G14 grade coal in the August 2018 spot e-auction on coaljunction, as out of the entire quantity of 207,000 tons offered by CIL subsidiaries CCL and MCL got allotted at a weighted average price of Rs 2,449.
G15 grade Strong demand for G15 grade coal (GCV of 2801-3100 Kcal/kg) in the September 2018 spot e-auction on coaljunction, as the entire quantity of 41,000 tons offered by CIL subsidiaries CCL and SECL, got allotted at a weighted average price of Rs 2,643, according to data available with ICMW.
However, there was no offer for G15 grade coal in the August 2018 spot e-auction on coaljunction.
G16 grade There was high demand by CIL for G16 grade coal (GCV of 2501-2800 Kcal/kg) in the September 2018 spot e-auction on coaljunction as the entire quantity of 65,000 tons offered by CIL subsidiary CCL, got allotted at a weighted average price of Rs 983 per ton, according to data available with ICMW.
However, there was high demand by CIL for G16 grade coal in the August 2018 spot e-auction on coaljunction as the entire quantity of 15,000 tons offered, got allotted at a weighted average price of Rs 1,893 per ton.
G17 grade There was strong demand G17 grade coal (GCV of 2201-2500 Kcal/kg) in the September 2018 spot e-auction on coaljunction, as CIL subsidiary CCL had offered 1,500, which got allotted at a weighted average price of Rs 1,377, according to data available with ICMW.
However, there was no offer for G17 grade coal in the August 2018 spot e-auction on coaljunction.
Mixed grade There was high demand for mixed grade coal offered by CIL subsidiary WCL on the e-auction platform of coaljunction in September 2018 as the entire quantity of 240,950 tons offered, got allotted at a weighted average price of Rs 3,368, according to data available with ICMW.
Similarly, there was high demand for mixed grade coal offered by CIL subsidiary WCL on the e-auction platform of coaljunction in August 2018 as the entire quantity of 152,900 tons offered, got allotted at a weighted average price of Rs 2,892.
Ungraded coalStrong demand for ungraded coal offered by CIL subsidiary NCL on the e-auction platform of coaljunction in September 2018 as the entire quantity of 65,000 tons offered, got allotted at a weighted average price of Rs 2,053, according to data available with ICMW.
Similarly, there was strong demand for ungraded coal offered by CIL subsidiary NCL on the e-auction platform of coaljunction in August 2018 as the entire quantity of 40,000 tons offered, got allotted at a weighted average price of Rs 1,109.
E-AUCtION
Singareni Collieries Company’s (SCCL) allotted quantities of coal in the spot e-auction held on coaljunction in September
2018 saw good demand as 76 percent of the various grades of coal offered got alloted, according to provisional data available with ICMW.
In September 2018, the offered quantity stood at 461,000 tons while the allotted quantity stood at 350,200 tons.
An analysis of the auction revealed that washery grade, ungraded, G7, G8, G9, G11, G13, G15 and G17 were offered in September 2018.
Moreover, quantity-wise, G13 and washery grade was offered in the highest volume (176,000 tons) and allocation-wise G13 grade (131,000 tons) was the topmost. Percentage-wise, ungraded, G7 and G13 had the highest quantity allotment (100 percent).
There was no spot e-auction held by SCCL on coaljunction in August 2018. Earlier, in July 2018, the offered quantity by SCCL stood at 591,000 tons while the allotted quantity was at 172,026 tons.
SCCL’s Sept coaljunction spot e-auction sees good demand

October 31, 2018 | 48
E-AUCtION
There was very high demand 100 percent) for G7 grade (GCV ranging from 5,201 to 5,500 Kcal/kg) coal offered by SCCL
on the e-auction platform of coaljunction in September 2018 as the entire of 16,000 tons offered, got allotted at a weighted average price of Rs 4,401, according to data available with ICMW.
G8 grade There was very poor demand (88 percent) for G8 grade (GCV range of 4,901-5,200 Kcal/kg) coal offered by SCCL on the e-auction platform of coaljunction in September 2018 as out of 23,000 tons offered, 20,312 tons got allotted at a weighted average price of Rs 3,722 according to data available with ICMW.
G9 grade There was good demand (76 percent) for G9 grade (GCV ranging between 4,601 and 4,900 Kcal/kg) coal offered by SCCL on the e-auction platform of coaljunction in September 2018 as out of 25,000 tons offered, 18,921 tons got allotted at a weighted average price of Rs 3,440 according to data available with ICMW.
G11 grade There was poor demand (28 percent) for G11 grade (GCV range of 4,001 -4,300 Kcal/kg) coal offered by SCCL on the e-auction platform of coaljunction in September 2018 as the entire quantity of 10,000 tons offered, got allotted at a weighted average price of Rs 2,700, according to data available with ICMW.
G13 grade There was very high demand for G13 grade (GCV range of 3401-3700 Kcal/kg) coal offered by SCCL on the e-auction platform of coaljunction in September 2018 as out of 131,000 tons offered, 131,000 tons got allotted at a weighted average price of Rs 2,525 according to data available with ICMW.
G15 grade There was strong demand (99.8 percent) for G15 grade (GCV range of 2801-3100 Kcal/kg) coal offered by SCCL on the e-auction platform of coaljunction in September 2018 as out of of 30,000 tons offered, 29,954 tons got allotted at a weighted average price of Rs 1,934 according to data available with ICMW.
G17 grade There was strong demand for G17 grade (GCV range of 2201-2500 Kcal/kg) coal offered by SCCL on the e-auction platform of coaljunction in September 2018 as out of 30,000 tons offered, 15,181 tons got allotted at a weighted average price of Rs 651 according to data available with ICMW.
Ungraded coal There was strong demand (100 percent) for ungraded coal offered by SCCL on the e-auction platform of coaljunction in September 2018 as the entire quantity of 20,000 tons offered, got allotted at a weighted average price of Rs 210, according to data available with ICMW.
Contd. on next Pg
Very high demand for SCCL’s G7 in Sept spot e-auction
Spot allotment via other platform up 69% in Sept m-o-m
The total allotment of coal through the spot e-auction conducted by Coal India (CIL) subsidiaries during September
2018 on the MSTC platform stood at 7.759 million tons (mt), rose manifold month-on-month compared to 4.596 mt in August 2018, as per data available with ICMW.
Similarly, the quantity offered during September 2018 stood at 7.815 mt rose 74.9 percent month-on-month from 4.467 mt in August 2018.
An analysis of the auction revealed that coke fines, ungraded, G1, G2, G3, G4, G6, G7, G11, G15, G16 and G17 and mixed grades were not offered in September 2018.
Moreover, quantity-wise, G13 grade was offered in the highest volume (0.36 mt) and allocation-wise also G13 (0.36 mt) was the topmost. Percentage-wise, G5, G8, G9, G10, G12, G13 and G14 all had the highest quantity allotted (100 percent).
Strong demand for G5 grade in Sept spot e-auction via MSTC
There was strong demand for G5 grade (GCV of 5801-6100 Kcal/kg) coal for allotment on spot e-auction through MSTC
in September 2018 as the entire quantity of 7,500 tons offered by CIL subsidiary BCCL, got allotted at a weighted average price of Rs 5,048, as per data available with ICMW.
There was strong demand for G5 grade coal for allotment on spot e-auction through MSTC in August 2018 as the entire quantity of 8,980 tons offered by CIL subsidiariy ECL, got allotted at a weighted average price of Rs 4,821.
G8 grade Strong demand was witnessed for G8 grade (GCV 4,901 to

October 31, 2018 | 49
E-AUCtION
5,200 Kcal/kg) coal offered on MSTC’s spot e-auction by CIL subsidiary WCL in September 2018 as the entre quantity of 5,000 tons offered, got allotted at a weighted average price of Rs 3,182 per ton, as per data available with ICMW.
Similarly, strong demand was witnessed for G8 grade coal offered on MSTC’s spot e-auction by CIL subsidiary WCL in August 2018 as the entre quantity of 254,000 tons offered, got allotted at a weighted average price of Rs 3,774 per ton.
G9 grade Strong demand was witnessed in September 2018 for G9 grade (GCV 4601-4900 Kcal/kg) coal offered by CIL subsidiary MCL for allotment through MSTC on spot e-auction as the entire offered quantity of 35,000 tons, got allotted at a weighted average price of Rs 2,977 per ton, as per data available with ICMW.
Poor demand (33 percent) was witnessed for G9 grade coal offered on MSTC spot e-auction by CIL subsidiaries WCL and CCL in August 2018 as out of the entre quantity of 3,000 tons offered, 1,000 tons got allotted at a weighted average price of Rs 3,402 per ton.
G10 grade Strong demand was witnessed in September 2018 for G10 grade (GCV 4,301 to 4,600 Kcal/kg) coal offered by CIL subsidiary MCL for allotment through MSTC on spot e-auction as the entire offered quantity of 30,000 tons, got allotted at a weighted average price of Rs 3,108 per ton, as per data available with ICMW.
Strong demand was witnessed in August 2018 for G10 grade coal offered by CIL subsidiary WCL for allotment through MSTC on spot e-auction as the entire offered quantity of 1,157,000 tons, got allotted at a weighted average price of Rs 1,904 per ton.
G12 grade Very high demand was witnessed in September 2018 for G12 grade (GCV 3701-4000 Kcal/kg) coal offered by CIL subsidiary MCL for allotment on spot e-auction through MSTC as the entire offered quantity of 90,000 tons, got allotted at a weighted average price of Rs 2,845 per ton, as per data available with ICMW.
Similarly, strong demand (99.6 percent) was witnessed in August 2018 for G12 grade coal offered by CIL subsidiaries CCL and MCL for allotment on spot e-auction through MSTC as out of the entire offered quantity of 799,000 tons, 796,000 tons got allotted at a weighted average price of Rs 1,589 per ton.
G13 grade Strong demand was witnessed in September 2018 for G13 grade (GCV 3401-3700 Kcal/kg) coal offered by CIL subsidiary MCL for allotment on spot e-auction through MSTC as the entire offered quantity of 360,000 tons, got allotted at a weighted average price of Rs 2,671 per ton, as per data available with ICMW.
Strong demand (99.2 percent) was witnessed in August 2018 for G13 grade offered by CIL subsidiaries CCL and MCL for allotment on spot e-auction through MSTC as out of the entire offered quantity of 631,000 tons, 626,000 tons got allotted at a weighted average price of Rs 1,640 per ton.
G14 grade High demand was witnessed in September 2018 for G14 grade (GCV 3101-3400 Kcal/kg) coal offered by CIL subsidiary MCL for allotment on spot e-auction through MSTC as the entire offered quantity of 180,000 tons, got allotted at a weighted average price of Rs 2,425 per ton, as per data available with ICMW.
Similarly, High demand was witnessed in August 2018 for G14 grade (GCV 3101-3400 Kcal/kg) coal offered by CIL subsidiary CCL for allotment on spot e-auction through MSTC as the entire offered quantity of 15,000 tons, got allotted at a weighted average price of Rs 1,883 per ton.
Contd. from previous Pg
There was high demand (95.5 percent) for CIL on special forward e-auction platform of coaljunction in September
2018 as out of 3,105,000 tons offered, 2,967,000 tons got allotted at a weighted average price of Rs 2,744, according to data available with ICMW.
However, no offer was seen by CIL on special forward e-auction platform of coaljunction in August 2018. Previously, CIL in July 2018 had offered 2,116,000 tons out of which, 2,048,000 tons got allotted at a weighted average price of Rs 3,511.
An analysis of the auction revealed that washery, washed power coal, G6, G8, G10 and G12 grades were offered in the special forward auction held in September 2018. During the month, coal was offered by CIL subsidiaries CCL and BCCL.
Moreover, quantity-wise, washery grade (W4) offered in the highest volume (1.95 mt) and allocation-wise also washery grade (W4) (1.84 mt) was the topmost. Percentage-wise, G8, G10 and G12 had the highest quantity allotted (100 percent).
High demand for CIL on coaljunction’s special forward e-auction in Sept

October 31, 2018 | 50
E-AUCtION
Allotment via MSTC’s special forward auction in Sept down 96%
The total allotment of coal through the special forward e-auction conducted by Coal India (CIL) subsidiaries during
September 2018 on the MSTC platform stood at 0.284 million tons (mt), down 96 percent month-on-month compared to 7.815 mt in August 2018, as per data available with ICMW.
Similarly, the quantity offered during September 2018 stood at 0.309 mt down 69 percent month-on-month from 1 mt in August 2018.
An analysis of the auction revealed that G5, G6, G7, G9, G12, G13, G14 and G15 were the grades offered in September 2018.
Quantity-wise, G13 grade was offered in the highest volume (110,000 tons) and allocation-wise also G13 (108,000 tons) was the topmost.
Strong demand for coal via MSTC’s special spot auction in Sept
Strong demand (89 percent) was seen for coal offered in MSTC’s special forward auction in September 2018 by Coal
India (CIL), as per data available with ICMW. During the month a total of 2,691,000 tons were offered by CIL of which 2,403,100 tons got allotted at a weighted average price of Rs 1,209.
An analysis of the auction revealed that G4, G5, G6, G7, G9, G10, G12, G14, G15, G16 and G17 were the grades offered in September 2018.
Quantity-wise, G17 grade was offered in the highest volume (1.525 mt) and allocation-wise also G13 (1.525 tons) was the topmost. Percentage-wise, G4, G5, G6, G10, G14, G15, G16 and G17 grades achieved 100 percent allotment.
There was no special spot auction via MSTC in August 2018.

October 31, 2018 | 51
SUMMARY tAbLE fOR VARIOUS CIL E-AUCtIONS IN SEPtEMbER 2018
SUMMARY tAbLE fOR VARIOUS CIL E-AUCtIONS PROGRESSIVE’18-19
Auction Type Sum of Quantity Offered (tons)
Sum of Quantity Allotted (tons)
Sum of Total Notified Value
Sum of Total Alloted Value
Increase over Notified Price (%)
Spot 28,66,110 28,17,730 4,26,40,31,870 8,59,71,81,454 101.62
Special Forward 34,14,500 32,51,000 5,88,09,06,000 9,02,29,86,281 53.43
Special Spot 26,91,000 24,03,100 1,90,91,81,450 2,90,46,96,402 52.14
Grand Total 89,71,610 84,71,830 12,05,41,19,320 20,52,48,64,137 70.27
Auction Type Sum of Quantity Offered (tons)
Sum of Quantity Allotted (tons)
Sum of Total Notified Value
Sum of Total Alloted Value
Increase over Notified Price (%)
Spot 2,03,73,319 1,84,66,146 28,35,37,83,821 53,05,94,60,209 87.13
Exclusive 52,17,500 44,74,080 7,49,21,33,640 12,06,99,21,011 61.10
Exclusive Forward 32,41,500 28,29,350 4,00,38,23,400 7,38,11,64,679 84.35
Special Forward 2,77,80,500 2,04,56,974 30,37,03,28,000 52,53,66,40,411 72.99
Special Spot 26,91,000 24,03,100 1,90,91,81,450 2,90,46,96,402 52.14
Grand Total 5,93,03,819 4,86,29,650 72,12,92,50,311 1,27,95,18,82,713 77.39
*e-auction data through coaljuntion and MSTC for the month ended September’2018.
*e-auction data through coaljuntion and MSTC for the period April-September’2018.
E-AUCtION

October 31, 2018 | 52
SPOt E-AUCtIONS HELD IN SEPtEMbER 2018
GCV Range
Grade / GCV Band
Size Name of the Client
e-Auction Date
Mode of Despatch Ex Location
Qty offered
(in Tons)
Qty Alloted
(in Tons)
Notified Price (in Rs./Ton)
Reserve Price (in Rs./Ton)
Average Price (in Rs./Ton)
% Increase
over Notified
Price (%)
% Increase
Over Reserve Price (%)
2201-2500 G17 CCL 12-Sep-18 Road RAJRAPPA REJECTS 1,500 1,500 536 697 1,377 157 98
2201-2500 G17 CRR SCCL 25-Sep-18 Road KOYAGUDEM OC 30,000 15,181 650 650 651 0.13 0.13
2201-2500 Total 31,500 16,681
2501-2800 G16 CCL 11-Sep-18 Road GIDI- W SLURRY 15,000 15,000 604 785 1,338 121 70
2501-2800 G16 CCL 12-Sep-18 RoadKATHARA W. REJECTS (HEAP NO.19D) (P/L)
50,000 50,000 604 785 819 36 4
2501-2800 Total 65,000 65,000
2801-3100 G15 CCL 12-Sep-18 Road RAJRAPPA REJECTS 1,500 1,500 708 920 1,245 76 35
2801-3100 G15 CCL 12-Sep-18 Road PIPARWAR W REJECTS 17,500 17,500 708 920 2,077 193 126
2801-3100 G15 ROM SECL 25-Sep-18 Road Umaria 2,000 2,000 708 850 2,644 273 211
2801-3100 G15 ROM SECL 25-Sep-18 Road Gare Pelma IV / 1 20,000 20,000 708 850 3,244 358 282
2801-3100 G15 RND SCCL 25-Sep-18 Road JK5 OC 30,000 29,954 1,300 1,560 1,934 49 24
2801-3100 Total 71,000 70,954
3101-3400 G14 ROM CCL 11-Sep-18 Road Magadh OC 1,50,000 1,50,000 897 1,166 1,376 53 18
3101-3400 G14 CCL 12-Sep-18 Road GIDI W REJECTS 15,000 15,000 897 1,166 1,332 48 14
3101-3400 G14 n MCL 28-Sep-18 Road Kaniha 50,000 50,000 897 1,077 1,077 20 -
3101-3400 G14 n MCL 28-Sep-18 Road Lakhanpur 70,000 70,000 897 1,077 2,966 231 175
3101-3400 G14 n MCL 28-Sep-18 Road Belpahar 60,000 60,000 897 1,077 2,917 225 171
3101-3400 Total 3,45,000 3,45,000
3401-3700 G13 ROM CCL 11-Sep-18 Road PURNADIH OCP 20,000 20,000 980 1,274 3,030 209 138
3401-3700 G13 ROM CCL 12-Sep-18 Road ROHINI OCP 4,000 4,000 980 1,274 2,918 198 129
3401-3700 G13 ROM SECL 25-Sep-18 Road Balrampur UG (Stock) 20,000 20,000 980 1,176 2,551 160 117
3401-3700 G13 CRR SCCL 25-Sep-18 Road JVR OC 2 20,000 20,000 1,560 1,880 1,933 24 3
3401-3700 G13 CRR SCCL 25-Sep-18 Road RCHP 30,000 30,000 1,560 1,880 2,136 37 14
3401-3700 G13 CRR SCCL 25-Sep-18 Rail GDK OC3 CHP 81,000 81,000 1,560 1,880 2,815 80 50
3401-3700 G13 n MCL 28-Sep-18 Road Kulda 1,00,000 1,00,000 980 1,176 3,959 304 237
3401-3700 G13 n MCL 28-Sep-18 Road Hingula 2,00,000 2,00,000 980 1,176 1,882 92 60
3401-3700 G13 n MCL 28-Sep-18 Road Lajkura 40,000 40,000 980 1,176 3,061 212 160
3401-3700 G13 Steam MCL 28-Sep-18 Road Belpahar 20,000 20,000 1,250 1,500 3,332 167 122
3401-3700 Total 5,35,000 5,35,000
3701-4000 G12CRUROM (-100MM)
WCL 03-Sep-18 Road GONDEGAON OC 21,000 21,000 1,275 1,748 2,658 108 52
3701-4000 G12 CCL 11-Sep-18 RoadPIPARWAR SLURRY (MECHANICAL LOADING)
10,000 6,300 1,063 1,382 1,382 30 -
3701-4000 G12 ROM CCL 11-Sep-18 RoadAMRAPALI COAL SALES CENTRE
1,00,000 1,00,000 1,063 1,382 1,578 48 14
3701-4000 G12 ROM CCL 11-Sep-18 Road ROHINI OCP 10,000 10,000 1,063 1,382 3,185 200 130
3701-4000 G12 CCL 12-Sep-18 Road KEDLA W REJECTS (P/L) 20,000 20,000 1,063 1,382 3,405 220 146
3701-4000 G12 ROM CCL 12-Sep-18 Road TETARIAKHAR OC 5,000 5,000 1,063 1,382 3,148 196 128
3701-4000 G12 ROM CCL 12-Sep-18 Road PURNADIH OCP 5,000 5,000 1,063 1,382 3,153 197 128
3701-4000 G12 ROM SECL 25-Sep-18 Road Gare Pelma IV/2&3 20,000 20,000 1,063 1,276 4,261 301 234
3701-4000 G12CRUROM (-100MM)
WCL 28-Sep-18 Road MOHAN QUARRY 20,000 20,000 1,275 1,748 3,246 155 86
3701-4000 G12CRUROM (-100MM)
WCL 28-Sep-18 Road BHANEGAON OC 42,000 42,000 1,275 1,748 3,070 141 76
E-AUCtION

October 31, 2018 | 53
Detailed Data of Spot e-Auctions held in September 2018, Contd...
GCV Range
Grade / GCV Band
Size Name of the Client
e-Auction Date
Mode of Despatch Ex Location
Qty offered
(in Tons)
Qty Alloted
(in Tons)
Notified Price (in Rs./Ton)
Reserve Price (in Rs./Ton)
Average Price (in Rs./Ton)
% Increase
over Notified
Price (%)
% Increase
Over Reserve Price (%)
3701-4000 G12 n MCL 28-Sep-18 Road Jagannath 60,000 60,000 1,063 1,276 2,856 169 124
3701-4000 G12 n MCL 28-Sep-18 Road Ananta 30,000 30,000 1,063 1,276 2,824 166 121
3701-4000 Total 3,43,000 3,39,300
4001-4300 G11CRUROM (-100MM)
WCL 03-Sep-18 Road PADMAPUR OC 10,000 10,000 1,374 1,877 2,987 117 59
4001-4300 G11CRUROM (-100MM)
WCL 03-Sep-18 Road UKNI OC (COST PLUS) 25,000 11,760 3,141 3,231 3,231 3 0.01
4001-4300 G11CRUROM (-100MM)
WCL 03-Sep-18 RailCHARGAON SIDING (NM UG TO OC (COST PLUS))
1,20,000 1,20,000 2,133 2,133 3,236 52 52
4001-4300 G11 ROM CCL 11-Sep-18 RoadBENTI COAL DUMP ASHOKA
10,000 10,000 1,145 1,489 3,488 205 134
4001-4300 G11 ROM CCL 12-Sep-18 Road GIDI-C 3,000 3,000 1,145 1,489 3,699 223 148
4001-4300 G11 ROM CCL 12-Sep-18 Road PIPARWAR COAL DUMP 10,000 10,000 1,145 1,489 3,506 206 135
4001-4300 G11 SLK SECL 25-Sep-18 Road Bangwar UG 5,000 5,000 1,175 1,410 3,413 190 142
4001-4300 G11 ROM SCCL 25-Sep-18 Road KK - 5 10,000 10,000 2,150 2,580 2,700 26 5
4001-4300 Total 1,93,000 1,79,760
4301-4600 G10CRUROM (-100MM)
WCL 03-Sep-18 RoadBHATADIH OC (COST PLUS)
30,000 30,000 2,574 2,664 3,038 18 14
4301-4600 G10 STM WCL 03-Sep-18 Road MOHAN 9/10 MOURI INCLINE 4,000 3,970 1,744 2,268 3,648 109 61
4301-4600 G10 ROM CCL 11-Sep-18 Road TETARIAKHAR OC 10,000 10,000 1,228 1,596 3,515 186 120
4301-4600 G10 ROM CCL 11-Sep-18 Road GIRIDIH OC 4,000 300 1,228 1,596 1,596 30 -
4301-4600 G10 ROM CCL 12-Sep-18 RoadAMRAPALI COAL SALES CENTRE (SM)
1,00,000 1,00,000 1,228 1,596 1,706 39 7
4301-4600 G10 ROM CCL 12-Sep-18 Road SEL DHORI OCP 10,000 10,000 1,228 1,596 4,459 263 179
4301-4600 G10 ROM CCL 12-Sep-18 Road MAGADH OC 1,00,000 1,00,000 1,228 1,596 1,819 48 14
4301-4600 G10 ROM CCL 12-Sep-18 Road KARO OC 7,000 7,000 1,228 1,596 2,198 79 38
4301-4600 G10 ROM SECL 25-Sep-18 Road Sharda (High Wall) 5,000 5,000 1,228 1,474 4,347 254 195
4301-4600 G10 (-)100 mm NCL 27-Sep-18 Road Jhingurda 80,000 80,000 1,228 1,597 2,895 136 81
4301-4600 G10 (-) 250 mm NCL 27-Sep-18 Road Kakri 20,000 20,000 1,228 1,597 3,506 186 120
4301-4600 G10 STM WCL 28-Sep-18 Road GOKUL OC 7,000 6,960 1,744 2,268 3,684 111 62
4301-4600 G10CRUROM (-100MM)
WCL 28-Sep-18 Road PENGANGA OC 1,05,000 1,05,000 1,474 2,007 3,461 135 72
4301-4600 G10 Steam MCL 28-Sep-18 Road HBI 30,000 30,000 1,498 1,798 3,108 107 73
4301-4600 Total 5,12,000 5,08,230
4601-4900 G9 STM WCL 03-Sep-18 Road CHATTARPUR-I 12,000 11,970 1,912 2,551 2,553 34 0.09
4601-4900 G9 STM WCL 03-Sep-18 RoadDINESH (MAKARDHOKRA-III) OC
7,200 7,200 1,912 2,486 3,176 66 28
4601-4900 G9 CCL 11-Sep-18 Road RAJRAPPA-SLURRY 3,000 3,000 1,368 1,778 1,799 32 1
4601-4900 G9 ROM CCL 12-Sep-18 Road GOVINDPUR PHASE II OCP 3,000 3,000 1,368 1,778 4,512 230 154
4601-4900 G9 ROM CCL 12-Sep-18 Road URIMARI OCP 5,000 5,000 1,368 1,778 4,423 223 149
4601-4900 G9 ROM CCL 12-Sep-18 Road CHURI 200 200 1,368 1,778 1,778 30 -
4601-4900 G9 ROM SECL 25-Sep-18 Road KURASIA UG 10,000 10,000 1,368 1,642 4,405 222 168
4601-4900 G9 SLK WCL 28-Sep-18 Road MANA 2,100 2,100 1,672 2,174 3,730 123 72
4601-4900 G9 CRR SCCL 25-Sep-18 RoadMNG OC (MANUGURU)-(NEW MINE)
25,000 18,921 2,860 3,440 3,440 20 -
4601-4900 G9 Steam MCL 28-Sep-18 Road Orient - 2 30,000 30,000 1,638 1,966 3,139 92 60
E-AUCtION
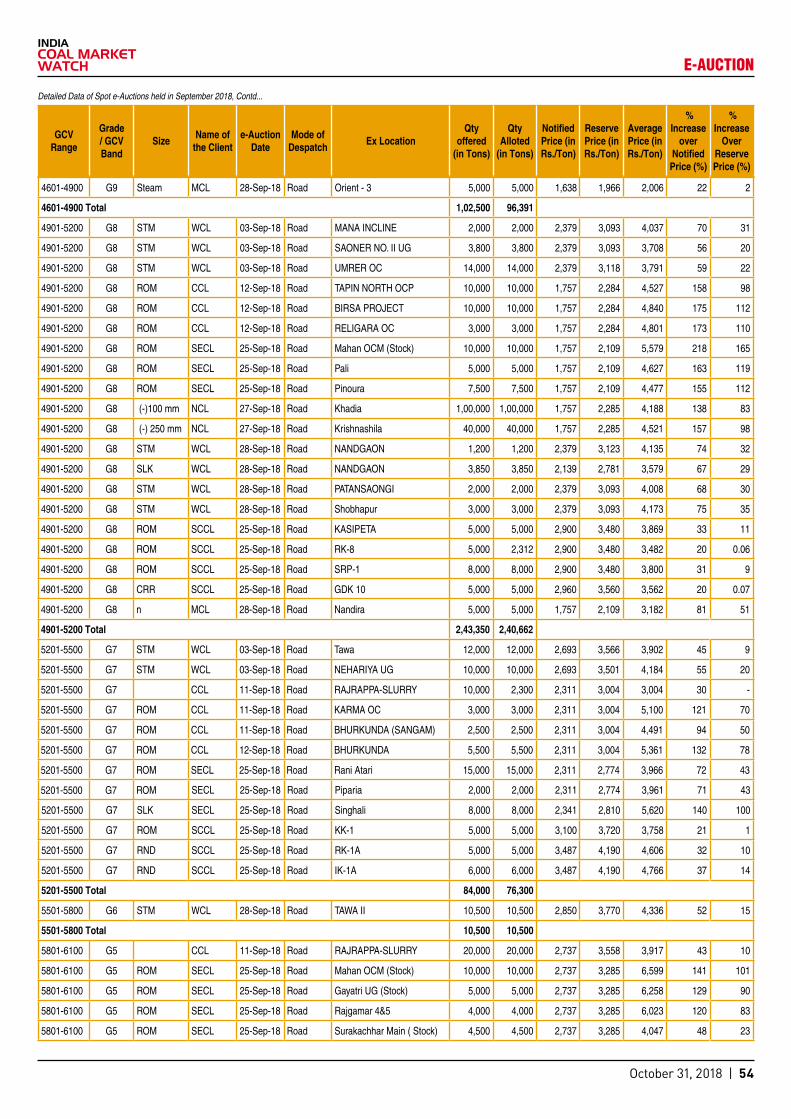
October 31, 2018 | 54
4601-4900 G9 Steam MCL 28-Sep-18 Road Orient - 3 5,000 5,000 1,638 1,966 2,006 22 2
4601-4900 Total 1,02,500 96,391
4901-5200 G8 STM WCL 03-Sep-18 Road MANA INCLINE 2,000 2,000 2,379 3,093 4,037 70 31
4901-5200 G8 STM WCL 03-Sep-18 Road SAONER NO. II UG 3,800 3,800 2,379 3,093 3,708 56 20
4901-5200 G8 STM WCL 03-Sep-18 Road UMRER OC 14,000 14,000 2,379 3,118 3,791 59 22
4901-5200 G8 ROM CCL 12-Sep-18 Road TAPIN NORTH OCP 10,000 10,000 1,757 2,284 4,527 158 98
4901-5200 G8 ROM CCL 12-Sep-18 Road BIRSA PROJECT 10,000 10,000 1,757 2,284 4,840 175 112
4901-5200 G8 ROM CCL 12-Sep-18 Road RELIGARA OC 3,000 3,000 1,757 2,284 4,801 173 110
4901-5200 G8 ROM SECL 25-Sep-18 Road Mahan OCM (Stock) 10,000 10,000 1,757 2,109 5,579 218 165
4901-5200 G8 ROM SECL 25-Sep-18 Road Pali 5,000 5,000 1,757 2,109 4,627 163 119
4901-5200 G8 ROM SECL 25-Sep-18 Road Pinoura 7,500 7,500 1,757 2,109 4,477 155 112
4901-5200 G8 (-)100 mm NCL 27-Sep-18 Road Khadia 1,00,000 1,00,000 1,757 2,285 4,188 138 83
4901-5200 G8 (-) 250 mm NCL 27-Sep-18 Road Krishnashila 40,000 40,000 1,757 2,285 4,521 157 98
4901-5200 G8 STM WCL 28-Sep-18 Road NANDGAON 1,200 1,200 2,379 3,123 4,135 74 32
4901-5200 G8 SLK WCL 28-Sep-18 Road NANDGAON 3,850 3,850 2,139 2,781 3,579 67 29
4901-5200 G8 STM WCL 28-Sep-18 Road PATANSAONGI 2,000 2,000 2,379 3,093 4,008 68 30
4901-5200 G8 STM WCL 28-Sep-18 Road Shobhapur 3,000 3,000 2,379 3,093 4,173 75 35
4901-5200 G8 ROM SCCL 25-Sep-18 Road KASIPETA 5,000 5,000 2,900 3,480 3,869 33 11
4901-5200 G8 ROM SCCL 25-Sep-18 Road RK-8 5,000 2,312 2,900 3,480 3,482 20 0.06
4901-5200 G8 ROM SCCL 25-Sep-18 Road SRP-1 8,000 8,000 2,900 3,480 3,800 31 9
4901-5200 G8 CRR SCCL 25-Sep-18 Road GDK 10 5,000 5,000 2,960 3,560 3,562 20 0.07
4901-5200 G8 n MCL 28-Sep-18 Road Nandira 5,000 5,000 1,757 2,109 3,182 81 51
4901-5200 Total 2,43,350 2,40,662
5201-5500 G7 STM WCL 03-Sep-18 Road Tawa 12,000 12,000 2,693 3,566 3,902 45 9
5201-5500 G7 STM WCL 03-Sep-18 Road NEHARIYA UG 10,000 10,000 2,693 3,501 4,184 55 20
5201-5500 G7 CCL 11-Sep-18 Road RAJRAPPA-SLURRY 10,000 2,300 2,311 3,004 3,004 30 -
5201-5500 G7 ROM CCL 11-Sep-18 Road KARMA OC 3,000 3,000 2,311 3,004 5,100 121 70
5201-5500 G7 ROM CCL 11-Sep-18 Road BHURKUNDA (SANGAM) 2,500 2,500 2,311 3,004 4,491 94 50
5201-5500 G7 ROM CCL 12-Sep-18 Road BHURKUNDA 5,500 5,500 2,311 3,004 5,361 132 78
5201-5500 G7 ROM SECL 25-Sep-18 Road Rani Atari 15,000 15,000 2,311 2,774 3,966 72 43
5201-5500 G7 ROM SECL 25-Sep-18 Road Piparia 2,000 2,000 2,311 2,774 3,961 71 43
5201-5500 G7 SLK SECL 25-Sep-18 Road Singhali 8,000 8,000 2,341 2,810 5,620 140 100
5201-5500 G7 ROM SCCL 25-Sep-18 Road KK-1 5,000 5,000 3,100 3,720 3,758 21 1
5201-5500 G7 RND SCCL 25-Sep-18 Road RK-1A 5,000 5,000 3,487 4,190 4,606 32 10
5201-5500 G7 RND SCCL 25-Sep-18 Road IK-1A 6,000 6,000 3,487 4,190 4,766 37 14
5201-5500 Total 84,000 76,300
5501-5800 G6 STM WCL 28-Sep-18 Road TAWA II 10,500 10,500 2,850 3,770 4,336 52 15
5501-5800 Total 10,500 10,500
5801-6100 G5 CCL 11-Sep-18 Road RAJRAPPA-SLURRY 20,000 20,000 2,737 3,558 3,917 43 10
5801-6100 G5 ROM SECL 25-Sep-18 Road Mahan OCM (Stock) 10,000 10,000 2,737 3,285 6,599 141 101
5801-6100 G5 ROM SECL 25-Sep-18 Road Gayatri UG (Stock) 5,000 5,000 2,737 3,285 6,258 129 90
5801-6100 G5 ROM SECL 25-Sep-18 Road Rajgamar 4&5 4,000 4,000 2,737 3,285 6,023 120 83
5801-6100 G5 ROM SECL 25-Sep-18 Road Surakachhar Main ( Stock) 4,500 4,500 2,737 3,285 4,047 48 23
E-AUCtION
Detailed Data of Spot e-Auctions held in September 2018, Contd...
GCV Range
Grade / GCV Band
Size Name of the Client
e-Auction Date
Mode of Despatch Ex Location
Qty offered
(in Tons)
Qty Alloted
(in Tons)
Notified Price (in Rs./Ton)
Reserve Price (in Rs./Ton)
Average Price (in Rs./Ton)
% Increase
over Notified
Price (%)
% Increase
Over Reserve Price (%)
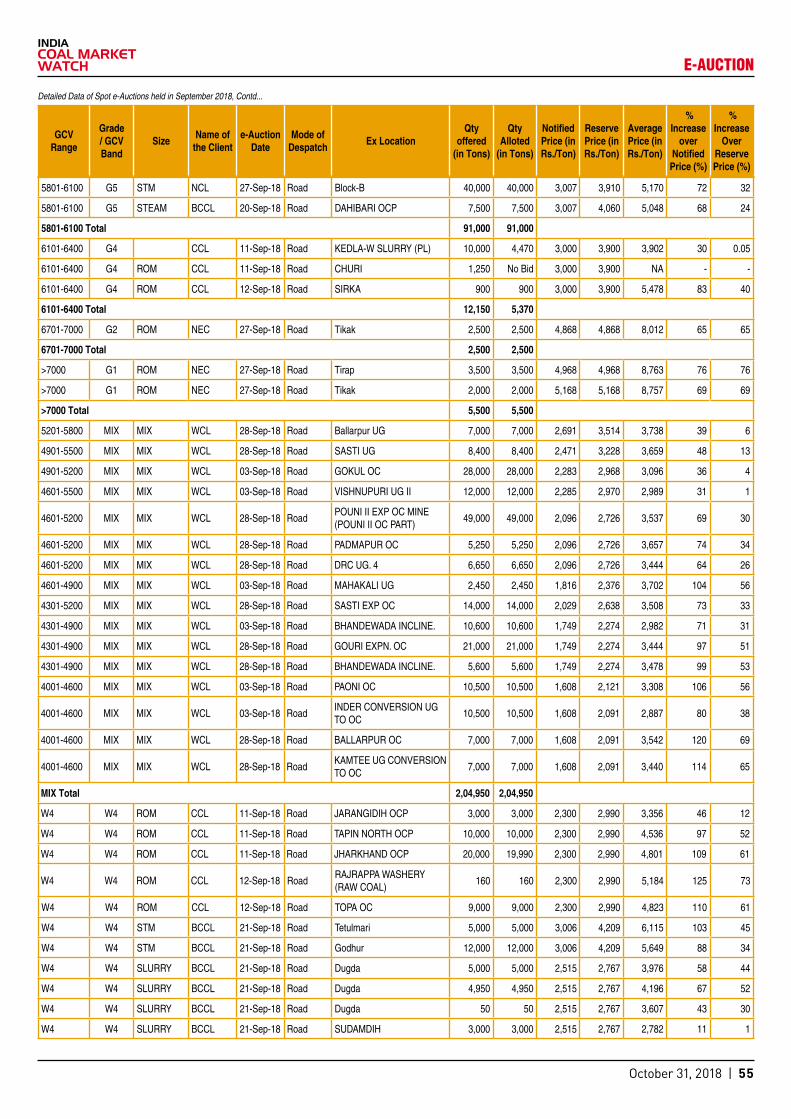
October 31, 2018 | 55
5801-6100 G5 STM NCL 27-Sep-18 Road Block-B 40,000 40,000 3,007 3,910 5,170 72 32
5801-6100 G5 STEAM BCCL 20-Sep-18 Road DAHIBARI OCP 7,500 7,500 3,007 4,060 5,048 68 24
5801-6100 Total 91,000 91,000
6101-6400 G4 CCL 11-Sep-18 Road KEDLA-W SLURRY (PL) 10,000 4,470 3,000 3,900 3,902 30 0.05
6101-6400 G4 ROM CCL 11-Sep-18 Road CHURI 1,250 No Bid 3,000 3,900 NA - -
6101-6400 G4 ROM CCL 12-Sep-18 Road SIRKA 900 900 3,000 3,900 5,478 83 40
6101-6400 Total 12,150 5,370
6701-7000 G2 ROM NEC 27-Sep-18 Road Tikak 2,500 2,500 4,868 4,868 8,012 65 65
6701-7000 Total 2,500 2,500
>7000 G1 ROM NEC 27-Sep-18 Road Tirap 3,500 3,500 4,968 4,968 8,763 76 76
>7000 G1 ROM NEC 27-Sep-18 Road Tikak 2,000 2,000 5,168 5,168 8,757 69 69
>7000 Total 5,500 5,500
5201-5800 MIX MIX WCL 28-Sep-18 Road Ballarpur UG 7,000 7,000 2,691 3,514 3,738 39 6
4901-5500 MIX MIX WCL 28-Sep-18 Road SASTI UG 8,400 8,400 2,471 3,228 3,659 48 13
4901-5200 MIX MIX WCL 03-Sep-18 Road GOKUL OC 28,000 28,000 2,283 2,968 3,096 36 4
4601-5500 MIX MIX WCL 03-Sep-18 Road VISHNUPURI UG II 12,000 12,000 2,285 2,970 2,989 31 1
4601-5200 MIX MIX WCL 28-Sep-18 RoadPOUNI II EXP OC MINE (POUNI II OC PART)
49,000 49,000 2,096 2,726 3,537 69 30
4601-5200 MIX MIX WCL 28-Sep-18 Road PADMAPUR OC 5,250 5,250 2,096 2,726 3,657 74 34
4601-5200 MIX MIX WCL 28-Sep-18 Road DRC UG. 4 6,650 6,650 2,096 2,726 3,444 64 26
4601-4900 MIX MIX WCL 03-Sep-18 Road MAHAKALI UG 2,450 2,450 1,816 2,376 3,702 104 56
4301-5200 MIX MIX WCL 28-Sep-18 Road SASTI EXP OC 14,000 14,000 2,029 2,638 3,508 73 33
4301-4900 MIX MIX WCL 03-Sep-18 Road BHANDEWADA INCLINE. 10,600 10,600 1,749 2,274 2,982 71 31
4301-4900 MIX MIX WCL 28-Sep-18 Road GOURI EXPN. OC 21,000 21,000 1,749 2,274 3,444 97 51
4301-4900 MIX MIX WCL 28-Sep-18 Road BHANDEWADA INCLINE. 5,600 5,600 1,749 2,274 3,478 99 53
4001-4600 MIX MIX WCL 03-Sep-18 Road PAONI OC 10,500 10,500 1,608 2,121 3,308 106 56
4001-4600 MIX MIX WCL 03-Sep-18 RoadINDER CONVERSION UG TO OC
10,500 10,500 1,608 2,091 2,887 80 38
4001-4600 MIX MIX WCL 28-Sep-18 Road BALLARPUR OC 7,000 7,000 1,608 2,091 3,542 120 69
4001-4600 MIX MIX WCL 28-Sep-18 RoadKAMTEE UG CONVERSION TO OC
7,000 7,000 1,608 2,091 3,440 114 65
MIX Total 2,04,950 2,04,950
W4 W4 ROM CCL 11-Sep-18 Road JARANGIDIH OCP 3,000 3,000 2,300 2,990 3,356 46 12
W4 W4 ROM CCL 11-Sep-18 Road TAPIN NORTH OCP 10,000 10,000 2,300 2,990 4,536 97 52
W4 W4 ROM CCL 11-Sep-18 Road JHARKHAND OCP 20,000 19,990 2,300 2,990 4,801 109 61
W4 W4 ROM CCL 12-Sep-18 RoadRAJRAPPA WASHERY (RAW COAL)
160 160 2,300 2,990 5,184 125 73
W4 W4 ROM CCL 12-Sep-18 Road TOPA OC 9,000 9,000 2,300 2,990 4,823 110 61
W4 W4 STM BCCL 21-Sep-18 Road Tetulmari 5,000 5,000 3,006 4,209 6,115 103 45
W4 W4 STM BCCL 21-Sep-18 Road Godhur 12,000 12,000 3,006 4,209 5,649 88 34
W4 W4 SLURRY BCCL 21-Sep-18 Road Dugda 5,000 5,000 2,515 2,767 3,976 58 44
W4 W4 SLURRY BCCL 21-Sep-18 Road Dugda 4,950 4,950 2,515 2,767 4,196 67 52
W4 W4 SLURRY BCCL 21-Sep-18 Road Dugda 50 50 2,515 2,767 3,607 43 30
W4 W4 SLURRY BCCL 21-Sep-18 Road SUDAMDIH 3,000 3,000 2,515 2,767 2,782 11 1
E-AUCtION
Detailed Data of Spot e-Auctions held in September 2018, Contd...
GCV Range
Grade / GCV Band
Size Name of the Client
e-Auction Date
Mode of Despatch Ex Location
Qty offered
(in Tons)
Qty Alloted
(in Tons)
Notified Price (in Rs./Ton)
Reserve Price (in Rs./Ton)
Average Price (in Rs./Ton)
% Increase
over Notified
Price (%)
% Increase
Over Reserve Price (%)

October 31, 2018 | 56
W4 W4 SLURRY BCCL 21-Sep-18 Road Madhuban 10,000 2,900 2,515 2,767 2,767 10 -
W4 W4 STEAM BCCL 20-Sep-18 Road MAHESHPUR 500 - 3,006 4,209 - - -
W3 W3 ROM CCL 11-Sep-18 Road SEL DHORI OCP 10,000 10,000 2,750 3,575 4,477 63 25
W3 W3 ROM CCL 12-Sep-18 Road JARANGIDIH OCP 3,000 3,000 2,750 3,575 3,756 37 5
W3 W3 STM BCCL 21-Sep-18 Road MURAIDIH(SATABDI) 2,000 2,000 3,150 4,410 4,429 41 0.43
W3 W3 STM BCCL 21-Sep-18 Road PHULARITAND 6,000 6,000 3,150 4,410 4,438 41 1
W3 W3 STM BCCL 21-Sep-18 RoadAMALGAMATED BLOCK-II(JAMUNIA)
5,000 5,000 3,150 4,410 4,422 40 0.26
W3 W3 STM BCCL 21-Sep-18 Road NEW AKASHKINAREE 1,000 1,000 3,150 4,410 4,430 41 0.45
W3 W3 STM BCCL 21-Sep-18 RoadAKWM OCP (KUMARIJORE PATCH)
12,000 12,000 3,150 4,410 6,156 95 40
W3 W3 STM BCCL 21-Sep-18 Road S.Bansjora 8,000 8,000 3,150 4,410 6,069 93 38
W3 W3 STM BCCL 21-Sep-18 Road Bastacolla 500 500 3,150 4,410 5,962 89 35
W3 W3 STEAM BCCL 20-Sep-18 Road KUYA OCP OUTSOURCED 2,000 2,000 3,150 4,410 5,859 86 33
W3 W3 STEAM BCCL 20-Sep-18 Road SOUTH JHARIA 10,000 10,000 3,150 4,410 5,969 90 35
W3 W3 STEAM BCCL 20-Sep-18 Road KUYA OCP 6,000 6,000 3,150 4,410 5,879 87 33
W3 W3 STEAM BCCL 20-Sep-18 Road BASTACOLLA 500 500 3,150 4,410 5,310 69 20
W3 W3 STEAM BCCL 20-Sep-18 Road NTST OCP 10,000 10,000 3,150 4,410 5,953 89 35
W3 W3 STEAM BCCL 20-Sep-18 Road MURAIDIH 3,000 3,000 3,150 4,410 4,462 42 1
W3 W3 STEAM BCCL 20-Sep-18 RoadAMALGAMATED BLOCK-II(BENEDIH)
3,000 3,000 3,150 4,410 4,443 41 1
W3 W3 STEAM BCCL 20-Sep-18 RoadAMALGAMATED BLOCK-II(NUDKHURKEE)
3,000 3,000 3,150 4,410 4,442 41 1
W3 W3 STEAM BCCL 20-Sep-18 RoadNEW AKASHKINAREE (HIRED)
10,000 10,000 3,150 4,410 4,432 41 0.49
W3 W3 STEAM BCCL 20-Sep-18 Road BLOCK IV 1,000 1,000 3,150 4,410 4,410 40 -
W3 W3 STEAM BCCL 20-Sep-18 RoadAKWM OCP (KANTAPAHARI PATCH)
10,000 10,000 3,150 4,410 4,415 40 0.11
W3 W3 STEAM BCCL 20-Sep-18 Road NICHITPUR SSY 5,000 5,000 3,150 4,410 5,840 85 32
W2 W2 STM BCCL 21-Sep-18 Road Jogidih 500 No Bid 3,906 5,469 NA - -
W2 W2 STEAM BCCL 20-Sep-18 Road DAMAGORIA 10,000 4,950 3,906 5,469 5,470 40 0.02
WG4 WG4 MIX WCL 03-Sep-18 Road TANDSI UG 10,000 10,000 2,910 2,910 3,474 19 19
WG WG R SCCL 25-Sep-18 Road MNG (WASHERY) 50,000 38,964 138 138 138 0.05 0.05
WG WG R SCCL 25-Sep-18 Road GLOBAL WASHERY 10,000 9,792 138 138 138 - -
WG WG SL SCCL 25-Sep-18 Road GLOBAL WASHERY 10,000 1,071 427 427 429 0.44 0.44
WG WG SL SCCL 25-Sep-18 Road MNG (WASHERY) 25,000 14,705 427 427 427 - -
WG WG R SCCL 25-Sep-18 Rail MNG (WASHERY) 81,000 24,300 138 138 138 - -
WG, W4, W3 & W2 Total 3,90,160 2,89,832
UNGRADED UNGRADED REJECTS BCCL 21-Sep-18 Road Patherdih 40,000 40,000 719 719 1,928 168 168
UNGRADED UNGRADED Crushed NCL 27-Sep-18 Road Bina 25,000 25,000 536 697 2,254 320 223
UNGRADED LOGRD SCCL 25-Sep-18 Road KOYAGUDEM OC2 20,000 20,000 100 100 210 110 110
UNGRADED Total 85,000 85,000
Grand Total 33,27,110 31,67,930
E-AUCtION
Detailed Data of Spot e-Auctions held in September 2018, Contd...
GCV Range
Grade / GCV Band
Size Name of the Client
e-Auction Date
Mode of Despatch Ex Location
Qty offered
(in Tons)
Qty Alloted
(in Tons)
Notified Price (in Rs./Ton)
Reserve Price (in Rs./Ton)
Average Price (in Rs./Ton)
% Increase
over Notified
Price (%)
% Increase
Over Reserve Price (%)

October 31, 2018 | 57
Monthwise Quantity Offered & Alloted through Coaljunction & MStC E-Auction
MONTH OFFERED QTY (in tons)
ALLOTED QTY (in tons)
Variation (In Percent)
Oct-17 53,90,770 47,20,539 -12.43%
Nov-17 67,86,114 58,22,990 -14.19%
Dec-17 1,06,35,204 96,29,698 -9.45%
Jan-18 63,18,680 50,78,216 -19.63%
Feb-18 78,14,192 62,44,595 -20.09%
Mar-18 59,80,206 41,57,027 -30.49%
Apr-18 46,24,104 38,83,268 -16.02%
May-18 49,63,364 40,99,200 -17.41%
Jun-18 50,98,220 37,52,669 -26.39%
Jul-18 32,37,731 25,77,663 -20.39%
Aug-18 25,56,790 23,67,848 -7.39%
Sep-18 33,27,110 31,67,930 -4.78%
0
25,00,000
50,00,000
75,00,000
1,00,00,000
Oct
-17
Nov
-17
Dec
-17
Jan-
18
Feb-
18
Mar
-18
Apr
-18
May
-18
Jun-
18
Jul-1
8
Aug
-18
Sep
-18
Qty
Offe
red
In T
ons
OFFERED BY ROAD OFFERED BY RAIL
Monthly data of offered quantitythrough coaljunction & MStC (road & rail)*
0
20,00,000
40,00,000
60,00,000
80,00,000
1,00,00,000
1,20,00,000O
ct-1
7
Nov
-17
Dec
-17
Jan-
18
Feb-
18
Mar
-18
Apr
-18
May
-18
Jun-
18
Jul-1
8
Aug
-18
Sep
-18
Qua
ntity
in
Ton
s
OFFERED QTY (in tons) ALLOTED QTY (in tons)
-
1,80,000
3,60,000
5,40,000
7,20,000
9,00,000
BC
CL
RAI
L
BC
CL
RO
AD
CC
L R
AIL
CC
L R
OA
D
EC
L R
AIL
EC
L R
OA
D
MC
L R
AIL
MC
L R
OA
D
NC
L R
AIL
NC
L R
OA
D
NE
C R
AIL
NE
C R
OA
D
SC
CL
RAI
L
SC
CL
RO
AD
SEC
L R
AIL
SEC
L R
OA
D
WC
L R
AIL
WC
L R
OA
D
Qua
ntity
In T
ons
Companies
Aug-18 QTY OFFERED Aug-18 QTY ALLOTED
Sep-18 QTY OFFERED Sep-18 QTY ALLOTED
Quantity offered & sold throughcoaljunction & MStC
Companywise quantity offered & sold through coaljunction & MStC in Aug’18 vs Sept’18
Monthly data of offered quantity through coaljunction & MStC (road & rail)
MONTH OFFERED BY ROAD OFFERED BY RAIL
Oct-17 52,54,480 1,36,290
Nov-17 62,72,400 5,13,714
Dec-17 97,46,730 8,88,474
Jan-18 61,46,680 1,72,000
Feb-18 70,62,650 7,51,542
Mar-18 55,65,490 4,14,716
Apr-18 40,82,040 5,42,064
May-18 49,12,000 51,364
Jun-18 49,18,220 1,80,000
Jul-18 30,52,731 1,85,000
Aug-18 25,56,790 0
Sep-18 30,45,110 2,82,000
CompanyAugust 2018 September 2018 Variation (In Percent)
Qty Offered
Qty Alloted
Qty Offered
Qty Alloted
Offered Qty
Alloted Qty
BCCL RAILBCCL ROAD 2,98,300 1,74,250 1,96,500 1,83,350 -34.13% 5.22%CCL RAILCCL ROAD 7,37,280 7,25,100 8,21,010 7,99,120 11.36% 10.21%ECL RAILECL ROAD 1,62,110 1,61,978 MCL RAILMCL ROAD 6,15,000 5,70,000 7,00,000 7,00,000 13.82% 22.81%NCL RAILNCL ROAD 3,05,000 3,05,000 3,05,000 3,05,000 0.00% 0.00%NEC RAILNEC ROAD 6,000 6,000 8,000 8,000 33.33% 33.33%SCCL RAIL 1,62,000 1,05,300 SCCL ROAD 2,99,000 2,44,900 SECL RAILSECL ROAD 1,53,000 1,53,000 WCL RAIL 1,20,000 1,20,000 WCL ROAD 4,33,100 4,25,520 5,62,600 5,49,260 29.90% 29.08%TOTAL 25,56,790 23,67,848 33,27,110 31,67,930 -23.15% -25.26%
Companywise quantity offered & alloted through coaljunction & MStC in Aug’18 vs Sept’18 via rail & road
Note: E-auction data through coaljuntion and MSTC for the period ended August’18 Vs September’18. Note: E-auction data through coaljuntion and MSTC for the period ended August’18 Vs September’18.
Note: E-auction data through coaljuntion and MSTC for the period ended October’2017 - September’2018. Note: E-auction data through coaljuntion and MSTC for the period ended October’2017 - September’2018.
Note: E-auction data through coaljuntion and MSTC for the period ended October’2017 - September’2018. Note: E-auction data through coaljuntion and MSTC for the period ended October’2017 - September’2018.
Qty. In Tons Qty. In Tons
Qty. In Tons
E-AUCtION

October 31, 2018 | 58
Comparision - quantity offered & sold through coaljunction E-AuctionQty. in tons
MONTH OFFERED QTY (in tons)
ALOTTED QTY (in tons)
Variation (Qty offered vs Qty sold)
April'18 - September'18 1,68,39,864 1,41,51,439 -15.96%
April'17 - September'17 1,28,33,502 84,35,391 -34.27%
Variation 31.22% 67.76%
Comaprision - reserve price and realised price realised through coaljunction E-AuctionPrice in Rs. Crore
MONTH Average Reserve Price of Allotted Quantity
Average Realised Price of Allotted Quantity Gain over Reserve Price
April'18 - September'18 1880 2825 50.23%
April'17 - September'17 1805 2258 25.11%
Variation 4.17% 25.08%
Companywise Data of Alloted Quantity through Coaljunction & MStC in September’18 (Road & Rail)
Client RAIL ROAD Grand Total
BCCL - 1,83,350 1,83,350
CCL - 7,99,120 7,99,120
ECL - - -
MCL - 7,00,000 7,00,000
NCL - 3,05,000 3,05,000
NEC - 8,000 8,000
SCCL 1,05,300 2,44,900 3,50,200
SECL - 1,53,000 1,53,000
WCL 1,20,000 5,49,260 6,69,260
Grand Total 2,25,300 29,42,630 31,67,930
-
1,80,000
3,60,000
5,40,000
7,20,000
9,00,000
BCCL CCL ECL MCL NCL NEC SCCL SECL WCL
Qua
ntity
(in
Ton
s)
SUBSIDIARY NAME
ROAD RAIL
Companywise Data of Alloted Quantity through Coaljunction & MStC in September’18 (Road & Rail)
Note: E-auction data through coaljuntion and MSTC for the month ended September’2018 Note: E-auction data through coaljuntion and MSTC for the month ended September’2018
Qty. In Tons
E-AUCtION

October 31, 2018 | 59
SPECIAL SPOt E-AUCtIONS HELD IN SEPtEMbER 2018
GCV Range
Grade / GCV Band
Size Client e-Auction Date
Mode of Despatch Ex Location
Qty offered
(In tons)
Qty Alloted
(In tons)
(ANP)Average Notified
Price(in Rs)
(ARP)Average Reserve
Price (In Rs)
(AAP) Average
Auctioned Price
(in Rs)
% Increase
over Notified
Price (%)
% Increase
Over Reserve Price (%)
2201-2500 G17 n CCL 14-Sep-18 RailKATHARA-W NEW SIDING
15,00,000 15,00,000 536 697 717 34 3
2201-2500 G17 n CCL 14-Sep-18 RoadSWANG W. REJECTS
25,000 25,000 536 697 1,197 123 72
2201-2500 Total 15,25,000 15,25,000
2501-2800 G16 n CCL 14-Sep-18 RoadKARGALI W REJECTS (P/L)
50,000 50,000 604 785 1,287 113 64
2501-2800 G16 n CCL 14-Sep-18 Road GIDI-W SLURRY 50,000 50,000 604 785 855 42 9
2501-2800 Total 1,00,000 1,00,000
2801-3100 G15 n CCL 14-Sep-18 RoadPIPARWAR W REJECTS
20,000 20,000 708 920 1,996 182 117
2801-3100 Total 20,000 20,000
3101-3400 G14 n CCL 14-Sep-18 Road GIDI W REJECTS 50,000 50,000 897 1,166 1,639 83 41
3101-3400 Total 50,000 50,000
3701-4000 G12 n CCL 14-Sep-18 Rail CHAINPUR 60,000 60,000 1,063 1,382 2,469 132 79
3701-4000 G12 n CCL 14-Sep-18 RoadSWANG W. SLURRY
30,000 3,950 1,063 1,382 1,384 30 0.16
3701-4000 G12 n CCL 14-Sep-18 Road
PIPARWAR SLURRY (MECHANICAL LOADING)
50,000 2,000 1,063 1,382 1,382 30 -
3701-4000 G12 ROM CCL 14-Sep-18 Road Magadh OC 1,00,000 1,00,000 1,063 1,382 1,959 84 42
3701-4000 G12 ROM CCL 14-Sep-18 RoadAmrapali Coal Sales Centre
1,00,000 1,00,000 1,063 1,382 1,501 41 9
3701-4000 Total 3,40,000 2,65,950
4301-4600 G10 ROM CCL 14-Sep-18 Road Magadh OC 1,00,000 1,00,000 1,228 1,596 2,308 88 45
4301-4600 G10 ROM CCL 14-Sep-18 RoadAmrapali Coal Sales Centre (SM)
2,00,000 2,00,000 1,228 1,596 1,602 30 0.36
4301-4600 Total 3,00,000 3,00,000
4601-4900 G9 n CCL 14-Sep-18 RoadKATHARA W. SLURRY
2,30,000 44,350 1,368 1,778 1,778 30 -
4601-4900 Total 2,30,000 44,350
5201-5500 G7 n CCL 14-Sep-18 RoadKATHARA W. SLURRY
36,000 7,800 2,311 3,004 3,004 30 -
5201-5500 Total 36,000 7,800
5501-5800 G6 n CCL 14-Sep-18 RoadKEDLA-W SLURRY (PL)
30,000 30,000 2,524 3,281 4,557 81 39
5501-5800 Total 30,000 30,000
5801-6100 G5 n CCL 14-Sep-18 RoadRAJRAPPA-SLURRY
50,000 50,000 2,737 3,558 4,631 69 30
5801-6100 Total 50,000 50,000
6101-6400 G4 n CCL 14-Sep-18 RoadKEDLA-W SLURRY (PL)
10,000 10,000 3,000 3,900 4,668 56 20
6101-6400 Total 10,000 10,000
Grand Total 26,91,000 24,03,100
E-AUCtION

October 31, 2018 | 60
SPECIAL fORWARD E-AUCtIONS HELD IN SEPtEMbER 2018
GCV Range
Grade / GCV Band
Size Client e-Auction Date
Mode of Despatch Ex Location
Qty offered
(in tons)
Qty Alloted
(in tons)
(ANP)Average Notified Price (in
Rs)
(ARP)Average Reserve Price (in
Rs)
(AAP) Average
Auctioned Price (in
Rs)
% Increase
over Notified
Price (%)
% Increase
Over Reserve
Price (%)
2801-3100 G15 ROM SECL 29-Sep-18 Road Gare Pelma IV/1 50,000 48,000 590 649 2,066 250 218
2801-3100 Total 50,000 48,000
3101-3400 G14 ROM SECL 29-Sep-18 Road Gare Pelma IV/2&3 17,000 16,000 748 823 918 23 12
3101-3400 G14 ROM SECL 29-Sep-18 Road Chhal OC 30,000 28,000 748 823 3,064 310 272
3101-3400 Total 47,000 44,000
3401-3700 G13 ROM SECL 29-Sep-18 RoadMahan II OC (Forest Land)(Stock)
25,000 24,000 817 899 3,112 281 246
3401-3700 G13 ROM SECL 29-Sep-18 Road Manikpur OC 85,000 84,000 817 899 3,159 287 251
3401-3700 Total 1,10,000 1,08,000
3701-4000 G12 ROM SECL 29-Sep-18 Road Gare Pelma IV/2&3 30,000 28,000 886 975 3,801 329 290
3701-4000 G12 ROM SECL 29-Sep-18 Road Jampali OC 15,000 12,000 886 975 3,988 350 309
3701-4000 G12 ROM CCL 13-Sep-18 Road Magadh OC 2,00,000 2,00,000 886 1,019 1,554 75 52
3701-4000 Total 2,45,000 2,40,000
4301-4600 G10ROM (-100 MM)
CCL 13-Sep-18 RoadAMRAPALI COAL SALES CENTRE
7,00,000 7,00,000 1,024 1,178 1,903 86 62
4301-4600 Total 7,00,000 7,00,000
4601-4900 G9 ROM SECL 29-Sep-18 Road Kurasia UG 10,000 8,000 1,140 1,254 3,319 191 165
4601-4900 Total 10,000 8,000
4901-5200 G8ROM (-100 MM)
BCCL 14-Sep-18 Road DAHIBARI 90,000 90,000 1,465 1,685 2,549 74 51
4901-5200 Total 90,000 90,000
5201-5500 G7 ROM SECL 29-Sep-18 RoadMahan II OC (Forest Land) (Stock)
15,000 12,000 1,926 2,119 4,332 125 104
5201-5500 G7 ROM SECL 29-Sep-18 Road Amadand UG 5,000 4,000 1,926 2,119 4,989 159 135
5201-5500 Total 20,000 16,000
5501-5800 G6 ROM SECL 29-Sep-18 Road Rehar UG (Stock) 7,500 4,000 2,317 2,549 5,639 143 121
5501-5800 G6 ROM SECL 29-Sep-18 Road Kumda 7&8 5,000 4,000 2,317 2,549 5,659 144 122
5501-5800 G6ROM (-100 MM)
BCCL 14-Sep-18 Road EAST BASSURIA 30,000 28,000 2,317 2,665 2,665 15 -
5501-5800 G6ROM (-100 MM)
BCCL 14-Sep-18 Road DAHIBARI 30,000 28,000 2,317 2,665 2,665 15 -
5501-5800 Total 72,500 64,000
5801-6100 G5 ROM SECL 29-Sep-18 Road Mahamaya UG 5,000 4,000 2,737 3,011 3,771 38 25
5801-6100 G5 ROM SECL 29-Sep-18 Road Vijay West 10,000 8,000 2,737 3,011 3,731 36 24
5801-6100 Total 15,000 12,000
E-AUCtION

October 31, 2018 | 61
W4 W4ROM (-100 MM)
BCCL 14-Sep-18 Road NEW AKASHKINAREE 60,000 60,000 2,280 2,508 2,555 12 2
W4 W4ROM (-100 MM)
BCCL 14-Sep-18 Road AKWM OCP 3,00,000 3,00,000 2,280 2,508 3,615 59 44
W4 W4ROM (-100 MM)
BCCL 14-Sep-18 Road SALANPUR 10,000 8,000 2,280 2,508 2,578 13 3
W4 W4ROM (-100 MM)
BCCL 14-Sep-18 Road S. BANSJORA 60,000 60,000 2,280 2,508 3,209 41 28
W4 W4ROM (-100 MM)
BCCL 14-Sep-18 Road NICHITPUR 60,000 60,000 2,280 2,508 3,552 56 42
W4 W4ROM (-100 MM)
BCCL 14-Sep-18 Road TETULMARI 40,000 40,000 2,280 2,508 2,991 31 19
W4 W4ROM (-100 MM)
BCCL 14-Sep-18 Road Godhur 90,000 90,000 2,280 2,508 3,703 62 48
W4 W4ROM (-100 MM)
BCCL 14-Sep-18 RoadBASTACOLLA (CHANDMARI)
15,000 15,000 2,280 2,508 2,803 23 12
W4 W4ROM (-100 MM)
BCCL 14-Sep-18 RoadBASTACOLLA (VICTORY)
9,000 8,000 2,280 2,508 2,608 14 4
W4 W4ROM (-100 MM)
BCCL 14-Sep-18 RoadAMAL. NT-ST JEENAGORA
90,000 90,000 2,280 2,508 3,575 57 43
W4 W4ROM (-100 MM)
BCCL 14-Sep-18 Rail KKC (L) 3,33,000 3,33,000 2,280 2,508 3,029 33 21
W4 W4ROM (-100 MM)
BCCL 14-Sep-18 Rail KESS 2,22,000 1,11,000 2,280 2,508 2,518 10 0.40
W4 W4ROM (-100 MM)
BCCL 14-Sep-18 Rail CK(W) 3,33,000 3,33,000 2,280 2,508 2,829 24 13
W4 W4ROM (-100 MM)
BCCL 14-Sep-18 Rail TUNDU 3,33,000 3,33,000 2,280 2,508 3,334 46 33
W2, W3, W4 & WG4 Total 19,55,000 18,41,000
WASHED POWER COAL
WASHED POWER COAL
- BCCL 14-Sep-18 Road Sudamdih Washery 1,00,000 80,000 3,145 3,460 3,460 10 -
UNGRADED & WASHEDPOWERCOAL Total 1,00,000 80,000
Grand Total 34,14,500 32,51,000
Special forward e-Auctions held in September 2018, Contd...
GCV Range
Grade / GCV Band
Size Client e-Auction Date
Mode of Despatch Ex Location
Qty offered
(in tons)
Qty Alloted
(in tons)
(ANP)Average Notified Price (in
Rs)
(ARP)Average Reserve Price (in
Rs)
(AAP) Average
Auctioned Price (in
Rs)
% Increase
over Notified
Price (%)
% Increase
Over Reserve
Price (%)
E-AUCtION

October 31, 2018 | 62
Region / State
Mode of Transport
Name of Thermal Power Station Sector Capacity
(MW)
PLF % (Sept 2018)
PLF % (Apr to Sept 2018)
Normative Stock Reqd.(Days)
Require-ment for the day (In ‘000 Tons’)
Actual Stock Critical(*) / Super Critical
(**) as per Trigger level
& other conditions
Reasons for critical coal stock/Remarks
In ‘000 Tons’ In Days
Indigenous Import Total
NORTHERN
Delhi
1 RAIL BADARPUR TPS C 705 47.6 41.3 30 6.05 0.00 0.00 0.00 0 Plant under shutdown.
Haryana
2 RAIL INDIRA GANDHI STPP JV 1500 60.7 54.8 25 13.21 4.13 0.00 4.13 0Supply to NTPC 98% of prorata ACQ
3 RAIL MAHATMA GANDHI TPS P 1320 49.5 54.2 25 11.33 54.33 0.00 54.33 5 CIL Supply 82% of prorata ACQ.
4 RAIL PANIPAT TPS S 920 27.9 47.6 25 7.89 37.37 0.00 37.37 5 *Supply to HPGCL 72% of prorata ACQ
5 RAIL RAJIV GANDHI TPS S 1200 22.5 39.0 25 18.45 0.00 0.00 0.00 0 **Supply to HPGCL 72% of prorata ACQ
6 RAIL YAMUNA NAGAR TPS S 600 22.9 65.2 25 5.15 40.19 0.00 40.19 8
Punjab
7 RAIL GH TPS (LEH.MOH.) S 920 27.5 38.8 30 12.20 106.64 0.00 106.64 9
8 RAIL GOINDWAL SAHIB TPP P 540 37.4 40.5 30 4.63 3.52 0.00 3.52 1 ** CIL Supply 74% of prorata ACQ.
9 RAIL RAJPURA TPP P 1400 76.6 76.7 30 17.81 80.60 0.00 80.60 5 CIL Supply 96% of prorata ACQ.
10 RAIL ROPAR TPS S 1260 32.6 24.1 25 13.10 101.26 0.00 101.26 8
11 RAIL TALWANDI SABO TPP P 1980 69.4 63.3 25 21.74 59.31 9.99 69.30 3 CIL Supply 95% of prorata ACQ.
Rajasthan
12 RAIL CHHABRA TPP S 1660 82.0 77.9 30 6.65 0.00 0.00 0.00 0
Plant had total coal stock (linkage + captive mine) of 376000 Tonnes as on 31.08.2018.
13 RAIL KAWAI TPS P 1320 81.0 52.6 30 19.62 5.65 14.50 20.15 1 CIL Supply 79% of prorata ACQ.
14 RAIL KOTA TPS S 1240 64.6 71.9 30 15.68 207.89 0.00 207.89 13
15 RAIL SURATGARH TPS S 1500 41.6 58.8 30 16.88 89.51 0.00 89.51 5 *Supply to RRVUNL 73% prorata ACQ
Uttar Pradesh
16 PITHEAD ANPARA C TPS P 1200 73.8 81.8 15 14.69 37.76 0.00 37.76 3CIL Supply 136% of prorata ACQ.
17 PITHEAD ANPARA TPS S 2630 82.9 85.6 15 31.17 524.23 0.00 524.23 17
18 RAIL BARKHERA TPS P 90 11.6 29.8 25 0.95 1.77 0.00 1.77 2 ** CIL Supply 50% of prorata ACQ.
19 RAIL DADRI (NCTPP) C 1820 66.0 71.5 30 18.64 0.92 0.00 0.92 0Supply to NTPC 98% of prorata ACQ
20 RAIL HARDUAGANJ TPS S 605 59.9 63.2 25 5.19 13.03 0.00 13.03 3Supply to UPRVUNL 87% prorata ACQ
21 RAIL KHAMBARKHERA TPS P 90 11.3 30.0 30 0.77 0.66 0.00 0.66 1 ** CIL Supply 50% of prorata ACQ.
22 RAIL KUNDARKI TPS P 90 72.0 43.9 30 0.81 4.71 0.00 4.71 6 * CIL Supply 50% of prorata ACQ.
23 RAIL LALITPUR TPS P 1980 22.8 47.5 30 19.64 100.19 0.00 100.19 5 * CIL Supply 72% of prorata ACQ.
24 RAIL MAQSOODPUR TPS P 90 11.1 29.7 30 0.77 7.85 0.00 7.85 10
25 RAIL OBRA TPS S 1188 42.0 42.7 20 10.19 64.24 0.00 64.24 6Supply to UPRVUNL 87% prorata ACQ
26 RAIL PARICHHA TPS S 1140 50.6 52.9 30 13.24 15.39 0.00 15.39 1Supply to UPRVUNL 87% prorata ACQ
27 RAIL PRAYAGRAJ TPP P 1980 44.1 44.1 25 16.99 168.05 0.00 168.05 10
28 PITHEAD RIHAND STPS C 3000 86.9 85.8 15 31.54 1000.14 0.00 1000.14 32
29 RAIL ROSA TPP Ph-I P 1200 65.9 57.3 25 11.42 27.37 0.00 27.37 2 CIL Supply 78% of prorata ACQ.
30 PITHEAD SINGRAULI STPS C 2000 88.9 75.4 15 28.35 479.91 0.00 479.91 17
31 RAIL TANDA TPS C 440 63.3 65.0 25 6.28 0.00 0.00 0.00 0Supply to NTPC 98% of prorata ACQ
32 RAIL UNCHAHAR TPS C 1550 69.2 70.2 25 13.30 20.32 0.00 20.32 2Supply to NTPC 98% of prorata ACQ
33 RAIL UTRAULA TPS P 90 63.3 42.2 30 0.87 6.54 0.00 6.54 8
Total of Northern Region 39248 24 415.21 3263.48 24.49 3287.97 8 8
COAL StOCK POSItION At VARIOUS tHERMAL POWER StAtIONSIN tHE COUNtRY AS ON 25.10.2018
POWER SECtOR

October 31, 2018 | 63
WESTERN
Chhatisgarh
34 RAIL AKALTARA TPS P 1800 43.8 50.3 15 17.26 53.76 8.29 62.05 4 * CIL Supply 68% of prorata ACQ
35 RAIL BALCO TPS P 600 40.3 51.1 15 5.15 25.38 0.00 25.38 5 * CIL Supply 70% of prorata ACQ
36 RAIL BARADARHA TPS P 1200 70.7 67.6 15 13.92 49.06 0.00 49.06 4 CIL Supply 79% of prorata ACQ
37 RAIL BHILAI TPS JV 500 76.8 85.5 20 6.66 0.95 0.00 0.95 0Supply to NTPC 98% of prorata ACQ
38 RAIL DSPM TPS S 500 94.5 90.5 15 7.55 45.06 0.00 45.06 6CSPGCL Supply 98% of prorata ACQ.
39 PITHEAD KORBA-II S 440 38.9 46.0 15 4.10 39.51 0.00 39.51 10
40 PITHEAD KORBA STPS C 2600 75.1 86.5 15 40.55 0.00 0.00 0.00 0Supply to NTPC 98% of prorata ACQ
41 PITHEAD KORBA-WEST TPS S 1340 83.3 80.6 15 20.60 168.55 0.00 168.55 8
42 RAIL MARWA TPS S 1000 85.0 81.3 15 15.35 36.57 0.00 36.57 2CSPGCL Supply 98% of prorata ACQ.
43 RAIL NAWAPARA TPP P 600 53.4 55.6 15 9.21 35.45 0.00 35.45 4 * CIL Supply 54% of prorata ACQ.
44 RAIL PATHADI TPP P 600 66.2 82.5 15 7.53 12.86 0.00 12.86 2 CIL Supply 78% of prorata ACQ.
45 PITHEAD SIPAT STPS C 2980 96.0 90.6 15 42.92 0.00 0.00 0.00 0Supply to NTPC 98% of prorata ACQ
46 RAIL TAMNAR TPP P 2400 35.3 40.3 20 13.77 9.82 0.00 9.82 1 CIL Supply 93% of prorata ACQ.
47 RAIL UCHPINDA TPP P 1080 36.2 35.6 15 2.91 3.94 0.00 3.94 1 CIL Supply 75% of prorata ACQ.
Gujarat
48 RAIL GANDHI NAGAR TPS S 630 62.4 70.4 30 8.81 10.52 0.03 10.55 1 **Supply to GSECL is 82% of prorata ACQ
49 RAILSABARMATI (C STATION)
P 422 95.0 93.8 30 4.73 7.97 62.35 70.32 2 ** CIL Supply 79% of prorata ACQ.
50 RAIL UKAI TPS S 1110 87.1 66.0 30 15.80 28.83 8.10 36.93 2 **Supply to GSECL is 82% of prorata ACQ
51 RAIL WANAKBORI TPS S 1470 75.7 69.2 30 18.11 41.30 0.45 41.75 2 **Supply to GSECL is 82% of prorata ACQ
Madhya Pradesh
52 PITHEAD AMARKANTAK EXT TPS S 210 100.6 81.5 15 2.73 61.90 0.00 61.90 23
53 RAIL ANUPPUR TPP P 1200 54.7 66.1 25 11.86 7.00 0.00 7.00 1 CIL Supply 86% of prorata ACQ.
54 RAIL BINA TPS P 500 44.5 53.9 25 5.48 34.52 0.00 34.52 6CIL Supply 106% of prorata ACQ.
55 RAIL SANJAY GANDHI TPS S 1340 67.3 71.1 20 17.82 40.83 0.00 40.83 2Supply to MPPGCL 85% prorata ACQ
56 RAIL SATPURA TPS S 1330 58.6 58.5 20 14.51 63.35 0.00 63.35 4Supply to MPPGCL 85% prorata ACQ
57 RAIL SEIONI TPP P 600 66.0 41.3 20 5.25 24.73 0.00 24.73 5 * CIL Supply 74% of prorata ACQ.
58 RAIL SHRI SINGHAJI TPP S 1200 48.7 53.7 20 20.02 61.77 0.00 61.77 3Supply to MPPGCL 85% prorata ACQ
59 PITHEAD VINDHYACHAL STPS C 4760 91.3 89.5 15 73.76 1574.47 0.00 1574.47 21
Maharashtra
60 RAIL AMARAVATI TPS P 1350 69.8 53.5 20 11.58 24.55 0.00 24.55 2 CIL Supply 96% of prorata ACQ.
61 RAIL BHUSAWAL TPS S 1210 45.3 63.9 20 12.50 46.12 0.00 46.12 4 *Supply to MAHAGENCO 81% prorata ACQ
62 RAIL BUTIBORI TPP P 600 96.7 53.5 20 5.15 7.55 0.00 7.55 1CIL Supply 103% of prorata ACQ.
63 RAILCHANDRAPUR (MAHARASHTRA) STPS
S 2920 59.1 52.0 20 35.90 76.23 0.00 76.23 2 **Supply to MAHAGENCO 81% prorata ACQ
64 RAIL DAHANU TPS P 500 94.2 90.0 25 6.34 16.48 20.85 37.33 3 ** CIL Supply 87% of prorata ACQ.
65 RAIL DHARIWAL TPP P 600 50.8 64.6 20 5.15 42.48 0.00 42.48 8
66 RAIL GMR WARORA TPS P 600 43.6 67.9 20 6.79 16.80 0.00 16.80 2 ** CIL Supply 67% of prorata ACQ.
67 RAIL KHAPARKHEDA TPS S 1340 50.1 56.0 25 19.63 35.64 0.00 35.64 2 **Supply to MAHAGENCO 81% prorata ACQ
POWER SECtOR
Contd...
Region / State
Mode of Transport
Name of Thermal Power Station Sector Capacity
(MW)
PLF % (Sept 2018)
PLF % (Apr to Sept 2018)
Normative Stock Reqd.(Days)
Require-ment for the day (In ‘000 Tons’)
Actual Stock Critical(*) / Super Critical
(**) as per Trigger level
& other conditions
Reasons for critical coal stock/Remarks
In ‘000 Tons’ In Days
Indigenous Import Total

October 31, 2018 | 64
68 RAIL KORADI TPS S 2400 25.5 34.6 25 20.59 104.98 0.00 104.98 5 *Supply to MAHAGENCO 81% prorata ACQ
69 RAIL MAUDA TPS C 2320 67.3 59.3 20 23.85 0.00 0.00 0.00 0Supply to NTPC 98% of prorata ACQ
70 RAIL NASIK TPS S 630 43.3 44.5 25 5.51 8.44 0.00 8.44 2 **Supply to MAHAGENCO 81% prorata ACQ
71 RAIL PARAS TPS S 500 56.7 76.8 25 4.29 16.51 0.00 16.51 4 *Supply to MAHAGENCO 81% prorata ACQ
72 RAIL PARLI TPS S 1170 36.6 37.5 25 10.04 21.75 0.00 21.75 2 **Supply to MAHAGENCO 81% prorata ACQ
73 RAIL SOLAPUR C 660 18.6 43.6 25 6.95 0.00 0.00 0.00 0Supply to NTPC 98% of prorata ACQ
74 RAIL TIRORA TPS P 3300 69.6 64.6 20 39.69 78.81 9.22 88.03 2 ** CIL Supply 63% of prorata ACQ.
Total of Western Region 52512 20 620.31 2934.44 109.29 3043.73 5 18
SOUTHERN
Andhra Pradesh
75 RAILDAMODARAM SANJEEVAIAH TPS
S 1600 45.7 50.5 20 13.73 76.87 13.69 90.56 7
76 RAIL Dr. N.TATA RAO TPS S 1760 78.5 76.0 20 25.17 1.77 0.00 1.77 0Supply to APGENCO 85% prorata ACQ
77 RAIL PAINAMPURAM TPP P 1320 94.8 89.7 20 11.33 150.83 0.60 151.43 13
78 RAIL RAYALASEEMA TPS S 1650 65.5 47.4 25 11.91 7.75 0.00 7.75 1Supply to APGENCO 85% prorata ACQ
79 RAIL SIMHADRI C 2000 63.2 66.6 25 25.31 0.00 0.00 0.00 0Supply to NTPC 98% of prorata ACQ
80 RAIL VIZAG TPP P 1040 0.0 6.1 25 8.92 4.44 9.47 13.91 2Supply kept in abeyance by MCL due to APERC order dated 31.01.2018
Karnataka
81 RAIL BELLARY TPS S 1700 35.7 19.1 30 14.59 37.11 0.00 37.11 3 Bridge Linkage
82 RAIL KUDGI STPP C 1600 46.4 30.7 30 13.73 0.00 0.00 0.00 0Supply to NTPC 98% of prorata ACQ
83 RAIL RAICHUR TPS S 1720 74.3 55.3 30 14.76 10.34 0.00 10.34 1 **Supply to KPCL 86% prorata ACQ
84 RAIL YERMARUS TPP S 1600 0.0 8.0 30 6.86 32.05 0.00 32.05 5 Bridge Linkage
Tamil Nadu
85INTER MODAL
METTUR TPS S 840 65.2 66.4 30 10.88 34.46 6.64 41.11 4 *Supply to TANGEDCO 81% prorata ACQ
86INTER MODAL
METTUR TPS - II S 600 65.2 66.4 30 8.16 18.80 1.58 20.38 2 **Supply to TANGEDCO 81% prorata ACQ
87INTER MODAL
NORTH CHENNAI TPS S 1830 47.7 65.2 30 23.80 16.23 0.00 16.23 1 **Supply to TANGEDCO 81% prorata ACQ
88 RAIL TUTICORIN (JV) TPP JV 1000 79.3 61.9 30 12.93 103.91 117.30 221.21 17
89INTER MODAL
TUTICORIN TPS S 1050 73.2 72.9 30 9.01 78.96 15.36 94.32 10
90INTER MODAL
VALLUR TPP JV 1500 53.7 57.2 30 12.87 0.00 0.00 0.00 0Supply to NTPC 98% of prorata ACQ
Telangana
91 PITHEAD KAKATIYA TPS S 1100 87.1 87.5 15 14.31 243.29 0.00 243.29 17
92 RAIL KOTHAGUDEM TPS S 720 61.5 60.9 20 10.43 478.75 0.00 478.75 46
93 RAILKOTHAGUDEM TPS (NEW)
S 1000 91.8 84.2 20 16.55 160.03 0.00 160.03 10
94 PITHEAD RAMAGUNDEM STPS C 2600 89.7 82.9 15 30.95 186.30 0.00 186.30 6
Total of Southern Region 28230 25 296.19 1641.89 164.64 1806.54 6 4
EASTERN
Bihar
95 RAIL BARH II C 1320 75.4 84.3 20 16.84 34.17 0.38 34.55 2Supply to NTPC 98% of prorata ACQ
POWER SECtOR
Contd...
Region / State
Mode of Transport
Name of Thermal Power Station Sector Capacity
(MW)
PLF % (Sept 2018)
PLF % (Apr to Sept 2018)
Normative Stock Reqd.(Days)
Require-ment for the day (In ‘000 Tons’)
Actual Stock Critical(*) / Super Critical
(**) as per Trigger level
& other conditions
Reasons for critical coal stock/Remarks
In ‘000 Tons’ In Days
Indigenous Import Total

October 31, 2018 | 65
Pithead Plants: (*) No. of plants with critical coal stock (< 5 Days) 0 (**) No. of plants with super critical coal stock(< 3 Days 0Non-Pithead Plants : (*) No. of plants with critical coal stock (< 7 Days) 12 (**) No. of plants with super critical coal stock (< 4 Days) 18
96 PITHEAD KAHALGAON TPS C 2340 74.8 77.3 15 37.18 0.00 0.00 0.00 0Supply to NTPC 98% of prorata ACQ
97 RAIL MUZAFFARPUR TPS JV 610 56.1 47.1 20 6.33 0.00 0.00 0.00 0Supply to NTPC 98% of prorata ACQ
98 RAIL NABI NAGAR TPP JV 500 42.9 38.4 20 5.34 8.99 0.00 8.99 2Supply to NTPC 98% of prorata ACQ
Jharkhand
99 RAIL BOKARO `B` TPS C 710 77.3 67.6 20 8.23 61.00 0.00 61.00 7
100 RAILCHANDRAPURA(DVC) TPS
C 630 77.9 70.0 20 6.02 49.87 0.00 49.87 8
101 RAIL KODARMA TPP C 1000 54.1 78.3 20 8.58 106.56 0.00 106.56 12
102 RAIL MAITHON RB TPP JV 1050 60.1 76.4 20 10.87 16.34 48.67 65.01 6CIL Supply 129% of prorata ACQ.
103 ROAD TENUGHAT TPS S 420 35.6 39.1 20 6.02 30.31 0.00 30.31 5CIL Supply 125% of prorata ACQ.
Odisha
104 PITHEAD IB VALLEY TPS S 420 88.0 80.7 15 7.58 122.54 0.00 122.54 16
105 RAIL KAMALANGA TPS P 1050 70.7 75.8 20 11.96 78.62 0.00 78.62 7
106 PITHEAD TALCHER (OLD) TPS C 460 71.8 88.8 15 6.65 140.14 0.00 140.14 21
107 PITHEAD TALCHER STPS C 3000 72.6 79.9 15 52.61 142.36 3.38 145.74 3Supply to NTPC 98% of prorata ACQ
West Bengal
108 RAIL BAKRESWAR TPS S 1050 57.0 75.9 20 13.47 3.33 0.00 3.33 0Supply to WBPDCL 99% prorata ACQ
109 RAIL BANDEL TPS S 450 39.4 49.6 20 4.61 18.28 0.00 18.28 4Supply to WBPDCL 99% prorata ACQ
110 RAIL BUDGE BUDGE TPS P 750 100.2 98.8 20 9.21 141.72 0.00 141.72 15
111 RAIL D.P.L. TPS S 660 30.4 41.9 25 5.66 14.04 0.00 14.04 2 CIL Supply 97% of prorata ACQ.
112 RAIL DURGAPUR STEEL TPS C 1000 41.6 71.0 20 8.58 13.63 0.00 13.63 2Supply to DVC 116% prorata ACQ
113 RAIL DURGAPUR TPS C 210 15.1 48.9 20 1.80 45.79 0.00 45.79 25
114 PITHEAD FARAKKA STPS C 2100 88.1 77.2 15 28.99 0.00 3.14 3.14 0Supply to NTPC 98% of prorata ACQ
115 RAIL HALDIA TPP P 600 97.4 94.4 20 7.79 81.26 1.64 82.90 11
116 RAIL KOLAGHAT TPS S 1260 37.4 42.0 25 11.55 4.84 0.00 4.84 0Supply to WBPDCL 99% prorata ACQ
117 RAIL MEJIA TPS C 2340 46.4 59.0 20 22.43 64.09 0.00 64.09 3Supply to DVC 116% prorata ACQ
118 RAIL RAGHUNATHPUR TPP C 1200 23.6 27.7 15 10.30 14.38 0.00 14.38 1Supply to DVC 116% prorata ACQ
119 RAIL SAGARDIGHI TPS S 1600 48.9 58.2 20 14.36 2.68 0.00 2.68 0Supply to WBPDCL 99% prorata ACQ
120 RAIL SANTALDIH TPS S 500 51.4 82.1 20 6.95 15.81 0.00 15.81 2Supply to WBPDCL 99% prorata ACQ
121 RAIL SOUTHERN REPL. TPS P 135 27.4 30.6 20 1.57 11.54 0.00 11.54 7
122 RAIL TITAGARH TPS P 240 0.0 0.0 20 2.06 14.02 0.00 14.02 7
Total of Eastern Region 27605 19 333.54 1236.31 57.21 1293.52 4 0
NORTH EASTERN
Assam
123 RAIL BONGAIGAON TPP C 500 53.8 67.2 20 4.29 0.00 0.00 0.00 0Supply to NTPC 98% of prorata ACQ
Total of North Eastern Region 500 20 4.29 0.00 0.00 0.00 0 0
Region-wise/All India total 148095 22 1669.54 9076.12 355.63 9431.76 6 30
POWER SECtOR
Contd...
Region / State
Mode of Transport
Name of Thermal Power Station Sector Capacity
(MW)
PLF % (Sept 2018)
PLF % (Apr to Sept 2018)
Normative Stock Reqd.(Days)
Require-ment for the day (In ‘000 Tons’)
Actual Stock Critical(*) / Super Critical
(**) as per Trigger level
& other conditions
Reasons for critical coal stock/Remarks
In ‘000 Tons’ In Days
Indigenous Import Total

October 31, 2018 | 66
Coal Production Apr-18 May-18 Jun-18 Jul-18 Aug-18 Sep-18
ECL 3.810 3.800 3.390 3.090 3.000 3.350
BCCL 2.440 2.940 2.300 2.330 2.210 2.370
CCL 3.600 4.100 3.740 3.500 3.710 4.140
NCL 7.960 8.440 8.190 8.070 7.730 7.990
WCL 3.400 3.500 2.740 1.670 2.200 3.100
SECL 12.860 13.940 13.150 11.730 10.720 9.840
MCL 10.720 10.370 11.360 10.160 9.190 9.410
NEC 0.050 0.045 0.026 0.020 0.030 0.040
CIL 44.840 47.140 44.880 40.560 38.800 40.240
SCCL 4.510 5.100 4.960 4.430 4.380 5.120
OTHERS* N/A N/A N/A N/A N/A N/A
ALL INDIA TOTAL 49.350 52.240 49.840 44.990 43.180 45.360
Coal Despatch Apr-18 May-18 Jun-18 Jul-18 Aug-18 Sep-18
ECL 4.170 4.310 3.780 3.580 3.270 3.380
BCCL 3.050 3.200 2.830 3.010 2.510 2.440
CCL 5.990 6.400 5.300 4.860 4.640 4.550
NCL 8.130 8.440 7.780 8.400 8.260 8.170
WCL 4.420 4.630 4.560 3.920 3.710 3.930
SECL 13.040 13.850 13.710 13.050 12.130 10.700
MCL 12.110 11.980 11.600 11.400 10.670 10.710
NEC 0.080 0.050 0.040 0.030 0.030 0.030
CIL 50.970 52.860 49.590 48.250 45.220 43.910
SCCL 5.773 5.840 5.270 4.540 4.490 5.130
OTHERS* N/A N/A N/A N/A N/A N/A
ALL INDIA TOTAL 56.743 58.700 54.860 52.790 49.710 49.040
COAL PRODUCtION (COMPANY-WISE)
COAL DESPAtCH (COMPANY-WISE)
(Million Tons)
(Million Tons)
INDIA’S COAL PRODUCtION

October 31, 2018 | 67
Ports Date Country of Origin Importers Item Description Unit Price (in Rs/Ton)
Unit Price (in $/Ton)
Quantity (in Tons)
KOLKATA
4-Sep-18INDONESIA MAITHON POWER LTD
STEAM COAL (AIFTA CERT.NO.0003450/SMD/2018)
3,806 54 27,912
3,812 54 27,617
SOUTH AFRICA RUNGTA MINES LTD., STEAM COAL (GCV/ARB 4942 KCAL/KG) 5,984 84 29,000
11-Sep-18 SOUTH AFRICARAWMET RESOURCES PVT. LTD.
STEAM COAL ASH (ADB 24.63%) GOODS ARE CQD BASIS AS CON T DT.25/7/2018 (SVB FILE S44-12/2016A (SVB) DT.28/11/2017)
5,745 79 27,968
13-Sep-18 INDONESIAANAND CARBO PRIVATE LIMITED
STEAM (NON-COKING) COAL 5,300 73 20,000
5,300 73 2,753
14-Sep-18INDONESIA
ANAND CARBO PRIVATE LIMITED
STEAM (NON-COKING) COAL 5,300 73 2,000
SOUTH AFRICA RUNGTA MINES LTD., STEAM COAL (GCV/ARB 5694 KCAL/KG) 7,494 103 30,000
28-Sep-18 SOUTH AFRICA ADANI ENTERPRISES LIMITED STEAM COAL 7,660 104 11,432
29-Sep-18 SOUTH AFRICA
DHANBAD FUELS LTD., STEAM COAL 7,623 104 4,000
MAAN STEEL & POWER LIMITED
STEAM COAL
7,623 103 128
7,623 103 1,567
7,623 103 1,525
7,623 104 4,102
7,623 104 3,678
SHYAM STEEL MANUFACTURING LIMITED
STEAM COAL (NON COKING) 7,182 98 9,491
7,182 98 20,509
KOLKATA Total 2,23,682
PARADIP
1-Sep-18 INDONESIA MAITHON POWER LTDSTEAM COAL (AIFTA CFT NO.0003450/SMD/2018)
3,806 54 47,872
3-Sep-18 SOUTH AFRICA AARTI STEELS LIMITED STEAM COAL 5,349 75 7,600
5-Sep-18 SOUTH AFRICA
RAWMET RESOURCES PVT. LTD.
STEAM COAL 5,484 77 5,000
RUNGTA MINES LTD., STEAM COAL 5,984 84 30,000
5,984 84 17,486
7-Sep-18 SOUTH AFRICAANAND CARBO PRIVATE LIMITED
STEAM COAL 5,230 72 34,200
5,230 72 2,199
12-Sep-18 SOUTH AFRICA GALLANTT ISPAT LIMITED STEAM (NON-COKING) COAL 6,418 88 27,208
13-Sep-18 SOUTH AFRICA RUNGTA MINES LTD., STEAM COAL 7,494 103 32,927
7,494 103 15,000
17-Sep-18 INDONESIA ESSAR STEEL INDIA LTD. STEAM (NON-COKING) COAL 4,458 61 60,000
4,458 61 15,652
18-Sep-18 SOUTH AFRICA AARTI STEELS LIMITED STEAM COAL 6,869 95 19,000
19-Sep-18 SOUTH AFRICAANAND CARBO PRIVATE LIMITED
STEAM COAL 6,457 89 2,000
20-Sep-18
INDONESIA MAITHON POWER LTDSTEAM COAL (AIFTA CFT NO.0003450/SMD/2018)
3,884 54 295
SOUTH AFRICARAWMET RESOURCES PVT. LTD.
STEAM COAL 6,475 89 15,591
21-Sep-18 SOUTH AFRICAAGARWAL COAL CORPORATION PVT LTD
STEAM (NON-COKING) COAL 6,629 90 20,642
24-Sep-18 SOUTH AFRICA MSP STEEL & POWER LIMITED STEAM COAL 6,728 91 30,800
27-Sep-18 SOUTH AFRICAMAITHAN ISPAT LIMITED, STEAM (NON COKING) COAL 6,739 92 10,000
MSP STEEL & POWER LIMITED STEAM (NON COKING) COAL 6,629 90 15,500
PARADIP Total 4,08,972
VIZAG 4-Sep-18 INDONESIA ADANI ENTERPRISES LIMITED STEAM COAL (ARB 3403 KCAL/KG) 2,986 42 55,000
NON COKING COAL IMPORtS INtO INDIA tHROUGH tHE SELECtED PORtS SEPtEMbER’18
NON COKING COAL IMPORtS

October 31, 2018 | 68
VIZAG
5-Sep-18 SOUTH AFRICAJINDAL STEEL & POWER LIMITED
STEAM (NON COKING) COAL (NCV ARB 5932 KCAL)
7,862 111 72,000
7,864 111 4,126
7,864 111 240
7-Sep-18 INDONESIAANAND CARBO PRIVATE LIMITED
STEAM (NON COKING) COAL (GCV ARB 5034 KCAL /KG)
5,200 72 35,000
12-Sep-18 SOUTH AFRICA ADANI ENTERPRISES LIMITED STEAM COAL (NCV ARB:4814 KCAL / KG) 6,442 89 72,566
17-Sep-18 INDONESIA VEDANTA LIMITEDNON COKING COAL (STEAM COAL) (GCV ARB 5513 KCAL/KG)
5,824 80 32,157
5,824 80 55,000
24-Sep-18 SOUTH AFRICA ADANI ENTERPRISES LIMITED STEAM COAL (ARB 5687 KCAL/KG) 7,660 104 49,500
25-Sep-18
INDONESIA ADANI ENTERPRISES LIMITED STEAM COAL (ARB 5220 KCAL/KG) 5,082 69 54,015
SOUTH AFRICA BHARAT ALUMINIUM CO LTDSTEAM (NON COKING) COAL NCV (ARB) 4995 KACL/KG
5,013 68 75,241
29-Sep-18 INDONESIAADANI POWER MAHARASHTRA LTD.
STEAM COAL (GCV ARB 5212 KCAL/KG) 6,572 89 78,355
VIZAG Total 5,83,200
GANGAVARAM
3-Sep-18 SOUTH AFRICAINDIA COKE & POWER PRIVATE LIMITED
STEAM (NON COKING) COAL (NCV A RB 5055KCAL/KG)
5,999 84 40,000
5,999 84 41,855
STEAM (NON COKING) COAL (NCV A RB 5422KCAL/KG)
6,919 97 10,682
6,919 97 72,000
10-Sep-18 MOZAMBIQUERASHTRIYA ISPAT NIGAM LIMITED
BENGA THERMAL COAL 6,970 96 38,300
14-Sep-18 SOUTH AFRICABHUSHAN POWER & STEEL LIMITED
STEAM (NON COKING) COAL (NCV: ARB 4846 KCAL/KG)
6,929 96 1,35,000
6,929 96 22,500
6,929 96 7,470
17-Sep-18 SOUTH AFRICASHAH SPONGE & POWER LIMITED
STEAM COAL (NCV ARB 4871 KCAL) 5,577 77 4,000
18-Sep-18 SOUTH AFRICA ADANI ENTERPRISES LIMITED STEAM COAL (NCV ARB 4871 KCAL) 5,861 81 78,205
26-Sep-18 SOUTH AFRICASHRI BAJRANG POWER AND ISPAT LIMITED
STEAM COAL (NCV ARB 5073 KCAL/KG) 6,229 85 63,200
28-Sep-18 INDONESIA ADANI ENTERPRISES LIMITED STEAM COAL (GCV ARB 4210 KCAL) 3,830 52 51,589
GANGAVARAM Total 5,64,801
KRISHNAPATNAM
3-Sep-18 UNITED STATESPENNA CEMENT INDUSTRIES LIMITED
STEAM COAL (NCV ON ARB:6921 KCAL/KG) 8,084 114 16,875
4-Sep-18
INDONESIASEMBCORP GAYATRI POWER LIMITED
STEAM COAL (NCV ON ARB 4015 KCAL/KG) 4,056 57 72,555
SOUTH AFRICA TATA INTERNATIONAL LIMITED
STEAM (NON COKING) COAL (NCVON ARB 4850 KCAL/KG)
5,635 79 55,000
STEAM (NON-COKING) COAL (NCV ON ARB 4842 KCAL/KG)
5,621 79 54,991
STEAM COAL (NCV ON ARB 5514 KCAL/KG) 6,796 96 55,000
5-Sep-18
INDONESIASEMBCORP ENERGY INDIA LIMITED
STEAM COAL (NCV ON ARB:3657 KCAL/KG) 3,422 48 1,39,950
STEAM COAL (NCV ON ARB:4179 KCAL/KG) 5,677 80 6,023
5,677 80 66,482
SOUTH AFRICAMAHALAXMI CONTINENTAL LIMITED
STEAM (NON COKING) COAL (NCV ON ARB 4832 KCAL/KG)
6,042 85 15,000
STEAM (NON COKING) COAL (NCV ON ARB OF 4832 KCAL/KG)
6,042 85 10,000
6,042 85 2,496
6-Sep-18
AUSTRALIATRAFIGURA INDIA PRIVATE LIMITED
DRAKE 5 COKING COAL 13,228 186 32,462
INDONESIASEMBCORP ENERGY INDIA LIMITED
STEAM COAL (NCV ON ARB:3807 KCA L/KG) 3,317 47 1,36,900
Non Coking Coal imports into India through the selected ports September’18, Contd...
Ports Date Country of Origin Importers Item Description Unit Price (in Rs/Ton)
Unit Price (in $/Ton)
Quantity (in Tons)
NON COKING COAL IMPORtS

October 31, 2018 | 69
KRISHNAPATNAM
8-Sep-18 AUSTRALIAJANKI CORP LTD., STEAM COAL (NCV ON ARB OF 5510 KCAL /KG)
6,215 86 3,000
6,215 86 6,000
ZUARI CEMENT LIMITED STEAM COAL (NCV ON ARB:5510 KCAL/KG) 6,450 89 12,833
10-Sep-18 AUSTRALIAMINERA STEEL & POWER PVT.LTD.
STEAM COAL (NCV ON ARB 5510 KCAL/KG) 6,327 87 9,000
12-Sep-18 AUSTRALIA
RAWMET RESOURCES PVT. LTD.
STEAM COAL (NCV ON ARB OF 5510 KCAL/KG) 6,215 86 1,000
TRAFIGURA INDIA PRIVATE LIMITED
DRAKE 5 COKING COAL 13,498 186 20,000
14-Sep-18
AUSTRALIAPARASAKTI CEMENT INDUSTRIES LTD.
STEAM COAL (NCV ON ARB OF 5510 KCAL/KG) 6,620 91 16,500
INDONESIASEMBCORP GAYATRI POWER LIMITED
STEAM COAL (NCV ON ARB 4054 KCAL/KG) 3,601 50 75,877
17-Sep-18 RUSSIA JSW STEEL LIMITED COAL
10,242 141 4,482
10,242 141 22,627
10,242 141 24,285
10,242 141 16,516
10,242 141 14,923
19-Sep-18 INDONESIASEMBCORP ENERGY INDIA LIMITED
STEAM COAL (NCV ON ARB:3244 KCAL/KG) 2,604 36 72,100
20-Sep-18
AUSTRALIA
BHARATHI CEMENT CORPORATION PVT. LTD.,
STEAM COAL (NCV ON ARB 5608 KCAL/KG) 6,123 84 70,000
KALBURGI CEMENT PRIVATE LIMITED
STEAM COAL (NCV ON ARB 5608 KCAL/KG)
6,123 84 927
6,123 84 9,000
6,123 84 10,000
INDONESIASEMBCORP GAYATRI POWER LIMITED
STEAM COAL (NCV ON ARB3785 KCAL /KG) 3,399 47 1,39,600
SOUTH AFRICA
AGARWAL SPONGE AND ENERGY PVT LTD
STEAM (NON-COKING) COAL (NCV ON ARB 5521 KCAL/KG)
6,852 94 5,000
AKSHARA INDUSTRIES LTD
STEAM (NON COKING) COAL (NCV ON ARB OF 5521 KCAL/KG)
6,810 94 2,500
STEAM (NON COKING) COAL (NCV ON ARBOF 5521 KCAL/KG)
6,810 94 5,000
CAUVERY IRON AND STEEL (INDIA) LTD.,
STEAM (NON COKNG) COAL (NCV ON ARB OF 5521 KCAL/KG)
7,041 97 2,500
STEAM (NON COKNG) ORIGIN COAL (NCV ON ARB OF 5521 KCAL/KG)
7,041 97 2,500
JSW ENERGY LIMITED STEAM COAL (NCV ON ARB 4675 KCAL/KG) 4,805 66 78,438
K.I. (INTERNATIONAL) LIMITED,STEAM (NON COKING) COAL (NCV ON ARB 5521 KCAL/KG)
7,139 98 2,500
7,291 101 25,000
7,291 101 2,795
MARUTI ISPAT & ENERGY PRIVATE LIMITED
STEAM (NON COKING) COAL (NCV ON ARB OF 5521 KCAL/KG)
7,177 99 15,000
SUVAN STEELS PRIVATE LIMITED
STEAM (NON COKING) COAL (NCV ON ARB OF5521 KCAL/KG)
6,900 95 5,000
VRKP SPONGE AND POWER PLANT LLP
STEAM (NON COKING) COAL OF COAL (NCV ON ARB OF 5521 KCAL/KG)
6,718 93 2,500
STEAM (NON-COKING) COAL (NCV ON ARB 5521 KCAL/KG)
6,852 94 7,500
21-Sep-18 INDONESIA THE INDIA CEMENTS LIMITED STEAM COAL (NCV ON ARB 3554 KCAL/KG) 3,803 52 20,000
3,803 52 2,581
22-Sep-18 INDONESIASEMBCORP GAYATRI POWER LIMITED
STEAM COAL (NCV ON ARB 3650 KCAL/KG) 3,437 47 74,512
NON COKING COAL IMPORtS
Non Coking Coal imports into India through the selected ports September’18, Contd...
Ports Date Country of Origin Importers Item Description Unit Price (in Rs/Ton)
Unit Price (in $/Ton)
Quantity (in Tons)

October 31, 2018 | 70
KRISHNAPATNAM
22-Sep-18 INDONESIA THE INDIA CEMENTS LIMITED STEAM COAL (NCV ON ARB 3554 KCAL/KG) 3,803 52 4,721
3,803 52 25,000
24-Sep-18 UNITED STATES THE INDIA CEMENTS LIMITED CONSOL BEFH XCOAL HIGH CV THERMAL COAL 8,200 111 15,000
25-Sep-18
INDONESIASEMBCORP ENERGY INDIA LIMITED
STEAM COAL (NCV ON ARB:4055 KCAL/KG) 5,577 76 74,575
UNITED STATES
K.I. (INTERNATIONAL) LIMITED, STEAM COAL (NCV ON ARB 6822 KCAL/KG) 8,237 112 31,000
8,237 112 3,998
THE INDIA CEMENTS LIMITEDCONSOL BEFH XCOAL HIGH CV THERMAL COAL
8,200 111 5,982
8,200 111 45,000
27-Sep-18
AUSTRALIA
ANJANI PORTLAND CEMENT LTD
STEAM COAL (NCV ON ARB 5567 KCAL/KG) 6,425 87 12,000
ZUARI CEMENT LIMITEDSTEAM COAL (NCV ON ARB:5492 KCAL/KG)
6,538 89 13,388
6,538 89 50,000
STEAM COAL (NCV ON ARB:5500 KCAL/KG) 6,260 85 31,993
SOUTH AFRICA
K.I. (INTERNATIONAL) LIMITED,
STEAM (NON COKING) COAL (NCV ON ARB 5443 KCAL/KG)
7,207 98 5,000
7,207 98 1,698
STEAM (NON COKING) COAL OF COAL (NCV ON ARB OF 5443 KCAL/KG)
7,207 98 5,000
SEMBCORP GAYATRI POWER LIMITED
STEAM COAL (NCV ON ARB 4722 KCAL/KG) 5,044 68 76,365
UNITED STATESPENNA CEMENT INDUSTRIES LIMITED
STEAM COAL (NCV ON ARB: 6822 KCAL/KG) 8,255 112 5,000
STEAM COAL (NCV ON ARB:6822 KCAL/KG) 8,255 112 10,000
28-Sep-18
AUSTRALIASWISS SINGAPORE INDIA PRIVATE LIMITED
STEAM COAL (NCV ON ARB 5567 KCAL/KG) 6,187 84 12,000
RUSSIA JSW STEEL LIMITED COAL
10,545 143 2,053
10,545 143 558
10,545 143 10,316
10,545 143 15,897
10,545 143 2,225
SOUTH AFRICA K.I. (INTERNATIONAL) LIMITED,
STEAM (NON COKING) COAL OF COAL (NCV ON ARB OF 5443 KCAL/KG)
7,207 98 32,500
STEAM (NON COKING) COAL OF COAL (NCVON ARB OF 5060 KCAL/KG)
6,299 86 2,500
STEAM (NON-COKING) COAL (NCV ON ARB 5670 KCAL/KG)
7,485 102 2,500
29-Sep-18
AUSTRALIA THE K.C.P.LTD
STEAM COAL (NCV ON ARB 5492 KCAL/KG) 6,300 86 10,000
STEAM COAL (NCV ON ARB 5567 KCAL/KG) 6,217 84 5,000
6,217 84 10,000
INDONESIASEMBCORP ENERGY INDIA LIMITED
STEAM COAL (NCV ON ARB:3650 KCAL/KG) 3,348 45 1,40,922
SOUTH AFRICA K.I. (INTERNATIONAL) LIMITED,
STEAM (NO COKING) COAL (NCV ON ARB 5443 KCAL/KG)
7,207 98 2,500
STEAM (NON COKING) COAL (NCV ON ARB 5060 KCAL/KG)
6,299 86 3,143
STEAM (NON COKING) COAL (NCV ON ARB 5443 KCAL/KG)
7,207 98 2,500
STEAM (NON COKING) COAL OF COAL (NCV ON ARB OF 5060 KCAL/KG)
6,299 86 17,500
STEAM (NON COKING) COAL OF COAL (NCV ON ARB OF 5443 KCAL/KG)
7,207 98 5,000
STEAM (NON COKING) COAL OF COAL (NCVON ARB OF 5060 KCAL/KG)
6,299 86 2,500
NON COKING COAL IMPORtS
Non Coking Coal imports into India through the selected ports September’18, Contd...
Ports Date Country of Origin Importers Item Description Unit Price (in Rs/Ton)
Unit Price (in $/Ton)
Quantity (in Tons)

October 31, 2018 | 71
KRISHNAPATNAM 29-Sep-18 SOUTH AFRICA K.I. (INTERNATIONAL) LIMITED,
STEAM (NON COKING) COLA (NCV ON ARB 5670 KCAL/KG)
7,485 102 2,500
STEAM (NON-COKING) COAL (NCV ON ARB 5670 KCAL/KG)
6,082 83 22,500
6,082 83 3,324
7,485 102 3,258
7,485 102 37,500
KRISHNAPATNAM Total 22,10,145
ENNORE
1-Sep-18 INDONESIA TULSYAN NEC LIMITED, STEAM (NON COKING) COAL 4,039 57 30,175
4,119 58 10,000
3-Sep-18 INDONESIAINDIA COKE & POWER PRIVATE LIMITED
STEAM (NON-COKING) COAL 3,568 50 15,000
6-Sep-18 INDONESIA
DEVENDRAN COAL INTERNATIONAL PRIVATE LIMITED
STEAMING (NON-COKING) COAL 5,119 72 30,000
OPG POWER GENERATION PRIVATE LIMITED
STEAM (NON-COKING) COAL (AIFTA NO.0001010/KBL/2018 DT.29.08.2018)
3,405 48 78,348
7-Sep-18 INDONESIASURYADEV ALLOYS & POWER PVT LTD
STEAM (NON COKING) COAL 3,620 50 55,950
11-Sep-18 INDONESIA YASIN IMPEX INDIA PVT LTDSTEAM COAL (AIFTA NO : 0003606/SMD/2018)
4,210 58 5,000
4,210 58 20,000
STEAM COAL (AIFTA NO : 0003607/SMD/2018) 4,210 58 23,550
12-Sep-18 INDONESIAARS ENERGY PRIVATE LIMITED
STEAMING (NON-COKING) COAL (AIFTA NO:0004888/BJM/201 8 DT.06.09.2018)
3,548 49 60,500
19-Sep-18 INDONESIASURYADEV ALLOYS & POWER PVT LTD
STEAM (NON COKING) COAL 3,458 48 53,450
20-Sep-18 INDONESIA
SREE RAYALASEEMA HI STRENGTH HYPO LTD
STEAM (NON-COKING) COAL (AIFTA NO : 0000 477/KBG/2018)
3,670 51 49,500
T G V SRAAC LIMITEDSTEAM (NON-COKING) COAL (AIFTA NO : 0000 476/KBG/2018)
3,670 51 10,195
24-Sep-18 INDONESIA
AGARWAL COAL COMPANY STEAM COAL (AIFTA NO : 0000482/KBG/2018) 3,616 49 18,000
APOLLO TYRES LIMITED STEAM COAL (AIFTA NO : 0000482/KBG/2018) 3,754 51 12,000
SWISS SINGAPORE INDIA PRIVATE LIMITED
STEAM COAL (AIFTA NO : 0000482/KBG/2018) 3,546 48 29,080
29-Sep-18 INDONESIA TULSYAN NEC LIMITED, STEAM (NON COKING) COAL 3,835 52 15,000
ENNORE Total 5,15,748
CHENNAI
3-Sep-18 AUSTRALIAAMCOL MINERALS & MATERIALS INDIA PVT LTD
BITUMINOUS COAL 19,772 278 104
15-Sep-18 AUSTRALIAAMCOL MINERALS & MATERIALS INDIA PVT LTD
BITUMINOUS COAL 20,176 278 104
CHENNAI Total 208
KARAIKAL
6-Sep-18 INDONESIATAMIL NADU NEWSPRINT & PAPERS LIMITED
STEAMING (NON-COKING) COAL 5,425 76 58,000
5,425 76 10,470
11-Sep-18 INDONESIA
GLOBAL COAL VENTURES PRIVATE LIMITED
STEAMING NON-COKING COAL 4,311 59 15,303
JSW STEEL LIMITED STEAM COAL 4,784 66 33,000
18-Sep-18 INDONESIATAMIL NADU NEWSPRINT & PAPERS LIMITED
STEAMING (NON-COKING) COAL 5,571 77 58,000
19-Sep-18 INDONESIASHIVSAI IMPEX (OPC) PRIVATE LIMITED
STEAMING (NON-COKING) COAL 5,633 78 14,100
24-Sep-18 INDONESIATHE RAMCO CEMENTS LIMITED
STEAMING (NON-COKING) COAL 3,642 49 50,000
3,642 49 7,460
KARAIKAL Total 2,46,333
NON COKING COAL IMPORtS
Non Coking Coal imports into India through the selected ports September’18, Contd...
Ports Date Country of Origin Importers Item Description Unit Price (in Rs/Ton)
Unit Price (in $/Ton)
Quantity (in Tons)

October 31, 2018 | 72
TUTICORIN / VOC
3-Sep-18 INDONESIAAGARWAL COAL CORPORATION PVT LTD
STEAM (NON COKING) COAL 2,413 34 30,400
2,413 34 30,000
5-Sep-18 SOUTH AFRICASWISS SINGAPORE INDIA PRIVATE LIMITED
STEAM COAL 6,978 98 53,882
10-Sep-18 INDONESIADEVENDRAN COAL INTERNATIONAL PRIVATE LIMITED
STEAMING (NON COKING) COAL 5,224 72 49,295
14-Sep-18 INDONESIA GIMPEX PRIVATE LIMITEDSTEAM (NON-COKING) COAL-GRADE 1 4,973 69 37,200
STEAM (NON-COKING) COAL-GRADE 2 3,794 52 24,200
18-Sep-18 INDONESIAAGARWAL COAL CORPORATION PVT LTD
STEAM (NON-COKING) COAL 3,925 54 30,000
3,926 54 25,350
20-Sep-18 INDONESIA
DHAR COAL PRODUCTS (P) LTD.,
STEAM (NON COKING) COAL
3,715 51 21,000
3,715 51 9,400
4,896 67 22,300
NLC TAMIL NADU POWER LIMITED
IMPORTED NON COKING (STEAMING) COAL 5,737 79 66,000
26-Sep-18 INDONESIA
ANU & ANUSH COAL LLP STEAM (NON COKING) COAL. 2,651 36 6,300
BALAJI MALTS PVT.LTD, STEAM COAL 2,632 36 18,000
2,632 36 3,600
DEVENDRAN COAL INTERNATIONAL PRIVATE LIMITED
STEAMING (NON COKING) COAL 3,812 52 41,250
ELITE NATURAL PRODUCTS STEAM (NON COKING) COAL. 2,651 36 15,000
ICOAL ENERGY PRIVATE LIMITED
STEAM (NON COKING) COAL. 2,651 36 10,000
MILLENIUM STEEL INDIA PVT LTD
STEAM (NON COKING) COAL. 2,651 36 21,000
SREE RENGARAJ ISPAT INDUSTRIES (P) LIMITED
STEAM COAL 2,790 38 30,000
THE RAMCO CEMENTS LIMITED
STEAMING (NON COKING) COAL 3,591 49 25,000
27-Sep-18 INDONESIAAGARWAL COAL CORPORATION PVT LTD
STEAM (NON COKING) COAL 3,618 49 30,000
3,618 49 19,890
28-Sep-18 INDONESIA
ADANI ENTERPRISES LIMITEDSTEAM COAL (AIFTA FORM AI NO 0000311BDA2018)
2,578 35 53,000
GLOBAL COAL VENTURES PRIVATE LIMITED
STEAMING (NON COKING) COAL 3,719 51 57,930
TUTICORIN / VOC Total 7,29,997
NEW MANGALORE
5-Sep-18 SOUTH AFRICA
HARE KRISHNA METALLICS PVT. LTD.,
COAL ORIGIN (GCV-6018 KCAL/KG, VOLAT ILE MATTER (ADB)- 23.50%)
6,470 91 10,000
ILC IRON & STEEL PVT LTDCOAL ORIGIN (GCV-6018 KCAL/KG, VOLA TILE MATTER (ADB) 23.50%)
6,470 91 5,000
6-Sep-18 SOUTH AFRICAAGARWAL COAL CORPORATION PVT LTD
STEAM (NON COKING) COAL (GCV ADB 6018 KCAL/KG VOLATILE MATTER ADB 23.50%)
6,399 90 9,377
10-Sep-18 SOUTH AFRICA
BALAJI MALTS PVT.LTD,STEAM COAL (NON COKING) (NCV KCAL/KG ARB 5415 VOLATILE MATTER 22.20%)
6,653 92 1,767
6,653 92 4,000
6,672 92 9,000
VANYA STEELS PRIVATE LIMITED
STEAM COAL (NON COKING) (NCV KCAL/KG ARB 5415 VOLATILE MATTER 22.20%)
6,875 95 10,000
11-Sep-18 INDONESIA SURYA EXIM LIMITEDSTEAM (NON COKING) COAL (GCV ARB 4093 KCAL/KG VOLATILE MATTER ADB 36.2%)
4,463 62 15,000
21-Sep-18 INDONESIA GRASIM INDUSTRIES LTD. STEAM (NON COKING) COAL 4,899 67 21,000
NON COKING COAL IMPORtS
Non Coking Coal imports into India through the selected ports September’18, Contd...
Ports Date Country of Origin Importers Item Description Unit Price (in Rs/Ton)
Unit Price (in $/Ton)
Quantity (in Tons)

October 31, 2018 | 73
NEW MANGALORE
21-Sep-18 INDONESIAJ AMBITION COAL AND MINERALS PRIVATE LIMITED
STEAM (NON COKING) COAL 4,710 64 33,972
NEW MANGALORE Total 1,19,116
MARMAGOA
4-Sep-18AUSTRALIA JSW STEEL LIMITED STEAM COAL 7,845 110 49,390
SOUTH AFRICA B M M ISPAT LTD STEAM COAL 6,931 97 8,000
5-Sep-18 SOUTH AFRICA B M M ISPAT LTD STEAM COAL 6,931 97 40,000
12-Sep-18 SOUTH AFRICA JSW STEEL LIMITED ZIBULO COAL 8,483 117 87,944
28-Sep-18 INDONESIA JSW ENERGY LIMITED STEAM COAL 4,331 59 73,072
MARMAGOA Total 2,58,406
MUMBAI
5-Sep-18 INDONESIATHE TATA POWER COMPANY LTD
STEAMING (NON COKING) COAL 6,574 92 48,860
17-Sep-18 INDONESIATHE TATA POWER COMPANY LTD
STEAMING (NON COKING) COAL 6,438 89 49,050
6,887 95 58,102
29-Sep-18 INDONESIATHE TATA POWER COMPANY LTD
STEAMING (NON COKING) COAL 6,312 86 56,350
MUMBAI Total 2,12,362
MUNDRA
6-Sep-18 INDONESIACOASTAL GUJARAT POWER LIMITED
STEAM COAL (GCV-4224 KCAL/KG & VM-42.8%) 3,975 56 1,60,965
8-Sep-18 MOZAMBIQUE ULTRATECH CEMENT LIMITEDSTEAM (NON COKING) COAL (NCV-5808 KCAL/KG & VM-18.4%)
7,107 98 55,000
11-Sep-18 INDONESIAGUJARAT STATE ELECTRICITY CORPORATION LTD,
STEM COAL (GCV-5519 KCAL/KG & VM-41.51%) 7,141 98 78,677
12-Sep-18 INDONESIA
ADI ENTERPRISESSTEAM COAL (GCV-5151 KCAL/KG & VM-39.83%)
5,328 73 7,500
COASTAL GUJARAT POWER LIMITED
STEAM COAL (HHV-5235 KCAL/KG & VM-39.9%) 5,566 77 1,91,914
GOEL SALES CORPORATIONSTEAM COAL (GCV-5151 KCAL/KG & VM-39.83%)
5,328 73 10,000
GUJARAT STATE ELECTRICITY CORPORATION LTD,
STEAM COAL (GCV-5390 KCAL/KG & VM-39.83%)
7,030 97 72,655
SHRI SATCHIDANAND PETROLEUMS PVT. LTD.
STEAM COAL (GCV-5151 KCAL/KG & VM-39.83%)
5,328 73 10,000
14-Sep-18
INDONESIA
ADANI WILMAR LIMITED STEAM COAL (GCV-5151KCAL/KG & VM-39.83%) 5,350 74 6,000
DHAVAL INDUSTRIAL CORPORATION
STEAM COAL (GCV-5151 KCAL/KG & VM-39.83%)
5,328 73 10,000
SSK INTERNATIONAL STEAM COAL (GCV-5151 KCAL/KG & VM-39.83%) 5,328 73 10,000
SOUTH AFRICA ADI ENTERPRISES STEAM COAL (GCV-5952 KCAL/KG & VM-25.1 9%) 7,527 104 10,000
UNITED STATES SHREE CEMENT LIMITEDNORTHERN APPALACHIAN THERMAL COAL (NCV 6859 KCAL/KGS (ARB) )
7,298 101 1,32,000
15-Sep-18 INDONESIA AAGAM COMMOTRADESTEAM COAL (GCV-5151 KCAL/KG & VM-39.83%)
5,328 73 10,000
17-Sep-18
INDONESIA
DHARAM ASSOCIATESSTEAM COAL (GCV-5151 KCAL/KG & VM-39.83%)
5,328 73 10,000
VARRSANA ISPAT LTD.STEAM COAL (GCV-5151 KCAL/KG & VM-39.83%)
6,150 85 10,000
SOUTH AFRICA ADANI ENTERPRISES LIMITEDSTEAM COAL (NCV-5952 KCAL/KG & VM-25.1 9%)
8,180 113 67,689
18-Sep-18 INDONESIA VERTIGO IMPEX PVT.LTD.STEAM COAL (GCV-5151 KCAL/KG & VM-39.83%)
5,328 73 10,000
20-Sep-18 SOUTH AFRICA ADANI ENTERPRISES LIMITEDSTEAM COAL (NCV-5903 KCAL/KG & VM-26.9 4%)
7,273 100 78,484
30-Sep-18 OTHERS NA NON COKING COAL (DETAILS NOT AVAILABLE) - - 17,22,692
MUNDRA Total 26,63,576
NON COKING COAL IMPORtS
Non Coking Coal imports into India through the selected ports September’18, Contd...
Ports Date Country of Origin Importers Item Description Unit Price (in Rs/Ton)
Unit Price (in $/Ton)
Quantity (in Tons)

October 31, 2018 | 74
KANDLA
4-Sep-18 INDONESIA
AGARWAL COAL CORPORATION PVT LTD
STEAM (NON COKING) COAL (GCV ARB 3328 KCAL/KG) (AIFTA CERTI NO.0000270/BDA/2018 DT.27.08.18)
2,574 36 30,000
STEAM (NON COKING) COAL (GCV ARB 3328 KCAL/KG) (AIFTA CERTI NO.0000271/BDA/2018 DT.27.08.18)
2,574 36 25,000
STEAM (NON COKING) COAL (GCV ARB 3328 KCAL/KG) (AIFTA CERTI NO.0000272/BDA/2018 DT.27.08.18)
2,574 36 5,500
MBG COMMODITIES PRIVATE LIMITED
STEAM NON COKING COAL (AIFTA CER TI NO.0000474/TJR/2018 DT25.08.2018) (GCV ARB 5306 KCAL/KG)
4,941 69 60,500
WELSPUN STEEL LTD.
STEAM (NON COKING) COAL GCV (ARB) 5051 K CAL/KG
5,259 74 15,000
STEAM (NON COKING) COAL, GCV (ARB) 5051 K CAL/KG
5,259 74 40,000
5-Sep-18 INDONESIATURNREST RESOURCES PVT. LTD.
STEAM COAL (AIFTA CERTI NO.0002258/SMD/20 18 DT.04.06.2018) (GCV ARB 4713 KCAL/KG)
4,842 68 5,000
6-Sep-18
INDONESIASWISS SINGAPORE INDIA PRIVATE LIMITED
STEAM COAL (GCV 3806 KCAL/KG) AIFTAPTNO:0000273/0000274/0000275/0000276/BDA/2018DT28.08.18
2,706 38 54,910
UNITED STATESSWISS SINGAPORE INDIA PRIVATE LIMITED
STEAM COAL (NCV (ARB) 6875 KCAL/KG) 7,640 107 33,224
7,640 107 90,000
7-Sep-18 INDONESIATURNREST RESOURCES PVT. LTD.
STEAM COAL (AIFTA CERTI NO.0002258/SMD/20 18 DT.04.06.2018) (GCV ARB 4713 KCAL/KG)
4,842 67 3,950
10-Sep-18 UNITED STATES DELTA GLOBAL PVT. LTD.CONSOL BEFH XCOAL HIGH CV THERMAL COAL (NCV ARB 6992 KCAL/KG)
8,050 111 70,000
11-Sep-18 INDONESIA MOHIT MINERALS LIMITED
STEAM (NON COKING) COAL (GCV3767ARB) AIFTAPT CERT.0000282/BDA/2018 DT.03.09.2018SR.NO.AIEAA2398
2,510 35 10,000
2,510 35 5,000
2,510 35 5,000
STEAM (NON COKING) COAL (GCV3767ARB) AIFTAPT CERT.0000283/BDA/2018 DT.03.09.2018SR.NO.AIEAA2399
2,510 35 5,000
STEAM (NON COKING) COAL (GCV3767ARB) AIFTAPT CERT.0000284BDA2018 DT.03.09.2018SR.NO.AIEAA2400
2,510 35 2,000
2,510 35 24,000
2,510 35 3,000
2,510 35 3,069
12-Sep-18 UNITED STATES DELTA GLOBAL PVT. LTD.CONSOL BEFH XCOAL HIGH CV THERMAL COAL (NCV ARB 6992 KCAL/KG)
8,050 111 10,000
13-Sep-18 INDONESIAINDIA COKE & POWER PRIVATE LIMITED
STEAM NON COKING COAL GCV 3566 KCAL/KGS ARB COO REF NO. 0003561/SMD/2018 SR NO AI-FAA-4691 DT 03.09.2018
3,265 45 24,200
STEAM NON COKING COAL GCV 4019 KCAL KGS ARB COO REF NO. 0003558/SMD/2018 SR NO AI-FAA-4688 DT 03.09.2018
3,918 54 15,000
STEAM NON COKING COAL GCV 4019 KCAL/KGS ARB COO REF NO. 0003557/SMD/2018 SR NO AI-FAA-4687 DT 03.09.2018
3,918 54 15,000
STEAM NON COKING COAL GCV 4019 KCAL/KGS ARB COO REF NO. 0003559/SMD/2018 SR NO AI-FAA-4689 DT 03.09.2018
3,918 54 8,500
14-Sep-18 SOUTH AFRICASWISS SINGAPORE INDIA PRIVATE LIMITED
STEAM COAL (NCV 5905 ARB) 7,925 109 31,948
7,925 109 23,046
NON COKING COAL IMPORtS
Non Coking Coal imports into India through the selected ports September’18, Contd...
Ports Date Country of Origin Importers Item Description Unit Price (in Rs/Ton)
Unit Price (in $/Ton)
Quantity (in Tons)

October 31, 2018 | 75
KANDLA
17-Sep-18 SOUTH AFRICA
JSW MINERALS TRADING PRIVATE LIMITED
STEAM (NON COKING) COAL (GCV ARB 5935 KCAL/KG)
7,558 104 57,603
VARRSANA ISPAT LTD.STEAM (NON COKING) COAL (GCV ARB 5935 KCAL/KG)
8,064 111 10,000
20-Sep-18
INDONESIASWISS SINGAPORE INDIA PRIVATE LIMITED
STEAM COAL (GCV KCAL/KG 4105 ARB AIFTA CERTI. NO. 0004989/BJM/2018 DTD. 12.09.2018.
3,652 50 51,400
UNITED STATES
COMSOL ENERGY PRIVATE LIMITED
THERMAL COAL (NCV 6214 KCAL/KGS ARB) 7,257 100 30,103
DELTA GLOBAL PVT. LTD.CONSOL BEFH XCOAL HIGH CV THERMAL COAL (NCV ARB 6992 KCAL/KG)
8,050 111 10,000
J.K.FUELS THERMAL COAL (NCV 6214 KCAL/KGS (ARB) ) 6,901 95 30,000
R.K.COALS THERMAL COAL (NCV 6214 KCAL/KGS (ARB) ) 6,901 95 30,000
SWISS SINGAPORE INDIA PRIVATE LIMITED
STEAM COAL (NCV 6622 ARB) 7,784 107 79,489
TATA INTERNATIONAL LIMITED STEAM COAL (GCV ARB 7140 KCAL/KG) 8,066 111 59,022
8,066 111 65,000
22-Sep-18
INDONESIA VIMAL COAL PRIVATE LIMITEDSTEAM COAL (GCV4321ARB) AIFTAPT CERT.0000502/TJR/2 018 DT.17.09.2018SR.NO.AIFAA4189
4,113 56 55,000
UNITED STATES THE INDIA CEMENTS LIMITED STEAM COAL (NCV 6622 ARB)
8,011 109 3,000
8,011 109 25,000
8,011 109 2,000
24-Sep-18 SOUTH AFRICATRAFIGURA INDIA PRIVATE LIMITED
STEAM COAL NCV 4862 KCAL/KGS ARB 6,516 88 25,145
STEAM COAL NCV 5939 KCAL/KGS ARB 7,842 106 52,710
27-Sep-18 INDONESIA
AARTI INDUSTRIES LIMITED STEAM COAL (GCV 4193 KCAL/KG) 3,719 51 2,000
GALLANTT METAL LTD STEAM COAL (GCV 4193 KCAL/KG) 3,701 50 15,000
KUTCH CHEMICAL INDUSTRIES LTD
STEAM COAL (GCV KCAL/KG 4105 ARB AIFTA CERTI. NO. 0004990/BJM/2018 DTD. 12.09.2018.
3,830 52 5,000
28-Sep-18
AUSTRALIA HINDUSTAN ZINC LIMITEDSTEAM COAL NET CALORIFIC VALUE ARB 5499 K CAL/KG
6,238 85 45,000
6,238 85 18,500
INDONESIA
ADI TRADELINKSTEAM COAL (GCV 4193 KCAL/KG) (CERTIFICA TE NO. 0005095/BJM/2018)
3,719 51 10,000
KUTCH CHEMICAL INDUSTRIES LTD
STEAM COAL (GCV 4193 KCAL/KG) 3,683 50 10,000
29-Sep-18
INDONESIA ADANI ENTERPRISES LIMITEDSTEAM COAL (GCV 4193 KCAL/KG) (CERTIFIC ATE NO. 0005096/BJM/2018)
3,829 52 42,276
SOUTH AFRICA J.K. CEMENT LTDSTEAM NON COKING COAL (GCV-ARB 5117 AND NCV-ARB 4930)
5,123 70 40,000
5,123 70 4,743
UNITED STATESJSW MINERALS TRADING PRIVATE LIMITED
CONSOL BEFH XCOAL HIGH CV THERMAL COAL (GCV ARB 7249 KCAL/KG)
7,767 105 85,082
KANDLA Total 14,80,920
MAGDALLA
5-Sep-18 INDONESIA GANDHAR COAL AND MINES STEAM (NON COKING) COAL 2,702 38 25,000
12-Sep-18 INDONESIAFC AGRAWAL COAL PRIVATE LIMITED
STEAM (NON COKING) COAL 5,256 72 15,000
5,256 72 10,000
14-Sep-18 INDONESIAINDIA COKE & POWER PRIVATE LIMITED
STEAM (NON COKING) COAL 3,544 49 55,000
15-Sep-18 INDONESIA SURYA EXIM LIMITED STEAM (NON COKING) COAL 4,593 63 27,500
NON COKING COAL IMPORtS
Non Coking Coal imports into India through the selected ports September’18, Contd...
Ports Date Country of Origin Importers Item Description Unit Price (in Rs/Ton)
Unit Price (in $/Ton)
Quantity (in Tons)

October 31, 2018 | 76
MAGDALLA
15-Sep-18 INDONESIA SURYA EXIM LIMITED STEAM (NON COKING) COAL 4,593 63 2,500
4,593 63 595
17-Sep-18 INDONESIA MOHIT MINERALS LIMITED STEAM (NON COKING) COAL 4,247 59 10,000
20-Sep-18 INDONESIAPHULCHAND EXPORTS PVT.LTD.
NON COKING COAL 4,144 57 30,000
4,144 57 6,825
24-Sep-18 INDONESIA
MBG COMMODITIES PRIVATE LIMITED
STEAM (NON COKING) COAL 5,139 70 24,000
SPARKLE COMMERCIAL PRIVATE LIMITED
STEAM (NON COKING) COAL
4,828 66 10,600
5,349 73 20,000
5,349 73 2,250
TARANJOT RESOURCES PRIVATE LIMITED
STEAM COAL 2,604 35 30,000
25-Sep-18 INDONESIA GARDEN SILK MILLS LIMITED STEAM COAL 3,131 43 23,550
27-Sep-18 INDONESIAAGARWAL COAL CORPORATION PVT LTD
STEAM (NON COKING) COAL 3,002 41 20,000
3,002 41 10,000
28-Sep-18 INDONESIA
AGARWAL COAL CORPORATION PVT LTD
STEAM (NON COKING) COAL 3,492 47 15,713
3,492 47 10,000
GANDHAR OIL REFINERY (INDIA) LTD.
STEAM NON COKING COAL 4,111 56 15,628
4,111 56 40,000
MAGDALLA Total 4,04,161
DAHEJ
6-Sep-18 SOUTH AFRICARELIANCE INDUSTRIES LIMITED
STEAM (NON COKING) COAL 5,540 78 75,051
10-Sep-18 INDONESIAGUJARAT FLUORO CHEMICALS LTD
STEAM COAL (ORIGINAL COPY OF AIFTA (COO) REF.NO. 0003452/SMD/2018 DT. 28.08.2018)
3,830 53 40,000
11-Sep-18 INDONESIA
GUJARAT STATE ELECTRICITY CORPORATION LTD,
STEAM COAL (ORIGINAL COPY OF AIFTA (COO) REF.NO. 0000494/TJR/2018 DT. 07.09.2018)
6,882 95 75,705
SHUBHALAKSHMI POLYESTERS LIMITED.
STEAM COAL (ORIGINAL COPY OF AIFTA (COO) REF.NO. 0003455/SMD/2018 DT. 28.08.2018)
3,863 53 6,000
14-Sep-18 INDONESIAGUJARAT STATE ELECTRICITY CORPORATION LTD,
STEAM COAL (ORIGINAL COPY OF AIFTA (COO) REF.NO. 0003472/SMD/2018 DT. 29.08.2018)
6,895 95 75,560
17-Sep-18 INDONESIA ADANI ENTERPRISES LIMITEDISTEAM COAL (ORIGINAL COPY OF AIFTA (COO) REF.NO. 0000461/KBG/2018 DT. 06.09.2018)
3,265 45 75,265
19-Sep-18 AUSTRALIARELIANCE INDUSTRIES LIMITED
STEAM (NON COKING) COAL 5,727 79 52
5,727 79 76,186
22-Sep-18 SOUTH AFRICA ADANI ENTERPRISES LIMITED STEAM COAL 7,383 100 74,182
25-Sep-18 INDONESIAADANI POWER RAJASTHAN LTD.
STEAM COAL 5,881 80 75,712
DAHEJ Total 5,73,713
HAZIRA
5-Sep-18 INDONESIARELIANCE INDUSTRIES LIMITED
STEAM (NON COKING) COAL (COO REFERENCE NO.0004706/BJ M/2018 DTD.28.08.2018)
4,936 69 73,000
7-Sep-18 INDONESIAAGARWAL COAL CORPORATION PVT LTD
STEAM NON COKING COAL 3,876 53 5,500
NON COKING COAL IMPORtS
Non Coking Coal imports into India through the selected ports September’18, Contd...
Ports Date Country of Origin Importers Item Description Unit Price (in Rs/Ton)
Unit Price (in $/Ton)
Quantity (in Tons)
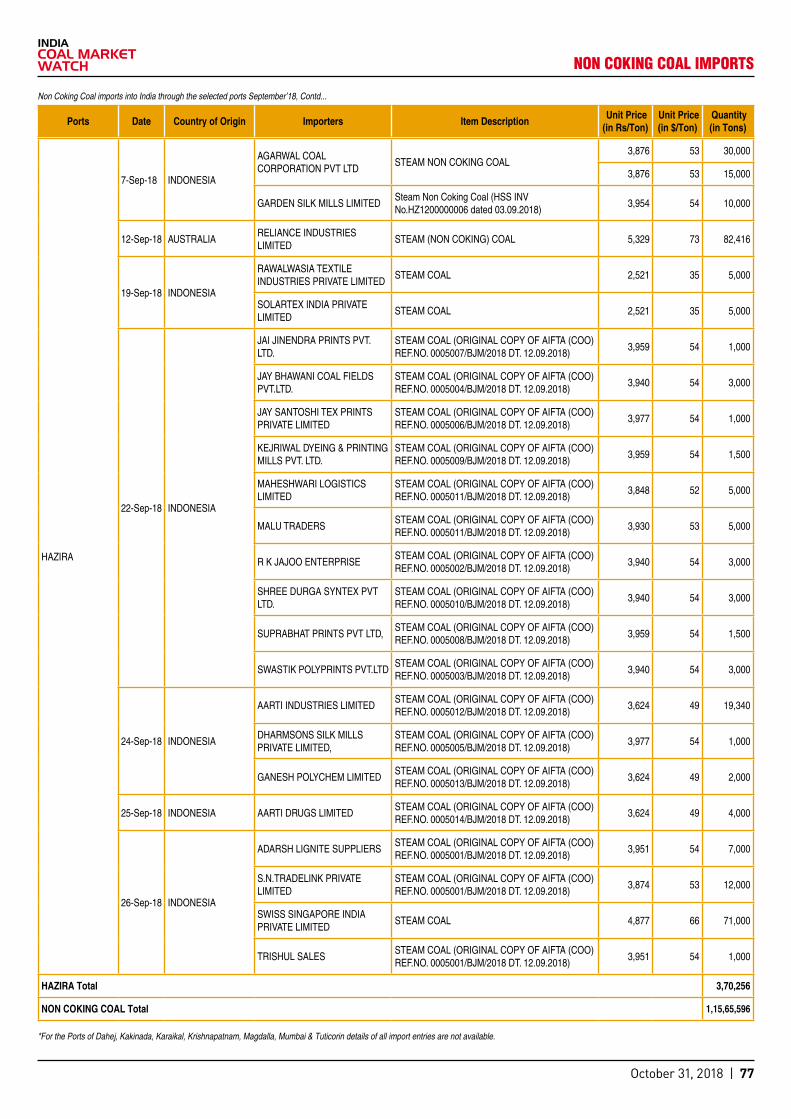
October 31, 2018 | 77
HAZIRA
7-Sep-18 INDONESIA
AGARWAL COAL CORPORATION PVT LTD
STEAM NON COKING COAL 3,876 53 30,000
3,876 53 15,000
GARDEN SILK MILLS LIMITEDSteam Non Coking Coal (HSS INV No.HZ1200000006 dated 03.09.2018)
3,954 54 10,000
12-Sep-18 AUSTRALIARELIANCE INDUSTRIES LIMITED
STEAM (NON COKING) COAL 5,329 73 82,416
19-Sep-18 INDONESIA
RAWALWASIA TEXTILE INDUSTRIES PRIVATE LIMITED
STEAM COAL 2,521 35 5,000
SOLARTEX INDIA PRIVATE LIMITED
STEAM COAL 2,521 35 5,000
22-Sep-18 INDONESIA
JAI JINENDRA PRINTS PVT. LTD.
STEAM COAL (ORIGINAL COPY OF AIFTA (COO) REF.NO. 0005007/BJM/2018 DT. 12.09.2018)
3,959 54 1,000
JAY BHAWANI COAL FIELDS PVT.LTD.
STEAM COAL (ORIGINAL COPY OF AIFTA (COO) REF.NO. 0005004/BJM/2018 DT. 12.09.2018)
3,940 54 3,000
JAY SANTOSHI TEX PRINTS PRIVATE LIMITED
STEAM COAL (ORIGINAL COPY OF AIFTA (COO) REF.NO. 0005006/BJM/2018 DT. 12.09.2018)
3,977 54 1,000
KEJRIWAL DYEING & PRINTING MILLS PVT. LTD.
STEAM COAL (ORIGINAL COPY OF AIFTA (COO) REF.NO. 0005009/BJM/2018 DT. 12.09.2018)
3,959 54 1,500
MAHESHWARI LOGISTICS LIMITED
STEAM COAL (ORIGINAL COPY OF AIFTA (COO) REF.NO. 0005011/BJM/2018 DT. 12.09.2018)
3,848 52 5,000
MALU TRADERSSTEAM COAL (ORIGINAL COPY OF AIFTA (COO) REF.NO. 0005011/BJM/2018 DT. 12.09.2018)
3,930 53 5,000
R K JAJOO ENTERPRISESTEAM COAL (ORIGINAL COPY OF AIFTA (COO) REF.NO. 0005002/BJM/2018 DT. 12.09.2018)
3,940 54 3,000
SHREE DURGA SYNTEX PVT LTD.
STEAM COAL (ORIGINAL COPY OF AIFTA (COO) REF.NO. 0005010/BJM/2018 DT. 12.09.2018)
3,940 54 3,000
SUPRABHAT PRINTS PVT LTD,STEAM COAL (ORIGINAL COPY OF AIFTA (COO) REF.NO. 0005008/BJM/2018 DT. 12.09.2018)
3,959 54 1,500
SWASTIK POLYPRINTS PVT.LTDSTEAM COAL (ORIGINAL COPY OF AIFTA (COO) REF.NO. 0005003/BJM/2018 DT. 12.09.2018)
3,940 54 3,000
24-Sep-18 INDONESIA
AARTI INDUSTRIES LIMITEDSTEAM COAL (ORIGINAL COPY OF AIFTA (COO) REF.NO. 0005012/BJM/2018 DT. 12.09.2018)
3,624 49 19,340
DHARMSONS SILK MILLS PRIVATE LIMITED,
STEAM COAL (ORIGINAL COPY OF AIFTA (COO) REF.NO. 0005005/BJM/2018 DT. 12.09.2018)
3,977 54 1,000
GANESH POLYCHEM LIMITEDSTEAM COAL (ORIGINAL COPY OF AIFTA (COO) REF.NO. 0005013/BJM/2018 DT. 12.09.2018)
3,624 49 2,000
25-Sep-18 INDONESIA AARTI DRUGS LIMITEDSTEAM COAL (ORIGINAL COPY OF AIFTA (COO) REF.NO. 0005014/BJM/2018 DT. 12.09.2018)
3,624 49 4,000
26-Sep-18 INDONESIA
ADARSH LIGNITE SUPPLIERSSTEAM COAL (ORIGINAL COPY OF AIFTA (COO) REF.NO. 0005001/BJM/2018 DT. 12.09.2018)
3,951 54 7,000
S.N.TRADELINK PRIVATE LIMITED
STEAM COAL (ORIGINAL COPY OF AIFTA (COO) REF.NO. 0005001/BJM/2018 DT. 12.09.2018)
3,874 53 12,000
SWISS SINGAPORE INDIA PRIVATE LIMITED
STEAM COAL 4,877 66 71,000
TRISHUL SALESSTEAM COAL (ORIGINAL COPY OF AIFTA (COO) REF.NO. 0005001/BJM/2018 DT. 12.09.2018)
3,951 54 1,000
HAZIRA Total 3,70,256
NON COKING COAL Total 1,15,65,596
Non Coking Coal imports into India through the selected ports September’18, Contd...
Ports Date Country of Origin Importers Item Description Unit Price (in Rs/Ton)
Unit Price (in $/Ton)
Quantity (in Tons)
NON COKING COAL IMPORtS
*For the Ports of Dahej, Kakinada, Karaikal, Krishnapatnam, Magdalla, Mumbai & Tuticorin details of all import entries are not available.

October 31, 2018 | 78
23.0%
19.1%
12.8% 6.3% 5.0%5.0%
4.9%
23.9%
MUNDRA KRISHNAPATNAM KANDLA TUTICORIN / VOC
VIZAG DAHEJ GANGAVARAM OTHERS
48.4%
22.0%
7.7%
5.2%
1.0%
15.7%
INDONESIA SOUTH AFRICA UNITED STATES
AUSTRALIA RUSSIA OTHERS
Major ports through which Non Coking Coal arrived in India September’18
Major Non Coking Coal supplier countries to India (through selected ports) September’18
Major ports through which Non Coking Coal arrived in India September’18
Port Qty (in Tons)
MUNDRA 26,63,576
KRISHNAPATNAM 22,10,145
KANDLA 14,80,920
TUTICORIN / VOC 7,29,997
VIZAG 5,83,200
DAHEJ 5,73,713
GANGAVARAM 5,64,801
ENNORE 5,15,748
PARADIP 4,08,972
MAGDALLA 4,04,161
HAZIRA 3,70,256
MARMAGOA 2,58,406
KARAIKAL 2,46,333
KOLKATA 2,23,682
MUMBAI 2,12,362
NEW MANGALORE 1,19,116
CHENNAI 208
Grand Total 1,15,65,596
Major Non Coking Coal supplier countries to India (through selected ports) September’18
Country of Origin Qty (in Tons)
INDONESIA 55,98,876
SOUTH AFRICA 25,43,217
OTHERS 17,22,692
UNITED STATES 8,86,775
AUSTRALIA 6,06,855
RUSSIA 1,13,881
MOZAMBIQUE 93,300
Grand Total 1,15,65,596
Note: Figures are based on consignment lifted from these ports for which price details/break-up is available with ICMW team
NON COKING COAL IMPORtS

October 31, 2018 | 79
Ports Date Country of Origin Importers Item Description Unit Price
(in Rs/Ton) Unit Price (in $/Ton)
Quantity (in Tons)
KOLKATA
4-Sep-18 RUSSIA PARAGON OVERSEAS LTD.ANTHRACITE COAL (M:1.8%, ASH: 7.4%, VM:3.3%, FC:89.3%,.SULPHUR :0.93%, SIZE: 0.3-3MM 90.2%)
16,495 232 223
6-Sep-18 CHINACARBON RESOURCES PVT LTD
ELECTRICALLY CALCINED ANTHRACITE COAL 32,754 461 98
32,754 461 190
8-Sep-18 CHINACARBON RESOURCES PVT LTD
ELECTRICALLY CALCINED ANTHRACITE COAL 34,544 476 504
10-Sep-18 RUSSIAJAI BALAJI INDUSTRIES LIMITED
ANTHRACITE COAL (DETAILS AS PER INVOICE)
16,029 221 561
16,029 221 504
14-Sep-18 CHINACARBON RESOURCES PVT LTD
ELECTRICALLY CALCINED ANTHRACITE COAL 34,193 471 120
18-Sep-18 RUSSIA SATVIK ENTERPRISES LTD ANTHRACITE COAL 15,236 210 1,065
28-Sep-18 RUSSIASURYA ALLOY INDUSTRIES LIMITED
ANTHRACITE COAL (DETAILS AS PER INVOICE)
14,067 191 421
29-Sep-18 RUSSIAJAI BALAJI INDUSTRIES LIMITED
ANTHRACITE COAL (DETAILS AS PER INVOICE)
16,029 218 28
KOLKATA Total 3,713
PARADIP
4-Sep-18 RUSSIA BHUSHAN STEEL LIMITED ANTHRACITE COAL 8,436 119 35,000
18-Sep-18
RUSSIA ESSAR STEEL INDIA LTD. ANTHRACITE COAL 10,425 144 27,500
VIETNAM VISA MINMETAL LIMITEDHONGAI ANTHRACITE COAL NO.4 OF VIETNAMESE ORIGIN (LUMP COAL NO.4A.1)
17,920 247 8,796
PARADIP Total 71,296
VIZAG
7-Sep-18 RUSSIAINDIA COKE & POWER PRIVATE LIMITED
ANTHRACITE COAL 10,883 150 7,500
11-Sep-18 VIETNAM SAATVIK FERRO LIMITED VIETNAMESE ANTHRACITE COAL 10,748 148 498
28-Sep-18 RUSSIAJINDAL STAINLESS {HISAR} LIMITED
ANTHRACITE COAL M: 8.0%MAX, A:10%MAX, VM:3% ,P:0.01%MAX FIX CARBON 87%MIN, S:1% MAX, SIZE: 10-30MM, 85%MIN
14,732 200 281
29-Sep-18 RUSSIAS R G MINERALS AND METALS
ANTHRACITE COAL-MOISTURE-6.3%, ASH-7.3%, VOLATILE MATT ER-2.9%,FC-89.8%, SULPHUR-0.77%, NCV-7572 KCAL/KG
13,994 190 506
30-Sep-18 RUSSIA VANDANA GLOBAL LTD.,
ANTHRACITE COAL (SIZE:0 TO 13MM) (ASH DB-13.0% & VM DB-3.8%)
11,195 152 507
ANTHRACITE COAL (SIZE:0 TO 3MM) (ASH DB-4.6% & VM DB-2.1%)
16,645 226 249
VIZAG Total 9,541
KRISHNAPATNAM
4-Sep-18 RUSSIA B M M ISPAT LTD ANTHRACITE COAL 11,453 161 8,000
11,454 161 402
5-Sep-18 RUSSIA
B M M ISPAT LTD ANTHRACITE COAL 11,453 161 2,000
KIRLOSKAR FERROUS INDUSTRIES LIMITED
ANTHRACITE COAL 10,629 150 3,000
RAWMET RESOURCES PVT. LTD.
ANTHRACITE COAL 10,238 144 20,647
ANtHRACItE COAL IMPORtS INtO INDIA tHROUGH tHE MENtIONED PORtS SEPtEMbER’18
ANtHRACItE COAL IMPORtS

October 31, 2018 | 80
KRISHNAPATNAM
6-Sep-18 RUSSIA JSW STEEL LIMITED ANTHRACITE COAL 9,919 140 36,072
9,919 140 7,800
20-Sep-18 RUSSIA JSW STEEL LIMITED ANTHRACITE COAL 10,122 140 23,628
10,122 140 17,006
KRISHNAPATNAM Total 1,18,554
CHENNAI
1-Sep-18 CHINA
HEADWIN EXIM PRIVATE LIMITED
ELECTRICALLY CALCINED ANTHRACITE COAL 34,128 480 120
38,252 538 120
GAS CALCINED ANTHRACITE COAL 29,507 415 240
30,715 432 240
M K CARBON GAS CALCINED ANTHRACITE COAL 30,573 430 120
10-Sep-18 CHINAGRS GRAPHITE PRIVATE LIMITED
CALCINED ANTHRACITE COAL F.C 93% MIN: S:0.30%MAX M:0.5% MAX: ASH:6.5% MAX V.M 1.2% MAX SIZE:1-5MM, 90% MIN
34,461 475 108
17-Sep-18 CHINA
HEADWIN EXIM PRIVATE LIMITED
ELECTRICALLY CALCINED ANTHRACITE COAL 39,032 538 120
GAS CALCINED ANTHRACITE COAL 31,342 432 240
M K CARBONELECTRICALLY CALCINED ANTHRACITE COAL
38,452 530 120
38,814 535 120
GAS CALCINED ANTHRACITE COAL 31,197 430 120
18-Sep-18 CHINA M K CARBON GAS CALCINED ANTHRACITE COAL 31,197 430 120
24-Sep-18 SOUTH KOREAKISUL ENVIRO INDIA PRIVATE LIMITED
MEDIA (ANTHRACITE) 1,13,421 1,540 0.15
CHENNAI Total 1,788
MUNDRA
4-Sep-18 CHINAEXPONUS TRADELINK PRIVATE LIMITED
CALCINED ANTHRACITE COAL (F.C:93 MIN;S:0.3%MAX;ASH:,6.5%MAX;V M:1.5%MAX:MOISTURE:1.0%MAX;SIZE:1-5MM,90%MIN) (AS PER INV,BL)
29,151 410 27
5-Sep-18 CHINA FS INTERNATIONALCALCINED ANTHRACITE COAL 2160 BAGS OTHER DETAILS AS PER INV / P.L & B/L
28,440 400 54
6-Sep-18 RUSSIALAXMI LINING MATERIALS PVT. LTD.
ANTHRACITE (NATURAL) SPEC: FIXED CARBON (DB) :90% MIN MOIST:3. 0%MAX, ASH (DB) :6.0% MAX (SIZE: 1.0-4.0MM)-DTL AS PER INV, P
17,903 252 140
17-Sep-18 CHINA ALLOYSMIN INDUSTRIES GRAPHITIZED ANTHRACITE COAL 59,128 815 100
20-Sep-18 CHINA VANAJAA TRADERS CALCINED ANTHRACITE COAL 28,295 390 27
33,736 465 27
22-Sep-18 RUSSIA DCM SHRIRAM LIMITEDANTHRACITE COAL (CARBURETANT AC FURNACE)
13,331 181 982
25-Sep-18 CHINA FS INTERNATIONALCALCINED ANTHRACITE COAL 2000 BAGS AS PER INV / P/L. & B.L.
26,882 365 50
MUNDRA Total 1,407
ANTHRACITE COAL Total 2,06,300
*For the Ports of Dahej, Kakinada, Karaikal, Krishnapatnam, Magdalla, Mumbai & Tuticorin details of all import entries are not available.
Anthracite Coal imports into India through the mentioned ports September’18, Contd...
Ports Date Country of Origin Importers Item Description Unit Price
(in Rs/Ton) Unit Price (in $/Ton)
Quantity (in Tons)
ANtHRACItE COAL IMPORtS

October 31, 2018 | 81
Ports Date Country of Origin Importers Item Description Unit Price (in Rs/Ton)
Unit Price (in $/Ton)
Quantity (in Tons)
KOLKATA
3-Sep-18 CANADA TATA STEEL LIMITED TECK GREY WOLF COAL-COKING COAL 12,319 173 4,924
5-Sep-18 UNITED STATES JAI BALAJI INDUSTRIES LIMITEDLEER HARD COKING COAL (INV NO: ARPL/18-19/CC/UI/0257-B DT: 17/08/2018)
14,312 201 9,980
6-Sep-18
AUSTRALIAELECTROSTEEL CASTINGS LIMITED
BEDFORD COKING COAL 12,921 182 7,677
12,921 182 3,224
UNITED STATES RAWMET RESOURCES PVT. LTD.
LEER HARD COKING COAL ASH (ADB7.34%) GOODS ARE CQD BA SIS AS CONT DT13/7/2018 (SVB S44-12/2016A (SVB) DT.28/11/2017)
13,296 187 21,457
7-Sep-18 AUSTRALIA
STEEL AUTHORITY OF INDIA LIMITED
FRESHLY MINED AND WASHED BLACKWATER SOFT COKING COAL
12,778 176 31,961
TATA STEEL LIMITEDMORANBAH NORTH COKING COAL-COKING COAL
14,895 205 5,826
12-Sep-18 UNITED STATESSTEEL AUTHORITY OF INDIA LIMITED
FRESHLY MINED PRIME QUALITY WASHED/UNWASHED CAMBRIA CREEK MEDIUM VOLATILE HARD COKING COAL FROM THE MCCLURE CAMBRIA CREE
14,691 202 31,546
14-Sep-18 AUSTRALIASTEEL AUTHORITY OF INDIA LIMITED
FRESHLY MINED AND WASHED ILLAWARA ‘A’ HARD COKING COAL (BLEN D OF 80% BULLI SEAM AND 20% WONGAWILLI SEAM COALS)
14,912 206 29,587
15-Sep-18 AUSTRALIASTEEL AUTHORITY OF INDIA LIMITED
FRESHLY MINED AND WASHED ISAAC COKING COAL (BLEND OF 65% M ORANBAH NORTH AND 35% GERMAN CREEK COKING COALS)
14,142 195 27,668
17-Sep-18 AUSTRALIA
ELECTROSTEEL STEELS LIMITED.
POITREL COKING COAL 11,970 165 26,556
TATA STEEL LIMITED BEDFORD COKING COAL-COKING COAL 13,732 189 25,000
20-Sep-18 AUSTRALIASTEEL AUTHORITY OF INDIA LIMITED
FRESHLY MINED AND WASHED ISAAC COKING COAL (BLEND OF 65% MORANBAH NORTH AND 35% GERMAN CREEK COKING COALS)
14,330 198 32,275
24-Sep-18 AUSTRALIASTEEL AUTHORITY OF INDIA LIMITED
FRESHLY MINED AND WASHED GOONYELLA COKING COAL
14,908 202 32,381
25-Sep-18 NEW ZEALAND TATA STEEL LIMITED COKING COAL-COKING COAL 11,934 162 11,216
26-Sep-18 AUSTRALIA TATA STEEL LIMITED ILLAWARRA COKING COAL, COKING COAL 14,663 199 25,000
27-Sep-18 AUSTRALIATATA STEEL LIMITED POITREL COKING COAL-COKING COAL 11,964 162 22,000
TATA METALIKS LIMITED POITREL COKING COAL-COKING COAL 12,065 164 10,000
28-Sep-18 AUSTRALIA
ELECTROSTEEL CASTINGS LIMITED
PEAK DOWNS NORTH COKING COAL
13,930 189 5,459
13,930 189 5,521
13,930 189 11,287
13,930 189 325
13,930 189 5,919
13,930 189 3,393
TATA STEEL LIMITED ILLAWARRA COKING COAL-COKING COAL 14,651 199 6,551
KOLKATA Total 3,96,733
PARADIP
1-Sep-18 UNITED STATES RAWMET RESOURCES PVT. LTD. LEER HARD COKING COAL 13,127 185 45,394
3-Sep-18AUSTRALIA BHUSHAN STEEL LIMITED PEAK DOWNS NORTH X COKING COAL 13,824 194 78,000
CANADA TATA STEEL LIMITED TECH GREY WOLF COAL-COKING COAL 12,319 173 3,076
5-Sep-18 AUSTRALIAINDIA COKE & POWER PRIVATE LIMITED
GOONYELLA COKING COAL
14,092 198 39,966
14,092 198 40,000
14,149 199 39,806
14,149 199 39,840
COKING COAL IMPORtS INtO INDIA tHROUGH tHE MENtIONED PORtS SEPtEMbER’18
COKING COAL IMPORtS

October 31, 2018 | 82
PARADIP
5-Sep-18 AUSTRALIA
JINDAL STEEL & POWER LIMITED
LAKE VERMONT HARD COKING COAL 13,316 187 30,000
13,316 187 14,601
LAKE VERMONT HARD COKINGCOAL 13,316 187 10,000
VISA MINMETAL LIMITED PEAK DOWNS NORTH COKING COAL 14,671 206 15,000
10-Sep-18 AUSTRALIABHUSHAN STEEL LIMITED GOONYELLA COKING COAL 14,981 206 73,851
VISA MINMETAL LIMITED PEAK DOWNS NORTH COKING COAL 14,771 204 8,000
12-Sep-18 AUSTRALIATRAFIGURA INDIA PRIVATE LIMITED
PEAK DOWNS NORTH COKING COAL 13,785 190 31,850
14-Sep-18 AUSTRALIAELECTROSTEEL STEELS LIMITED.
POITREL COKING COAL 11,970 165 48,000
17-Sep-18 AUSTRALIA JINDAL COKE LTD., PEAK DOWNS NORTH COKING COAL 14,221 196 7,000
14,221 196 15,000
20-Sep-18
AUSTRALIASTEEL AUTHORITY OF INDIA LIMITED
COKING COAL 11,739 162 48,500
MOZAMBIQUEJINDAL STEEL & POWER LIMITED
SEMI HARD COKING COAL 12,188 168 17,301
12,230 169 20,000
25-Sep-18 AUSTRALIA BHUSHAN STEEL LIMITED INTEGRA COKING COAL 10,978 149 79,702
PARADIP Total 7,04,887
VIZAG
7-Sep-18 AUSTRALIASTEEL AUTHORITY OF INDIA LIMITED
FRESHLY MINED AND WASHED ILLAWARR ‘A’ HARD COKING COAL AGMT NO. 240/2017
14,912 206 40,000
11-Sep-18 AUSTRALIASTEEL AUTHORITY OF INDIA LIMITED
FRESHLY MINED AND WASHED ISAAC COKING COAL AS PER AGREEMENT NO 230/2013
14,330 198 40,000
12-Sep-18 AUSTRALIASTEEL AUTHORITY OF INDIA LIMITED
FRESHLY MINED AND WASHED BLACKWATER SOFT COKING COAL AGMT NO . 236/2015
12,778 176 8,263
FRESHLY MINED AND WASHED GOONYELA COKING COAL AGMT NO.236/20 15
14,685 202 40,000
13-Sep-18 UNITED STATESSTEEL AUTHORITY OF INDIA LIMITED
FRESHLY MINED PRIME QUALITY WASHED/UNWASHED CCMV HARD COKING COAL AGMT NO. 235/2015
14,691 202 7,212
15-Sep-18 AUSTRALIASTEEL AUTHORITY OF INDIA LIMITED
FRESHLY MINED AND WASHED ILLAWARR ‘A’ HARD COKING COAL AGMT NO. 240/2017,MAIN BE NO.7952048/07.08.2018
14,912 206 8,629
18-Sep-18 AUSTRALIASTEEL AUTHORITY OF INDIA LIMITED
FRESHLY MINED AND WASHED ISAAC COKING COAL AS PER AGREEMENT NO 230/2013, MAIN BE NO.7996941/11.09.2018
14,330 198 3,495
24-Sep-18 AUSTRALIASTEEL AUTHORITY OF INDIA LIMITED
FRESHLY MINED AND WASHED GOONYELA COKING COAL AGMT NO.236/20 15, MAIN BE NO.8020718/12.09.2018
14,908 202 1,777
FRESHLY MINED AND WASHED GOONYELLA C COKING COAL AGMT NO. 23 Jun-15
14,634 199 40,000
VIZAG Total 1,89,376
GANGAVARAM
3-Sep-18 AUSTRALIARASHTRIYA ISPAT NIGAM LIMITED
BLACKWATER SOFT COKING COAL 12,509 176 78,770
17-Sep-18 MOZAMBIQUERASHTRIYA ISPAT NIGAM LIMITED
BENGA COKING COAL 12,743 176 38,600
24-Sep-18 AUSTRALIARASHTRIYA ISPAT NIGAM LIMITED
GOONYELLA COKING COAL 14,800 201 25,614
PEAK DOWNS COKING COAL 15,073 205 54,559
GANGAVARAM Total 1,97,542
KRISHNAPATNAM 1-Sep-18 AUSTRALIA JSW STEEL LIMITED SOFT COKING COREX COAL
9,672 136 29,313
9,672 136 38,524
9,672 136 10,061
Coking Coal imports into India through the mentioned ports September’18, Contd...
Ports Date Country of Origin Importers Item Description Unit Price (in Rs/Ton)
Unit Price (in $/Ton)
Quantity (in Tons)
COKING COAL IMPORtS

October 31, 2018 | 83
KRISHNAPATNAM
4-Sep-18 AUSTRALIA SRIKALAHASTHI PIPES LIMITED BEDFORD COKING COAL 12,805 180 22,000
10-Sep-18 CANADA JSW STEEL LIMITED
TECK ICE MOUNTAIN COKING COAL 12,553 173 1,02,499
12,553 173 2,890
TECK STANDARD COKING COAL
14,563 201 15,139
14,563 201 24,450
14,563 201 14,797
24-Sep-18 AUSTRALIA SRIKALAHASTHI PIPES LIMITED PEAK DOWNS NORTH COKING COAL
13,615 185 20,240
13,615 185 18,700
13,615 185 6,060
KRISHNAPATNAM Total 3,04,672
NEW MANGALORE10-Sep-18 RUSSIA SATHAVAHANA ISPAT LIMITED OS COKING COAL 12,035 166 10,000
11-Sep-18 RUSSIA BENGAL ENERGY LIMITED OS COKING COAL 11,840 163 14,150
NEW MANGALORE Total 24,150
MARMAGOA
4-Sep-18 AUSTRALIA JSW STEEL LIMITED MAULES CREEK SEMI SOFT COKING COAL 11,652 164 38,610
6-Sep-18 MOZAMBIQUE JSW STEEL LIMITED MZ2 HARD COKING COAL 11,201 158 73,875
7-Sep-18 AUSTRALIA JSW STEEL LIMITEDMORANBAH NORTH BKC HARD COKING COAL
14,888 205 82,860
11-Sep-18 AUSTRALIA JSW STEEL LIMITED KESTREL 6.5% ASH COKING COAL 13,090 180 25,300
12-Sep-18 AUSTRALIA JSW STEEL LIMITEDMORANBAH NORTH BKC HARD COKING COAL
14,847 205 82,860
MARMAGOA Total 3,03,505
MUNDRA
10-Sep-18UNITED ARAB EMIRATES
COKE INDIA CORP COAL (O/D AS PER BL) 9,814 135 96
11-Sep-18 MOZAMBIQUE H.K. ENTERPRISES MZ2 HARD COKING COAL (MZ2) 13,037 180 10,000
12-Sep-18 AUSTRALIA JINDAL SAW LIMITED BLACKWATER WEAK COKING COAL
11,317 156 16,186
11,317 156 15,205
11,317 156 23,609
17-Sep-18 AUSTRALIA JINDAL SAW LIMITED GOONYELLA COKING COAL
14,526 200 22,971
14,526 200 44,365
14,526 200 42,664
18-Sep-18 MOZAMBIQUE H.K. ENTERPRISES MOATIZE THERMAL COAL (MZTH) 7,558 104 9,900
26-Sep-18 MOZAMBIQUE H.K. ENTERPRISESMOATIZE LOW VOL HARD COKING COAL (MLV)
15,356 209 5,000
MUNDRA Total 1,89,996
KANDLA
6-Sep-18 AUSTRALIA HARSH FUELS PRIVATE LIMITED PEAK DOWNS NORTH COKING COAL 14,735 207 8,000
8-Sep-18 AUSTRALIA NARAYANI COKE PVT.LTD. PEAK DOWNS NORTH COKING COAL 15,035 207 9,500
10-Sep-18 AUSTRALIA
NARAYANI COKE PVT.LTD. PEAK DOWNS NORTH COKING COAL 15,035 207 9,705
UNITED COKE PVT.LTD.PEAK DOWNS NORTH COKING COAL (TM- 9.3% AND ASH- 10.4%)
15,035 207 5,000
15,415 212 5,000
KANDLA Total 37,205
HAZIRA 29-Sep-18 UNITED KINGDOMFLOMETALLIC INDIA PRIVATE LIMITED
145 GRADED COAL ACD0145-11-895-H0950 29,029 394 57
HAZIRA Total 57
COKING COAL Total 23,48,124
COKING COAL IMPORtS
Coking Coal imports into India through the mentioned ports September’18, Contd...
Ports Date Country of Origin Importers Item Description Unit Price (in Rs/Ton)
Unit Price (in $/Ton)
Quantity (in Tons)
*For the Ports of Dahej, Kakinada, Karaikal, Krishnapatnam, Magdalla, Mumbai & Tuticorin details of all import entries are not available.
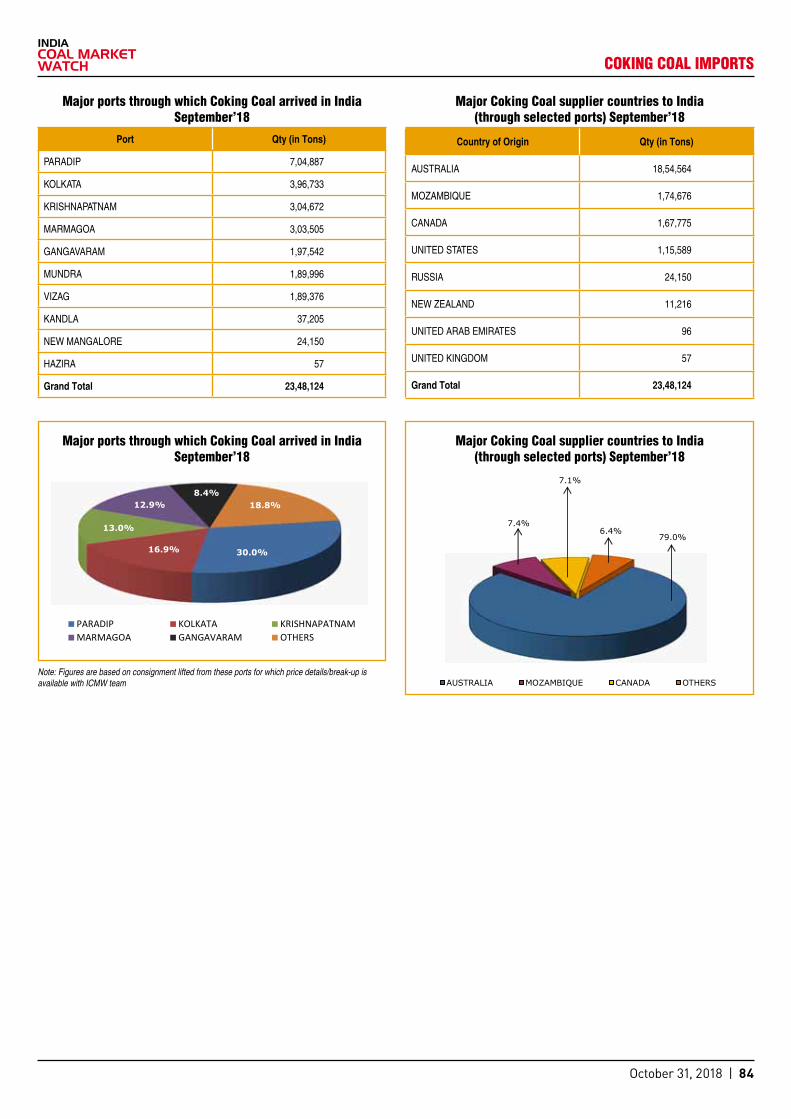
October 31, 2018 | 84
30.0%16.9%
13.0%
12.9%8.4%
18.8%
PARADIP KOLKATA KRISHNAPATNAMMARMAGOA GANGAVARAM OTHERS
79.0%
7.4%
7.1%
6.4%
AUSTRALIA MOZAMBIQUE CANADA OTHERS
Major ports through which Coking Coal arrived in India September’18
Major Coking Coal supplier countries to India (through selected ports) September’18
Major ports through which Coking Coal arrived in India September’18
Port Qty (in Tons)
PARADIP 7,04,887
KOLKATA 3,96,733
KRISHNAPATNAM 3,04,672
MARMAGOA 3,03,505
GANGAVARAM 1,97,542
MUNDRA 1,89,996
VIZAG 1,89,376
KANDLA 37,205
NEW MANGALORE 24,150
HAZIRA 57
Grand Total 23,48,124
Major Coking Coal supplier countries to India (through selected ports) September’18
Country of Origin Qty (in Tons)
AUSTRALIA 18,54,564
MOZAMBIQUE 1,74,676
CANADA 1,67,775
UNITED STATES 1,15,589
RUSSIA 24,150
NEW ZEALAND 11,216
UNITED ARAB EMIRATES 96
UNITED KINGDOM 57
Grand Total 23,48,124
Note: Figures are based on consignment lifted from these ports for which price details/break-up is available with ICMW team
COKING COAL IMPORtS

October 31, 2018 | 85
Ports Date Country of Origin Importers Item Description Unit Price
(in Rs/Ton) Unit Price(in $/Ton)
Quantity(in Tons)
KOLKATA
6-Sep-18 AUSTRALIAELECTROSTEEL CASTINGS LIMITED
YARRABEE PCI COAL
11,306 159 526
11,306 159 10,050
11,306 159 8,078
11,306 159 3,347
11-Sep-18 AUSTRALIASTEEL AUTHORITY OF INDIA LIMITED
CENTURY PCI COAL 11,336 156 32,795
14-Sep-18 AUSTRALIASTEEL AUTHORITY OF INDIA LIMITED
FRESHLY MINED AND WASHED POITREL PCI COAL
10,075 139 31,659
KOLKATA Total 86,454
PARADIP 5-Sep-18 AUSTRALIAJINDAL STEEL & POWER LIMITED
LAKE VERMONT PCI COAL 10,156 143 12,556
10,156 143 20,000
PARADIP Total 32,556
VIZAG
3-Sep-18 AUSTRALIASTEEL AUTHORITY OF INDIA LIMITED
CENTURY PCI COAL 11,109 156 70,000
11-Sep-18 AUSTRALIASTEEL AUTHORITY OF INDIA LIMITED
CENTURY PCI COAL MAIN BE NO.7888517, DT:-03.09.2018
11,336 156 5,205
VIZAG Total 75,205
KRISHNAPATNAM 1-Sep-18 AUSTRALIA JSW STEEL LIMITED JELLINBAH PCI COAL
9,778 138 65,358
9,778 138 1,337
9,778 138 20,863
KRISHNAPATNAM Total 87,558
CHENNAI 14-Sep-18 COLOMBIAOSWAL SMELTERS PVT LTD
NON COKING COAL 16,280 224 405
CHENNAI Total 405
MUMBAI 17-Sep-18 MOZAMBIQUE VEDANTA LIMITEDCOAL SAMPLES (NCV) (FOR DESTRUCTIVE ANALYSIS PURPOSE ONLY)
2,834 39 0.26
2,856 39 0.25
2,868 40 0.25
MUMBAI Total 1
MAGDALLA 24-Sep-18 AUSTRALIAESSAR STEEL INDIA LTD.
JELINBAH PCI COAL 11,240 153 88,000
MAGDALLA Total 88,000
PCI COAL Total 3,70,179
PCI COAL IMPORtS INtO INDIA tHROUGH tHE MENtIONED PORtS SEPtEMbER’18
*For the Ports of Dahej, Kakinada, Karaikal, Krishnapatnam, Magdalla, Mumbai & Tuticorin details of all import entries are not available.
PCI COAL IMPORtS

October 31, 2018 | 86
Ports Date Country of Origin Importers Item Description Unit Price (in Rs/Ton)
Unit Price (in $/Ton)
Quantity (in Tons)
KOLKATA
10-Sep-18 UNITED KINGDOMASSAM CARBON PRODUCTS LTD.
400 X 25 KG BAGS LOW ASH FOUNDRY COKE 240# (Z38W)
48,565 669 10
13-Sep-18
CHINARAWMET RESOURCES PVT. LTD.
GAS COKE (TOTAL MOISTURE ARB14.91%,ASH DB7.35%,VOLATILE MATTE R DB6.92%,SUL DB0.34%,FIXED CARBON DB85.73%,PHOS DB0.009%)
15,611 215 497
COLOMBIAELECTROSTEEL CASTINGS LIMITED
LOW ASH METALLURGICAL COKE BREEZE
12,261 169 1,073
12,261 169 494
12,261 169 242
12,261 169 161
15-Sep-18 COLOMBIA
ORISSA METALIKS PRIVATE LIMITED
LOW ASH METALLURGICAL COKE BREEZE 10,955 151 4,021
10,955 151 2,479
RASHMI METALIKS LIMITED LOW ASH METALLURGICAL COKE BREEZE 11,151 154 10,000
KOLKATA Total 18,978
PARADIP
6-Sep-18 COLOMBIA
INDO GERMAN INTERNATIONAL PVT LTD
LOW ASH METALLURGICAL COKE BREEZE 11,824 166 6,500
JINDAL STAINLESS LIMITED METALLURGICAL COKE 24,937 351 5,500
13-Sep-18 COLOMBIASHYAM METALICS AND ENERGY LIMITED
ULTRA LOW PHOS LOW ASH METALLURGICAL COKE
25,697 354 2,201
14-Sep-18 COLOMBIA ROHIT FERRO-TECH LTD.MEDIUM PHOS LOW ASH METALLURGICAL COKE
24,121 332 2,000
15-Sep-18 RUSSIAJINDAL STEEL & POWER LIMITED
LOW ASH METALLURGICAL COKE (0-10mm) 13,414 185 11,820
13,414 185 8,422
17-Sep-18 CHINA Visa Steel Ltd.LOW ASH LOW PHOSPHORUS METALLURGICAL COKE
27,539 380 8,704
19-Sep-18 COLOMBIATRAFIGURA INDIA PRIVATE LIMITED
LOW ASH METALLURGICAL COKE BREEZE 10,737 148 5,000
PARADIP Total 50,147
VIZAG
7-Sep-18 RUSSIAINDIA COKE & POWER PRIVATE LIMITED
LOW ASH METALLURGICAL COKE 17,412 240 17,450
12-Sep-18 CHINAINDSIL HYDRO POWER AND MANGANESE LTD
LOW ASH METALLURTGICAL COKE 21,108 291 177
15-Sep-18 CHINA
JINDAL STAINLESS {HISAR} LIMITED
GAS COKE SPEC:MOISTURE:16.0% MAX,ASH:9.0%MAX,SULPHUR:0.6%MAX VM:8.0%MAX,PHOS:0.01%MAX,FIX CARBON:83%MIN,SIZE:10-30MM,90%M
17,051 235 234
S R G MINERALS AND METALS
SEMI COKE, SIZE: 6-18MM, FC-85.28%, ASH-8.25%
15,090 208 270
19-Sep-18 CHINA
DECCAN FERRO ALLOYS PRIVATE LIMITED
LOW ASH METALLURGICAL COKE (6-20 MM) (ASH DB-12.48% VM DB: 1.27%)
20,749 286 955
SARDA ENERGY & MINERALS LIMITED
LOW ASH METALLURGICAL COKE (6-20 MM) (ASH DB-12.48% , VM DB- 1.27%)
21,040 290 1,072
SARDA METALS & ALLOYS LIMITED
LOW ASH METALLURGICAL COKE (6-20 MM) (ASH DB-12.48% V M DB: 1.27%)
21,040 290 2,144
MEt COKE IMPORtS INtO INDIA tHROUGH tHE MENtIONED PORtS SEPtEMbER’18
MEt COKE IMPORtS

October 31, 2018 | 87
VIZAG
19-Sep-18 CHINATRAFIGURA INDIA PRIVATE LIMITED
LOW ASH METALLURGICAL COKE (5-15 MM) 19,951 275 6,052
LOW ASH METALLURGICAL COKE (6-20 MM) 20,894 288 11,700
21-Sep-18 CHINAJINDAL STAINLESS {HISAR} LIMITED
GAS COKE SPEC:MOISTURE:16.0% MAX,ASH:9.0%MAX,SULPHUR:0.6%MAX VM:8.0%MAX,PHOS:0.01%MAX,FIX CARBON:83%MIN,SIZE:10-30MM,90%M
17,310 235 255
28-Sep-18 COLOMBIA
INDIA COKE & POWER PRIVATE LIMITED
LOW ASH METALLURGICAL COKE 22,625 307 1,500
LOW ASH METALLURGICAL COKE (0-10 mm) 11,048 150 7,964
INDSIL ENERGY AND ELECTRO CHEMICALS PRIVATE LTD
LOW ASH METALLURGICAL COKE 23,007 312 100
VIZAG Total 49,873
GANGAVARAM
1-Sep-18 CHINARASHTRIYA ISPAT NIGAM LIMITED
LOW ASH METALLURGICAL COKE 23,932 337 32,998
28-Sep-18 CHINARASHTRIYA ISPAT NIGAM LIMITED
LOW ASH METALLURGICAL COKE 24,269 330 33,000
GANGAVARAM Total 65,998
KRISHNAPATNAM
10-Sep-18 CHINA JSW STEEL LIMITED LOW ASH METALLURGICAL COKE 25,241 348 1,355
25,241 348 50,000
28-Sep-18 CHINA MUKAND LTD LOW ASH METALLURGICAL COKE LOOSE 25,115 341 1,840
25,115 341 4,441
KRISHNAPATNAM Total 57,636
CHENNAI
20-Sep-18 CHINADIGITAL WAVES INTERNATIONAL PRIVATE LIMITED
LOW ASH METALLURGIAL COKE (SIZE: 70-100 MM) (ASH:11.35) (VM:1.15) (FC: 87.50) (S:0.41)
27,206 375 107
21-Sep-18 CHINAHENGCHANG MACHINERY FACTORY INDIA
FOUNDRY COKE 30,588 415 79
28-Sep-18 CHINADIGITAL WAVES INTERNATIONAL PRIVATE LIMITED
LOW ASH METALLURGICAL COKE (SIZE: 60-90 MM) (ASH: 11.35) (VM: 1.15) (FC: 87.50) (S: 0.41)
24,305 330 115
CHENNAI Total 301
TUTICORIN / VOC 28-Sep-18 CHINANOVA CARBONS INDIA PRIVATE LIMITED
SEMI COKE OF COAL 59,081 802 53
TUTICORIN / VOC Total 53
MAGDALLA
14-Sep-18 AUSTRALIA ESSAR STEEL INDIA LTD. LOW ASH METALLURGICAL COKE 24,952 344 38,462
18-Sep-18 POLAND ESSAR STEEL INDIA LTD. LOW ASH METALLURGICAL COKE 28,157 388 8,934
28,157 388 60,000
19-Sep-18 GERMANY ESSAR STEEL INDIA LTD. LOW ASH METALLURGICAL COKE 27,358 377 9,630
MAGDALLA Total 1,17,026
MET COKE Total 3,60,011
Met Coke imports into India through the mentioned ports September’18, Contd...
Ports Date Country of Origin Importers Item Description Unit Price (in Rs/Ton)
Unit Price (in $/Ton)
Quantity (in Tons)
*For the Ports of Dahej, Kakinada, Karaikal, Krishnapatnam, Magdalla, Mumbai & Tuticorin details of all import entries are not available.
MEt COKE IMPORtS

October 31, 2018 | 88
Ports Date Country of Origin Importers Item Description Unit Price (in Rs/Ton)
Unit Price(in $/Ton)
Quantity(in Tons)
KOLKATA 5-Sep-18 CHINA TATA STEEL LIMITEDGRAPHITIZED PETROLEUM COKE-PETROLEUM COKE
80,912 1,138 172
KOLKATA Total 172
VIZAG 11-Sep-18 SAUDI ARABIA
ACC LIMITEDGREEN DELAYED PETROLEUM COKE OF SAUDI ARABIA ORIGIN (PET COKE A11 020)
7,924 109 25,000
AMBUJA CEMENTS LIMITED
GREEN DELAYED PETROLEUM COKE OF SAUDI ARABIA ORIGIN (PET COKE A11 020)
7,924 109 25,000
VIZAG Total 50,000
KRISHNAPATNAM 12-Sep-18
SAUDI ARABIAULTRATECH CEMENT LIMITED
PETROLEUM COKE 7,626 105 23,368
7,626 105 29,478
UNITED STATES
BHARATHI CEMENT CORPORATION PVT. LTD.,
FLUID PETCOKE 6,972 96 16,499
GREEN DELAYED PETCOKE 7,475 103 4,414
KALBURGI CEMENT PRIVATE LIMITED
FLUID PETCOKE 7,021 97 16,499
GREEN DELAYED PETCOKE 7,563 104 4,395
KRISHNAPATNAM Total 94,653
CHENNAI
4-Sep-18 CHINA
BHARTIA PULVERISERS
CALCINED PETROLEUM COKE: F.C: 98.5% MIN; S: 0.07-0.12% MAX; H2O: 0.5% MAX; ASH: 0.8% MAX; V.M: 0.7% MAX; SIZE: 1-5MM, 90
57,804 813 27
R B A EXPORTS PVT LTD
GRAPHITIZED PETROLEUM COKE F.C:98.5%MIN;S:0.05%MAX;ASH:0.5%M AX;V.M:0.8%MAX;H2O:0.5%MAX;SIZE:0-4MM 90%MIN;PACKING:IN 25KG
60,719 854 19
7-Sep-18 GERMANYBRAKES INDIA PRIVATE LIMITED
CARBOLUX SK6 SIZE 0.2-3MM PACKED IN 25 KG PAPER BAGS (CALCINE D PETROLEUM COKE)
58,685 809 24
15-Sep-18 CHINA JSW STEEL LIMITED CALCINED PETROLEUM COKE 43,170 595 120
19-Sep-18 GERMANYJ S AUTO CAST FOUNDRY INDIA PVT. LTD,
CARBOLUX SK,SIZE 0.2-3 MM (CALCINED PETROLEUM COKE)
71,867 991 48
22-Sep-18 CHINA GRAPHITE INDIA LIMITEDCALCINED PETROLEUM COKE CPC (3-8MM) [NOT FOR FUEL PURPOSE]
39,035 530 95
24-Sep-18 CHINA GRAPHITE INDIA LIMITEDCALCINED PETROLEUM COKE CPC (1-3MM) [NOT FOR FUEL PURPOSE]
37,930 515 200
28-Sep-18 CHINA R B A EXPORTS PVT LTD PETROLEUM COKE (GRAPHITIZED)
62,750 852 13
62,750 852 4
62,750 852 1
29-Sep-18 JAPANRANE BRAKE LINING LIMITED
CALCINED NEEDLE PITCH COKE 1 MM-42MESH 484 (PETROLEUM COKE) (RAW MATERIAL FOR BRAKE LINING)
1,95,901 2,660 0.06
CHENNAI Total 551
COCHIN 19-Sep-18 CHINASAINT-GOBAIN INDIA PRIVATE LIMITED
CALCINED PETROLEUM COKE (1-5 MM) 59,817 824 20
COCHIN Total 20
MUNDRA 22-Sep-18 CHINA PNP CORPORATION
GRAPHITIZED PETROLEUM COKE F.C;98.50% MIN S;0.05% MAX ASH;0.70% MAX V.M;0.80% MAX II20:0.50% MAX SIZE 0.2-1MM
56,342 765 40
MUNDRA Total 40
KANDLA
20-Sep-18 SAUDI ARABIA SHREE CEMENT LIMITED PETROLEUM COKE (NON-CANCLED) 7,475 103 53,750
24-Sep-18 UNITED STATESTRICON ENERGY INDIA PRIVATE LIMITED
PETROLEUM COKE (PETCOKE) 8,654 117 13,103
KANDLA Total 66,853
PET COKE Total 2,12,288
PEt COKE IMPORtS INtO INDIA tHROUGH tHE MENtIONED PORtS SEPtEMbER’18
PEt COKE IMPORtS
*For the Ports of Dahej, Kakinada, Karaikal, Krishnapatnam, Magdalla, Mumbai & Tuticorin details of all import entries are not available.

October 31, 2018 | 89
GYPSUM IMPORtS INtO INDIA tHROUGH tHE SELECtED PORtS SEPtEMbER’18
Ports Date Country of Origin Importer Name Item Description Unit Price
(in Rs./Ton) Unit Price (in $/Ton)
Quantity (in Tons)
KOLKATA
5-Sep-18 CHINA WILL & WISDOMGYPSUM INVESTMENT CASTING POWDER FOR IMITATION JEWELLERY
12,079 170 54
6-Sep-18 TURKEY NICKUNJ EXIMP ENTERPRISES PVT.LTD.
NICKAST GYPSUM INV. POWDER IN 22.5KG YELLOW SACK (6-RYL/CST-2 2.5) (INVESTMENT POWDER FOR JEWELLERY CASTING) (1200 PKGS)
22,137 311 27
8-Sep-18
CHINA HRIDHAY IMPEX PRIVATE LIMITED GYPSUM POWDER 5,902 81 54
OMAN VINOD KUMAR DAGAGYPSOMAN GYPSUM POWDER - 20KGS BAGS (LOW SETTING CORNISH)
4,769 66 135
SAUDI ARABIA K.M.CORPORATIONRAW GYPSUM POWDER 20KG & 25KG BAGS
2,861 39 270
11-Sep-18UNITED ARAB EMIRATES
INNOVATIONGYPSUM POWDER (APPROX 25 KG BAGS)
4,146 57 135
12-Sep-18
IRAN JEWEL CHOWDHURYGYPSUM POWDER 200 MESH IN PP BAGS (APPROX 25KG)
5,321 73 272
UNITED ARAB EMIRATES
VINOD KUMAR DAGAGYPSUM POWDER (IN APROX 25 KG BAG)
3,954 55 136
14-Sep-18 IRAN ULTRATECH CEMENT LIMITED NATURAL GYPSUM 1,460 20 24,000
20-Sep-18 IRAN JEWEL CHOWDHURYGYPSUM POWDER 200 MESH IN PP BAGS (APPROX 25 KG)
5,319 73 218
22-Sep-18CHINA HRIDHAY IMPEX PRIVATE LIMITED GYPSUM POWDER 5,936 81 28
OMAN JSW CEMENT LIMITED NATURAL GYPSUM 1,580 21 27,000
KOLKATA Total 52,328
HYDERABAD
7-Sep-18 IRAN ARHAAN INTERIORS MICRONIZED GYPSUM POWER 3,439 47 56
14-Sep-18 IRAN BRANCO GYPSUM PRIVATE LIMITED GYPSUM POWDER 3,643 50 54
15-Sep-18 IRAN BUILDON GYPSUM POWDER (267.600 MTS) 3,557 49 268
20-Sep-18 OMAN ESSBI CORPORATIONGYPCORE-GYPSUM POWDER-DECORE H100
3,994 55 108
21-Sep-18UNITED ARAB EMIRATES
PHOTON STICKS
GYPSUM POWDER GRA2 200MESH (AS PER INV
3,314 45 54
GYPSUM POWDER GRAA 200MESH (AS PER INV
3,761 51 23
GYPSUM POWDER GRA3 100MESH (AS PER INV
2,942 40 54
HYDERABAD Total 616
VIZAG4-Sep-18 OMAN
JK LAKSHMI CEMENT LTD GYPSUM 1,362 19 19,000
MELCON (VIZAG) PRIVATE LIMITED NATURAL GYPSUM 1,393 20 12,150
THE K.C.P.LTD NATURAL GYPSUM 1,391 20 24,000
11-Sep-18 OMAN SASTHA SENIOR BUILDING PRODUCTS Gypsoman Gypsum Powder (Low Setting) 4,722 65 54
VIZAG Total 55,204
CHENNAI
5-Sep-18 THAILAND SAINT-GOBAIN INDIA PRIVATE LIMITED
GYPROC EASI-FILL TG60 (GYPSUM PLASTER) (TOTAL BAGS 1002,BAG/117 THB)
13,666 192 20
GYPROC EASI-FILL TG60 (GYPSUM PLASTER) (TOTAL BAGS 3600,BAG/117 THB)
14,054 198 72
15-Sep-18CHINA HUA YAO MOULDS PRIVATE LIMITED
HIGH TEMPERATURE GYPSUM POWDER
14,160 195 15
HIGH STRENGTH GYPSUM POWDER 18,342 253 2
OMAN JSW CEMENT LIMITED NATURAL GYPSUM 1,556 21 56,000
20-Sep-18 IRAN CERA-CHEM PRIVATE LIMITED,GYPSUM POWDER IN APPROX 25 KGS BAGS
4,422 61 136
GYPSUM IMPORtS

October 31, 2018 | 90
CHENNAI 25-Sep-18 SAUDI ARABIASAGAR GRANDHI CONSTRUCTIONS PRIVATE LIMITED
REGULAR GYPSUM POWDER 4,918 67 52
CHENNAI Total 56,297
TUTICORIN / VOC
3-Sep-18 IRAN SSS ENTERPRISES GYPSUM POWDER (CALICINATED) 3,821 54 162
10-Sep-18 IRAN RRV TRADE PRIVATE LIMITED GYPSUM POWDER 4,916 68 81
13-Sep-18 OMANEASTERN BULK TRADING & SHIPPING PVT LTD
NATURAL GYPSUM 1,288 18 10,984
17-Sep-18 IRAN SSS ENTERPRISES CALCINATED GYPSUM POWDER 3,975 55 108
TUTICORIN / VOC Total 11,335
KATTUPALLI-INKAT1
1-Sep-18UNITED ARAB EMIRATES
VANS GYPSUM PVT.LTD., GYPSUM POWDER (MESH 100) 3,131 44 266
3-Sep-18 UNITED STATESGOLD STAR POWDERS PRIVATE LIMITED
INDUSTRIAL ALPHA PLASTER-B 100 LB BAG CALCINED GYPSUM POWDER .
43,227 608 20
10-Sep-18 OMAN GYPCORE INDIA PRIVATE LIMITEDGYPSUM POWDER H-100 (FOR WALL APPLICATON) 25KG BAGS
4,035 56 189
15-Sep-18 OMAN GYPCORE INDIA PRIVATE LIMITEDGYPSUM POWDER DECORE H 100 25KG BAGS (FOR WALL APPLICATION)
4,035 56 135
24-Sep-18 OMAN GYPCORE INDIA PRIVATE LIMITEDGYPSUM POWDER DECORE H 100-25KG BAGS (FOR WALL APPLICATION)
4,096 56 162
25-Sep-18 IRAN BUILDON GYPSUM POWDER 4,509 61 260
27-Sep-18UNITED ARAB EMIRATES
NKV HOME DEPOTGYPSUM POWDER 4,760 65 675
GYPSUM POWER 4,760 65 675
28-Sep-18UNITED ARAB EMIRATES
VANS GYPSUM PVT.LTD., GYPSUM POWDER (MESH 100) 4,467 61 270
KATTUPALLI-INKAT1 Total 2,652
COCHIN
1-Sep-18 IRANFRAMEROCK GYP PROFILE INDIA PRIVATE LIMITED
CALCINED GYPSUM POWDER 4,867 68 135
10-Sep-18
IRAN PRABHA SPECIALITIESCALCINATED GYPSUM POWDER IN BAGS (EACH 25 KG + 0.5 KG)
4,852 67 135
UNITED ARAB EMIRATES
PRABHA SPECIALITIESCALCINATED GYPSUM POWDER IN BAGS (EACH 25 KG + 0.5 KG)
4,852 67 135
17-Sep-18UNITED ARAB EMIRATES
PRABHA SPECIALITIESCALCINED GYPSUM POWDER IN BAGS (EACH 25 KG + 0.5 KG)
3,942 54 271
18-Sep-18UNITED ARAB EMIRATES
PRABHA SPECIALITIESCALCINED GYPSUM POWDER IN BAGS (EACH 25 KG + 0.5 KG)
3,942 54 271
24-Sep-18 GERMANYDENTCARE DENTAL LAB PRIVATE LIMITED
CALCINED GYPSUM PREPARATIONS FUR USE IN DENTISTRY-PACKED IN 20 KG PAPER BAGS (240 PAPER BAGS IN TOTAL)
1,06,841 1,451 5
CALCINED GYPSUM PREPARATIONS FOR USE IN DENTISTRY -300 PAPER BAGS IN TOTAL
1,02,314 1,389 6
CALCINED GYPSUM PREPARATIONS FOR USE IN DENTISTRY-30 PAPER B AGS IN TOTAL)
69,719 947 1
28-Sep-18 IRAN THRILOKA EXPORTS GYPSUM POWDER (CALCINED) 4,682 64 55
COCHIN Total 1,012
NEW MANGALORE
19-Sep-18 OMAN ACC LIMITED NATURAL GYPSUM
1,404 19 7,906
1,404 19 3,953
1,404 19 11,859
26-Sep-18 IRAN F.C. FORMATION,NORMAL GYPSUM PLASTER (POWDER FORM)
4,745 64 106
3,317 45 106
NEW MANGALORE Total 23,929
Gypsum imports into India through the selected ports September’18, Contd...
Ports Date Country of Origin Importer Name Item Description Unit Price
(in Rs./Ton) Unit Price (in $/Ton)
Quantity (in Tons)
GYPSUM IMPORtS
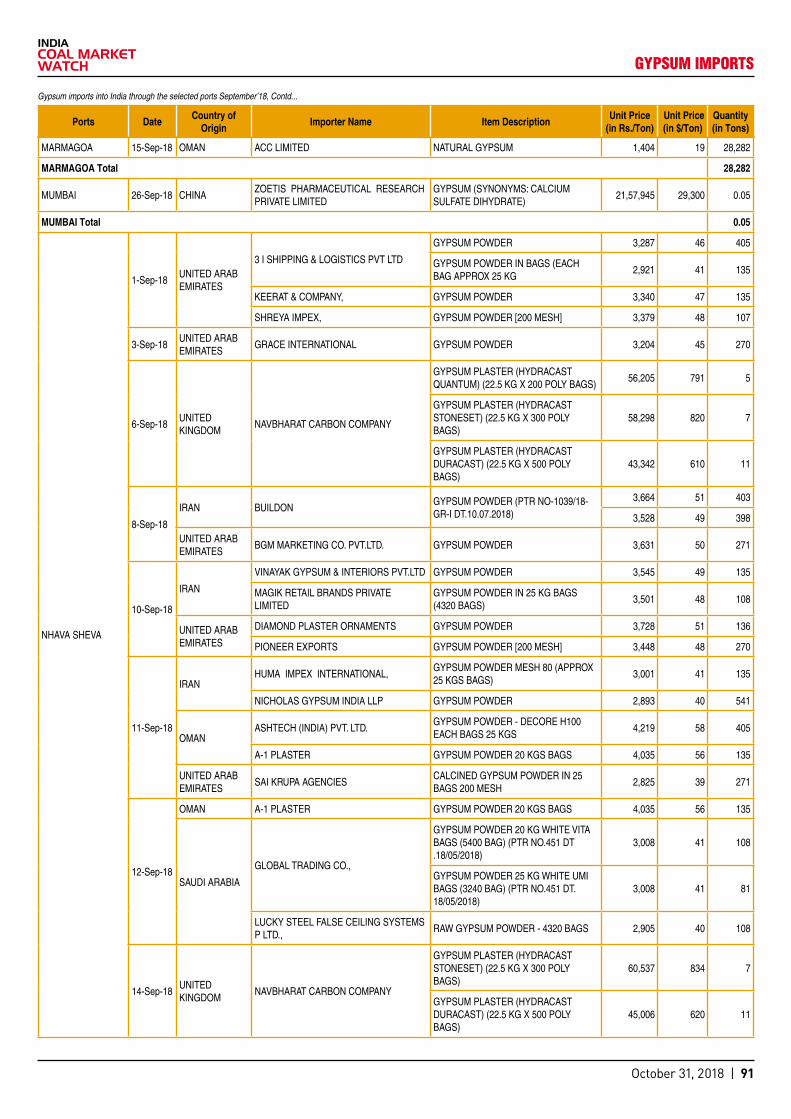
October 31, 2018 | 91
MARMAGOA 15-Sep-18 OMAN ACC LIMITED NATURAL GYPSUM 1,404 19 28,282
MARMAGOA Total 28,282
MUMBAI 26-Sep-18 CHINAZOETIS PHARMACEUTICAL RESEARCH PRIVATE LIMITED
GYPSUM (SYNONYMS: CALCIUM SULFATE DIHYDRATE)
21,57,945 29,300 0.05
MUMBAI Total 0.05
NHAVA SHEVA
1-Sep-18UNITED ARAB EMIRATES
3 I SHIPPING & LOGISTICS PVT LTD
GYPSUM POWDER 3,287 46 405
GYPSUM POWDER IN BAGS (EACH BAG APPROX 25 KG
2,921 41 135
KEERAT & COMPANY, GYPSUM POWDER 3,340 47 135
SHREYA IMPEX, GYPSUM POWDER [200 MESH] 3,379 48 107
3-Sep-18UNITED ARAB EMIRATES
GRACE INTERNATIONAL GYPSUM POWDER 3,204 45 270
6-Sep-18UNITED KINGDOM
NAVBHARAT CARBON COMPANY
GYPSUM PLASTER (HYDRACAST QUANTUM) (22.5 KG X 200 POLY BAGS)
56,205 791 5
GYPSUM PLASTER (HYDRACAST STONESET) (22.5 KG X 300 POLY BAGS)
58,298 820 7
GYPSUM PLASTER (HYDRACAST DURACAST) (22.5 KG X 500 POLY BAGS)
43,342 610 11
8-Sep-18
IRAN BUILDONGYPSUM POWDER (PTR NO-1039/18-GR-I DT.10.07.2018)
3,664 51 403
3,528 49 398
UNITED ARAB EMIRATES
BGM MARKETING CO. PVT.LTD. GYPSUM POWDER 3,631 50 271
10-Sep-18
IRAN
VINAYAK GYPSUM & INTERIORS PVT.LTD GYPSUM POWDER 3,545 49 135
MAGIK RETAIL BRANDS PRIVATE LIMITED
GYPSUM POWDER IN 25 KG BAGS (4320 BAGS)
3,501 48 108
UNITED ARAB EMIRATES
DIAMOND PLASTER ORNAMENTS GYPSUM POWDER 3,728 51 136
PIONEER EXPORTS GYPSUM POWDER [200 MESH] 3,448 48 270
11-Sep-18
IRANHUMA IMPEX INTERNATIONAL,
GYPSUM POWDER MESH 80 (APPROX 25 KGS BAGS)
3,001 41 135
NICHOLAS GYPSUM INDIA LLP GYPSUM POWDER 2,893 40 541
OMANASHTECH (INDIA) PVT. LTD.
GYPSUM POWDER - DECORE H100 EACH BAGS 25 KGS
4,219 58 405
A-1 PLASTER GYPSUM POWDER 20 KGS BAGS 4,035 56 135
UNITED ARAB EMIRATES
SAI KRUPA AGENCIESCALCINED GYPSUM POWDER IN 25 BAGS 200 MESH
2,825 39 271
12-Sep-18
OMAN A-1 PLASTER GYPSUM POWDER 20 KGS BAGS 4,035 56 135
SAUDI ARABIA
GLOBAL TRADING CO.,
GYPSUM POWDER 20 KG WHITE VITA BAGS (5400 BAG) (PTR NO.451 DT .18/05/2018)
3,008 41 108
GYPSUM POWDER 25 KG WHITE UMI BAGS (3240 BAG) (PTR NO.451 DT. 18/05/2018)
3,008 41 81
LUCKY STEEL FALSE CEILING SYSTEMS P LTD.,
RAW GYPSUM POWDER - 4320 BAGS 2,905 40 108
14-Sep-18UNITED KINGDOM
NAVBHARAT CARBON COMPANY
GYPSUM PLASTER (HYDRACAST STONESET) (22.5 KG X 300 POLY BAGS)
60,537 834 7
GYPSUM PLASTER (HYDRACAST DURACAST) (22.5 KG X 500 POLY BAGS)
45,006 620 11
GYPSUM IMPORtS
Gypsum imports into India through the selected ports September’18, Contd...
Ports Date Country of Origin Importer Name Item Description Unit Price
(in Rs./Ton) Unit Price (in $/Ton)
Quantity (in Tons)

October 31, 2018 | 92
NHAVA SHEVA
14-Sep-18UNITED KINGDOM
NAVBHARAT CARBON COMPANY
GYPSUM PLASTER (HYDRACAST CADCAST) (22.5 KG X 200 POLY BAGS) (VALUE FOR CUSTOM PURPOSE)
47,542 655 5
GYPSUM PLASTER (HYDRACAST QUANTUM) (22.5 KG X 10 POLY BAGS) (VALUE FOR CUSTOM PURPOSE)
67,917 936 0.23
15-Sep-18
IRAN
BUILDONGYPSUM POWDER (PTR NO-1039/18-GR-I DT.10.07.2018)
3,662 50 405
3,528 49 392
3,528 49 395
3,668 51 398
3,528 49 397
SUPER GYPSUM GYPSUM POWDER IN BAGS 100 MESH 3,299 45 271
SHEARWATER MANUFACTURING AND TRADING LLP
GYPSUM POWDER 200 MESH 3,721 51 135
OMAN ARROW TECHNICAL SERVICESGYPSUM POP 25 KG BAG (2160 BAG) 4,255 59 54
GYPSUM POP 15 KG BAG (5400 BAG) 4,255 59 81
UNITED ARAB EMIRATES
WALPLAST PRODUCTS PVT. LTD. GYPSUM POWDER 3,863 53 270
16-Sep-18 IRAN SUPREME INDUSTRIESGYPSUM POWDER PACKING IN 25 KG BAG
3,369 46 270
17-Sep-18 IRAN NICHOLAS GYPSUM INDIA LLP GYPSUM POWDER 2,857 39 27
18-Sep-18UNITED ARAB EMIRATES
VANS GYPSUM PVT.LTD.,
GYPSUM POWDER IN VANS BAGS 100 MESH (BADGE NO.001801) (PTR NO . 966. DT:- 04.07.18)
3,385 47 275
GYPSUM POWDER (MESH 100) (PTR NO. 1040. DT:- 11.07.18)
3,644 50 243
19-Sep-18 OMAN RAJAN TRADERSGYPSUM POWDER, 4050 BAGS (REMITTANCE AS PER PI NO.PI/1441)
3,994 55 81
21-Sep-18 IRAN BUILDONGYPSUM POWDER (PTR NO-1039/18-GR-I DT.10.07.2018)
3,580 49 370
22-Sep-18UNITED ARAB EMIRATES
WALPLAST PRODUCTS PVT. LTD. GYPSUM POWDER 3,947 54 270
24-Sep-18
IRAN
BUILDONGYPSUM POWDER (PTR NO-1039/18-GR-I DT.10.07.2018)
3,990 54 342
KABCO VENTURES PRIVATE LIMITEDMICRONIZED GYPSUM POWDER (FOR CONSTRUCTION AND BUILDING MATE RIAL USE)
2,681 36 113
HAMI EXPO GYPSUM POWDER 3,421 46 265
UNITED ARAB EMIRATES
BGM MARKETING CO. PVT.LTD. GYPSUM POWDER 3,694 50 181
SARVOTTAM SUPPLIERSGYPSUM POWDER APPROX 25KG BAGS
3,021 41 135
HASHMATI ENTERPRISE LLPGYPSUM POWDER 200 MESH PACKING: NEW PP BAGS EACH BAG WEIGHT 25 KG +0.5
3,542 48 135
25-Sep-18IRAN
HUMA IMPEX INTERNATIONAL,GYPSUM POWDER MESH 100 (APROX 25 KGS BAGS)
3,350 45 135
VINAYAK GYPSUM & INTERIORS PVT.LTD
GYPSUM POWDER 3,325 45 135
MICRONIZED GYPSUM POWDER FOR PLASTERING
3,381 46 52
GYPSUM LUMP 4,479 61 2
SAUDI ARABIA SAM GYPSUM PRIVATE LIMITED GYPSUM POWDER 20 KG BAGS 2,928 40 135
Gypsum imports into India through the selected ports September’18, Contd...
Ports Date Country of Origin Importer Name Item Description Unit Price
(in Rs./Ton) Unit Price (in $/Ton)
Quantity (in Tons)
GYPSUM IMPORtS

October 31, 2018 | 93
NHAVA SHEVA
25-Sep-18UNITED KINGDOM
NAVBHARAT CARBON COMPANY (BOMBAY)
GYPSUM PLASTER (SRS STONECAST BLUE) (45 KG PLASTIC DRUM X 48 DRM)
78,149 1,061 2
GYPSUM PLASTER (SRS STONECAST) (22.7 KG POLY BAG X 200 BAG)
66,713 906 5
GYPSUM PLASTER (SRS CADCAST) (10 KG HEAT SEALED ALUMINIUM FO IL BAG X 50 BAG)
1,20,771 1,640 1
GYPSUM PLASTER (SRS SILK) (22.7 KG POLY BAG X 50 BAG)
62,349 847 1
GYPSUM PLASTER (SRS STONECAST BLUE) (22.7 KG POLY BAG X 500 BAG)
65,506 889 11
GYPSUM PLASTER (SRS CLASSIC) (22.7 KG POLY BAG X 150 BAG)
50,928 691 3
26-Sep-18
OMAN A-1 PLASTER GYPSUM POWDER EACH BAGS 20 KGS 4,096 56 135
UNITED STATES NAVBHARAT CARBON COMPANY
SC20 INVESTMENT (GYPSUM PLASTER)
83,657 1,136 19
KC2000 INVESTMENT (GYPSUM PLASTER)
74,564 1,012 8
SC-D INVESTMENT (GYPSUM PLASTER)
91,837 1,247 11
27-Sep-18 SAUDI ARABIA
GLOBAL TRADING CO.,
GYPSUM POWDER 20 KG WHITE VITA BAGS (5400 BAGS) (PTR NO.451 D T.18/05/2018)
3,054 41 108
GYPSUM POWDER 25 KG WHITE UMI BAGS (8640 BAGS) (PTR NO.451 DT .18/05/2018)
3,054 41 216
THE FRAMES INCORPORATIONGYPSUM POWDER BAGS (FREE SAMPLE NO COMMERICAL VALUE)
5,163 70 0.04
28-Sep-18
UNITED ARAB EMIRATES
3 I SHIPPING & LOGISTICS PVT LTD
GYPSUM POWDER (TEST REPORT NO. 2026 DT. 27.08.2018
3,404 46 405
GYPSUM POWDER (TEST REPORT NO. 2026 DT. 27.08.18
3,472 47 270
UNITED KINGDOM
NAVBHARAT CARBON COMPANY (BOMBAY)
GYPSUM PLASTER (SRS SILK) (22.7 KG POLY BAG X 50 BAG)
62,067 843 1
GYPSUM PLASTER (SRS CLASSIC) (22.7 KG POLY BAG X 150 BAG)
50,698 688 3
GYPSUM PLASTER (SRS STONECAST) (22.7 KG POLY BAG X 250 BAG)
66,411 902 6
GYPSUM PLASTER (SRS STONECAST BLUE) (22.7 KG POLY BAG X 550 BAG)
65,210 885 12
29-Sep-18
IRAN BUILDONGYPSUM POWDER (PTR NO-1039/18-GR-I DT.10.07.2018)
3,580 49 405
UNITED ARAB EMIRATES
BGM MARKETING CO. PVT.LTD. GYPSUM POWDER 3,693 50 260
SUPER GYPSUM GYPSUM POWDER IN BAGS 200 MESH 2,939 40 272
2,939 40 271
NHAVA SHEVA Total 13,128
MUNDRA
4-Sep-18
IRAN SHREE GANESH METALLOY LTD.,GYPSUM POWDER PACKED IN 25 KG BAGS (OTHER DETAILS AS PER INVOICE & PACKING LIST)
3,235 46 24
THAILAND JAQUAR & COMPANY PVT.LTD.SUPRADURO SN 75E (1,100 KG) 40 BAGS GYPSUM PLASTER (FOR CAPTIVE CONSUMPTION
10,796 152 44
8-Sep-18UNITED ARAB EMIRATES
DANIYA ENTERPRISESGYPSUM POWDER GYPSUM POWDER SUPER MICRONISED 100MESH
5,224 72 27
Gypsum imports into India through the selected ports September’18, Contd...
Ports Date Country of Origin Importer Name Item Description Unit Price
(in Rs./Ton) Unit Price (in $/Ton)
Quantity (in Tons)
GYPSUM IMPORtS

October 31, 2018 | 94
MUNDRA
8-Sep-18UNITED ARAB EMIRATES
DANIYA ENTERPRISESGYPSUM POWDER GYPSUM POWDER SUPER MICRONISED 100MESH
5,224 72 25
10-Sep-18 THAILAND JAQUAR & COMPANY PVT.LTD.SUPRADURO SN 75E (1,100 KG) = 40 BAGS GYPSUM PLASTER (FOR CAPTIVE CONSUMPTION)
11,017 152 44
14-Sep-18 IRAN BUILDON GYPSUM POWDER GYPSUM POWDER 3,528 49 135
17-Sep-18UNITED ARAB EMIRATES
SHREEJI GYPSUM AND INTERIORSGYPSUM POWDER IN BAGS 200 MESH. (7700 BAGS) OTHER DETAILS AS PER INVOICE, PACKING LIST & B/L.
3,438 47 190
26-Sep-18 THAILAND JAQUAR & COMPANY PVT.LTD.SUPRADURO SN 75E (1,100 KG) = 60 BAGS GYPSUM PLASTER (FOR CAPTIVE CONSUMPTION)
11,184 152 66
MUNDRA Total 555
MAGDALLA 24-Sep-18 IRAN
SANJAY TRADING COMPANY GYPSUM 1,236 17 16,788
1,236 17 12,000
PRISM JOHNSON LIMITEDGypsum (HSS Invoice No.STC/HSS/2018-19/GYP/001 dated 20.09.2018)
1,275 17 28,000
MAGDALLA Total 56,788
PIPAVAV 20-Sep-18 OMAN ULTRATECH CEMENT LIMITED NATURAL GYPSUM 1,224 17 28,100
1,224 17 25,000
PIPAVAV Total 53,100
AHMEDABAD 24-Sep-18 THAILAND CERA SANITARYWARE LTD, GYPSUM PLASTER : MOLDA SN 75 C - 1 13,607 185 72
AHMEDABAD Total 72
HAZIRA
4-Sep-18 OMAN REGAL GYPSUM TRADINGGYPSUM POWDER-DECORE H100, OTHER DETAILS AS PER INVOICE & PACKING LIST.
3,954 56 54
15-Sep-18 OMAN SAINT-GOBAIN INDIA PRIVATE LIMITEDNATURAL GYPSUM (50-150 MM) 1,376 19 11,800
NATURAL GYPSUM (50-100 MM) 1,376 19 46,400
17-Sep-18 SAUDI ARABIA SANKHLA BROTHERSRAW GYPSUM POWDER 40 KGS WHITE BAGS
2,935 40 270
HAZIRA Total 58,524
DAHEJ
12-Sep-18UNITED ARAB EMIRATES
KAY KAY TRADING COMPANY NATURAL GYPSUM 939 13 52,150
25-Sep-18 IRAN ULTRATECH CEMENT LIMITED NATURAL GYPSUM 1,052 14 8,000
26-Sep-18 IRAN ULTRATECH CEMENT LIMITED NATURAL GYPSUM
1,052 14 17,179
1,052 14 13,200
1,052 14 17,500
DAHEJ Total 1,08,029
DELHI 4-Sep-18 ITALYCTS RESTORATION PRODUCTS(INDIA) PVT LTD
01121005 GYPSUM OF BOLOGNA TYPE (PACK SIZE 5 KG) (PRODUCTS, E QUIPMENT AND SYSTEM FOR ART CONSERVATION)
99,894 1,405 0.01
01121605 EXTRA PURE BOLOGNA GYPSUM (PACK SIZE 5 KG) (PRODUCTS , EQUIPMENT AND SYSTEM FOR ART CONSERVATION)
2,09,302 2,944 0.01
DELHI Total 0.01
Grand Total 5,21,851
Gypsum imports into India through the selected ports September’18, Contd...
Ports Date Country of Origin Importer Name Item Description Unit Price
(in Rs./Ton) Unit Price (in $/Ton)
Quantity (in Tons)
GYPSUM IMPORtS

October 31, 2018 | 95
LIMEStONE IMPORt tHROUGH MAJOR INDIAN PORtS SEPtEMbER’18
Port Date Country Of Origin Importer Item Description Unit Price
(in Rs./Ton) Unit Price (in $/Ton)
Quantity (in Tons)
KOLKATA
28-Sep-18
OMAN YOUTHSTAR VANIJYA PRIVATE LIMITED
QUICK LIME 10-50 MM (LUMP LIME) Available-Ca-O94.50, Total CaO-96.40, S-0.01, LOI @1000 DEG. C-1.96,Sio-2 0.02, Fe-2.0
7,439 101 219
UNITED ARAB EMIRATES
TATA STEEL LIMITEDCP GRADE LIMESTONE-LIMESTONE FOR METALLURGICAL USE CONFIRMING TO IS:10345-2004
1,565 21 24,000
1-Sep-18
UNITED ARAB EMIRATES
RIPLEY & COMPANY STEVEDORING & HANDLING PVT.LTD.
LIMESTONE 10-40 MM [GOODS FOR METALLURGICAL USE AND CONFORMS TO IS:10345-2004]
2,019 28 5,015
2,019 28 6,000
LIMESTONE 40-80 MM [GOODS FOR METALLURGICAL USE AND CONFORMS TO IS:10345-2004]
1,982 28 5,003
1,982 28 5,000
LIMESTONE 20-50 MM [GOODS FOR METALLURGICAL USE AND CONFORMS TO IS:10345-2004]
1,837 26 5,000
1,837 26 5,000
VIETNAM SNG MICRONS PRIVATE LIMITEDLIMESTONE POWDER GRADE: SM004 (NOT FOR MEDICAL USE AND FOOD USE)
6,044 85 56
3-Sep-18UNITED ARAB EMIRATES
TATA STEEL LIMITEDCP GRADE LIMESTONE-LIMESTONE FOR METALLURGICAL USE CONFIRMING TO IS:10345-2004
1,576 22 25,000
5-Sep-18
MALAYSIA 20 MICRONS LTD.LIMESTONE POWDER-N (NOT FOR MEDICATION USE)
6,659 94 200
UNITED ARAB EMIRATES
TATA STEEL LIMITEDCP GRADE LIMESTONE, LIMESTONE FOR METALLURGICAL USE CONFIRMING TO IS:10345-2004
1,510 21 11,000
6-Sep-18
FRANCE ITC LIMITEDPCC LIME 0/20 MM (QUICK LIME) (PULP CONVERSION CHEMICAL)
10,666 150 274
UNITED ARAB EMIRATES
STEEL AUTHORITY OF INDIA LIMITEDSMS GRADE LOW SILICA LIMESTONE-SIZE 30-60 MM. THIS LIMESTO NE CONFORMS TO IS: 10345-2004
1,467 21 26,400
10-Sep-18
MALAYSIA
20 MICRONS LTD.LIMESTONE POWDER-N (NOT FOR MEDICATION USE)
6,795 94 100
POLY PIPES INDIA (P) LTDLIMESTONE POWDER TKN 700 (PK-2018-MICECA-26-001339 DT:29.08 .2018)
7,120 98 53
UNITED ARAB EMIRATES
SHYAM FERRO ALLOYS LTD QUICK LIME LUMPS (CAO: 94.67%) 7,190 99 227
TATA STEEL LIMITEDCP GRADE LIMESTONE-LIMESTONE FOR METALLURGICAL USE CONFIRMI NG TO IS:10345-2004
1,608 22 3,100
VIETNAM
TATA STEEL LIMITED
LIMESTONE-CP GRADE (AIFTA VN-IN18/09/00082)-limesto ne for metallurgical use confirming to is:10345-2004
1,586 22 2,347
LOW SILICA LIMESTONE (AIFTA CFT:VN-IN 18/77/00150)-LIMESTONE FOR METALLURGICAL USE CONFIRMING TO IS:10345-2004
1,417 20 25,000
VISHNU KEDIA
LIMESTONE POWDER (NON PHARMA GRADE) CFT NO-VN-IN 18/74/006 81 DT-16.08..2018
6,094 84 41
LIMESTONE POWDER (C) (NON PHARMA GRADE) CFT NO-VN-IN 18/74 /00681 DT-16.08..2018
7,110 98 4
LIMESTONE POWDER-2 MICRON (NON PHARMA GRADE) CFT NO-VN-I N 18/74/00681 DT-16.08..2018
7,255 100 10
11-Sep-18 VIETNAMEVEREST POLYFILLERS PRIVATE LIMITED
LIME STONE POWDER 7,255 100 196
LIMEStONE IMPORtS

October 31, 2018 | 96
KOLKATA
11-Sep-18 VIETNAM
MOHTA MICRO MINERALS PRIVATE LIMITED
LIMESTONE POWDER KC2P-03D (NOT FOR MEDICAL & FOOD PURPOSE US E)
6,214 86 28
LIMESTONE POWDER KC2P-03H (NOT FOR MEDICAL & FOOD PURPOSE US E)
4,549 63 56
LIMESTONE POWDER KC2P-03G (NOT FOR MEDICAL & FOOD PURPOSE US E)
4,993 69 56
S P ASSOCIATESLIMESTONE ULTRA FINE POWDER-UNCOATED GRADE CMT-03 (AIFTA.CF T.NO:VN-IN 18/05/01371 DT:29.08.2018)
5,793 80 56
12-Sep-18UNITED ARAB EMIRATES
TATA STEEL LIMITEDSP GRADE LIMESTONE-LIMESTONE FOR METALLURGICAL USE CONFIRMING TO IS:10345-2004
1,437 20 2,245
15-Sep-18 VIETNAM KRISHNA TALCO INDUSTRIES
LIMESTONE POWDER-KT-2V (NON PHARMA GRADE) CFT NO-VN-IN 18 /01/14457 DT-21.08..2018
5,949 82 55
LIMESTONE POWDER-KT-1V (NON PHARMA GRADE) CFT NO-VN-IN 18 /01/14457 DT-21.08..2018
6,929 96 78
18-Sep-18
UNITED ARAB EMIRATES
ELECTROSTEEL STEELS LIMITED.LIMESTONE 30-60 MM (GOODS FOR METALLURGICAL USE AND CONFORMS TO IS:10345-2004)
1,513 21 24,000
VIETNAMSTENOVATE SYNERGIES & EXPORTS PRIVATE LIMITED
QUICK LIME LUMP 8,305 114 239
20-Sep-18 VIETNAM SNG MICRONS PRIVATE LIMITEDLIMESTONE POWDER GRADE: SM004 (NOT FOR MEDICINAL AND FOOD US E)
6,312 87 84
21-Sep-18 OMAN YOUTHSTAR VANIJYA PRIVATE LIMITED QUICK LIME 10-50 MM (LUMP LIME) 7,439 101 221
24-Sep-18
UNITED ARAB EMIRATES
RIPLEY & COMPANY STEVEDORING & HANDLING PVT.LTD.
LIMESTONE 10-40 MM [GOODS FOR METALLURGICAL USE AND CONFORMS TO IS:10345-2004)
1,849 25 560
TATA STEEL LIMITED
CP GR LIMESTONE-limestone for metallurgical use confirming to is:10345-2004
1,533 21 25,000
SP GR. LIMESTONE-LIMESTONE FOR METALLURGICAL USE C ONFIRMING TO IS:10345-2004
1,526 21 2,700
VIETNAM CHANDRA POLYMER PRIVATE LIMITED.
LIME STONE POWDER GRADE-CPPL-2 (AIFTA.CFT.NO:VN-IN18/74/007 50 DT:06.09.2018)
6,334 86 28
LIME STONE POWDER GRADE-CPPL-001 (AIFTA.CFT.NO:VN-IN18/74/0 0750 DT:06.09.2018)
8,138 111 102
25-Sep-18 VIETNAM TATA STEEL LIMITED
LOW SILICA LIMESTONE-AIFTA CERT NO VN-IN18/77/00150 DT 05/09 /2018-LIMESTONE FOR METALLURGICAL USE CONFIRMING TO IS:103
1,439 20 2,300
LOW SILICA LIMESTONE-AIFTA CERT NO VN-IN18/77/00146 DT 04/0 9/2018-LIMESTONE FOR METALLURGICAL USE CONFIRMING TO IS:10
1,623 22 3,612
27-Sep-18UNITED ARAB EMIRATES
TATA STEEL LIMITEDCP GR LIMESTONE-limestone for metallurgical use confirming to is:10345-2004
1,533 21 3,100
7-Sep-18 VIETNAM TATA STEEL LIMITED
LOW SILICA LIMESTONE (AIFTA CFT NO. VN-IN 18/77/0014 6)-LIMESTONE FOR METALLURGICAL USE CONFIRMING TO IS:10345-
1,599 22 22,000
26-Sep-18 MALAYSIA 20 MICRONS LTD.LIMESTONE POWDER-N (NOT FOR MEDICATION USE)
6,897 94 100
Limestone import through major Indian ports September’18, Contd...
Port Date Country Of Origin Importer Item Description Unit Price
(in Rs./Ton) Unit Price (in $/Ton)
Quantity (in Tons)
LIMEStONE IMPORtS

October 31, 2018 | 97
KOLKATA
8-Sep-18 VIETNAM RAM RATAN MUNDHRALIMESTONE POWDER CA-SP10 (NOT FOR MEDICINAL AND FOOD PURPOSE) (INVOICE NO: SUN.86.0718-GCC/IND)
6,239 86 168
29-Sep-18 VIETNAM KRISHNA TALCO INDUSTRIES
LIMESTONE POWDER-KT-IV (NON PHARMA GRADE) CFT NO. VN-IN 18 /01/15516 DT. 06.09.2018
7,034 96 53
LIMESTONE POWDER-KT-3V (NON PHARMA GRADE) CFT NO. VN-IN 18/01 /15516 DT. 06.09.2018
5,634 77 55
KOLKATA Total 2,36,142
RAXAUL 14-Sep-18 NEPAL FLSMIDTH PRIVATE LIMITEDLIMESTONE 1,778 25 1
LIMESTONE HIGH GRADE 2,135 29 1
RAXAUL Total 2
PARADIP
1-Sep-18UNITED ARAB EMIRATES
TATA STEEL LIMITEDCP GRADE LIMESTONE-LIMESTONE FOR METALLURGICAL USE CONFIRMING TO IS:10345-2004
1,510 21 20,000
3-Sep-18UNITED ARAB EMIRATES
TATA STEEL LIMITEDCP GRADE LIMESTONE-LIMESTONE FOR METALLURGICAL USE CONFIRMING TO IS:10345-2004
1,510 21 4,709
12-Sep-18UNITED ARAB EMIRATES
BHUSHAN POWER & STEEL LIMITED LIMESTONE (40-80MM) 1,386 19 54,510
NEELACHAL ISPAT NIGAM LIMITED LIMESTONE (10-50 MM) 1,360 19 51,975
STEEL AUTHORITY OF INDIA LIMITEDSMS GRADE LOW SILICA LIMESTONE SIZE-(30-60 MM)
1,497 21 210
TATA STEEL LIMITEDCP GRADE LIMESTONE-LIMESTONE FOR METALLURGICAL USE CONFIRM ING TO IS:10345-2004
1,520 21 11,000
14-Sep-18UNITED ARAB EMIRATES
BHUSHAN STEEL LIMITED CP GRADE LIMESTONE 1,372 19 39,025
TATA STEEL LIMITEDCP GRADE LIMESTONE-LIMESTONE FOR METALLURGICAL USE CONFIRMIN G TO IS: 10345-2004
1,520 21 9,900
15-Sep-18 VIETNAM TATA STEEL LIMITED
LOW SILICA LIMESTONE (AIFTA CFT VN-IN 18/77/00149)-LIMESTONE FOR METALLURGICAL USE CONFIRMING TO IS:10345-2004
1,417 20 11,000
LOW SILICA LIMESTONE (AIFTA VN-IN 18/77/00150)-LIM ESTONE FOR METALLURGICAL USE CONFIRMING TO IS:10345-2004
1,417 20 12,000
24-Sep-18 VIETNAM TATA STEEL LIMITED
LOW SILICA LIMESTONE (AIFTA CFT:VN-IN 18/77/00150)-LIMESTONE FOR METALLURGICAL USE CONFIRMING TO IS:10345-2004
1,439 20 4,500
PARADIP Total 2,18,829
VIZAG
28-Sep-18UNITED ARAB EMIRATES
JINDAL STEEL & POWER LIMITEDLIME STONE (40-80MM) OF UAE ORIGIN 1,428 19 30,198
LIME STONE (5-30MM) OF UAE ORIGIN 1,296 18 20,150
STEEL AUTHORITY OF INDIA LIMITEDSMS GRADE LOW SILICA LIMESTONE-SIZE 10-35 MM
1,473 20 22,000
QUICK LIME LUMPS (10-50MM) (PO NO: 6700003704/31.7.2018)
6,924 94 249
1-Sep-18UNITED ARAB EMIRATES
QUICK LIME LUMPS (10-50MM) 6,684 94 209
3-Sep-18
THAILAND ITC LIMITED QUICK LIME 7,821 110 144
VIETNAMWOLKEM INDIA LIMITED
WHITE LIMESTONE LUMPS (SIZE : 10-30CM)
3,556 50 413
QUICK LIME IN JUMBO BAGS 6,613 93 258
LIMEStONE IMPORtS
Limestone import through major Indian ports September’18, Contd...
Port Date Country Of Origin Importer Item Description Unit Price
(in Rs./Ton) Unit Price (in $/Ton)
Quantity (in Tons)

October 31, 2018 | 98
VIZAG
3-Sep-18 VIETNAMWOLKEM INDIA LIMITED QUICK LIME IN JUMBO BAGS 6,613 93 266
QUICK LIME-CAO 92.14% 6,436 91 243
5-Sep-18 VIETNAM QUICK LIME (CAO : 91.98%) 6,612 93 508
10-Sep-18OMAN ITC LIMITED QUICK LIME (SIZE: 8-20MM) (LUMP LIME) 6,675 92 436
THAILAND ITC LIMITED QUICK LIME 7,981 110 144
11-Sep-18
MALAYSIA QUICK LIME LUMPS 6,892 95 750
OMAN QUICK LIME LUMPS 6,820 94 740
UNITED ARAB EMIRATES
JINDAL STEEL & POWER LIMITED LIME STONE (40-80MM) OF UAE ORIGIN 1,328 18 51,945
VIETNAMITC LIMITED QUICK LIME 7,110 98 369
QUICK LIME LUMPS 6,820 94 242
12-Sep-18 VIETNAMQUICK LIME LUMPS (SIZE: 10-60 MM) 6,820 94 236
QUICK LIME (CAO 90.98%) 6,823 94 262
17-Sep-18UNITED ARAB EMIRATES
QUICK LIME LUMPS (10-50MM) 6,820 94 291
18-Sep-18 OMAN ITC LIMITED QUICK LIME (SIZE: 8-20MM) (LUMP LIME) 6,675 92 370
20-Sep-18 OMAN QUICKLIME LUMPS 6,820 94 740
22-Sep-18UNITED ARAB EMIRATES
QUICK LIME LUMPS (10-50 MM) 6,924 94 208
24-Sep-18 VIETNAM QUICK LIME LUMPS (CAO: 93%) 6,850 93 216
25-Sep-18 VIETNAM QUICK LIME (CAO-90.26%) 6,927 94 326
7-Sep-18 VIETNAM QUICK LIME LUMP (SIZE:20-60 MM) 6,986 96 255
19-Sep-18 VIETNAM QUICK LIME (CAO:91.84%) 6,748 93 252
8-Sep-18 MALAYSIA QUICK LIME LUMPS 6,892 95 750
4-Sep-18
OMANITC LIMITED QUICK LIME (SIZE: 8-20MM) (LUMP LIME) 6,542 92 762
QUICK LIME: CAO:93.60% 6,613 93 445
VIETNAM
USHA MICRONS PRIVATE LIMITEDLIMESTONE POWDER (UM-30UC) (NOT FOR MEDICINAL USE)
4,266 60 28
LIMESTONE POWDER COATED (UM-20C) (NOT FOR MEDICINAL USE)
5,688 80 28
VIZAG Total 1,34,434
GANGAVARAM
6-Sep-18 VIETNAM RASHTRIYA ISPAT NIGAM LIMITED LIMESTONE (30-60MM) 1,160 16 55,000
24-Sep-18UNITED ARAB EMIRATES
TATA STEEL LIMITED CP GR. LIMESTONE 1,533 21 11,000
1,533 21 14,050
19-Sep-18UNITED ARAB EMIRATES
TATA STEEL LIMITED SP GR. LIMESTONE 1,503 21 11,000
1,503 21 16,100
8-Sep-18UNITED ARAB EMIRATES
TATA STEEL LIMITED CP GRADE LIMESTONE 1,608 22 12,540
1,608 22 11,000
GANGAVARAM Total 1,30,690
KRISHNAPATNAM 26-Sep-18UNITED ARAB EMIRATES
JSW STEEL LIMITED
LIMESTONE (GRADE : 30-60 MM) 1,215 17 47,665
LIMESTONE (GRADE: 40-80 MM) 1,241 17 10,000
LIME STONE (GRADE : 10-30MM) 1,105 15 16,000
KRISHNAPATNAM Total 73,665
KAKINADA 19-Sep-18 MALAYSIA OMYA INDIA PVT.LTD. LIME STONE/CALCITE CHIPS 3,540 49 10,000
KAKINADA Total 10,000
LIMEStONE IMPORtS
Limestone import through major Indian ports September’18, Contd...
Port Date Country Of Origin Importer Item Description Unit Price
(in Rs./Ton) Unit Price (in $/Ton)
Quantity (in Tons)
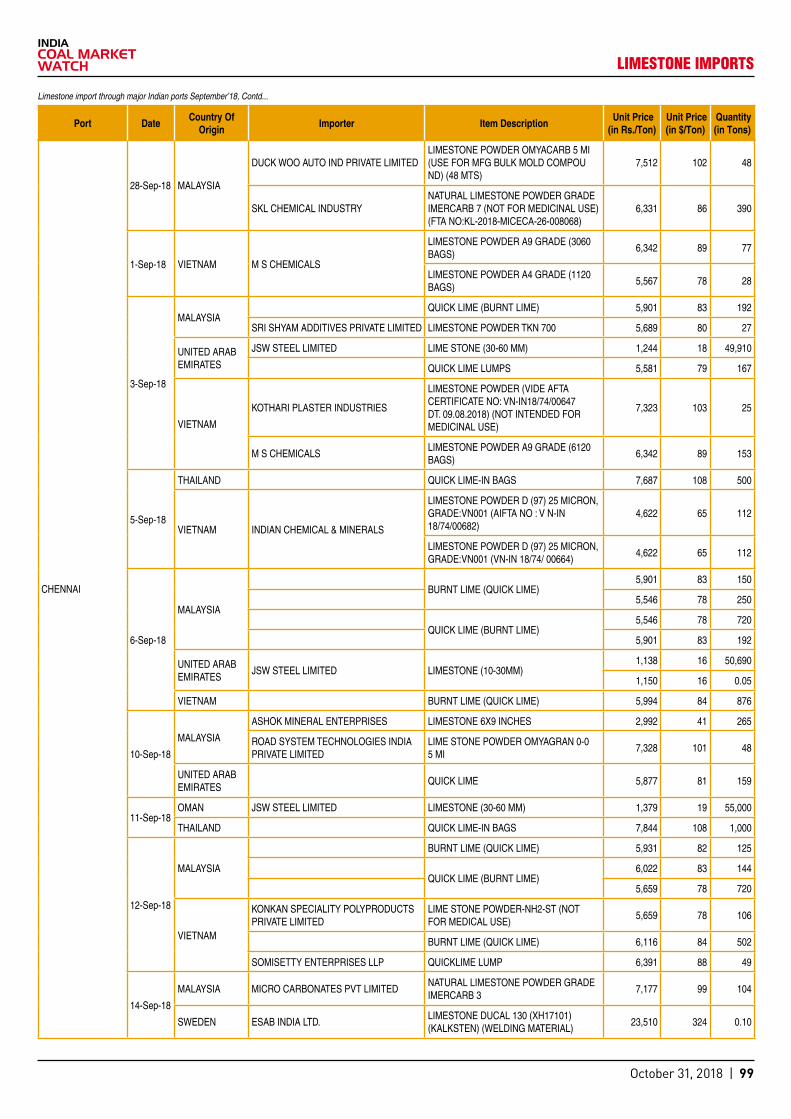
October 31, 2018 | 99
CHENNAI
28-Sep-18 MALAYSIA
DUCK WOO AUTO IND PRIVATE LIMITEDLIMESTONE POWDER OMYACARB 5 MI (USE FOR MFG BULK MOLD COMPOU ND) (48 MTS)
7,512 102 48
SKL CHEMICAL INDUSTRYNATURAL LIMESTONE POWDER GRADE IMERCARB 7 (NOT FOR MEDICINAL USE) (FTA NO:KL-2018-MICECA-26-008068)
6,331 86 390
1-Sep-18 VIETNAM M S CHEMICALS
LIMESTONE POWDER A9 GRADE (3060 BAGS)
6,342 89 77
LIMESTONE POWDER A4 GRADE (1120 BAGS)
5,567 78 28
3-Sep-18
MALAYSIAQUICK LIME (BURNT LIME) 5,901 83 192
SRI SHYAM ADDITIVES PRIVATE LIMITED LIMESTONE POWDER TKN 700 5,689 80 27
UNITED ARAB EMIRATES
JSW STEEL LIMITED LIME STONE (30-60 MM) 1,244 18 49,910
QUICK LIME LUMPS 5,581 79 167
VIETNAM
KOTHARI PLASTER INDUSTRIES
LIMESTONE POWDER (VIDE AFTA CERTIFICATE NO: VN-IN18/74/00647 DT. 09.08.2018) (NOT INTENDED FOR MEDICINAL USE)
7,323 103 25
M S CHEMICALSLIMESTONE POWDER A9 GRADE (6120 BAGS)
6,342 89 153
5-Sep-18
THAILAND QUICK LIME-IN BAGS 7,687 108 500
VIETNAM INDIAN CHEMICAL & MINERALS
LIMESTONE POWDER D (97) 25 MICRON, GRADE:VN001 (AIFTA NO : V N-IN 18/74/00682)
4,622 65 112
LIMESTONE POWDER D (97) 25 MICRON, GRADE:VN001 (VN-IN 18/74/ 00664)
4,622 65 112
6-Sep-18
MALAYSIA
BURNT LIME (QUICK LIME) 5,901 83 150
5,546 78 250
QUICK LIME (BURNT LIME) 5,546 78 720
5,901 83 192
UNITED ARAB EMIRATES
JSW STEEL LIMITED LIMESTONE (10-30MM) 1,138 16 50,690
1,150 16 0.05
VIETNAM BURNT LIME (QUICK LIME) 5,994 84 876
10-Sep-18
MALAYSIA
ASHOK MINERAL ENTERPRISES LIMESTONE 6X9 INCHES 2,992 41 265
ROAD SYSTEM TECHNOLOGIES INDIA PRIVATE LIMITED
LIME STONE POWDER OMYAGRAN 0-0 5 MI
7,328 101 48
UNITED ARAB EMIRATES
QUICK LIME 5,877 81 159
11-Sep-18OMAN JSW STEEL LIMITED LIMESTONE (30-60 MM) 1,379 19 55,000
THAILAND QUICK LIME-IN BAGS 7,844 108 1,000
12-Sep-18
MALAYSIA
BURNT LIME (QUICK LIME) 5,931 82 125
QUICK LIME (BURNT LIME) 6,022 83 144
5,659 78 720
VIETNAM
KONKAN SPECIALITY POLYPRODUCTS PRIVATE LIMITED
LIME STONE POWDER-NH2-ST (NOT FOR MEDICAL USE)
5,659 78 106
BURNT LIME (QUICK LIME) 6,116 84 502
SOMISETTY ENTERPRISES LLP QUICKLIME LUMP 6,391 88 49
14-Sep-18
MALAYSIA MICRO CARBONATES PVT LIMITEDNATURAL LIMESTONE POWDER GRADE IMERCARB 3
7,177 99 104
SWEDEN ESAB INDIA LTD.LIMESTONE DUCAL 130 (XH17101) (KALKSTEN) (WELDING MATERIAL)
23,510 324 0.10
LIMEStONE IMPORtS
Limestone import through major Indian ports September’18, Contd...
Port Date Country Of Origin Importer Item Description Unit Price
(in Rs./Ton) Unit Price (in $/Ton)
Quantity (in Tons)

October 31, 2018 | 100
CHENNAI
15-Sep-18
UNITED ARAB EMIRATES
QUICK LIME LUMPS 5,695 78 208
QUICK LIME (BURNT LIME) 5,877 81 181
VIETNAM
ESHWARI CHEMTECHLIME STONE GRANULES 3-4MM (INV.NO.03/2018/LC-ESH/INV DT.08.08 0.2018
3,324 46 84
M S CHEMICALS
LIMESTONE POWDER A9 GRADE (4080 BAGS)
6,559 90 102
LIMESTONE POWDER A4 GRADE (1120BAGS)
5,789 80 28
17-Sep-18 VIETNAM
NIRMAL TRADING CORPORATIONUNCOATED LIME STONE POWDER MRB2 (NOT FOR MEDICINAL USE) FTA. VNIN18/01/14513 DT.23.08.2018
5,949 82 54
RAJ CHEMICALSLIME STONE POWDER GRADE RC-3 (NOT FOR MEDICAL USE) (FTA NO: VN-IN 18/74/00687)
5,079 70 112
18-Sep-18UNITED ARAB EMIRATES
JSW STEEL LIMITED LIME STONE (10-30 MM) 1,175 16 43,502
20-Sep-18
MALAYSIA
GNANAM AGENCIESNATURAL LIME STONE POWDER GRADE IMERCARB 7
5,985 83 130
QUICK LIME (BURNT LIME) 5,659 78 250
QUICK LIME POWDER (200 BAGS) 7,255 100 250
THAILAND QUICK LIME-IN BAGS 7,924 109 300
UNITED ARAB EMIRATES
JSW STEEL LIMITED LIMESTONE (30-60MM) 1,288 18 19,777
VIETNAM
ROHIT MARKETINGUNCOATED LIMESTONE POWDER LCC35 (NOT FOR MEDICINAL USE)
4,353 60 27
SRI GANESH COLOUR CO.
LIME STONE POWDER-GCC SUPER SHINE 2G (NOT FOR MEDICINAL AND FOOD USE) (FTA NO :VN-IN 18/01/15608)
4,643 64 84
LIME STONE POWDER-GCC SUPER SHINE 1c (NOT FOR MEDICINAL AND FOOD USE) (FTA NO :VN-IN 18/01/15608)
6,602 91 28
21-Sep-18
MALAYSIA BURNT LIME (QUICK LIME) 5,745 78 250
UNITED ARAB EMIRATES
QUICK LIME 5,966 81 186
QUICK LIME LUMPS 5,782 79 167
VIETNAM
INDIAN CHEMICAL & MINERALSLIMESTONE LUMPS (GRADE : A SIZE 10 TO 40 CM) (AIFTA NO : VN-IN 18/05/01378)
3,314 45 140
PONN POLYMERSNATURAL LIMESTONE POWDER (GRADE:GANFIL VIETNAM G2)
4,971 68 140
22-Sep-18
OMAN QUICK LIME 20-60 MM (OWN USE) 6,872 93 265
VIETNAM RAJ CHEMICALSLIME STONE POWDER GRADE RC-3 (NOT FOR MEDICAL USE) (FTA NO: VN-IN 18/74/00667)
5,156 70 112
24-Sep-18 VIETNAMKOTHARI PLASTER INDUSTRIES
LIMESTONE POWDER GRADE:KPI-CALFINE (VIDE AFTA CERTIFICATENO:V N-IN18/01/15092 DT.30.08.18) (NOT INTENDED FOR MEDICINAL USE)
4,419 60 28
QUICK LIME LUMP 6,629 90 145
25-Sep-18 VIETNAM PONN POLYMERS
NATURAL LIMESTONE POWDER-GANFIL VIETNAM GRADE G2
4,971 68 84
NATURAL LIMESTONE POWDER (GRADE:GANFIL VIETNAM SUPER SHINE)
5,119 70 56
27-Sep-18 MALAYSIA OMYA INDIA PVT.LTD.
LIMESTONE POWDER 48 MTS OMYACARB 1-IP (1920 X 25KG PAPER BAG) (NOT INTENDED FOR MEDICINAL AND FOOD USE)
9,192 125 48
LIMEStONE IMPORtS
Limestone import through major Indian ports September’18, Contd...
Port Date Country Of Origin Importer Item Description Unit Price
(in Rs./Ton) Unit Price (in $/Ton)
Quantity (in Tons)

October 31, 2018 | 101
CHENNAI
27-Sep-18
MALAYSIA
OMYA INDIA PVT.LTD.BURNT LIME (QUICK LIME)
6,113 83 125
5,745 78 250
QUICK LIME (BURNT LIME) 5,745 78 720
VIETNAM ARUN MINERALS,LIMESTONE POWDER (UNCOATED) GCC-LC-10 (ASEAN-INDIA FREE TRADE AREA VN-IN18/01/15433)
5,966 81 78
7-Sep-18UNITED ARAB EMIRATES
ACCORD TRADING INDIA PVT. LTD., QUICK LIME 5,808 80 213
19-Sep-18
FRANCE ATC CHEMICALS INDIA PVT LTDACTILIME EC (RAW MATERIAL FOR LEATHER FINISHING) LEATHER CHEM ICALS
2,29,635 3,165 2
MALAYSIA
BURNT LIME (QUICK LIME) 6,022 83 125
QUICK LIME (BURNT LIME) 6,022 83 144
5,659 78 360
THAILAND QUICK LIME-IN BAGS 7,844 108 500
VIETNAM BURNT LIME (QUICK LIME) 6,116 84 512
26-Sep-18 THAILAND QUICK LIME-IN BAGS 7,963 108 500
CHENNAI Total 2,33,107
TUTICORIN / VOC
28-Sep-18
OMAN JSW STEEL LIMITED QUICK LIME 10-30MM 6,187 84 571
VIETNAM SRIRAAM CHEMICALS PRIVATE LIMITEDLIME STONE POWDER SR-08 7,181 98 50
LIME STONE POWDER SR-20 5,450 74 56
5-Sep-18 OMANTUTICORIN ALKALI CHEMICALS AND FERTILISERS LTD.,
QUICK LIME 7,074 100 244
6-Sep-18 OMAN QUICK LIME5-20MM 6,257 88 293
10-Sep-18UNITED ARAB EMIRATES
METALOTUS QUICK LIME LUMPS SIZE:10-50MM 7,043 97 206
11-Sep-18 OMANACCORD TRADING INDIA PVT. LTD., QUICK LIME (0-10 MM) 6,533 90 244
JSW STEEL LIMITED QUICK LIME 10-30MM 6,095 84 446
12-Sep-18OMAN QUICK LIME5-20MM 6,384 88 268
VIETNAM QUICK LIME 6,863 95 258
14-Sep-18 OMAN
JSW STEEL LIMITED QUICK LIME 0-10 MM 5,804 80 294
TAMIL NADU NEWSPRINT & PAPERS LIMITED
LIMESTONE 1,632 23 25,000
20-Sep-18 OMAN ACCORD TRADING INDIA PVT. LTD., QUICK LIME (0-10 MM) 6,533 90 244
21-Sep-18 OMAN JSW STEEL LIMITED QUICK LIME 0-10 MM 5,892 80 488
22-Sep-18
MALAYSIA 20 MICRONS NANO MINERALS LTD,LIMESTONE LUMPS (6”X9”) NOT FOR MEDICATION USE
2,883 39 269
VIETNAM RAAJ IMPEX INDIA INCQUICK LIME IN BAGS IN SMALL STONE FORM
7,352 100 154
24-Sep-18UNITED ARAB EMIRATES
EASTERN BULK TRADING & SHIPPING PVT LTD
LIMESTONE 994 14 9,002
25-Sep-18UNITED ARAB EMIRATES
THE INDIA CEMENTS LIMITED LIMESTONE 1,127 15 53,950
27-Sep-18 OMANTUTICORIN ALKALI CHEMICALS AND FERTILISERS LTD.,
QUICK LIME 7,328 100 241
19-Sep-18 OMAN JSW STEEL LIMITED QUICK LIME 10-30MM 6,095 84 547
26-Sep-18 OMAN ACCORD TRADING INDIA PVT. LTD., QUICK LIME (0-10 MM) 6,632 90 244
8-Sep-18 VIETNAMSRI RAJESWARI COLOURS & CHEMICALS
LIME STONE POWDER (LCC17) NOT FOR MEDICINAL USE
5,623 78 81
4-Sep-18 OMAN JSW STEEL LIMITED QUICK LIME 0-10 MM 5,688 80 609
LIMEStONE IMPORtS
Limestone import through major Indian ports September’18, Contd...
Port Date Country Of Origin Importer Item Description Unit Price
(in Rs./Ton) Unit Price (in $/Ton)
Quantity (in Tons)

October 31, 2018 | 102
TUTICORIN / VOC
4-Sep-18 OMAN JSW STEEL LIMITED
QUICK LIME 0-10MM 5,688 80 244
QUICK LIME 10-30MM 5,973 84 444
5,973 84 445
13-Sep-18 OMANEASTERN BULK TRADING & SHIPPING PVT LTD
LIMESTONE 1,270 18 21,600
TUTICORIN / VOC Total 1,16,492
IRUNGATTUKOTTAI-ILP ICD
5-Sep-18 OMAN SAINT-GOBAIN INDIA PRIVATE LIMITEDLIMESTONE (CALCIUM CARBONATE CALCITE)
3,413 48 750
25-Sep-18 OMAN SAINT-GOBAIN INDIA PRIVATE LIMITEDLIMESTONE (CALCIUM CARBONATE CALCITE)
3,413 46 375
IRUNGATTUKOTTAI-ILP ICD Total 1,125
KATTUPALLI-INKAT1
14-Sep-18
MALAYSIA
20 MICRONS LTD.
LIMESTONE POWDER-N (NOT FOR MEDICATION USE) VIDE FTA CERT.NO:PK-2018-AI-21-000798 DT:13.09.2018
5,938 82 100
LIMESTONE LUMPS (6”X9”) (NOT FOR MEDICATION USE) VIDE FTA CERT. NO: PK-2018-AI-21-000783 DT:06.09.2018
2,472 34 161
LIMESTONE LUMPS (RANDOM SIZE) (NOT FOR MEDICATION USE) VIDE FTA CERT. NO: PK-2018-AI-21-000794 DT:12.09.2018
2,761 38 215
POLY PIPES INDIA (P) LTD
LIMESTONE POWDER TKN 2 (MICECA CERTIFICATE NO.PK-2018-MICECA-26-001410)
7,172 99 106
LIMESTONE POWDER TKN 600 (MICECA CERTIFICATE NO.PK-2018-MICE CA-26-001410)
6,009 83 212
LIMESTONE POWDER TKN 5 (MICECA CERTIFICATE NO.PK-2018-MICECA-26-001410)
5,040 69 27
LIMESTONE POWDER TKN 700 (MICECA CERTIFICATE NO.PK-2018-MICE CA-26-001410)
6,281 87 265
VIETNAM SS ALUM PRIVATE LIMITED
LIMESTONE POWDER GRADE LC08 6,123 84 100
LIMESTONE POWDER GRADE LC20 4,534 63 28
LIMESTONE POWDER GRADE LC30 4,317 60 56
LIMESTONE POWDER GRADE LC65 3,918 54 196
15-Sep-18
MALAYSIAQUICK LIME-AIFTA REF NO.KL-2018-AI-21-011883
7,204 99 240
VIETNAMQUICK LIME-AIFTA REF NO.VN-IN 18/05/01404
7,364 102 326
20-Sep-18
MALAYSIA POLY PIPES INDIA (P) LTD
LIMESTONE POWDER TKN 5 (MICECA CERTIFICATE NO.PK-2018-MICECA-26-001420)
5,053 70 133
LIMESTONE POWDER TKN 2 (MICECA CERTIFICATE NO.PK-2018-MICECA-26-001420)
7,191 99 53
LIMESTONE POWDER TKN 700 (MICECA CERTIFICATE NO.PK-2018-MICE CA-26-001420)
6,297 87 292
LIMESTONE POWDER TKN 600 (MICECA CERTIFICATE NO.PK-2018-MICE CA-26-001420)
6,025 83 133
VIETNAM 20 MICRONS LTD.LIME STONE POWDER-Z VIDE FTA CERT. NO: VN-IN 18/01/15382 DT:04.09.2018
6,069 84 200
LIMEStONE IMPORtS
Limestone import through major Indian ports September’18, Contd...
Port Date Country Of Origin Importer Item Description Unit Price
(in Rs./Ton) Unit Price (in $/Ton)
Quantity (in Tons)

October 31, 2018 | 103
KATTUPALLI-INKAT1
21-Sep-18
MALAYSIA 20 MICRONS LTD.
LIMESTONE LUMPS (6”X9”) (NOT FOR MEDICATION USE) VIDE FTA CERT. NO: PK-2018-AI-21-000816 DT:18.09.2018
2,478 34 270
LIMESTONE POWDER-P (NOT FOR MEDICATION USE) VIDE FTA CERT.NO.PK-2018-AI-21-000828 DT:19.09.2018
8,389 114 48
LIMESTONE POWDER 700# (NOT FOR MEDICATION USE) VIDE FTA CERTIFICATE NO: PK-2018-AI-21-000821 DT:18.09.2018
4,705 64 104
LIMESTONE LUMPS (RANDOM SIZE) (NOT FOR MEDICATION USE) VIDE FTA CERT. NO: PK-2018-AI-21-000817 DT:18.09.2018
2,800 38 270
VIETNAM 20 MICRONS LTD.
LIME STONE POWDER-Z (NATURAL POWDER) [200 MTS]
6,264 85 200
LIME STONE POWDER-Z (NATURAL POWDER) [250 MTS] (INVOICE NUMBE R: MHS-20M/2018/32/CI)
6,176 84 250
QUICK LIME-AIFTA REF NO:VN-IN 18/05/01369
7,475 102 376
24-Sep-18 VIETNAM
QUICK LIME-AIFTA REF NO: VN-IN 18/05/01318
7,475 101 724
QUICK LIME-AIFTA REF NO: VN-IN 18/05/01437
7,475 102 728
7-Sep-18 VIETNAMQUICK LIME-AIFTA REF NO.VN-IN 18/05/01270
7,364 101 711
26-Sep-18 MALAYSIA
20 MICRONS LTD.
LIMESTONE LUMPS (RANDOM SIZE) (NOT FOR MEDICATION USE) VIDE FTA CERT. NO: PK-2018-AI-21-000837 DT:24.09.2018
2,804 38 269
POLY PIPES INDIA (P) LTD
LIMESTONE POWDER TKN 60S (MICECA CERTIFICATE NO.PK-2018-MICE CA-26-001457)
9,612 131 53
LIMESTONE POWDER TKN 600 (MICECA CERTIFICATE NO.PK-2018-MICE CA-26-001457)
6,131 83 27
LIMESTONE POWDER TKN 5 (MICECA CERTIFICATE NO.PK-2018-MICECA-26-001457)
5,142 70 371
LIMESTONE POWDER TKN 2 (MICECA CERTIFICATE NO.PK-2018-MICECA-26-001456)
7,260 99 106
LIMESTONE POWDER TKN 700 (MICECA CERTIFICATE NO.PK-2018-MICE CA-26-001456)
6,358 86 345
29-Sep-18 MALAYSIA 20 MICRONS LTD.
LIMESTONE LUMPS (6”X9”) (NOT FOR MEDICATION USE) VIDE FTA CERT. NO: PK-2018-AI-21-000844 DT:24.09.2018
2,474 34 270
QUICK LIME-AIFTA REF NO.KL-2018-AI-21-012451
7,313 99 480
4-Sep-18 VIETNAM 20 MICRONS LTD.LIME STONE POWDER-Z (NATURAL POWDER) [250 MTS]
5,962 84 250
2-Sep-18 VIETNAM 20 MICRONS LTD.LIME STONE POWDER-Z (NATURAL POWDER) [240 MTS]
5,878 83 240
KATTUPALLI-INKAT1 Total 8,932
KARAIKAL 14-Sep-18 MALAYSIA OMYA INDIA PVT.LTD. LIMESTONE/CALCITE CHIPS 3,504 48 10,000
KARAIKAL Total 10,000
LIMEStONE IMPORtS
Limestone import through major Indian ports September’18, Contd...
Port Date Country Of Origin Importer Item Description Unit Price
(in Rs./Ton) Unit Price (in $/Ton)
Quantity (in Tons)

October 31, 2018 | 104
COCHIN
10-Sep-18UNITED ARAB EMIRATES
QUICK LIME (0-10MM) 5,869 81 463
24-Sep-18 CHINA MATHA CHEMESQUICK LIME (EXPANSIVE MORTAR) (NON CHEMICAL & NON FOOD GRADE)
19,364 263 27
25-Sep-18UNITED ARAB EMIRATES
QUICK LIME (0-10MM) 5,958 81 570
COCHIN Total 1,061
NEW MANGALORE
12-Sep-18 VIETNAMKONKAN SPECIALITY POLYPRODUCTS PRIVATE LIMITED
LIMESTONE POWDER-NH2-ST 6,820 94 53
4-Sep-18UNITED ARAB EMIRATES
KIOCL LIMITED, HIGH PURITY LIMESTONE 1,244 17 27,500
NEW MANGALORE Total 27,553
BANGALORE
21-Sep-18 EGYPT M S CHEMICALSLIME STONE POWDER ASCOM 30 (NOT FOR MEDICINAL USE) (QTY : 54 MTS)
5,892 80 54
25-Sep-18 VIETNAM HMS MARKETING COMPANY
LIMESTONE POWDER GRADE:MC9 (INDUSTRIAL/TECHNICAL GRADE NOT FOR MEDICAL USE) (AIFTA:VN/IN/18/01/15581/07.09.2018)
7,954 108 51
BANGALORE Total 105
MUMBAI 26-Sep-18 MALAYSIA IMERYS NEWQUEST (INDIA) PVT LTDLIMESTONE CHIPS (CALCITE CHIPS) C.O. CERTIFICATE NO: KL-2018-MICECA-26-007999 DT.20.09.2018
4,150 56 11,250
MUMBAI Total 11,250
NHAVA SHEVA
28-Sep-18MALAYSIA 20 MICRONS LTD. LIMESTONE POWDER-N 6,028 82 100
VIETNAM 20 MICRONS LTD. LIMESTONE POWDER LSP 9,457 128 96
1-Sep-18 MALAYSIA DBL VENTURES PRIVATE LIMITED
LIMESTONE POWDER TKN 700 (PTR NO.3019 GR.I DT.08.02.2018) (F TA.NO.PK-2018-MICECA-26-001322, DTD.24.08.2018)
5,201 73 27
LIMESTONE POWDER TKN 2 (PTR NO.3479 GR.I DT.28.03.2018) (FTA .NO.PK-2018-MICECA-26-001322, DTD.24.08.2018)
6,055 85 27
3-Sep-18 OMAN HOGANAS INDIA PRIVATE LIMITEDLUMP LIME-QUICK LIME-10-65 MM ORDER NO 1003322430
7,765 109 22
5-Sep-18
ITALY ULTRA FINE QUICK LIME 12,454 175 64
MALAYSIA GIRIRAJ TRADING CO.
LIMESTONE POWDER OMYACARB 2-IP (NOT INTENDED FOR MEDICINAL U SE) AIFTA CER NO-KL-2018-MICECA-26-007427 DT.29.08.18.
7,821 110 13
OMAN HARISONS STEEL LTD.LUMP LIME QUICK LIME 10-50 MM (TEST REPORT NO.1364 DT.01.08. 2018)
7,190 101 45
THAILANDQUICKLIME (FOR MFR OF GLASS FIBRE) (CALCIUM OXIDE
10,871 153 176
6-Sep-18 OMAN JAY JAGDAMBA LIMITED QUICK LIME (10-50 MM) (LUMP LIME) 6,615 93 111
10-Sep-18UNITED ARAB EMIRATES
MUKAND LTDQUICK LIME (AS PER TEST REPORT NO.693/2018-19 GR I DTD.05/06 /18 LAB#1631/I DTD.11/6/18)
6,530 90 210
11-Sep-18
OMAN
HOGANAS INDIA PRIVATE LIMITEDLUMP LIME-QUICK LIME 10-65 MM ORDER NO 1003322430 DT 09.07. 18
7,924 109 22
MUKAND LTD
QUICK LIME (LUMP LIME) SIZE:10MM-50MM (AS PER TEST REPORT N O.624/2018-19 GR I 29/5/18 LAB NO.1410/I 31/5/18)
6,530 90 223
UNITED ARAB EMIRATES
INDIA STEEL WORKS LIMITED QUICK LIME LUMPS 20-50 MM 6,530 90 168
LIMEStONE IMPORtS
Limestone import through major Indian ports September’18, Contd...
Port Date Country Of Origin Importer Item Description Unit Price
(in Rs./Ton) Unit Price (in $/Ton)
Quantity (in Tons)

October 31, 2018 | 105
NHAVA SHEVA
11-Sep-18UNITED ARAB EMIRATES
MUKAND LTDQUICK LIME (AS PER TEST REPORT#693/2018-19 GR I DTD.05.06.18 LAB#1631/I DTD.11/06/18)
6,529 90 40
6,530 90 211
12-Sep-18
OMANHARISONS STEEL LTD.
LUMP LIME QUICK LIME 10-50 MM (PREVIOUS TEST REPORT NO.1364 DT.01.08.2018)
7,337 101 44
JAY JAGDAMBA LIMITED QUICK LIME (10-50 MM) (LUMP LIME) 6,750 93 110
VIETNAM SHREE KULODAY CORPORATIONLIMESTONE POWDER-3V (NOT INTENDED FOR MEDICINAL USE, NOT FOR FOOD PURPOSES)
5,020 69 55
15-Sep-18UNITED ARAB EMIRATES
MAHINDRA SANYO SPECIAL STEEL PVT LTD
QUICK LIME/CALCINED LIME-PTR NO.3411/17-18 GROUP I DT.22.03 .2018 COMPOSITIONS IN%:-CAO:93.0,MGO:1.75,SIO2:1.50, FE2O3:0
6,531 90 209
17-Sep-18UNITED ARAB EMIRATES
MUKAND LTDQUICK LIME (AS PER TEST REPORT NO.693/2018-19 DTD.05/06/18 L AB NO.1631/I DTD.11/06/18)
6,530 90 83
18-Sep-18
OMAN HOGANAS INDIA PRIVATE LIMITEDLUMP LIME-QUICK LIME 10-65 MM ORDER NO 1003322430
7,924 109 22
UNITED ARAB EMIRATES
MUKAND LTDQUICK LIME (AS PER TEST REPORT NO.693/2018-19 GR I 05.06.18 LAB#1631/I 11/6/18)
6,530 90 252
21-Sep-18 MALAYSIA RAJASTHAN BARYTES LTD.LIMESTONE CHIPS (LOOSE) SIZE : <150MM
3,314 45 55
33,14,250 45,000 0.05
22-Sep-18IRAN ULTRA POLYMIN LTD LIMESTONE 3,054 41 371
THAILAND QUICK LIME 11,048 150 22
24-Sep-18
MALAYSIA DBL VENTURES PRIVATE LIMITEDLIMESTONE POWDER TKN 2 (PTR NO.3479 GR.I DT.28.03.2018) (FTA .NO.PK-2018-MICECA-26-001407, DTD.07.09.2018)
6,236 85 53
UNITED ARAB EMIRATES
INDIA STEEL WORKS LIMITED QUICK LIME LUMPS 20-50 MM 6,629 90 84
ESSEL MINING & INDUSTRIES LTD. QUICK LIME POWDER 8,691 118 40
25-Sep-18
OMAN HOGANAS INDIA PRIVATE LIMITEDLUMP LIME QUICK LIME 10-65 MM ORDER NO 1003322430
8,044 109 22
UNITED ARAB EMIRATES
MAHINDRA SANYO SPECIAL STEEL PVT LTD
QUICK LIME/CALCINED LIME-PTR NO.631/18 GROUP I DT.30.05.201 8 COMPOSITIONS IN%:-CAO:93.0, MGO:1.75,SIO2:1.50, FE2O3:0.60,
6,624 90 293
27-Sep-18
OMAN ALOK INGOTS (MUMBAI) PVT. LTD. LUMP LIME (QUICK LIME 10-65 MM) 7,448 101 22
UNITED ARAB EMIRATES
MUKAND LTDQUICK LIME (AS PER TEST REPORT NO.693/2018-19 GR-I 05/06/18 LAB NO.1631/I 11/06/18)
6,628 90 97
6,629 90 154
7-Sep-18
MALAYSIA 20 MICRONS LTD. LIMESTONE POWDER-N 5,938 82 100
UNITED ARAB EMIRATES
MAHINDRA SANYO SPECIAL STEEL PVT LTD
QUICK LIME / CALCINED LIME PARTICLE SIZE:10MM-50MM (AS PER T EST REPORT NO.677/2018-19 GR I 04/06/2018 LAB NO.1577/I 07/0
6,527 90 303
VIETNAM 20 MICRONS LTD. LIMESTONE POWDER LSP V 4,983 69 110
19-Sep-18UNITED ARAB EMIRATES
MAHINDRA SANYO SPECIAL STEEL PVT LTD
QUICK LIME/CALCINED LIME-PTR NO.3411/17-18 GROUP I DT.22.03 .2018 COMPOSITIONS IN%:-CAO:93.0,MGO:1.75,SIO2:1.50, FE2O3:0
6,527 90 336
26-Sep-18 OMAN
HARISONS STEEL LTD.LUMP LIME QUICK LIME 10.50MM (TEST REPORT NO.1364 DT. 01.08. 2018)
7,448 101 44
MUKAND LTDQUICK LIME-10-50 MM (LUMP LIME) (AS PER TEST REPORT NO.624/2 018-19 GR.I DTD.29/05/18 LAB#1410/I 31/05/18)
6,629 90 220
LIMEStONE IMPORtS
Limestone import through major Indian ports September’18, Contd...
Port Date Country Of Origin Importer Item Description Unit Price
(in Rs./Ton) Unit Price (in $/Ton)
Quantity (in Tons)

October 31, 2018 | 106
NHAVA SHEVA 29-Sep-18
IRAN LIME CHEMICALS LTD LIME STONE WHITE LIMESTONE CHIPS 2,398 33 131
MALAYSIA 20 MICRONS LTD. LIMESTONE POWDER-N 6,028 82 100
OMAN JAY JAGDAMBA LIMITED QUICK LIME (10-50 MM) (LUMP LIME) 6,852 93 111
NHAVA SHEVA Total 4,995
AURANGABAD 24-Sep-18UNITED ARAB EMIRATES
R. L. STEELS & ENERGY LTD. QUICK LIME LUMPS (10-15MM) 5,611 76 62
AURANGABAD Total 62
NAGPUR
18-Sep-18UNITED ARAB EMIRATES
QUICK LIME 6,970 96 272
7-Sep-18UNITED ARAB EMIRATES
QUICK LIME 6,970 96 210
NAGPUR Total 482
MUNDRA
28-Sep-18
CHINA SHREE NATH CHEMICALS AND TOOLSEXPANSIVE LIME/QUICK LIME EXPANSIVE LIME QUICK LIME
11,784 160 54
VIETNAM KOTHARI PLASTER INDUSTRIES
LIME STONE POWDER GRADE KPI-CALFINE THE COMMODITY IS NOT INT ENDED FOR MEDICINAL USE OTHER DETAILS AS PER INV & P/L
4,787 65 28
1-Sep-18
EGYPT
ASHAPURA MINECHEM LTD.274.900 MT CALCUIM CARBONATE (LIMESTONE) (LOOSE IN CONTAINER)
2,353 33 275
GAYATRI MICRONS LIMITED,LIMESTONE LUMPS 10-20 CM (NOT FOR MEDICAL USE)
2,844 40 55
TURKEY DIVINE STONE ENTERPRISE63 ROUGH LIMESTONE BLOCKS (QUARRY MIXED)
6,897 97 900
6-Sep-18
EGYPT ASHAPURA MINECHEM LTD.697.7 MT CALCUIM CARBONATE (LIMESTONE) (LOOSE IN CONTAINER)
2,369 33 698
TURKEY DIVINE STONE ENTERPRISE
03 ROUGH LIMESTONE BLOCKS (QUARRY MIXED)
6,897 97 83
10 ROUGH LIMESTONE BLOCKS (QUARRY MIXED)
6,897 97 145
12-Sep-18 VIETNAM EURO CERAMICS LTD.
WHITE LIMESTONE LUMPS (O/D AS PER INV/PKG LIST)
4,217 58 168
LIMESTONE LUMP (AS PER O/D INV/PKG LIST)
3,568 49 110
17-Sep-18 PORTUGAL SARNA STONEX PVT.LTD.ROUGH MARBLE BLOCK (MOCA CREAM LIMESTONE COLOR)
17,192 237 28
18-Sep-18 MALAYSIA RAJASTHAN BARYTES LTD.LIMESTONE CHIPS (LOOSE) SIZE: <150MM OTHER DET. AS PER INVOICE AND PACKING LIST
3,301 46 324
21-Sep-18 EGYPT ASHAPURA MINECHEM LTD.429.710 MT CALCUIM CARBONATE (LIMESTONE) (LOOSE IN CONTAINER)
2,522 34 430
22-Sep-18 MALAYSIA WOLKEM INDIA LIMITEDWHITE LIMESTONE IN LUMP FORM SIZE: UNEVEN & ASSORTED BUT NOT EXCEEDING ONE CUBIC FEET
3,139 43 477
24-Sep-18MALAYSIA WOLKEM INDIA LIMITED
WHITE LIMESTONE IN LUMP FORM SIZE: UNEVEN & ASSORTED BELOW O NE CUBIC FEET
3,041 41 477
OMAN LUMP LIME QUICKLIME (10-50) MM 7,070 96 592
25-Sep-18 BULGARIA DIVINE STONE ENTERPRISE01 ROUGH LIMESTONE BLOCKS (QUARRY MIXED)
7,218 98 28
7,218 98 30
7-Sep-18 BULGARIA DIVINE STONE ENTERPRISE14 ROUGH LIMESTONE BLOCKS (QUARRY MIXED)
6,965 96 240
LIMEStONE IMPORtS
Limestone import through major Indian ports September’18, Contd...
Port Date Country Of Origin Importer Item Description Unit Price
(in Rs./Ton) Unit Price (in $/Ton)
Quantity (in Tons)

October 31, 2018 | 107
MUNDRA
26-Sep-18
EGYPT ASHAPURA MINECHEM LTD.441.500 MT CALCUIM CARBONATE (LIMESTONE) (LOOSE IN CONTAINER)
2,435 33 442
MALAYSIA WOLKEM INDIA LIMITED
WHITE LIMESTONE IN LUMP FORM SIZE: UNEVEN & ASSORTED BUT NOT EXCEEDING ONE CUBIC FEET
3,139 43 477
WHITE LIMESTONE IN LUMP FORM SIZE: UNEVEN & ASSORTED BELOW O NE CUBIC FEET
3,041 41 477
VIETNAM EURO CERAMICS LTD.WHITE LIMESTONE LUMPS (O/D AS PER INV/PKG LIST)
4,281 58 112
29-Sep-18 EGYPT ASHAPURA MINECHEM LTD.
54.97 MT LIMESTONE LUMPS (LOOSE IN CONTAINER)
2,512 34 55
379.220 MT LIMESTONE LUMPS (LOOSE IN CONTAINER)
2,521 34 379
30-Sep-18 CHINA PRAKASH CHAND CHANDAK HUFQUICK LIME POWDER (OTHR DTLS AS PER INV, P/L & B/L)
15,835 215 110
4-Sep-18 OMAN LUMP LIME QUICKLIME (10-50) MM 6,968 98 490
MUNDRA Total 7,683
MAGDALLA
3-Sep-18UNITED ARAB EMIRATES
ESSAR STEEL INDIA LTD. LIMESTOME (30-60 MM) 1,323 19 50,732
19-Sep-18UNITED ARAB EMIRATES
ESSAR STEEL INDIA LTD. LIMESTOME (30-60 MM) 1,383 19 49,659
MAGDALLA Total 1,00,391
PIPAVAV
1-Sep-18 MALAYSIA VIMAL MICRONS LTD.LIMESTONE AGGREGATES (MICECA CERTIFICATE NO:PK-2018-MICECA-26-001301)
3,077 43 371
10-Sep-18 VIETNAM GAYATRI MICRONS LIMITED, LIMESTONE POWDER GM OBG 5,079 70 165
22-Sep-18 MALAYSIA IMERYS CARBONATES INDIA LIMITEDLIME STONE LUMPS (CERTIFICATE NO.PK-2018-MICECA-26-001412) (AS PER INVOICE, PLIST & B/L)
3,167 43 530
8-Sep-18 MALAYSIA IMERYS CARBONATES INDIA LIMITED
LIME STONE LUMPS (CERTIFICATE NO. PK-2018-MICECA-26-001371DT . 03.09.2018) (AS PER INVOICE, P/LIST & BL)
3,120 43 530
29-Sep-18 MALAYSIA IMERYS CARBONATES INDIA LIMITEDLIME STONE LUMPS (CERTIFICATE NO.PK-2018-MICECA-26-001458) (AS PER INVOICE, PLIST & B/L)
3,188 43 530
4-Sep-18UNITED ARAB EMIRATES
ULTRATECH CEMENT LIMITED LIMESTONE 900 13 48,610
PIPAVAV Total 50,736
AHMEDABAD 14-Sep-18UNITED ARAB EMIRATES
PANCHMAHAL STEEL LIMITED, QUICK LIME LUMPS (10-50mm)-1 6,894 95 208
AHMEDABAD Total 208
ANKLESHWAR 20-Sep-18 EGYPT GUJARAT BOROSIL LIMITED LIME STONE POWDER
4,353 60 29
4,353 60 75
4,353 60 146
ANKLESHWAR Total 250
THAR DRY PORT
28-Sep-18UNITED ARAB EMIRATES
LAXCON STEELS LIMITED QUICK LIME LUMPS (10-50MM) 6,997 95 250
14-Sep-18UNITED ARAB EMIRATES
LAXCON STEELS LIMITED QUICK LIME LUMPS (10-50MM) 6,894 95 125
17-Sep-18UNITED ARAB EMIRATES
LAXCON STEELS LIMITED QUICK LIME LUMPS (10-50MM) 6,894 95 207
THAR DRY PORT Total 582
LIMEStONE IMPORtS
Limestone import through major Indian ports September’18, Contd...
Port Date Country Of Origin Importer Item Description Unit Price
(in Rs./Ton) Unit Price (in $/Ton)
Quantity (in Tons)

October 31, 2018 | 108
HAZIRA
1-Sep-18 OMANL & T SPECIAL STEELS & HEAVY FORGINGS PVT.LTD.
LUMP LIME-QUICK LIME LUMPS 10-60MM 6,687 94 67
10-Sep-18 MALAYSIA WOLKEM INDIA LIMITED
WHITE LIMESTONE IN LUMP FORM SIZE: UNEVEN & ASSORTED BUT NOT EXCEEDING ONE CUBIC FEET
3,418 47 398
LIMESTONE 40MM X 60MM (CHIPS) 3,688 51 318
14-Sep-18 MALAYSIA WOLKEM INDIA LIMITEDWHITE LIMESTONE IN LUMP FORM SIZE: UNEVEN & ASSORTED BUT NOT EXCEEDING ONE CUBIC FEET
3,419 47 424
15-Sep-18 MALAYSIA WOLKEM INDIA LIMITED LIMESTONE CHIPS SIZE: ASSORTED 3,688 51 318
25-Sep-18
MALAYSIA IMERYS MINERALS (INDIA) PVT LTD.LIMESTONE CHIPS (CALCITE CHIPS) (CERTIFICATE NO. KL-2018-MICECA-26-008000 DT.20.09.2018)
4,149 56 6,000
OMANL & T SPECIAL STEELS & HEAVY FORGINGS PVT.LTD.
LUMP LIME-QUICK LIME LUMPS 10-60 MM
6,851 93 66
QUICK LIME (5-25MM) (LUMP LIME) 6,923 94 500
4-Sep-18 OMANL & T SPECIAL STEELS & HEAVY FORGINGS PVT.LTD.
LUMP LIME-QUICK LIME LUMPS 10-60MM 6,687 94 67
HAZIRA Total 8,157
KANAKPURA 4-Sep-18 EGYPT M. S. ENTERPRISES
LIME STONE POWDER ASCOM 40 (NOT FOR MEDICINAL USE)
6,755 95 50
LIME STONE POWDER ASCOM 20 (NOT FOR MEDICINAL USE)
5,048 71 54
KANAKPURA Total 104
GARHI HARSARU
29-Sep-18 OMAN
QUICK LIME LUMPS (SIZE 10-50MM) USE AS COOLING AGENT IN FURNA
6,556 89 660
QUICK LIME/LUMP LIME (CAO: 96.50) (USE AS COOLING AGENT IN F
6,557 89 615
4-Sep-18 OMANQUICK LIME/LUMP LIME (CAO: 95.10) (USE AS COOLING AGENT IN F URNACES)
6,330 89 711
13-Sep-18 OMANQUICK LIME (CAO :93.50%) USE AS COOLING AGENT IN FURNACES
6,459 89 667
GARHI HARSARU Total 2,652
DELHI 5-Sep-18 OMANNATIONAL COUNCIL FOR CEMENT & BLDG MATERIALS
LIMESTONE (USED FOR LAB STUDY PURPOSE)
10,334 145 0.10
MARLY LIMESTONE (USED FOR LAB STUDY PURPOSE)
14,640 206 0.10
DELHI Total 0
KANPUR
11-Sep-18 OMAN RIMJHIM ISPAT LTD. LUMP LIME QUICK LIME 10-65MM 6,456 89 268
26-Sep-18 OMAN RIMJHIM ISPAT LTD. LUMP LIME-QUICK LIME 10-65 MM 6,778 92 356
6,778 92 357
KANPUR Total 980
KLPPLPANKI11-Sep-18 OMAN RIMJHIM ISPAT LTD. LUMP LIME QUICK LIME 10-65 MM 6,456 89 221
29-Sep-18 OMAN RIMJHIM ISPAT LTD. LUMP LIME QUICK LIME 10-65 MM 6,778 92 356
KLPPLPANKI Total 577
Grand Total 13,91,247
*Note: Figures have been updated till August’18. Data for September’18 is provisional and may be revised in the next issue.
LIMEStONE IMPORtS
Limestone import through major Indian ports September’18, Contd...
Port Date Country Of Origin Importer Item Description Unit Price
(in Rs./Ton) Unit Price (in $/Ton)
Quantity (in Tons)
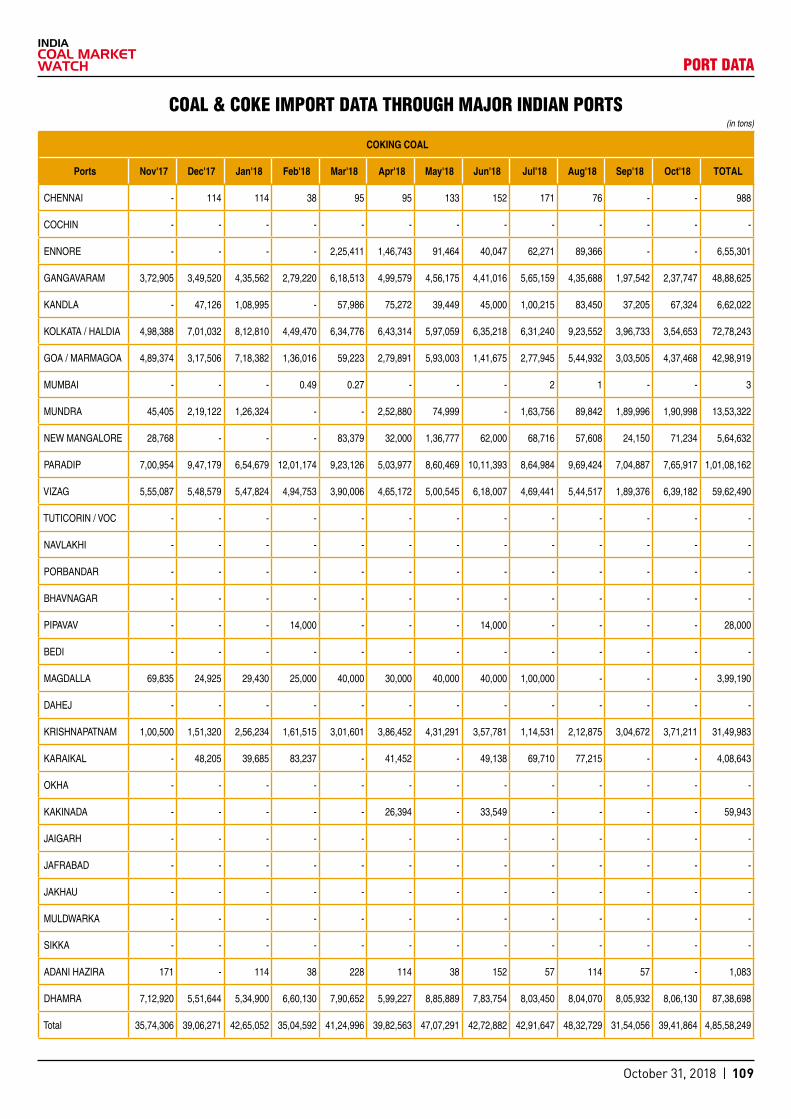
October 31, 2018 | 109
COAL & COKE IMPORt DAtA tHROUGH MAJOR INDIAN PORtS
COKING COAL
Ports Nov'17 Dec'17 Jan'18 Feb'18 Mar'18 Apr'18 May'18 Jun'18 Jul'18 Aug'18 Sep'18 Oct'18 TOTAL
CHENNAI - 114 114 38 95 95 133 152 171 76 - - 988
COCHIN - - - - - - - - - - - - -
ENNORE - - - - 2,25,411 1,46,743 91,464 40,047 62,271 89,366 - - 6,55,301
GANGAVARAM 3,72,905 3,49,520 4,35,562 2,79,220 6,18,513 4,99,579 4,56,175 4,41,016 5,65,159 4,35,688 1,97,542 2,37,747 48,88,625
KANDLA - 47,126 1,08,995 - 57,986 75,272 39,449 45,000 1,00,215 83,450 37,205 67,324 6,62,022
KOLKATA / HALDIA 4,98,388 7,01,032 8,12,810 4,49,470 6,34,776 6,43,314 5,97,059 6,35,218 6,31,240 9,23,552 3,96,733 3,54,653 72,78,243
GOA / MARMAGOA 4,89,374 3,17,506 7,18,382 1,36,016 59,223 2,79,891 5,93,003 1,41,675 2,77,945 5,44,932 3,03,505 4,37,468 42,98,919
MUMBAI - - - 0.49 0.27 - - - 2 1 - - 3
MUNDRA 45,405 2,19,122 1,26,324 - - 2,52,880 74,999 - 1,63,756 89,842 1,89,996 1,90,998 13,53,322
NEW MANGALORE 28,768 - - - 83,379 32,000 1,36,777 62,000 68,716 57,608 24,150 71,234 5,64,632
PARADIP 7,00,954 9,47,179 6,54,679 12,01,174 9,23,126 5,03,977 8,60,469 10,11,393 8,64,984 9,69,424 7,04,887 7,65,917 1,01,08,162
VIZAG 5,55,087 5,48,579 5,47,824 4,94,753 3,90,006 4,65,172 5,00,545 6,18,007 4,69,441 5,44,517 1,89,376 6,39,182 59,62,490
TUTICORIN / VOC - - - - - - - - - - - - -
NAVLAKHI - - - - - - - - - - - - -
PORBANDAR - - - - - - - - - - - - -
BHAVNAGAR - - - - - - - - - - - - -
PIPAVAV - - - 14,000 - - - 14,000 - - - - 28,000
BEDI - - - - - - - - - - - - -
MAGDALLA 69,835 24,925 29,430 25,000 40,000 30,000 40,000 40,000 1,00,000 - - - 3,99,190
DAHEJ - - - - - - - - - - - - -
KRISHNAPATNAM 1,00,500 1,51,320 2,56,234 1,61,515 3,01,601 3,86,452 4,31,291 3,57,781 1,14,531 2,12,875 3,04,672 3,71,211 31,49,983
KARAIKAL - 48,205 39,685 83,237 - 41,452 - 49,138 69,710 77,215 - - 4,08,643
OKHA - - - - - - - - - - - - -
KAKINADA - - - - - 26,394 - 33,549 - - - - 59,943
JAIGARH - - - - - - - - - - - - -
JAFRABAD - - - - - - - - - - - - -
JAKHAU - - - - - - - - - - - - -
MULDWARKA - - - - - - - - - - - - -
SIKKA - - - - - - - - - - - - -
ADANI HAZIRA 171 - 114 38 228 114 38 152 57 114 57 - 1,083
DHAMRA 7,12,920 5,51,644 5,34,900 6,60,130 7,90,652 5,99,227 8,85,889 7,83,754 8,03,450 8,04,070 8,05,932 8,06,130 87,38,698
Total 35,74,306 39,06,271 42,65,052 35,04,592 41,24,996 39,82,563 47,07,291 42,72,882 42,91,647 48,32,729 31,54,056 39,41,864 4,85,58,249
(in tons)
PORt DAtA

October 31, 2018 | 110
NON COKING COAL
Ports Nov'17 Dec'17 Jan'18 Feb'18 Mar'18 Apr'18 May'18 Jun'18 Jul'18 Aug'18 Sep'18 Oct'18 TOTAL
CHENNAI 128 362 488 298 182 313 344 642 1,102 806 208 - 4,873
COCHIN - - - - - - - 43,245 - - - - 43,245
ENNORE 6,09,867 2,14,010 6,00,738 5,38,423 5,89,904 8,21,073 8,00,775 7,00,011 4,38,452 4,83,002 5,15,748 4,51,190 67,63,192
GANGAVARAM 8,80,532 7,22,915 11,85,374 7,17,403 4,35,386 10,33,499 15,79,790 6,58,841 14,71,753 11,14,268 5,64,801 8,58,456 1,12,23,018
KANDLA 6,02,501 11,89,247 17,45,379 1,03,511 14,44,281 14,69,341 11,85,678 14,89,949 10,65,829 13,40,065 14,80,920 14,73,833 1,45,90,536
KOLKATA / HALDIA 1,09,783 2,30,657 4,00,038 2,09,231 34,400 86,611 1,88,352 2,31,878 2,44,785 3,77,945 2,23,682 3,40,502 26,77,865
GOA / MARMAGOA 1,56,878 4,64,580 1,51,985 1,00,122 79,626 1,92,997 1,75,814 1,79,775 2,11,332 1,58,430 2,58,406 1,96,691 23,26,636
MUMBAI 1,95,681 1,76,172 66,000 1,84,191 1,77,988 2,76,947 2,75,621 2,48,060 2,06,644 1,48,903 2,12,362 2,36,350 24,04,919
MUNDRA 27,02,450 21,82,248 25,62,732 26,04,014 21,40,834 24,54,965 22,68,894 19,59,941 25,43,754 26,39,530 26,63,576 24,37,851 2,91,60,788
NEW MANGALORE 2,78,174 3,98,706 4,85,320 4,50,876 5,92,221 7,52,054 5,75,283 6,48,136 3,04,131 2,34,152 1,19,116 2,68,051 51,06,220
PARADIP 6,55,035 10,71,791 8,67,260 5,56,333 4,50,724 4,15,712 5,16,725 4,47,394 4,75,015 5,19,661 4,08,972 4,10,788 67,95,410
VIZAG 6,61,606 7,73,385 7,15,680 6,34,936 6,01,404 4,99,157 12,09,110 3,94,939 10,94,831 6,14,180 5,83,200 5,73,614 83,56,041
TUTICORIN / VOC 9,00,878 5,55,904 3,00,125 5,25,377 5,31,698 4,99,706 7,38,463 3,65,350 4,41,756 3,33,535 7,29,997 7,19,142 66,41,931
NAVLAKHI 3,71,290 80,446 61,239 2,91,149 48,256 65,345 44,800 5,54,112 5,02,500 6,68,090 6,10,250 6,35,000 39,32,477
PORBANDAR 24,800 23,070 20,000 23,400 24,390 22,400 26,798 21,399 29,876 26,000 23,456 30,000 2,95,589
BHAVNAGAR 28,900 19,876 23,200 26,400 20,000 23,311 21,345 18,500 1,75,000 60,500 32,200 26,599 4,75,831
PIPAVAV 73,400 1,21,002 25,000 85,000 35,000 1,15,500 79,009 52,122 28,998 88,000 71,234 72,164 8,46,429
BEDI 3,84,300 1,83,211 51,600 1,37,900 2,23,456 1,87,988 2,01,876 1,33,890 2,01,987 2,34,126 2,22,190 2,21,173 23,83,697
MAGDALLA 3,64,752 6,91,836 6,11,350 4,87,841 7,73,537 8,57,810 5,55,983 5,54,495 5,30,148 7,98,288 4,04,161 5,22,345 71,52,546
DAHEJ 4,27,280 2,24,779 3,24,803 4,02,304 6,69,842 5,57,911 5,25,698 5,61,632 5,93,156 8,83,568 5,73,713 5,96,326 63,41,012
KRISHNAPATNAM 10,65,384 18,98,767 18,61,942 12,98,631 13,48,147 11,08,119 15,64,971 20,27,735 12,88,445 15,09,608 22,10,145 16,40,299 1,88,22,193
KARAIKAL 5,10,927 4,96,061 3,74,377 3,25,252 5,76,143 2,63,984 4,11,097 4,41,926 4,68,745 1,14,410 2,46,333 2,54,950 44,84,205
OKHA 48,900 29,763 30,200 20,500 32,437 31,300 29,200 23,400 31,200 29,876 28,312 26,543 3,61,631
KAKINADA 71,000 36,200 60,500 1,10,737 1,11,630 1,23,478 55,450 1,20,168 1,92,295 1,98,200 1,88,321 1,90,023 14,58,002
JAIGARH 3,68,170 2,22,597 2,28,764 3,29,700 2,57,780 2,28,753 3,58,000 1,98,765 2,35,000 3,54,250 4,05,351 3,03,850 34,90,980
JAFRABAD 38,689 19,765 24,287 26,543 25,600 23,214 20,213 19,876 18,976 17,321 14,300 16,742 2,65,526
JAKHAU 48,766 25,278 23,452 21,121 24,322 21,345 23,478 20,200 22,654 21,432 20,231 19,874 2,92,153
MULDWARKA 35,423 20,987 31,543 29,432 30,227 29,800 28,743 23,256 31,134 27,654 25,111 23,444 3,36,754
SIKKA 26,567 17,432 21,800 19,300 26,543 27,811 29,345 25,302 26,456 23,489 22,490 23,410 2,89,945
ADANI HAZIRA 3,87,005 3,30,585 2,29,679 2,71,515 7,85,057 2,17,331 5,90,405 5,22,168 6,27,473 7,30,790 3,70,256 3,96,959 54,59,223
DHAMRA 3,09,696 2,50,798 2,00,840 3,58,026 2,64,940 2,76,543 3,22,249 2,05,000 2,78,650 2,56,712 2,53,385 2,70,987 32,47,826
Total 1,23,38,761 1,26,72,431 1,32,85,696 1,08,89,466 1,23,55,954 1,26,84,317 1,44,03,509 1,28,92,107 1,37,82,076 1,40,06,792 1,34,82,427 1,32,37,156 15,60,30,693
(in tons)
PORt DAtA
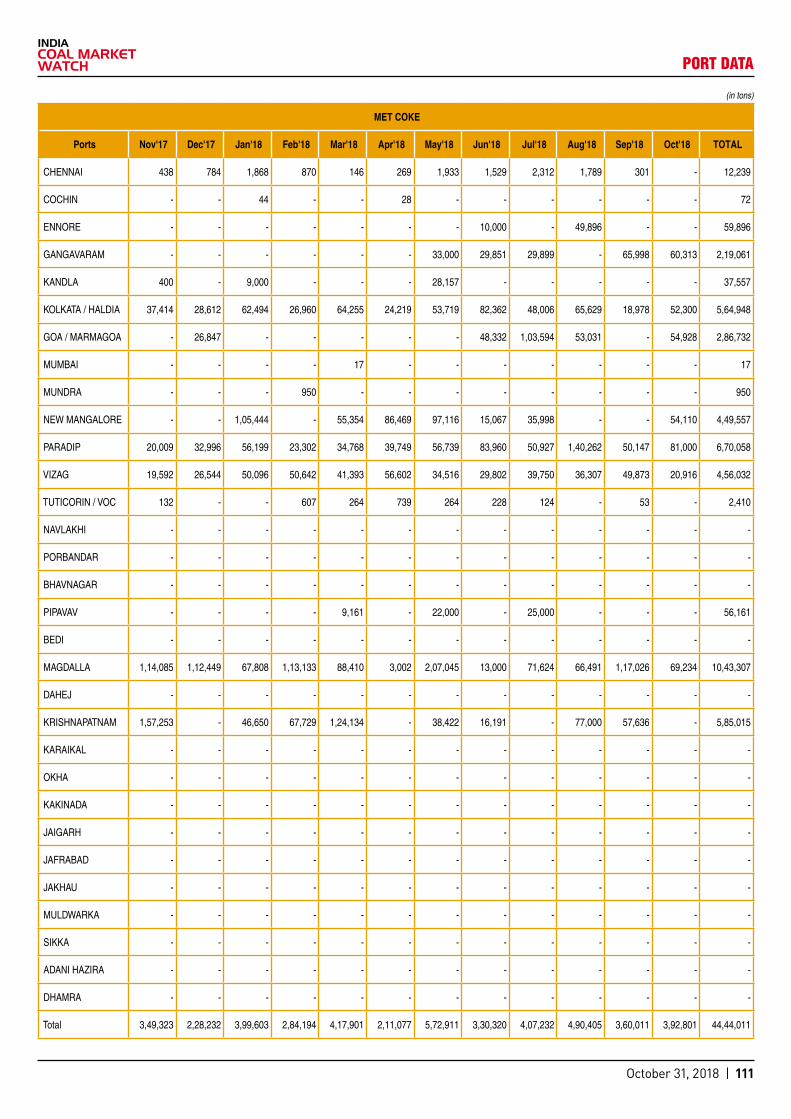
October 31, 2018 | 111
MET COKE
Ports Nov'17 Dec'17 Jan'18 Feb'18 Mar'18 Apr'18 May'18 Jun'18 Jul'18 Aug'18 Sep'18 Oct'18 TOTAL
CHENNAI 438 784 1,868 870 146 269 1,933 1,529 2,312 1,789 301 - 12,239
COCHIN - - 44 - - 28 - - - - - - 72
ENNORE - - - - - - - 10,000 - 49,896 - - 59,896
GANGAVARAM - - - - - - 33,000 29,851 29,899 - 65,998 60,313 2,19,061
KANDLA 400 - 9,000 - - - 28,157 - - - - - 37,557
KOLKATA / HALDIA 37,414 28,612 62,494 26,960 64,255 24,219 53,719 82,362 48,006 65,629 18,978 52,300 5,64,948
GOA / MARMAGOA - 26,847 - - - - - 48,332 1,03,594 53,031 - 54,928 2,86,732
MUMBAI - - - - 17 - - - - - - - 17
MUNDRA - - - 950 - - - - - - - - 950
NEW MANGALORE - - 1,05,444 - 55,354 86,469 97,116 15,067 35,998 - - 54,110 4,49,557
PARADIP 20,009 32,996 56,199 23,302 34,768 39,749 56,739 83,960 50,927 1,40,262 50,147 81,000 6,70,058
VIZAG 19,592 26,544 50,096 50,642 41,393 56,602 34,516 29,802 39,750 36,307 49,873 20,916 4,56,032
TUTICORIN / VOC 132 - - 607 264 739 264 228 124 - 53 - 2,410
NAVLAKHI - - - - - - - - - - - - -
PORBANDAR - - - - - - - - - - - - -
BHAVNAGAR - - - - - - - - - - - - -
PIPAVAV - - - - 9,161 - 22,000 - 25,000 - - - 56,161
BEDI - - - - - - - - - - - - -
MAGDALLA 1,14,085 1,12,449 67,808 1,13,133 88,410 3,002 2,07,045 13,000 71,624 66,491 1,17,026 69,234 10,43,307
DAHEJ - - - - - - - - - - - - -
KRISHNAPATNAM 1,57,253 - 46,650 67,729 1,24,134 - 38,422 16,191 - 77,000 57,636 - 5,85,015
KARAIKAL - - - - - - - - - - - - -
OKHA - - - - - - - - - - - - -
KAKINADA - - - - - - - - - - - - -
JAIGARH - - - - - - - - - - - - -
JAFRABAD - - - - - - - - - - - - -
JAKHAU - - - - - - - - - - - - -
MULDWARKA - - - - - - - - - - - - -
SIKKA - - - - - - - - - - - - -
ADANI HAZIRA - - - - - - - - - - - - -
DHAMRA - - - - - - - - - - - - -
Total 3,49,323 2,28,232 3,99,603 2,84,194 4,17,901 2,11,077 5,72,911 3,30,320 4,07,232 4,90,405 3,60,011 3,92,801 44,44,011
(in tons)
PORt DAtA

October 31, 2018 | 112
ANTHRACITE COAL
Ports Nov'17 Dec'17 Jan'18 Feb'18 Mar'18 Apr'18 May'18 Jun'18 Jul'18 Aug'18 Sep'18 Oct'18 TOTAL
CHENNAI 1,525 1,849 1,776 479 1,388 1,428 3,032 5,510 3,411 2,678 1,788 - 24,864
COCHIN - 54 - - - - - - 0.40 34 - - 89
ENNORE - - - - - - - - - - - - -
GANGAVARAM - - - - - - - - - - - - -
KANDLA - - - - - - - - - - - - -
KOLKATA / HALDIA 22,581 27,013 774 626 23,264 59,254 814 1,261 2,878 2,710 3,713 2,898 1,47,787
GOA / MARMAGOA - 54,950 - - - - - - - - - - 54,950
MUMBAI - - - - - - 6 - - - - - 6.03
MUNDRA 25 1,711 24 160 20 1,231 1,621 2,822 920 1,730 1,407 17,843 29,514
NEW MANGALORE - - 50,062 - - 69,300 42,129 33,000 - - - - 1,94,491
PARADIP 50,934 - 99,000 8,400 4,400 29,693 4,400 27,535 13,376 35,890 71,296 8,400 3,53,324
VIZAG 80,422 17,703 11,137 58,511 9,506 13,301 3,039 41,009 31,629 1,628 9,541 8,821 2,86,246
TUTICORIN / VOC 34 - - - 36 - 36 - - - - - 106
NAVLAKHI - - - - - - - - - - - - -
PORBANDAR - - - - - - - - - - - - -
BHAVNAGAR - - - - - - - - - - - - -
PIPAVAV 5,000 12,693 21,241 927 - 5,000 - - 16,003 - - - 60,864
BEDI - - - - - - - - - - - - -
MAGDALLA - - - - - - - - - - - - -
DAHEJ - - - - - - - - - - - - -
KRISHNAPATNAM 12,150 2,600 - 46,126 13,100 - 4,000 18,000 - 2,625 1,18,554 71,682 2,88,837
KARAIKAL - - - - - - - - - - - - -
OKHA - - - - - - - - - - - - -
KAKINADA - - - - - - - - - - - - -
JAIGARH - - - - - - - - - - - - -
JAFRABAD - - - - - - - - - - - - -
JAKHAU - - - - - - - - - - - - -
MULDWARKA - - - - - - - - - - - - -
SIKKA - - - - - - - - - - - - -
ADANI HAZIRA - - - - - - - - - - - - -
DHAMRA - - - - - - - - - - - - -
Total 1,72,671 1,18,573 1,84,014 1,15,228 51,714 1,79,208 59,077 1,29,138 68,217 47,295 2,06,300 1,09,644 14,41,078
(in tons)
PORt DAtA

October 31, 2018 | 113
PET COKE
Ports Nov'17 Dec'17 Jan'18 Feb'18 Mar'18 Apr'18 May'18 Jun'18 Jul'18 Aug'18 Sep'18 Oct'18 TOTAL
CHENNAI 221 67 32 706 86 224 50 66 257 258 551 - 2,517
COCHIN 20 - - 60 40 - - - - - 20 - 140.000
ENNORE - - - - - - - - - - - - -
GANGAVARAM 2,47,092 23,386 25,000 68,973 97,560 82,219 55,000 11,684 1,25,087 22,320 - 25,000 7,83,321
KANDLA 45,385 - 1,71,234 - - 27,500 - 52,050 - 30,000 66,853 50,001 4,43,023
KOLKATA / HALDIA 36,545 31,468 348 15,638 40 113 16,544 24,577 15,054 24,471 172 - 1,64,971
GOA / MARMAGOA - 11,771 15,778 - - 15,605 - 78 13,571 - - - 56,804
MUMBAI - 24 - - - - - - - 0 - - 24
MUNDRA 58,100 1,36,578 - 40 - 18 - - - 36 40 - 1,94,811
NEW MANGALORE 53,000 84,705 79,314 1,09,990 86,946 - - 55,000 43,999 - - - 5,12,953
PARADIP 25,318 - 28,579 49,891 - 20,501 34,561 59,677 13,404 40,684 - - 2,72,614
VIZAG 1,14,408 3,36,054 1,80,522 1,56,561 2,52,620 1,14,863 2,18,876 1,23,702 1,33,794 2,08,931 50,000 45,000 19,35,332
TUTICORIN / VOC - - - - - - 52,826 - 650 - - - 53,475
NAVLAKHI - - - - - - - - - - - - -
PORBANDAR - - - - - - - - - - - - -
BHAVNAGAR - - - - - - - - - - - - -
PIPAVAV 49,764 1,03,663 49,752 45,207 52,009 53,281 20 49,784 61,206 52,166 - 50,000 5,66,852
BEDI - - - - - - - - - - - - -
MAGDALLA - - - - - - - - - - - - -
DAHEJ - - - - - - - - - - - - -
KRISHNAPATNAM 70,000 3,68,772 1,60,993 - 85,000 1,64,197 1,31,459 1,13,021 25,000 1,56,357 94,653 1,72,329 15,41,781
KARAIKAL - 79,755 35,500 25,000 54,004 56,374 24,848 49,835 55,000 - - - 3,80,316
OKHA - - - - - - - - - - - - -
KAKINADA - - - 10,500 - 6,400 6,000 20,000 6,000 1,11,831 - - 1,60,731
JAIGARH - - - - - - - - - - - - -
JAFRABAD - - - - - - - - - - - - -
JAKHAU - - - - - - - - - - - - -
MULDWARKA - - - - - - - - - - - - -
SIKKA - - - - - - - - - - - - -
ADANI HAZIRA 72 - 1,07,651 24 120 96 - - 20 - - - 1,07,983
DHAMRA - - - - - - - - - - - - -
Total 6,99,925 11,76,241 8,54,703 4,82,590 6,28,426 5,41,393 5,40,182 5,59,475 4,93,042 6,47,053 2,12,288 3,42,330 71,77,649
(in tons)
PORt DAtA
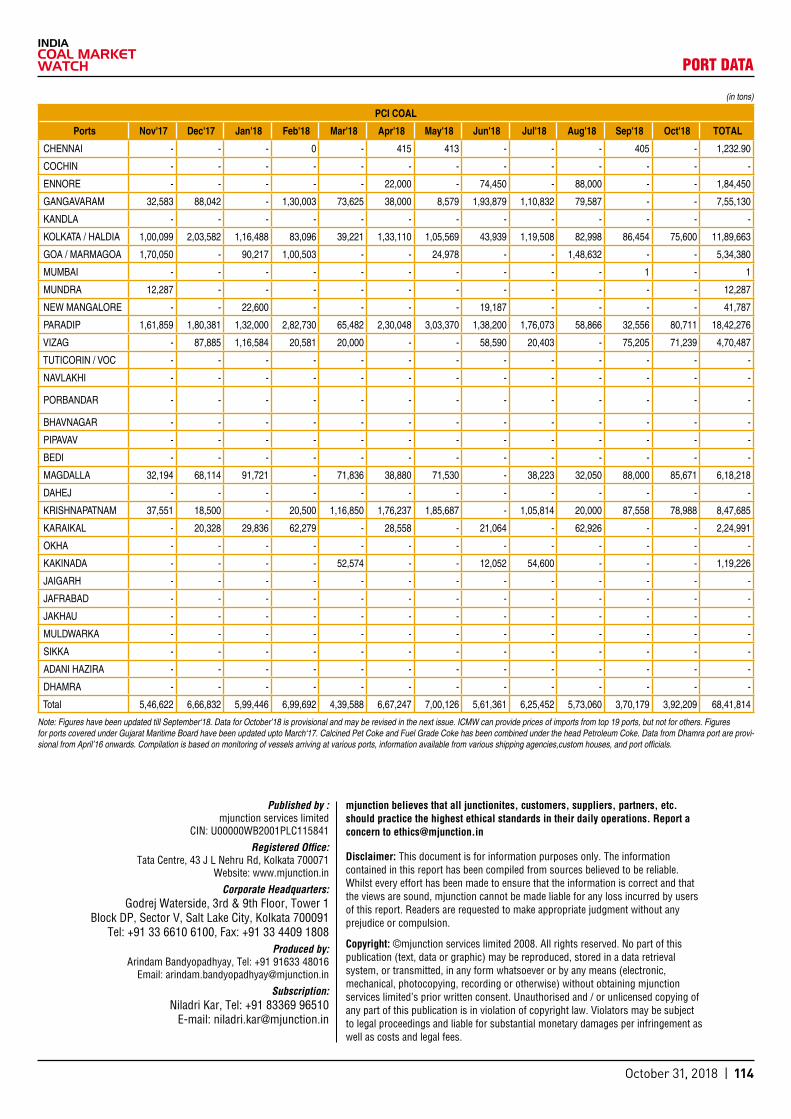
October 31, 2018 | 114
PCI COAL
Ports Nov'17 Dec'17 Jan'18 Feb'18 Mar'18 Apr'18 May'18 Jun'18 Jul'18 Aug'18 Sep'18 Oct'18 TOTAL
CHENNAI - - - 0 - 415 413 - - - 405 - 1,232.90
COCHIN - - - - - - - - - - - - -
ENNORE - - - - - 22,000 - 74,450 - 88,000 - - 1,84,450
GANGAVARAM 32,583 88,042 - 1,30,003 73,625 38,000 8,579 1,93,879 1,10,832 79,587 - - 7,55,130
KANDLA - - - - - - - - - - - - -
KOLKATA / HALDIA 1,00,099 2,03,582 1,16,488 83,096 39,221 1,33,110 1,05,569 43,939 1,19,508 82,998 86,454 75,600 11,89,663
GOA / MARMAGOA 1,70,050 - 90,217 1,00,503 - - 24,978 - - 1,48,632 - - 5,34,380
MUMBAI - - - - - - - - - - 1 - 1
MUNDRA 12,287 - - - - - - - - - - - 12,287
NEW MANGALORE - - 22,600 - - - - 19,187 - - - - 41,787
PARADIP 1,61,859 1,80,381 1,32,000 2,82,730 65,482 2,30,048 3,03,370 1,38,200 1,76,073 58,866 32,556 80,711 18,42,276
VIZAG - 87,885 1,16,584 20,581 20,000 - - 58,590 20,403 - 75,205 71,239 4,70,487
TUTICORIN / VOC - - - - - - - - - - - - -
NAVLAKHI - - - - - - - - - - - - -
PORBANDAR - - - - - - - - - - - - -
BHAVNAGAR - - - - - - - - - - - - -
PIPAVAV - - - - - - - - - - - - -
BEDI - - - - - - - - - - - - -
MAGDALLA 32,194 68,114 91,721 - 71,836 38,880 71,530 - 38,223 32,050 88,000 85,671 6,18,218
DAHEJ - - - - - - - - - - - - -
KRISHNAPATNAM 37,551 18,500 - 20,500 1,16,850 1,76,237 1,85,687 - 1,05,814 20,000 87,558 78,988 8,47,685
KARAIKAL - 20,328 29,836 62,279 - 28,558 - 21,064 - 62,926 - - 2,24,991
OKHA - - - - - - - - - - - - -
KAKINADA - - - - 52,574 - - 12,052 54,600 - - - 1,19,226
JAIGARH - - - - - - - - - - - - -
JAFRABAD - - - - - - - - - - - - -
JAKHAU - - - - - - - - - - - - -
MULDWARKA - - - - - - - - - - - - -
SIKKA - - - - - - - - - - - - -
ADANI HAZIRA - - - - - - - - - - - - -
DHAMRA - - - - - - - - - - - - -
Total 5,46,622 6,66,832 5,99,446 6,99,692 4,39,588 6,67,247 7,00,126 5,61,361 6,25,452 5,73,060 3,70,179 3,92,209 68,41,814
(in tons)
PORt DAtA
Note: Figures have been updated till September‘18. Data for October’18 is provisional and may be revised in the next issue. ICMW can provide prices of imports from top 19 ports, but not for others. Figures for ports covered under Gujarat Maritime Board have been updated upto March‘17. Calcined Pet Coke and Fuel Grade Coke has been combined under the head Petroleum Coke. Data from Dhamra port are provi-sional from April’16 onwards. Compilation is based on monitoring of vessels arriving at various ports, information available from various shipping agencies,custom houses, and port officials.
Published by : mjunction services limited
CIN: U00000WB2001PLC115841Registered Office:
Tata Centre, 43 J L Nehru Rd, Kolkata 700071 Website: www.mjunction.in
Corporate Headquarters: Godrej Waterside, 3rd & 9th Floor, Tower 1
Block DP, Sector V, Salt Lake City, Kolkata 700091 Tel: +91 33 6610 6100, Fax: +91 33 4409 1808
Produced by: Arindam Bandyopadhyay, Tel: +91 91633 48016
Email: [email protected]:
Niladri Kar, Tel: +91 83369 96510E-mail: [email protected]
mjunction believes that all junctionites, customers, suppliers, partners, etc. should practice the highest ethical standards in their daily operations. Report a concern to [email protected]
Disclaimer: This document is for information purposes only. The information contained in this report has been compiled from sources believed to be reliable. Whilst every effort has been made to ensure that the information is correct and that the views are sound, mjunction cannot be made liable for any loss incurred by users of this report. Readers are requested to make appropriate judgment without any prejudice or compulsion.
Copyright: ©mjunction services limited 2008. All rights reserved. No part of this publication (text, data or graphic) may be reproduced, stored in a data retrieval system, or transmitted, in any form whatsoever or by any means (electronic, mechanical, photocopying, recording or otherwise) without obtaining mjunction services limited’s prior written consent. Unauthorised and / or unlicensed copying of any part of this publication is in violation of copyright law. Violators may be subject to legal proceedings and liable for substantial monetary damages per infringement as well as costs and legal fees.