power efficiency comparison of dell and cisco high … · dell™ and cisco high memory capacity...
TRANSCRIPT
Brian Bassett
Solutions Performance Analysis
Power Efficiency Comparison of
Dell™ and Cisco
High Memory Capacity Blade Servers
This Dell test report analyzes the performance and performance per watt of high memory capacity blade solutions from Dell using the Dell
PowerEdge™ M620 and M710HD compared to the Cisco UCS B250 M2.
Power Efficiency Comparison of Dell and Cisco High Memory Capacity Blade Servers
ii
This document is for informational purposes only and may contain typographical errors and
technical inaccuracies. The content is provided as is, without express or implied warranties of any
kind.
© 2012 Dell Inc. All rights reserved. Dell and its affiliates cannot be responsible for errors or omissions
in typography or photography. Dell, the Dell logo, and PowerEdge are trademarks of Dell Inc. Intel and
Xeon are registered trademarks of Intel Corporation in the U.S. and other countries. Microsoft,
Windows, and Windows Server are either trademarks or registered trademarks of Microsoft Corporation
in the United States and/or other countries. Other trademarks and trade names may be used in this
document to refer to either the entities claiming the marks and names or their products. Dell
disclaims proprietary interest in the marks and names of others.
SPEC® and the benchmark name SPECpower_ssj® are registered trademarks of the Standard
Performance Evaluation Corporation. For more information about SPECpower, see
www.spec.org/power_ssj2008/
March 2012| Rev 1.0
Power Efficiency Comparison of Dell and Cisco High Memory Capacity Blade Servers
iii
Contents Executive summary ..................................................................................................... 5
Introduction ............................................................................................................. 6
Methodology ............................................................................................................. 8
Comparison 1: Blade solution power efficiency with 1333 MHz memory ..................................... 8
Comparison 1 Summary .............................................................................................. 14
Comparison 2: Blade solution power efficiency at 1067 MHz memory speed .............................. 14
Comparison 2 Summary .............................................................................................. 16
Cost as tested ......................................................................................................... 16
Expandability .......................................................................................................... 16
Rack density ........................................................................................................... 17
Summary ............................................................................................................... 17
Appendix A—Test methodology .................................................................................... 18
SPECpower_ssj2008 standard .................................................................................... 18
BIOS settings ........................................................................................................ 18
OS tuning ............................................................................................................ 19
SPECpower_ssj2008 configuration .............................................................................. 20
Power meter configuration....................................................................................... 20
Appendix B—Server hardware configuration details ............................................................ 21
Appendix C—Server firmware and driver details ................................................................ 22
Appendix D—Comparison results ................................................................................... 23
Tables Table 1. Blade enclosure configuration details .................................................................. 6
Table 2. Blade server details ....................................................................................... 7
Table 3. Comparison 1 memory configuration ................................................................... 8
Table 4. Comparison 2 memory configuration .................................................................. 14
Table 5. Blade solution cost details .............................................................................. 16
Table 6. Server hardware configuration details ................................................................ 21
Table 7. Server firmware and driver details .................................................................... 22
Power Efficiency Comparison of Dell and Cisco High Memory Capacity Blade Servers
4
Figures
Figure 1. As seen in Comparison 1 Normalized Results ......................................................... 9
Figure 2. Comparison 1 Normalized Results ....................................................................... 9
Figure 3. Comparison 1 power utilization at 100% load ........................................................ 10
Figure 4. Comparison 1 power utilization at idle ............................................................... 11
Figure 5. Comparison 1 aggregate performance at 100% target load ....................................... 12
Figure 6. Comparison 1 overall performance / watt scores ................................................... 13
Figure 7. Comparison 2 normalized results ...................................................................... 15
Figure 8. Comparison 1 results for UCS B250 M2 ................................................................ 23
Figure 9. Comparison 1 results for PowerEdge M710HD ....................................................... 23
Figure 10. Comparison 1 results for PowerEdge M620 ........................................................... 24
Figure 11. Comparison 2 results for UCS B250 M2 ................................................................ 24
Figure 12. Comparison 2 results for PowerEdge M710HD ....................................................... 25
Figure 13. Comparison 2 results for PowerEdge M620 ........................................................... 25
Power Efficiency Comparison of Dell and Cisco High Memory Capacity Blade Servers
5
Executive summary
In March 2012, Dell Inc. commissioned its Solutions Performance Analysis team to compare the performance
and power efficiency of four-blade solutions using three choices of blades: the Cisco UCS B250 M2, Dell
PowerEdge M710HD, and the recently announced PowerEdge M620. To represent configurations common for
applications such as virtualization with heavy system memory requirements, each blade in all three solutions
had 192 GB of system memory installed.
Each solution had four blade servers, one blade enclosure with one I/O module and the maximum installable
power supplies, and one 10Gb top-of-rack switch.
Key findings
Performance / watt
The higher performance and lower power draw of the four-blade Dell solutions compared to the UCS B250 M2
blade solution led to the PowerEdge M710HD solution’s 76% higher performance per watt score and the
PowerEdge M620 solution’s 108% higher performance per watt score.
Power at Idle
Even with all blades configured with the same amount of system memory, the four-blade PowerEdge M710HD
solution consumed 58% as much power at idle as the four-blade UCS B250 M2 solution with its extra DIMMs
and supporting circuitry. Similarly, the four-blade PowerEdge M620 blade solution drew just 55% as much
power at idle as the Cisco blade solution.
Power at 100% Load
Both of the four-blade PowerEdge solutions, again with the same amount of system memory installed per
blade, drew 64% to 67% as much power as the four-blade Cisco UCS B250 M2 blade solution with all blades
running at 100% load.
Performance
With the same processor models and the same memory capacity installed in each blade, the four-blade solution
based on PowerEdge M710HD blades provided up to 11% higher performance than the four-blade solution
based on UCS B250 M2 blades, and the four-blade solution based on PowerEdge M620 blades provided up to
25% higher performance than the UCS blade solution.
Rack density
When the 10U M1000e Modular Blade Enclosure is equipped with its maximum of sixteen M710HD or M620
servers, the solution can fit 1.6 servers per rack unit of space, 2.4 times as dense as the solution with Cisco
UCS B250 M2 blades.
Cost
In the configuration tested, the Cisco UCS B250 M2 blade solution costs $112,591.02[1], while the similarly
configured Dell PowerEdge M710HD solution costs 34% less at $73,820.00 [2], and the PowerEdge M620
solution costs 33% less at $75,372.00[3].
[1] Source: Quote from Cisco authorized reseller, February 22, 2012. Price is in U.S. dollars. [2] Source: Quote from www.dell.com, February 21, 2012. Price is in U.S. dollars. [3] Source: Quote from www.dell.com, February 21, 2012. Price is in U.S. dollars.
Power Efficiency Comparison of Dell and Cisco High Memory Capacity Blade Servers
6
Introduction
In order to compare the power efficiency of blade servers with high memory capacities installed, a Cisco blade
solution was assembled using four UCS B250 M2 blades (each with 192 GB of system memory installed) and
associated blade infrastructure. This solution was then measured for performance and performance / watt
using the industry-standard SPECpower_ssj2008 benchmark. For comparison purposes, a similar Dell blade
infrastructure was assembled and tested, first using four PowerEdge M710HD blades, and then using four
PowerEdge M620 blades. Each blade in the PowerEdge solutions also had 192 GB of system memory installed.
In all three cases, the entire blade infrastructure including the external network switch was included in the
power measurements.
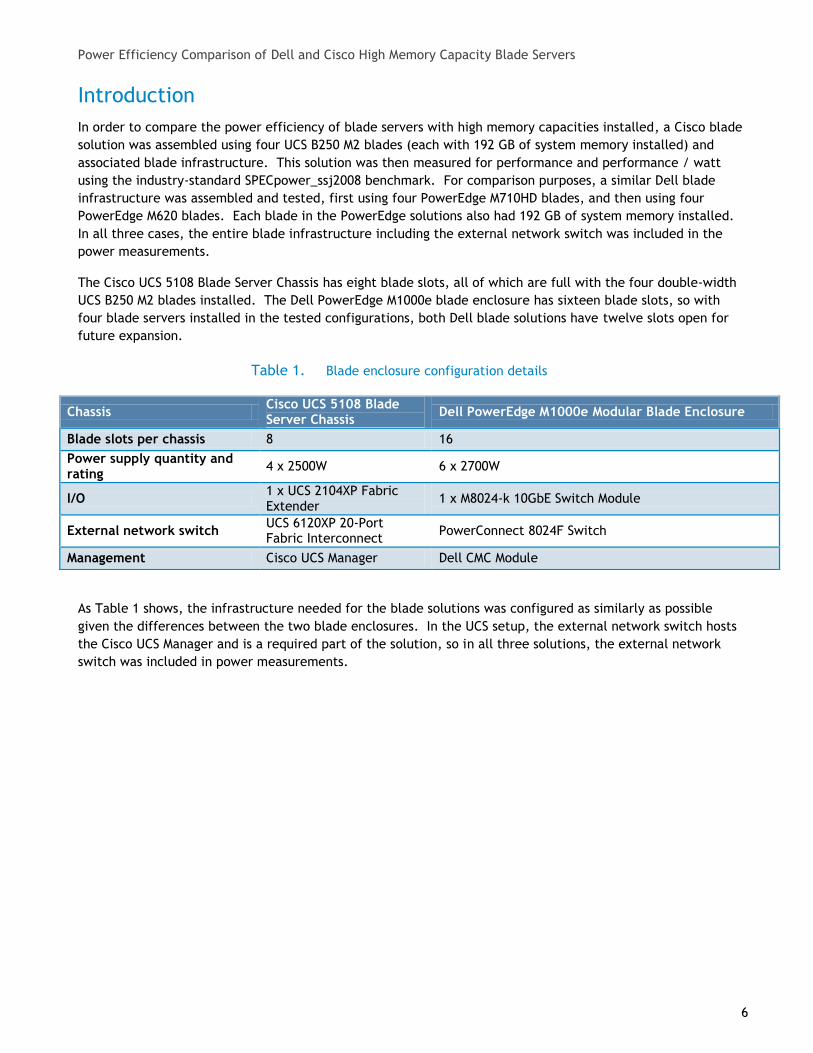
The Cisco UCS 5108 Blade Server Chassis has eight blade slots, all of which are full with the four double-width
UCS B250 M2 blades installed. The Dell PowerEdge M1000e blade enclosure has sixteen blade slots, so with
four blade servers installed in the tested configurations, both Dell blade solutions have twelve slots open for
future expansion.
Blade enclosure configuration details Table 1.
As Table 1 shows, the infrastructure needed for the blade solutions was configured as similarly as possible
given the differences between the two blade enclosures. In the UCS setup, the external network switch hosts
the Cisco UCS Manager and is a required part of the solution, so in all three solutions, the external network
switch was included in power measurements.
Chassis Cisco UCS 5108 Blade Server Chassis
Dell PowerEdge M1000e Modular Blade Enclosure
Blade slots per chassis 8 16
Power supply quantity and rating
4 x 2500W 6 x 2700W
I/O 1 x UCS 2104XP Fabric Extender
1 x M8024-k 10GbE Switch Module
External network switch UCS 6120XP 20-Port Fabric Interconnect
PowerConnect 8024F Switch
Management Cisco UCS Manager Dell CMC Module
Power Efficiency Comparison of Dell and Cisco High Memory Capacity Blade Servers
7
Blade server details Table 2.
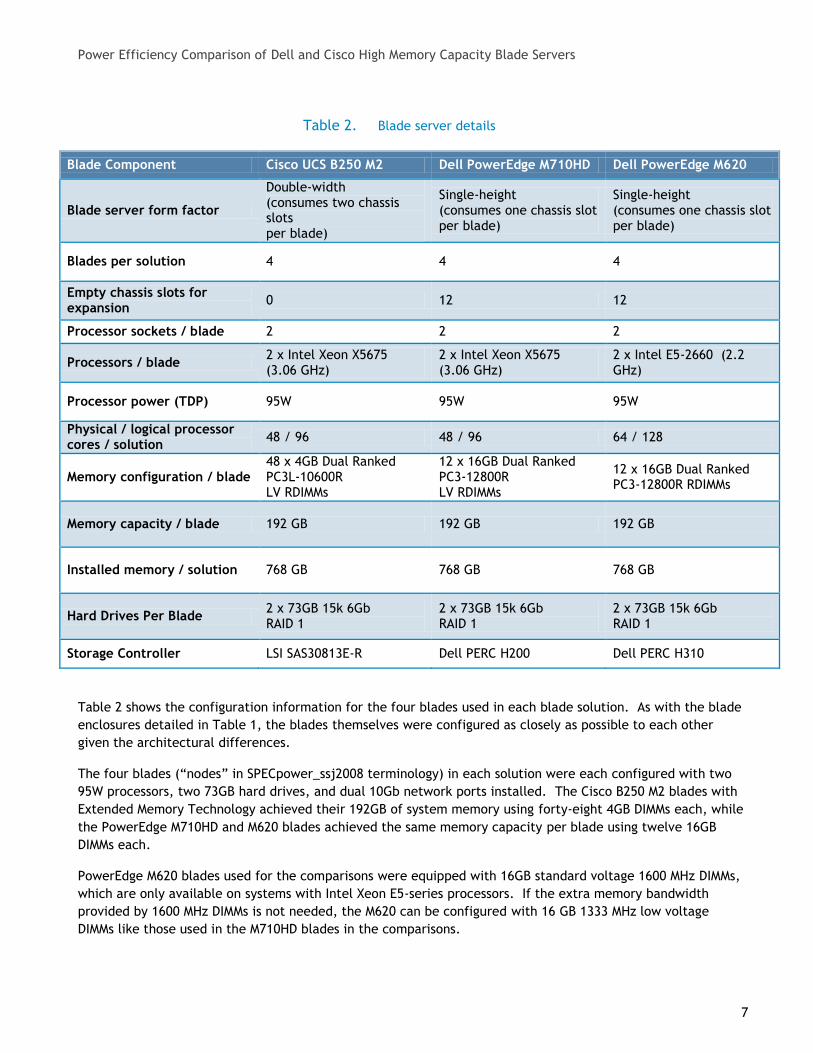
Table 2 shows the configuration information for the four blades used in each blade solution. As with the blade
enclosures detailed in Table 1, the blades themselves were configured as closely as possible to each other
given the architectural differences.
The four blades (“nodes” in SPECpower_ssj2008 terminology) in each solution were each configured with two
95W processors, two 73GB hard drives, and dual 10Gb network ports installed. The Cisco B250 M2 blades with
Extended Memory Technology achieved their 192GB of system memory using forty-eight 4GB DIMMs each, while
the PowerEdge M710HD and M620 blades achieved the same memory capacity per blade using twelve 16GB
DIMMs each.
PowerEdge M620 blades used for the comparisons were equipped with 16GB standard voltage 1600 MHz DIMMs,
which are only available on systems with Intel Xeon E5-series processors. If the extra memory bandwidth
provided by 1600 MHz DIMMs is not needed, the M620 can be configured with 16 GB 1333 MHz low voltage
DIMMs like those used in the M710HD blades in the comparisons.
Blade Component Cisco UCS B250 M2 Dell PowerEdge M710HD Dell PowerEdge M620
Blade server form factor
Double-width (consumes two chassis slots per blade)
Single-height (consumes one chassis slot per blade)
Single-height (consumes one chassis slot per blade)
Blades per solution 4 4 4
Empty chassis slots for expansion
0 12 12
Processor sockets / blade 2 2 2
Processors / blade 2 x Intel Xeon X5675 (3.06 GHz)
2 x Intel Xeon X5675 (3.06 GHz)
2 x Intel E5-2660 (2.2 GHz)
Processor power (TDP) 95W 95W 95W
Physical / logical processor cores / solution
48 / 96 48 / 96 64 / 128
Memory configuration / blade 48 x 4GB Dual Ranked PC3L-10600R LV RDIMMs
12 x 16GB Dual Ranked PC3-12800R LV RDIMMs
12 x 16GB Dual Ranked PC3-12800R RDIMMs
Memory capacity / blade 192 GB 192 GB 192 GB
Installed memory / solution 768 GB 768 GB 768 GB
Hard Drives Per Blade 2 x 73GB 15k 6Gb RAID 1
2 x 73GB 15k 6Gb RAID 1
2 x 73GB 15k 6Gb RAID 1
Storage Controller LSI SAS30813E-R Dell PERC H200 Dell PERC H310
Power Efficiency Comparison of Dell and Cisco High Memory Capacity Blade Servers
8
In Comparison 1, which is detailed below, the memory in each blade was configured to run at 1333 MHz to
make the configurations as comparable as possible. For Comparison 2, each blade was configured with its
memory set to 1067 MHz and the test was run again to examine what differences this setting made to relative
performance and power efficiency of the three blade solutions.
Methodology
SPECpower_ssj2008 is an industry standard benchmark created by the Standard Performance Evaluation
Corporation (SPEC) to measure a server’s power and performance across multiple utilization levels. It should
be noted that Dell has published many results using this benchmark4, while Cisco, at the time of writing, has
published none.5
Appendix A details the test methodology, Appendices B and C provide detailed configuration for the tests, and
Appendix D provides detailed report data that supports the results in this paper.
Comparison 1: Blade solution power efficiency with 1333 MHz
memory
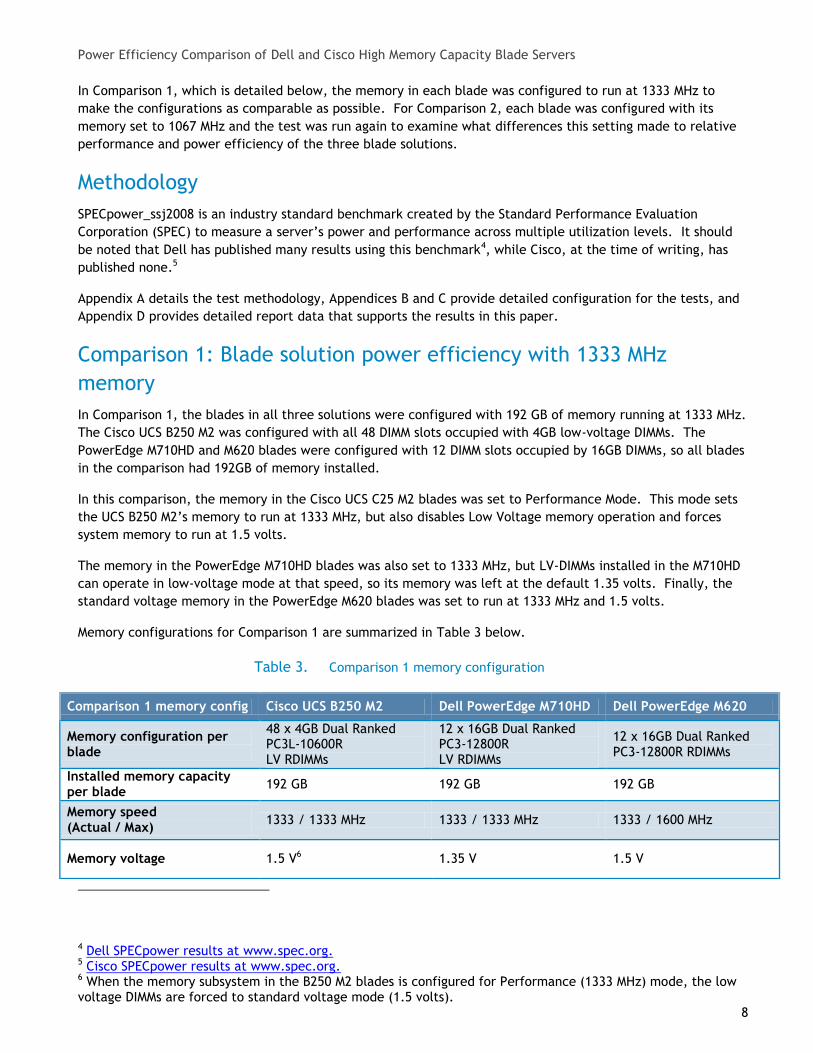
In Comparison 1, the blades in all three solutions were configured with 192 GB of memory running at 1333 MHz.
The Cisco UCS B250 M2 was configured with all 48 DIMM slots occupied with 4GB low-voltage DIMMs. The
PowerEdge M710HD and M620 blades were configured with 12 DIMM slots occupied by 16GB DIMMs, so all blades
in the comparison had 192GB of memory installed.
In this comparison, the memory in the Cisco UCS C25 M2 blades was set to Performance Mode. This mode sets
the UCS B250 M2’s memory to run at 1333 MHz, but also disables Low Voltage memory operation and forces
system memory to run at 1.5 volts.
The memory in the PowerEdge M710HD blades was also set to 1333 MHz, but LV-DIMMs installed in the M710HD
can operate in low-voltage mode at that speed, so its memory was left at the default 1.35 volts. Finally, the
standard voltage memory in the PowerEdge M620 blades was set to run at 1333 MHz and 1.5 volts.
Memory configurations for Comparison 1 are summarized in Table 3 below.
Comparison 1 memory configuration Table 3.
4 Dell SPECpower results at www.spec.org. 5 Cisco SPECpower results at www.spec.org. 6 When the memory subsystem in the B250 M2 blades is configured for Performance (1333 MHz) mode, the low voltage DIMMs are forced to standard voltage mode (1.5 volts).
Comparison 1 memory config Cisco UCS B250 M2 Dell PowerEdge M710HD Dell PowerEdge M620
Memory configuration per blade
48 x 4GB Dual Ranked PC3L-10600R LV RDIMMs
12 x 16GB Dual Ranked PC3-12800R LV RDIMMs
12 x 16GB Dual Ranked PC3-12800R RDIMMs
Installed memory capacity per blade
192 GB 192 GB 192 GB
Memory speed (Actual / Max)
1333 / 1333 MHz 1333 / 1333 MHz 1333 / 1600 MHz
Memory voltage 1.5 V6 1.35 V 1.5 V
Power Efficiency Comparison of Dell and Cisco High Memory Capacity Blade Servers
9
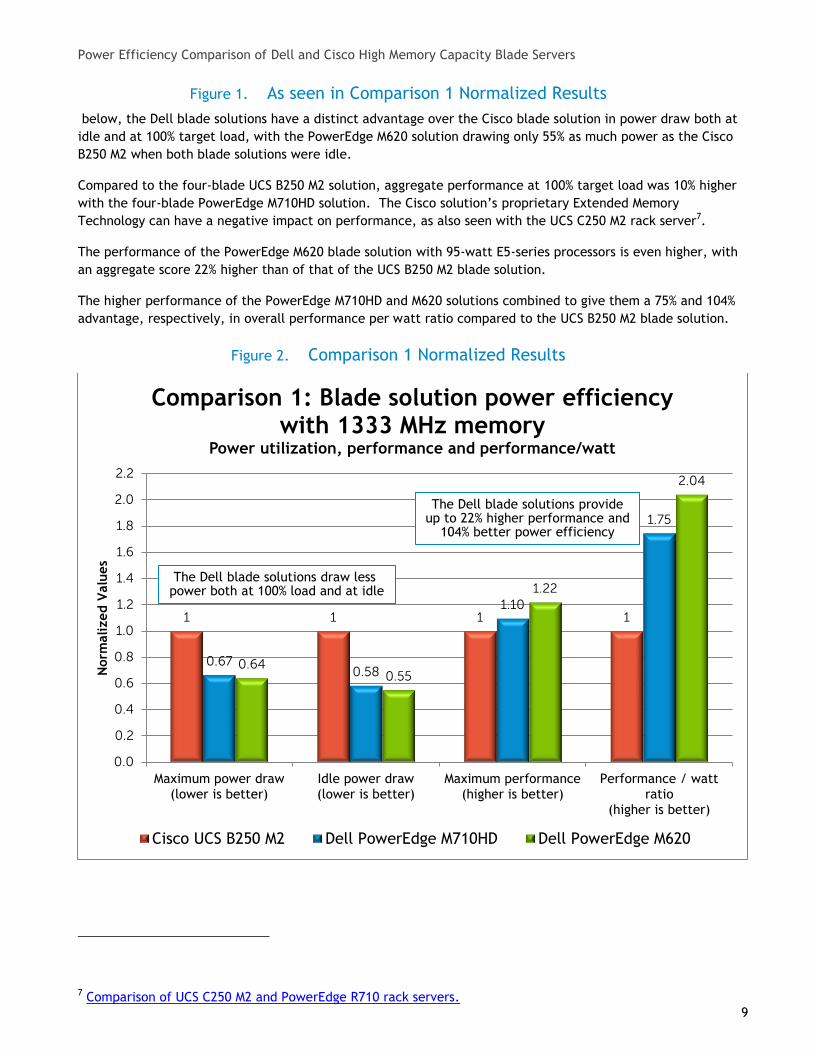
As seen in Comparison 1 Normalized Results Figure 1.
below, the Dell blade solutions have a distinct advantage over the Cisco blade solution in power draw both at
idle and at 100% target load, with the PowerEdge M620 solution drawing only 55% as much power as the Cisco
B250 M2 when both blade solutions were idle.
Compared to the four-blade UCS B250 M2 solution, aggregate performance at 100% target load was 10% higher
with the four-blade PowerEdge M710HD solution. The Cisco solution’s proprietary Extended Memory
Technology can have a negative impact on performance, as also seen with the UCS C250 M2 rack server7.
The performance of the PowerEdge M620 blade solution with 95-watt E5-series processors is even higher, with
an aggregate score 22% higher than of that of the UCS B250 M2 blade solution.
The higher performance of the PowerEdge M710HD and M620 solutions combined to give them a 75% and 104%
advantage, respectively, in overall performance per watt ratio compared to the UCS B250 M2 blade solution.
Comparison 1 Normalized Results Figure 2.
7 Comparison of UCS C250 M2 and PowerEdge R710 rack servers.
1 1 1 1
0.67 0.58
1.10
1.75
0.64 0.55
1.22
2.04
0.0
0.2
0.4
0.6
0.8
1.0
1.2
1.4
1.6
1.8
2.0
2.2
Maximum power draw(lower is better)
Idle power draw(lower is better)
Maximum performance(higher is better)
Performance / wattratio
(higher is better)
Norm
alized V
alu
es
Comparison 1: Blade solution power efficiency with 1333 MHz memory
Power utilization, performance and performance/watt
Cisco UCS B250 M2 Dell PowerEdge M710HD Dell PowerEdge M620
The Dell blade solutions draw less power both at 100% load and at idle
The Dell blade solutions provide up to 22% higher performance and
104% better power efficiency

Power Efficiency Comparison of Dell and Cisco High Memory Capacity Blade Servers
10
Figure 3 below shows the power utilization of each four-blade solution when running at 100% target load. The
Cisco solution draws 736 watts more than the M710HD solution, and 787 more watts than the M620 blade
solution, even though each of the three solutions have four similarly configured servers8.
The UCS B250 M2 blade solution had higher power draw than both PowerEdge solutions at the 100% load level,
at idle, and all measured points between.
Comparison 1 power utilization at 100% load Figure 3.
8 Required SPEC.org disclosure for Comparison 1:
The 4-node UCS B250 M2 solution scores (3,419,587 ssj_ops and 2,203 W) @ 100% target load for a SPECpower_ssj2008 overall ssj_ops / watt of 1,006.
The 4-node PowerEdge M710HD achieved (3,749,443 ssj_ops and 1,467 W) @ 100% target load for a SPECpower_ssj2008 overall ssj_ops / watt of 1,756.
The 4-node PowerEdge M620 achieved (4,175,133 ssj_ops and 1,416 W) @ 100% target load for a SPECpower_ssj2008 overall ssj_ops / watt of 2,054.
2,203
1,467 1,416
0
500
1000
1500
2000
2500
Avera
ge w
att
s at
100%
subm
easu
rem
ent
Comparison 1: Blade solution power draw with 1333 MHz memory
Power utilization at 100% workload (lower is better)
Cisco UCS B250 M2 Dell PowerEdge M710HD Dell PowerEdge M620
Power Efficiency Comparison of Dell and Cisco High Memory Capacity Blade Servers
11
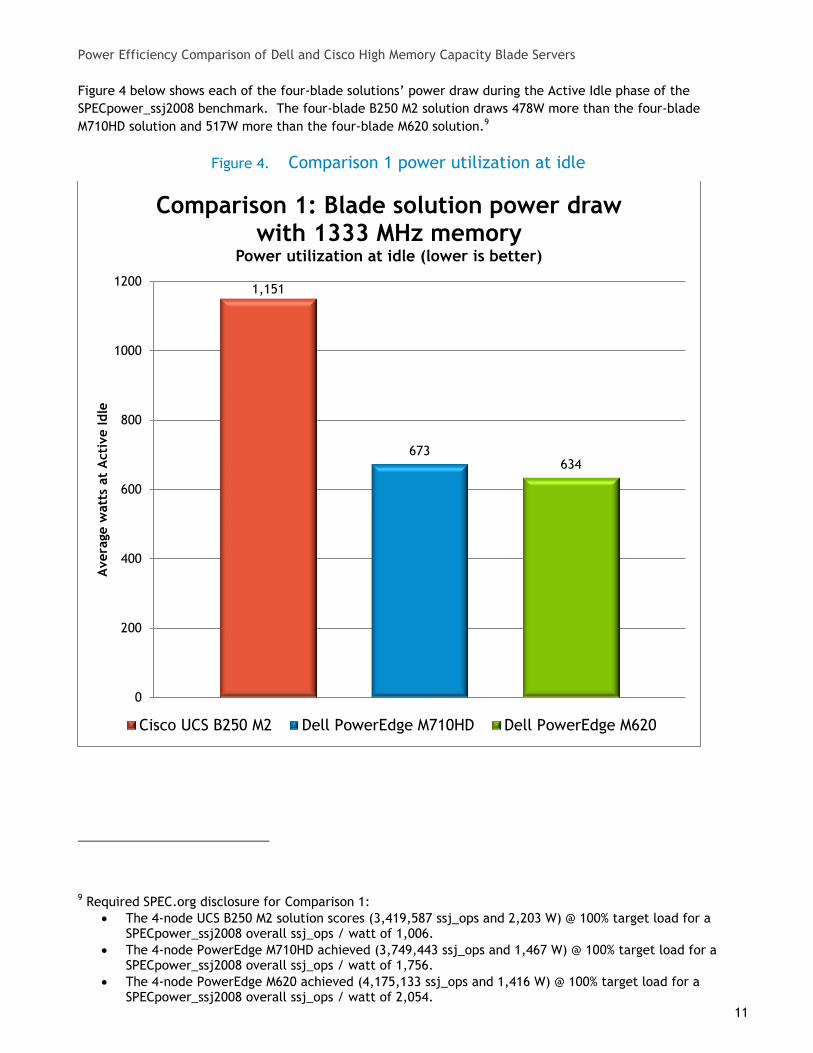
Figure 4 below shows each of the four-blade solutions’ power draw during the Active Idle phase of the
SPECpower_ssj2008 benchmark. The four-blade B250 M2 solution draws 478W more than the four-blade
M710HD solution and 517W more than the four-blade M620 solution.9
Comparison 1 power utilization at idle Figure 4.
9 Required SPEC.org disclosure for Comparison 1:
The 4-node UCS B250 M2 solution scores (3,419,587 ssj_ops and 2,203 W) @ 100% target load for a SPECpower_ssj2008 overall ssj_ops / watt of 1,006.
The 4-node PowerEdge M710HD achieved (3,749,443 ssj_ops and 1,467 W) @ 100% target load for a SPECpower_ssj2008 overall ssj_ops / watt of 1,756.
The 4-node PowerEdge M620 achieved (4,175,133 ssj_ops and 1,416 W) @ 100% target load for a SPECpower_ssj2008 overall ssj_ops / watt of 2,054.
1,151
673 634
0
200
400
600
800
1000
1200
Avera
ge w
att
s at
Acti
ve Idle
Comparison 1: Blade solution power draw with 1333 MHz memory
Power utilization at idle (lower is better)
Cisco UCS B250 M2 Dell PowerEdge M710HD Dell PowerEdge M620
Power Efficiency Comparison of Dell and Cisco High Memory Capacity Blade Servers
12
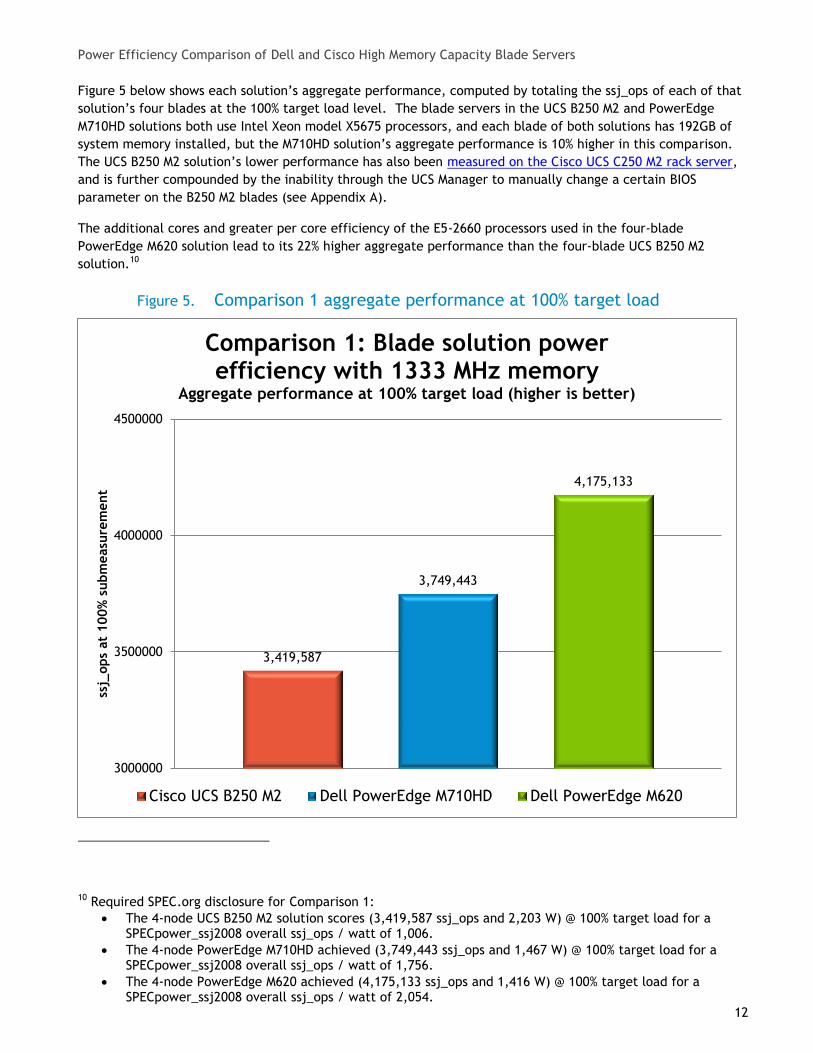
Figure 5 below shows each solution’s aggregate performance, computed by totaling the ssj_ops of each of that
solution’s four blades at the 100% target load level. The blade servers in the UCS B250 M2 and PowerEdge
M710HD solutions both use Intel Xeon model X5675 processors, and each blade of both solutions has 192GB of
system memory installed, but the M710HD solution’s aggregate performance is 10% higher in this comparison.
The UCS B250 M2 solution’s lower performance has also been measured on the Cisco UCS C250 M2 rack server,
and is further compounded by the inability through the UCS Manager to manually change a certain BIOS
parameter on the B250 M2 blades (see Appendix A).
The additional cores and greater per core efficiency of the E5-2660 processors used in the four-blade
PowerEdge M620 solution lead to its 22% higher aggregate performance than the four-blade UCS B250 M2
solution.10
Comparison 1 aggregate performance at 100% target load Figure 5.
10 Required SPEC.org disclosure for Comparison 1:
The 4-node UCS B250 M2 solution scores (3,419,587 ssj_ops and 2,203 W) @ 100% target load for a SPECpower_ssj2008 overall ssj_ops / watt of 1,006.
The 4-node PowerEdge M710HD achieved (3,749,443 ssj_ops and 1,467 W) @ 100% target load for a SPECpower_ssj2008 overall ssj_ops / watt of 1,756.
The 4-node PowerEdge M620 achieved (4,175,133 ssj_ops and 1,416 W) @ 100% target load for a SPECpower_ssj2008 overall ssj_ops / watt of 2,054.
3,419,587
3,749,443
4,175,133
3000000
3500000
4000000
4500000
ssj_
ops
at
100%
subm
easu
rem
ent
Comparison 1: Blade solution power efficiency with 1333 MHz memory
Aggregate performance at 100% target load (higher is better)
Cisco UCS B250 M2 Dell PowerEdge M710HD Dell PowerEdge M620
Power Efficiency Comparison of Dell and Cisco High Memory Capacity Blade Servers
13
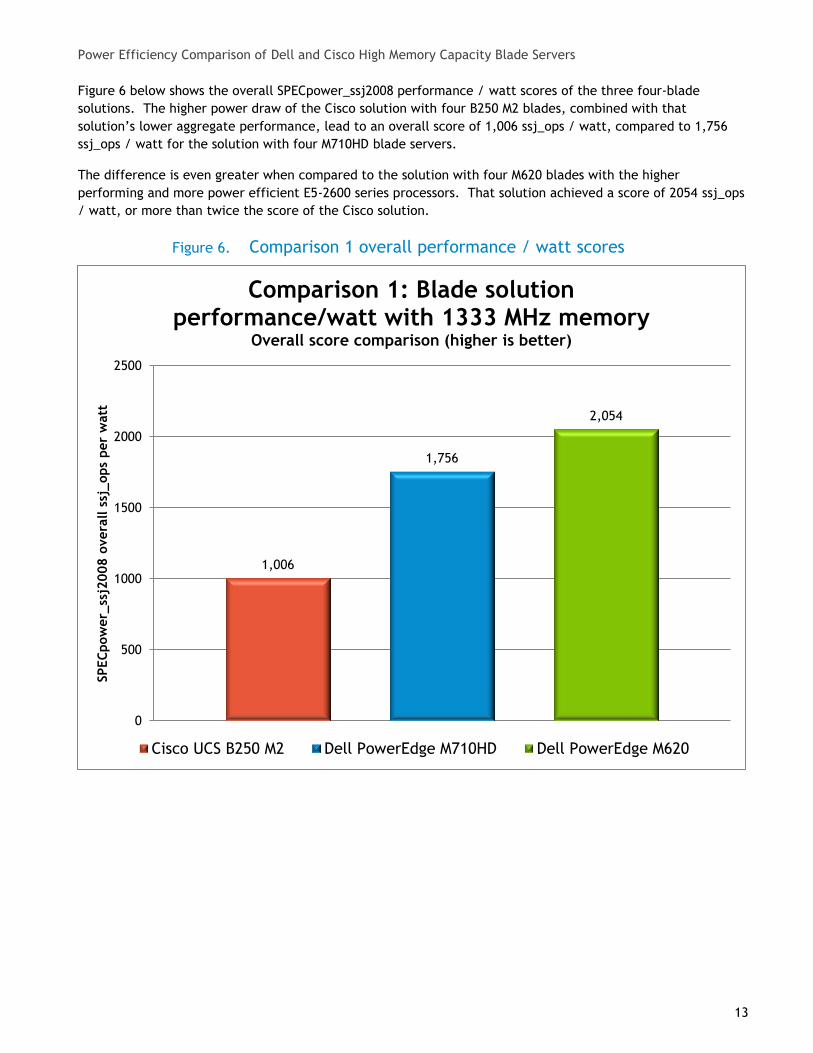
Figure 6 below shows the overall SPECpower_ssj2008 performance / watt scores of the three four-blade
solutions. The higher power draw of the Cisco solution with four B250 M2 blades, combined with that
solution’s lower aggregate performance, lead to an overall score of 1,006 ssj_ops / watt, compared to 1,756
ssj_ops / watt for the solution with four M710HD blade servers.
The difference is even greater when compared to the solution with four M620 blades with the higher
performing and more power efficient E5-2600 series processors. That solution achieved a score of 2054 ssj_ops
/ watt, or more than twice the score of the Cisco solution.
Comparison 1 overall performance / watt scores Figure 6.
1,006
1,756
2,054
0
500
1000
1500
2000
2500
SPEC
pow
er_
ssj2
008 o
vera
ll s
sj_ops
per
watt
Comparison 1: Blade solution performance/watt with 1333 MHz memory
Overall score comparison (higher is better)
Cisco UCS B250 M2 Dell PowerEdge M710HD Dell PowerEdge M620
Power Efficiency Comparison of Dell and Cisco High Memory Capacity Blade Servers
14
Comparison 1 Summary
Cisco’s Extended Memory Technology is claimed to provide improvements to performance and power
efficiency. As shown with results of the SPECpower_ssj2008 benchmark, however, the solution with four UCS
B250 M2 blade servers provides lower aggregate performance and significantly higher power draw at all tested
load levels compared to the solution with four similarly-configured PowerEdge M710HD blade servers. These
factors combine to give the four-blade M710HD solution a 75% lower performance / watt ratio than the Cisco
solution in this comparison.
The solution based on four of the recently introduced M620 blades achieves an even greater performance and
power efficiency advantage, giving it more than twice the power efficiency score of the Cisco solution.
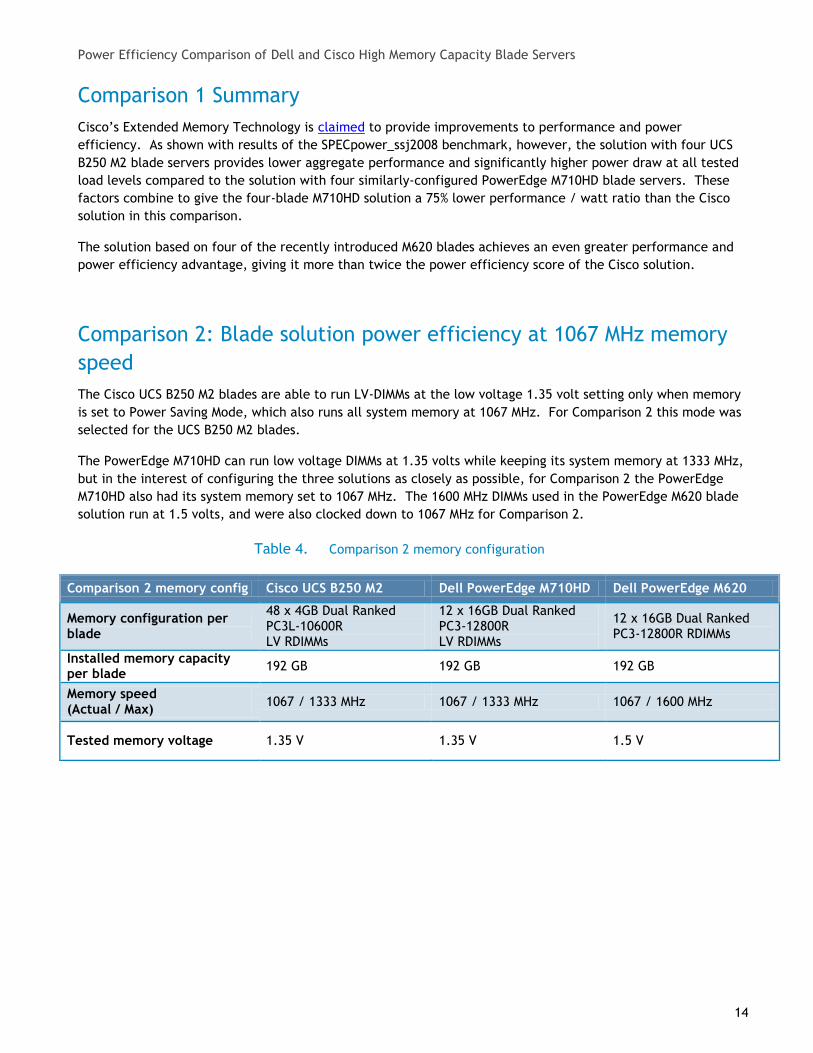
Comparison 2: Blade solution power efficiency at 1067 MHz memory
speed
The Cisco UCS B250 M2 blades are able to run LV-DIMMs at the low voltage 1.35 volt setting only when memory
is set to Power Saving Mode, which also runs all system memory at 1067 MHz. For Comparison 2 this mode was
selected for the UCS B250 M2 blades.
The PowerEdge M710HD can run low voltage DIMMs at 1.35 volts while keeping its system memory at 1333 MHz,
but in the interest of configuring the three solutions as closely as possible, for Comparison 2 the PowerEdge
M710HD also had its system memory set to 1067 MHz. The 1600 MHz DIMMs used in the PowerEdge M620 blade
solution run at 1.5 volts, and were also clocked down to 1067 MHz for Comparison 2.
Comparison 2 memory configuration Table 4.
Comparison 2 memory config Cisco UCS B250 M2 Dell PowerEdge M710HD Dell PowerEdge M620
Memory configuration per blade
48 x 4GB Dual Ranked PC3L-10600R LV RDIMMs
12 x 16GB Dual Ranked PC3-12800R LV RDIMMs
12 x 16GB Dual Ranked PC3-12800R RDIMMs
Installed memory capacity per blade
192 GB 192 GB 192 GB
Memory speed (Actual / Max)
1067 / 1333 MHz 1067 / 1333 MHz 1067 / 1600 MHz
Tested memory voltage 1.35 V 1.35 V 1.5 V
Power Efficiency Comparison of Dell and Cisco High Memory Capacity Blade Servers
15
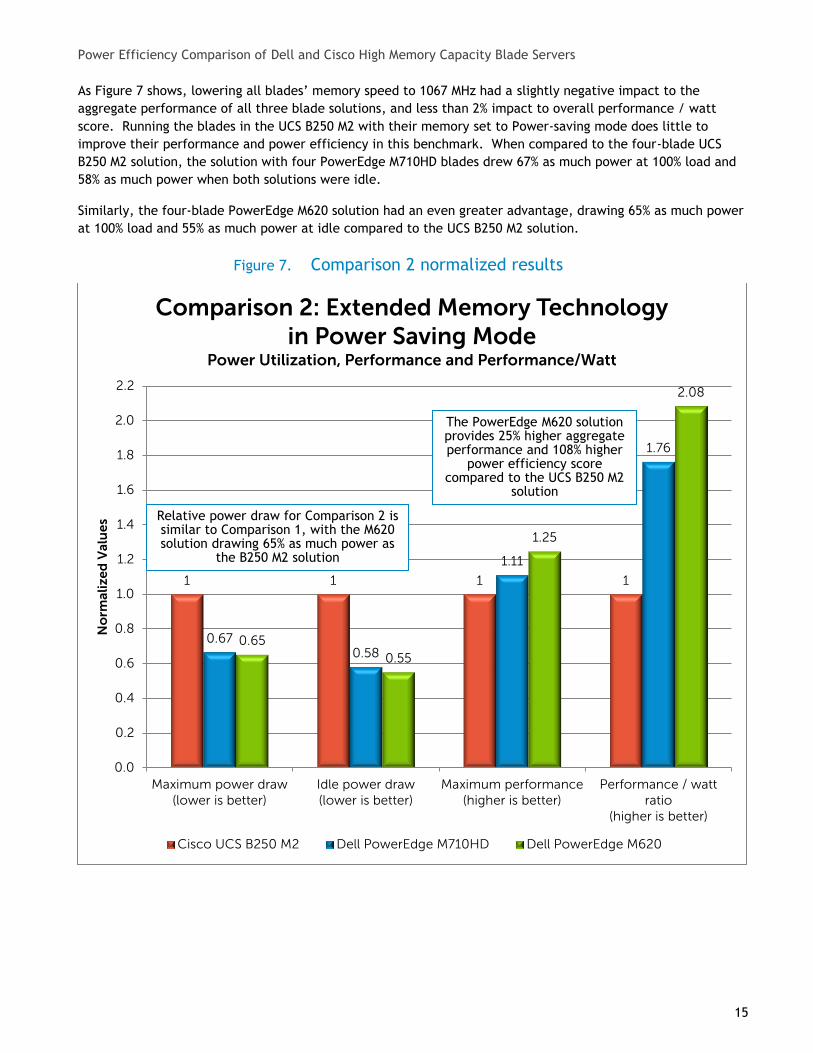
As Figure 7 shows, lowering all blades’ memory speed to 1067 MHz had a slightly negative impact to the
aggregate performance of all three blade solutions, and less than 2% impact to overall performance / watt
score. Running the blades in the UCS B250 M2 with their memory set to Power-saving mode does little to
improve their performance and power efficiency in this benchmark. When compared to the four-blade UCS
B250 M2 solution, the solution with four PowerEdge M710HD blades drew 67% as much power at 100% load and
58% as much power when both solutions were idle.
Similarly, the four-blade PowerEdge M620 solution had an even greater advantage, drawing 65% as much power
at 100% load and 55% as much power at idle compared to the UCS B250 M2 solution.
Comparison 2 normalized results Figure 7.
1 1 1 1
0.67 0.58
1.11
1.76
0.65
0.55
1.25
2.08
0.0
0.2
0.4
0.6
0.8
1.0
1.2
1.4
1.6
1.8
2.0
2.2
Maximum power draw(lower is better)
Idle power draw(lower is better)
Maximum performance(higher is better)
Performance / wattratio
(higher is better)
No
rma
liz
ed
Va
lue
s
Comparison 2: Extended Memory Technology in Power Saving Mode
Power Utilization, Performance and Performance/Watt
Cisco UCS B250 M2 Dell PowerEdge M710HD Dell PowerEdge M620
The PowerEdge M620 solution provides 25% higher aggregate performance and 108% higher
power efficiency score compared to the UCS B250 M2
solution
Relative power draw for Comparison 2 is similar to Comparison 1, with the M620 solution drawing 65% as much power as
the B250 M2 solution
Power Efficiency Comparison of Dell and Cisco High Memory Capacity Blade Servers
16
Comparison 2 Summary
Even with its system memory configured for Power Saving Mode, the four-blade UCS B250 M2 solution’s
combination of higher power draw and lower performance led to the four-blade PowerEdge M710HD solution
having a performance / watt ratio 76% higher, and the four-blade PowerEdge M620 solution having a
performance / watt ratio 108% higher.
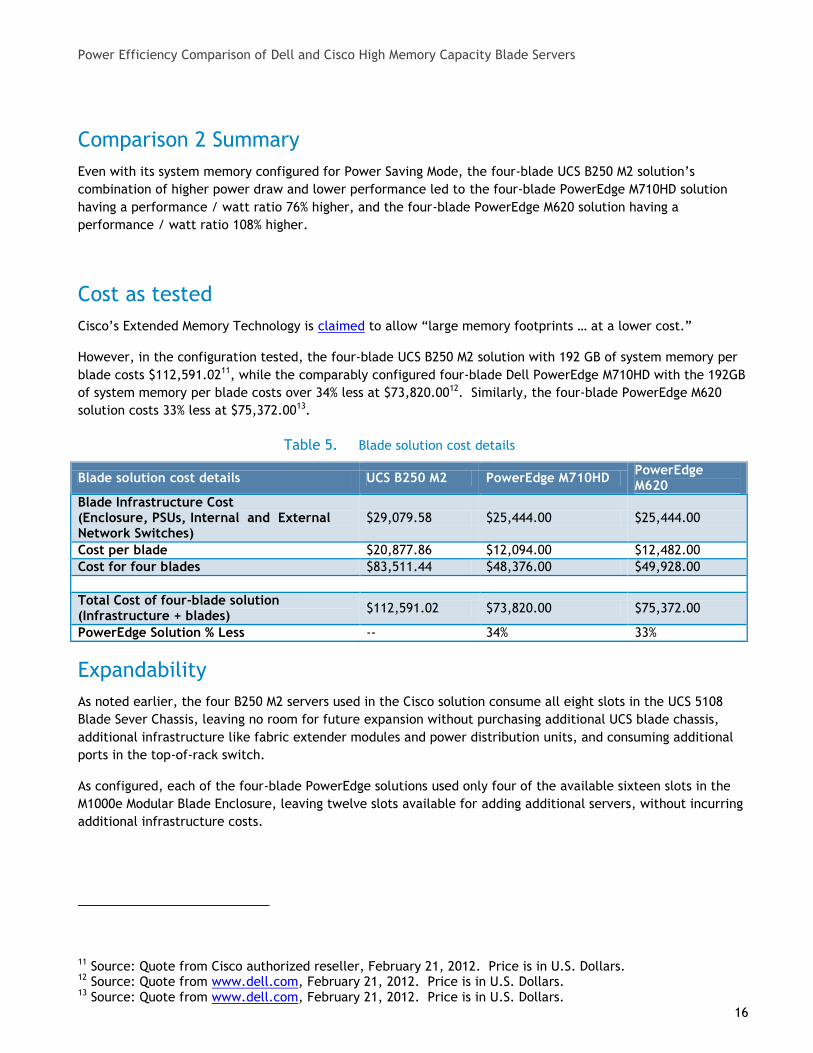
Cost as tested
Cisco’s Extended Memory Technology is claimed to allow “large memory footprints … at a lower cost.”
However, in the configuration tested, the four-blade UCS B250 M2 solution with 192 GB of system memory per
blade costs $112,591.0211, while the comparably configured four-blade Dell PowerEdge M710HD with the 192GB
of system memory per blade costs over 34% less at $73,820.0012. Similarly, the four-blade PowerEdge M620
solution costs 33% less at $75,372.0013.
Blade solution cost details Table 5.
Blade solution cost details UCS B250 M2 PowerEdge M710HD PowerEdge M620
Blade Infrastructure Cost (Enclosure, PSUs, Internal and External Network Switches)
$29,079.58 $25,444.00 $25,444.00
Cost per blade $20,877.86 $12,094.00 $12,482.00
Cost for four blades $83,511.44 $48,376.00 $49,928.00
Total Cost of four-blade solution (Infrastructure + blades)
$112,591.02 $73,820.00 $75,372.00
PowerEdge Solution % Less -- 34% 33%
Expandability
As noted earlier, the four B250 M2 servers used in the Cisco solution consume all eight slots in the UCS 5108
Blade Sever Chassis, leaving no room for future expansion without purchasing additional UCS blade chassis,
additional infrastructure like fabric extender modules and power distribution units, and consuming additional
ports in the top-of-rack switch.
As configured, each of the four-blade PowerEdge solutions used only four of the available sixteen slots in the
M1000e Modular Blade Enclosure, leaving twelve slots available for adding additional servers, without incurring
additional infrastructure costs.
11 Source: Quote from Cisco authorized reseller, February 21, 2012. Price is in U.S. Dollars. 12 Source: Quote from www.dell.com, February 21, 2012. Price is in U.S. Dollars. 13 Source: Quote from www.dell.com, February 21, 2012. Price is in U.S. Dollars.
Power Efficiency Comparison of Dell and Cisco High Memory Capacity Blade Servers
17
Rack density
The solution based on the UCS B250 M2 blade server can fit just four servers into the UCS 5108 Blade Server
Chassis, which consumes 6U (rack units) of rack space, or 0.67 servers per U. Thus, an admin could fit just 28
UCS B250 M2 servers in a standard 42U rack, assuming no space in that rack was consumed by infrastructure
like the UCS 6120XP Fabric Interconnect.
In contrast, when the 10U M1000e Modular Blade Enclosure is equipped with its maximum of sixteen M710HD or
M620 servers, the solution is 2.4 times as dense, able to fit 1.6 servers per U. With four M1000e enclosures
consuming 40U of rack space (leaving 2U for top-of-rack switches such as the PowerConnect 8024F used in this
test report), an admin could fit 64 M710HD or M620 servers in a single rack, with each server having the same
memory capacity, higher performance, and as much as 108% greater power efficiency compared to the UCS
B250 M2 blades.
Summary
The results of the testing contradict the claimed advantages of Cisco UCS Extended Memory Technology,
namely increased performance, reduced power, and lower cost. The four-blade Cisco UCS B250 M2 solution has
lower aggregate performance and worse power efficiency compared to the four-blade PowerEdge M710HD
solution with the same memory capacity per blade and the same model processors. In the tested
configurations, the PowerEdge M710HD blade solution costs 34% less than the comparably configured UCS B250
M2 solution.
The four-blade solution based on the recently introduced PowerEdge M620 blade is even better performing and
more power-efficient than both solutions, due in large part to Intel Xeon E5-2600 series processors. These
generational improvements lead to an even greater advantage for the M620 solution in aggregate performance
and power efficiency over the solution based on the UCS B250 M2. The PowerEdge M620 also has a 33% price
advantage over the comparable four-blade UCS solution, and both PowerEdge solutions are 2.4 times as rack-
dense as the UCS solution.
Power Efficiency Comparison of Dell and Cisco High Memory Capacity Blade Servers
18
Appendix A—Test methodology
SPECpower_ssj2008 standard
SPECpower_ssj2008 is an industry-standard benchmark created by the Standard Performance Evaluation
Corporation (SPEC) to measure a server’s power and performance across multiple utilization levels.
SPECpower_ssj2008 consists of a Server Side Java (SSJ) workload along with data collection and control
services. SPECpower_ssj2008 results portray the server’s performance in ssj_ops (server side Java operations
per second) divided by the power used in watts (ssj_ops/watt). SPEC created SPEcpower_ssj2008 for those
who want to accurately measure the power consumption of their server in relation to the performance that the
server is capable of achieving with ssj2008 workload.
SPECpower_ssj2008 consists of three main software components:
Server Side Java (SSJ) Workload—Java database that stresses the processors, caches and memory of the system, as well as software elements such as OS elements and the Java implementation chosen
to run the benchmark.
Power and Temperature Daemon (PTDaemon)—Program that controls and reports the power analyzer and temperature sensor data.
Control and Collect System (CCS)—Java program that coordinates the collection of all the data. For more information on how SPECpower_ssj008 works, see http://www.spec.org/power_ssj2008/. All results discussed in this test report are from “compliant runs” in SPEC terminology, which means that
although they have not been submitted to SPEC for review, Dell is allowed to disclose them for the purpose of
this study. All configuration details required to reproduce these results are listed in Appendices A, B, and C
and the first page of the result files from the runs compared are included in Appendix D. Full result files from
the runs compared are attached to this document for reference.
All servers were configured by installing a fresh copy of Microsoft® Windows Server® 2008 Enterprise R2 (Service
Pack 1) with the operating system installed on a two-hard drive RAID 1 choosing the “full installation” option
for each.
The latest driver and firmware update packages available to both servers were installed at the beginning of
this study. Refer to Appendix B for details.
The Dell Solutions Performance Analysis Team ran SPECpower_ssj2008 three times per configuration and chose
the run with the highest overall ssj_ops/watt for each configuration to compare for this study.
BIOS settings
BIOS settings differed between the two manufacturers, so we tuned for best-known SPECpower_ssj2008
performance results.
For the Dell PowerEdge M710HD blade servers:
Turbo Mode Disabled in BIOS.
Adjacent Cache Line Prefetch Disabled in BIOS.
Hardware Prefetcher Disabled in BIOS.
DCU Streamer Prefetcher Disabled in BIOS.
Data Reuse Disabled in BIOS.
Power Efficiency Comparison of Dell and Cisco High Memory Capacity Blade Servers
19
DAPC Mode Enabled.
For the Dell PowerEdge M620 blade servers:
Turbo Boost Disabled in BIOS
Adjacent Cache Line Prefetch Disabled in BIOS.
Hardware Prefetcher Disabled in BIOS.
DCU Streamer Prefetcher Disabled in BIOS.
DCU IP Prefetcher Disabled in BIOS.
DAPC Mode Enabled.
Memory Patrol Scrub Disabled in BIOS.
For the Cisco UCS B250 M2 blade servers:
When managed through UCS Manager, the Cisco UCS B250 M2 blades do not allow directly changing values for
BIOS settings through the blades’ F2 setup; rather, the settings are controlled through profiles in the UCS
Manager interface.
Turbo Boost Disabled in profile.
Processor C3 Report set to enabled in profile.
Processor C6 Report set to enabled in profile.
CPU Performance set to the “Enterprise” template, which sets the following values on the blade BIOS:
o Data Reuse Disabled
o DCU Streamer Prefetcher Disabled
o DCU IP Prefetcher Enabled
o Hardware Prefetcher Disabled
o Adjacent Line Prefetch Disabled
Most published results for SPECpower_ssj2008 from Dell and other vendors set the value of “DCU IP Prefetcher”
to “Disabled” when using Intel Xeon 5600-series processors. The lack of ability to set this value to Disabled
through UCS Manager likely hurt the aggregate performance scores of the UCS B250 M2 blades in this test
report.
For Comparison 1, the memory speed of all systems was set to 1333 MHz; for Comparison 2, the memory speed
of all systems was set to 1067 MHz.
OS tuning
To improve Java performance, large pages were enabled by entering Control Panel->Administrative Tools-
>Local Security Policy->Local Policies->User Rights Assignment->Lock Pages in Memory. The option was
changed to add Administrator.
Operating System Power Management mode for all solutions was changed to Power saver edited to turn off the
Hard Drive after 1 minute. On the Cisco UCS B250 M2 blades, which lack an integrated active power controller,
the setting “Minimum processor state” was changed to 0% from the default 5%, and the setting for “Maximum
processor state” was left at its default 100%. The PowerEdge M620 and M710HD blades did not need these
settings due to the integrated Dell Active Power Controller on those systems.
Power Efficiency Comparison of Dell and Cisco High Memory Capacity Blade Servers
20
We configured each server with a separate IP address on the same subnet as our SPECpower_ssj2008 controller
system where the Director, CCS, and PTDaemon components were located, and connected all servers to the
external network switch through NIC 1 for their respective runs.
SPECpower_ssj2008 configuration
IBM J9 Java Virtual Machine (JVM)14 was used for all solutions.
The following JVM options were used on both servers, as they are the best-known JVM tunings for
SPECpower_ssj2008 for the IBM J9 JVM when running with larger memory configurations:
-Xms1875m -Xmx1875m -Xmn1400m -Xaggressive -Xcompressedrefs -Xgcpolicy:gencon -
XlockReservation -Xnloa -XtlhPrefetch -Xlp
On each UCS B250 M2 and PowerEdge M710HD, with 24 logical processors per server, the following bindings
were used to ensure that each of the six JVMs ran on four logical processors:
start /affinity [F,F0,F00,F000,F0000,F0000]
On each PowerEdge M620, with 32 logical processors per server, the following bindings were used to ensure
that each of the eight JVMs ran on four logical processors:
start /affinity [F,F0,F00,F000,F0000,F0000,F00000,F000000]
Power meter configuration
We used the Yokogawa WT210 Digital Power Meter for the actual power measurement of the servers, as this is
the most commonly used analyzer for SPECpower_ssj2008 publications at the time that this study was
undertaken.
14 JVM build 2.4, J2RE 1.6.0 IBM J9 2.4 Windows Server® 2008 amd64-64 jvmwa64 60sr5-20090519_35743
Power Efficiency Comparison of Dell and Cisco High Memory Capacity Blade Servers
21
Appendix B—Server hardware configuration details
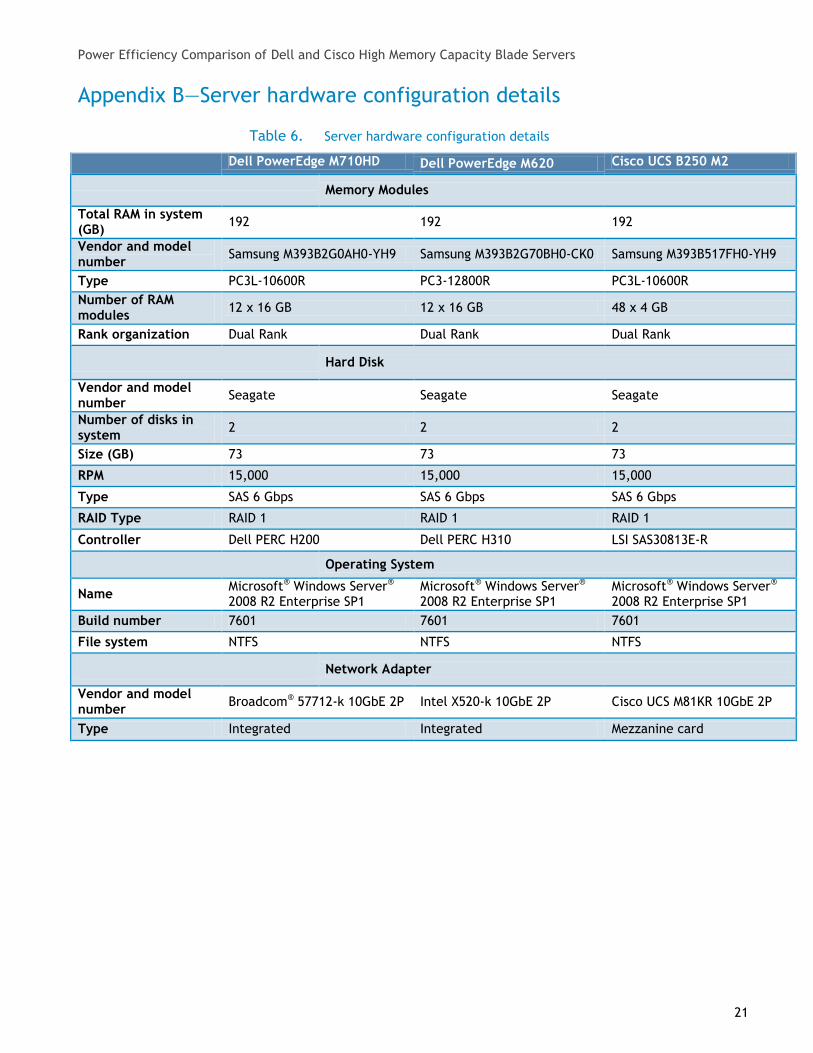
Server hardware configuration details Table 6.
Dell PowerEdge M710HD Dell PowerEdge M620 Cisco UCS B250 M2
Memory Modules
Total RAM in system (GB)
192 192 192
Vendor and model number
Samsung M393B2G0AH0-YH9 Samsung M393B2G70BH0-CK0 Samsung M393B517FH0-YH9
Type PC3L-10600R PC3-12800R PC3L-10600R
Number of RAM modules
12 x 16 GB 12 x 16 GB 48 x 4 GB
Rank organization Dual Rank Dual Rank Dual Rank
Hard Disk
Vendor and model number
Seagate Seagate Seagate
Number of disks in system
2 2 2
Size (GB) 73 73 73
RPM 15,000 15,000 15,000
Type SAS 6 Gbps SAS 6 Gbps SAS 6 Gbps
RAID Type RAID 1 RAID 1 RAID 1
Controller Dell PERC H200 Dell PERC H310 LSI SAS30813E-R
Operating System
Name Microsoft® Windows Server® 2008 R2 Enterprise SP1
Microsoft® Windows Server® 2008 R2 Enterprise SP1
Microsoft® Windows Server® 2008 R2 Enterprise SP1
Build number 7601 7601 7601
File system NTFS NTFS NTFS
Network Adapter
Vendor and model number
Broadcom® 57712-k 10GbE 2P Intel X520-k 10GbE 2P Cisco UCS M81KR 10GbE 2P
Type Integrated Integrated Mezzanine card
Power Efficiency Comparison of Dell and Cisco High Memory Capacity Blade Servers
22
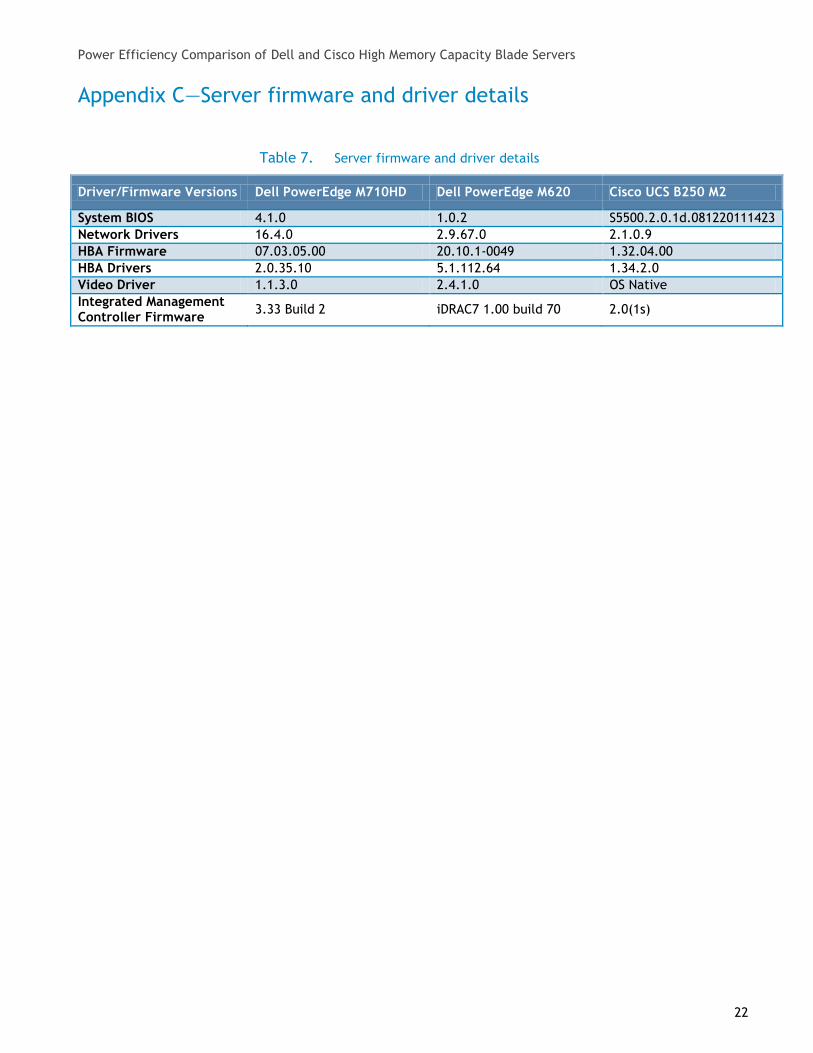
Appendix C—Server firmware and driver details
Server firmware and driver details Table 7.
Driver/Firmware Versions Dell PowerEdge M710HD Dell PowerEdge M620 Cisco UCS B250 M2
System BIOS 4.1.0 1.0.2 S5500.2.0.1d.081220111423
Network Drivers 16.4.0 2.9.67.0 2.1.0.9
HBA Firmware 07.03.05.00 20.10.1-0049 1.32.04.00
HBA Drivers 2.0.35.10 5.1.112.64 1.34.2.0
Video Driver 1.1.3.0 2.4.1.0 OS Native
Integrated Management Controller Firmware
3.33 Build 2 iDRAC7 1.00 build 70 2.0(1s)
Power Efficiency Comparison of Dell and Cisco High Memory Capacity Blade Servers
23
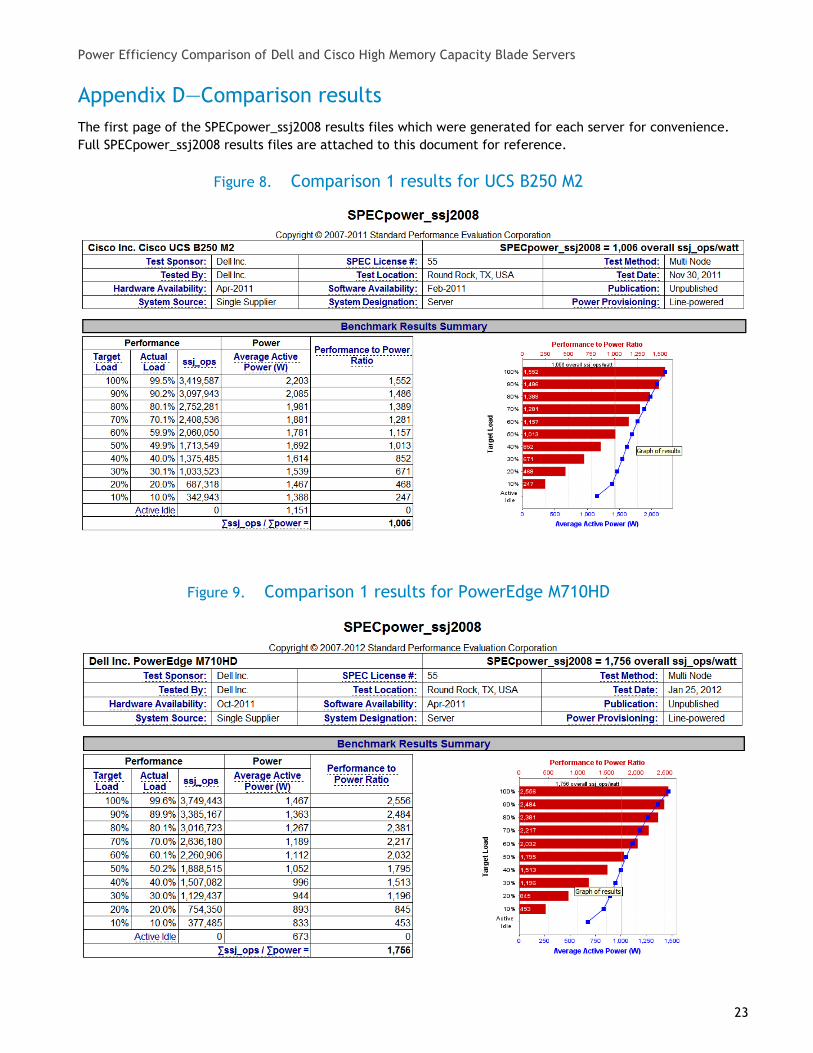
Appendix D—Comparison results
The first page of the SPECpower_ssj2008 results files which were generated for each server for convenience.
Full SPECpower_ssj2008 results files are attached to this document for reference.
Comparison 1 results for UCS B250 M2 Figure 8.
Comparison 1 results for PowerEdge M710HD Figure 9.
Power Efficiency Comparison of Dell and Cisco High Memory Capacity Blade Servers
24
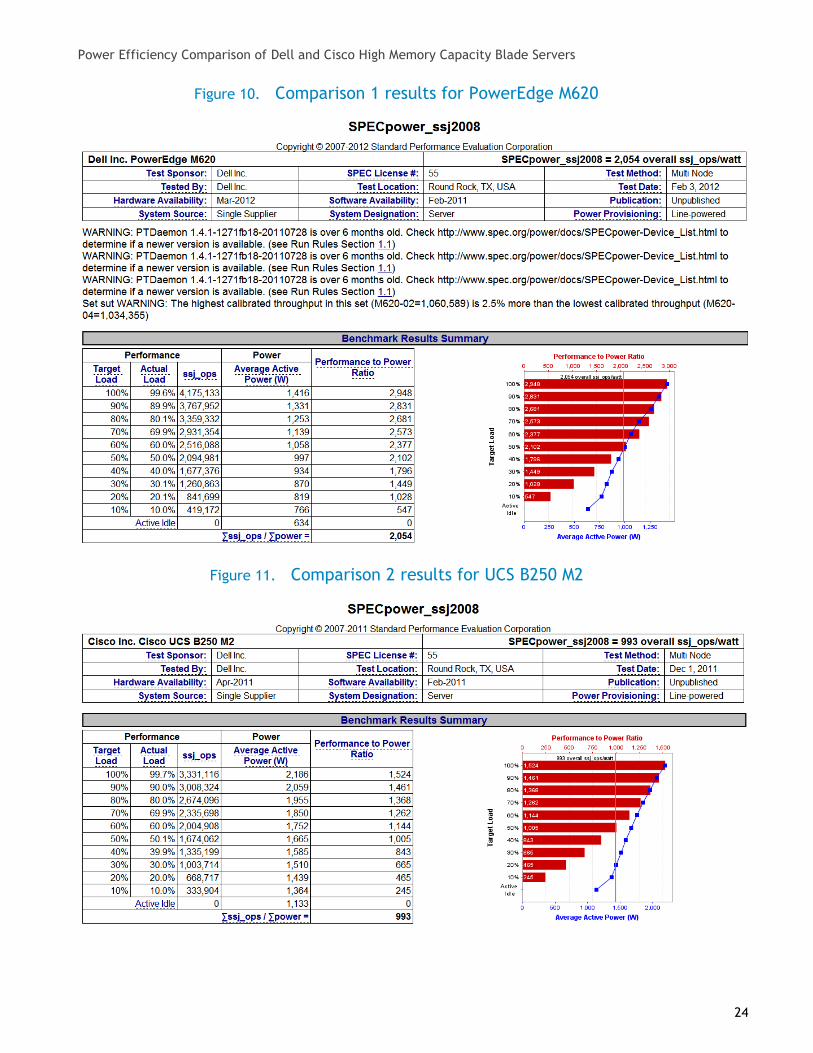
Comparison 1 results for PowerEdge M620 Figure 10.
Comparison 2 results for UCS B250 M2 Figure 11.
Power Efficiency Comparison of Dell and Cisco High Memory Capacity Blade Servers
25
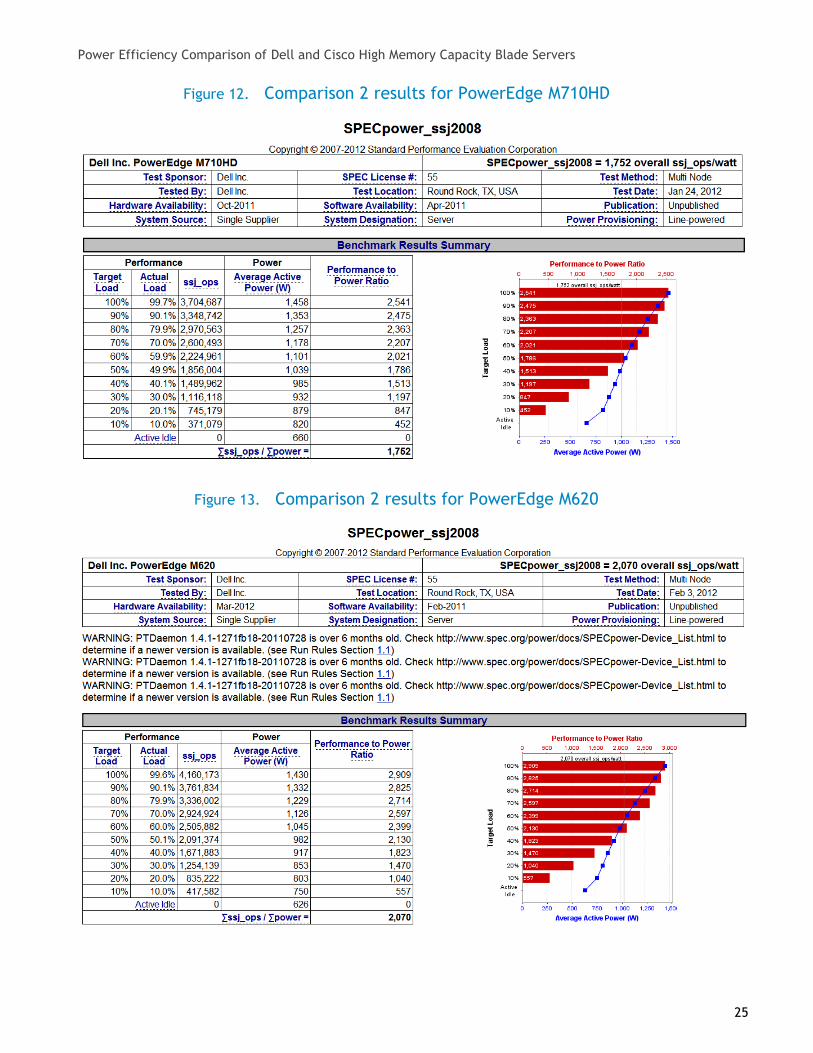
Comparison 2 results for PowerEdge M710HD Figure 12.
Comparison 2 results for PowerEdge M620 Figure 13.

SPECpower_ssj2008
file:///J|/Cisco/temp/Cisco-B250-M2-SPECPower-Results/192GB-1067-enterprise-mode-java-prefetch-993/ssj.0002-993/ssj.0002-main.html[2/20/2012 5:45:52 PM]
Performance PowerPerformance
to PowerRatio
TargetLoad
ActualLoad ssj_ops
AverageActivePower
(W)100% 99.7% 3,331,116 2,186 1,52490% 90.0% 3,008,324 2,059 1,46180% 80.0% 2,674,096 1,955 1,36870% 69.9% 2,335,698 1,850 1,26260% 60.0% 2,004,908 1,752 1,14450% 50.1% 1,674,062 1,665 1,00540% 39.9% 1,335,199 1,585 84330% 30.0% 1,003,714 1,510 66520% 20.0% 668,717 1,439 46510% 10.0% 333,904 1,364 245
Active Idle 0 1,133 0?ssj_ops / ?power = 993
Shared HardwareEnclosure: Cisco UCS 5108
Form Factor: 6U
SPECpower_ssj2008Copyright © 2007-2012 Standard Performance Evaluation Corporation
Cisco Inc. Cisco UCS B250 M2 SPECpower_ssj2008 = 993 overallssj_ops/watt
Test Sponsor: Dell Inc. SPEC License#: 55 Test Method: Multi Node
Tested By: Dell Inc. Test Location: Round Rock,TX, USA Test Date: Dec 1, 2011
HardwareAvailability: Apr-2011 Software
Availability: Feb-2011 Publication: Unpublished
SystemSource:
SingleSupplier
SystemDesignation: Server Power
Provisioning:Line-powered
Benchmark Results Summary
Aggregate SUT Data# of
Nodes# of
Chips# of
Cores# of
ThreadsTotal RAM
(GB)# of OSImages
# of JVMInstances
4 8 48 96 768 4 24
System Under Test
Shared Hardware

SPECpower_ssj2008
file:///J|/Cisco/temp/Cisco-B250-M2-SPECPower-Results/192GB-1067-enterprise-mode-java-prefetch-993/ssj.0002-993/ssj.0002-main.html[2/20/2012 5:45:52 PM]
Power SupplyQuantity and
Rating (W):4 x 2500
Power SupplyDetails:
Delta Model AHF-2DC-2500W
Network Switch: Cisco UCS 6120XP 20 Port1RU Fabric Interconnect
Network SwitchDetails: N10-S6100
KVM Switch: NoneKVM Switch
Details: N/A
Other Hardware: Cisco UCS 2104XP 4 PortI/O Module
Comment:Cisco UCS 6120XP FabricInterconnect measured forpower
Hardware per NodeHardware Vendor: Cisco Inc.
Model: Cisco UCS B250 M2Form Factor: Blade
CPU Name: Intel Xeon X5675(3.06 GHz)
CPU Characteristics: 6 Core, 3.06 GHz, 12MB L3 Cache
CPU Frequency(MHz): 3066
CPU(s) Enabled: 12 cores, 2 chips, 6cores/chip
Hardware Threads: 24 (2 / core)CPU(s) Orderable: 1,2 chips
Primary Cache: 32 KB I + 32 KB D onchip per core
Secondary Cache: 256 KB I+D on chipper core
Tertiary Cache: 12 MB I+D on chip perchip
Other Cache: NoneMemory Amount
(GB): 192
Software per NodePower
Management:Power saver Mode in OS (SeeNotes)
OperatingSystem (OS):
Windows 2008 ServerEnterprise x64 Edition
OS Version: R2 SP1Filesystem: NTFS
JVM Vendor: IBM Corporation
JVM Version:
IBM J9 VM (build 2.4, J2RE1.6.0 IBM J9 2.4 WindowsServer 2008 amd64-64jvmwa64 60sr5-20090519_35743 (JIT enabled,AOT enabled)
JVMCommand-
line Options:
-Xaggressive -Xcompressedrefs-Xgcpolicy:gencon -Xmn1400m-Xms1875m -Xmx1875m -XlockReservation -Xnoloa -Xlp
JVM Affinity: start /affinity [F, F0, F00, F000,F0000, F00000]
JVMInstances: 6
JVM InitialHeap (MB): 1400
Set: 'sut'Set Identifier: sut
Set Description: B250 M2# of Identical Nodes: 4
Comment: None

SPECpower_ssj2008
file:///J|/Cisco/temp/Cisco-B250-M2-SPECPower-Results/192GB-1067-enterprise-mode-java-prefetch-993/ssj.0002-993/ssj.0002-main.html[2/20/2012 5:45:52 PM]
# and size of DIMM: 48 x 4096 MB
Memory Details:4GB 2Rx4 PC3L-10600R ECC RDIMM,All slots populated
Power SupplyQuantity and Rating
(W):None
Power SupplyDetails: Shared
Disk Drive: 2 x 73 GB 2.5" SAS15000 RPM
Disk Controller:LSI SAS 1064E PCI-Express Fusion-MPTSAS
# and type ofNetwork Interface
Cards (NICs)Installed:
1 x Cisco UCSM81KR
NICs Enabled inFirmware / OS /
Connected:1/1/1
Network Speed(Mbit): 10000
Keyboard: NoneMouse: None
Monitor: NoneOptical Drives: No
Other Hardware: None
JVMMaximum
Heap (MB):1875
JVM AddressBits: 64
BootFirmware
Version:S5500.2.0.1d.0.081220111423
ManagementFirmware
Version:2.0(1s)
WorkloadVersion: SSJ 1.2.9
DirectorLocation: Controller
OtherSoftware:
IBM WebSphere ApplicationServer V7.0 for Windows onx86-64bit
Boot Firmware SettingsTurbo Boost disabled in UCS Manager.Enhanced Intel Speedstep enabled in UCS Manager.Processor C State enabled in UCS Manager.Processor C1E enabled in UCS Manager.Processor C3 enabled in UCS Manager.Processor C6 enabled in UCS Manager.LV DDR Mode set to "power-saving-mode" in UCS Manager.USB System Idle Power Optimizing Setting set to "lower idle power" in UCS Manager.CPU Performance set to "Enterprise" in UCS Manager.
Management Firmware Settingsnone
System Under Test Notes
Each JVM instance was affinitized to four cores.Using the local security settings console, "lock pages in memory" was enabled for the user running the

SPECpower_ssj2008
file:///J|/Cisco/temp/Cisco-B250-M2-SPECPower-Results/192GB-1067-enterprise-mode-java-prefetch-993/ssj.0002-993/ssj.0002-main.html[2/20/2012 5:45:52 PM]
HardwareHardware Vendor: Dell Inc.
Model: R410CPU Description: Xeon 5620
Memory amount (GB): 4
SoftwareOperating
System (OS):Microsoft Windows Server2008 Enterprise SP2
JVM Vendor: Oracle Corporation
JVM Version: Jrockit(R) 1.6.0_02 buildR26.4.0-63 (32-bit)
CCS Version: 1.2.5
Power Analyzer pwr1Hardware
Vendor:Yokogawa ElectricInternational Pte. Ltd.
Model: WT210Serial Number: 91KA21978
Connectivity: RS-232Input
Connection: Default
MetrologyInstitute: NIST
Accredited by: Simco ElectronicsCalibration
Label: 5412137
Date ofCalibration: 20-Oct-2011
PTDaemon HostSystem: same as CCS
PTDaemon HostOS: same as CCS
PTDaemonVersion: 1.4.1-1271fb18-20110728
SetupDescription:
Connected to SUT powersupply 1, 2, and 3.
Temperature Sensor temp1Hardware
Vendor: Digi International Inc.
Model: Watchport/H
Driver Version: Watchport Virtual Port5.30.2.0
Connectivity: USBPTDaemon Host
System: same as CCS
PTDaemon HostOS: same as CCS
SetupDescription:
50 mm in front of SUT mainairflow intake
benchmark.Run was started remotely via psexec scriptWindows Power mode set to "Power Saver".Windows Power Saver Settings:
Turn off Hard Disk after 1 MinuteTurn off Display after 1 Minute
Controller System
Measurement Devices
NotesNone
Aggregate Electrical and Environmental Data

SPECpower_ssj2008
file:///J|/Cisco/temp/Cisco-B250-M2-SPECPower-Results/192GB-1067-enterprise-mode-java-prefetch-993/ssj.0002-993/ssj.0002-main.html[2/20/2012 5:45:52 PM]
Target Load Average Active Power (W) Minimum Ambient Temperature (°C)100% 2,186 22.690% 2,059 22.780% 1,955 22.870% 1,850 22.660% 1,752 22.650% 1,665 22.440% 1,585 22.430% 1,510 22.520% 1,439 22.410% 1,364 22.5
Active Idle 1,133 22.4Line Standard Minimum Temperature (°C) Elevation (m)
208V / 60 Hz / 1 phase / 1 wire 22.4 255
Target Load Actual Load ssj_opsTarget Actual
Calibration 1 3,335,341Calibration 2 3,347,885Calibration 3 3,337,064
ssj_ops@calibrated=3,342,474100% 99.7% 3,342,474 3,331,11690% 90.0% 3,008,227 3,008,32480% 80.0% 2,673,980 2,674,09670% 69.9% 2,339,732 2,335,69860% 60.0% 2,005,485 2,004,90850% 50.1% 1,671,237 1,674,06240% 39.9% 1,336,990 1,335,19930% 30.0% 1,002,742 1,003,71420% 20.0% 668,495 668,71710% 10.0% 334,247 333,904
Active Idle 0 0
Copyright © 2007-2012 Standard Performance Evaluation Corporationhttp://www.spec.org - [email protected]
SPECpower_ssj2008 Reporter Version: [SSJ 1.2.9, July 28, 2011]
See the Power/Temperature Details Report for additional details.
Aggregate Performance Data
See the Aggregate Performance Report for additional details.

SPECpower_ssj2008
file:///Z|/...o-B250-M2-vs-Wocket/results/4-blade-power-efficiency-results/mojo/ssj.0069ssj.0069-4-Mojo-1067-2070-best/ssj.0069-main.html[2/20/2012 5:49:07 PM]
Performance PowerPerformance
to PowerRatio
TargetLoad
ActualLoad ssj_ops
AverageActivePower
(W)100% 99.6% 4,160,173 1,430 2,90990% 90.1% 3,761,834 1,332 2,82580% 79.9% 3,336,002 1,229 2,71470% 70.0% 2,924,924 1,126 2,59760% 60.0% 2,505,882 1,045 2,39950% 50.1% 2,091,374 982 2,13040% 40.0% 1,671,883 917 1,82330% 30.0% 1,254,139 853 1,47020% 20.0% 835,222 803 1,04010% 10.0% 417,582 750 557
Active Idle 0 626 0?ssj_ops / ?power = 2,070
SPECpower_ssj2008Copyright © 2007-2012 Standard Performance Evaluation Corporation
Dell Inc. PowerEdge M620 SPECpower_ssj2008 = 2,070overall ssj_ops/watt
Test Sponsor: Dell Inc. SPEC License#: 55 Test Method: Multi Node
Tested By: Dell Inc. Test Location: Round Rock,TX, USA Test Date: Feb 3, 2012
HardwareAvailability: Mar-2012 Software
Availability: Feb-2011 Publication: Unpublished
SystemSource:
SingleSupplier
SystemDesignation: Server Power
Provisioning:Line-powered
WARNING: PTDaemon 1.4.1-1271fb18-20110728 is over 6 months old. Checkhttp://www.spec.org/power/docs/SPECpower-Device_List.html to determine if a newerversion is available. (see Run Rules Section 1.1)WARNING: PTDaemon 1.4.1-1271fb18-20110728 is over 6 months old. Checkhttp://www.spec.org/power/docs/SPECpower-Device_List.html to determine if a newerversion is available. (see Run Rules Section 1.1)WARNING: PTDaemon 1.4.1-1271fb18-20110728 is over 6 months old. Checkhttp://www.spec.org/power/docs/SPECpower-Device_List.html to determine if a newerversion is available. (see Run Rules Section 1.1)
Benchmark Results Summary
Aggregate SUT Data

SPECpower_ssj2008
file:///Z|/...o-B250-M2-vs-Wocket/results/4-blade-power-efficiency-results/mojo/ssj.0069ssj.0069-4-Mojo-1067-2070-best/ssj.0069-main.html[2/20/2012 5:49:07 PM]
Shared HardwareEnclosure: Dell PowerEdge M1000e
Form Factor: 10UPower SupplyQuantity and
Rating (W):6 x 2700
Power SupplyDetails: Dell PN G803N
NetworkSwitch: Dell PowerConnect 8024F
Network SwitchDetails:
24 Port 10Gb EthernetSwitch
KVM Switch: NoneKVM Switch
Details: N/A
OtherHardware:
Dell M1000e ChassisManagement Controller, DellM8024-k Switch
Comment:Dell PowerConnect 8024Fnetwork switch measured forpower
Hardware per NodeHardware Vendor: Dell Inc.
Model: PowerEdge M620Form Factor: Blade
CPU Name: Intel Xeon E5-2660(2.20 GHz)
CPUCharacteristics: 8 Core, 2.20 GHz
CPU Frequency(MHz): 2200
CPU(s) Enabled: 16 cores, 2 chips, 8cores/chip
Software per NodePower
Management:Balanced Mode in OS (SeeNotes)
OperatingSystem (OS):
Windows 2008 ServerEnterprise x64 Edition
OS Version: R2 SP1Filesystem: NTFS
JVM Vendor: IBM Corporation
JVM Version:
IBM J9 VM (build 2.4, J2RE1.6.0 IBM J9 2.4 WindowsServer 2008 amd64-64jvmwa64 60sr5-
# ofNodes
# ofChips
# ofCores
# ofThreads
Total RAM(GB)
# of OSImages
# of JVMInstances
4 8 64 128 768 4 32
System Under Test
Shared Hardware
Set: 'sut'Set Identifier: sut
Set Description: M620# of Identical Nodes: 4
Comment: None

SPECpower_ssj2008
file:///Z|/...o-B250-M2-vs-Wocket/results/4-blade-power-efficiency-results/mojo/ssj.0069ssj.0069-4-Mojo-1067-2070-best/ssj.0069-main.html[2/20/2012 5:49:07 PM]
Hardware Threads: 32 (2 / core)CPU(s) Orderable: 1,2 chips
Primary Cache: 64KB I + 64KB D onchip per core
Secondary Cache: 256KB I+D on chip perchip
Tertiary Cache: 20 MB I+D off chip perchip
Other Cache: NoneMemory Amount
(GB): 192
# and size of DIMM: 12 x 16384 MB
Memory Details:
16GB 2Rx4 PC3-12800R ECC UDIMM,Slots A1-A6, B1-B6populated
Power SupplyQuantity and
Rating (W):None
Power SupplyDetails: Shared
Disk Drive: 2 x 73 GB 2.5" 15000RPM SAS (RAID 1)
Disk Controller: PERC H310 Modular# and type of
Network InterfaceCards (NICs)
Installed:
1 x onboard Intel X520-kdual-port 10 GigabitEthernet
NICs Enabled inFirmware / OS /
Connected:2/2/1
Network Speed(Mbit): 1000
Keyboard: NoneMouse: None
Monitor: NoneOptical Drives: No
Other Hardware: None
20090519_35743 (JIT enabled,AOT enabled)
JVMCommand-
line Options:
-Xmn1400m -Xms1875m -Xmx1875m -Xaggressive -Xcompressedrefs -Xgcpolicy:gencon -XlockReservation -Xnoloa -XtlhPrefetch -Xlp
JVM Affinity:start /affinity [F, F0, F00, F000,F0000, F00000, F000000,F0000000]
JVMInstances: 8
JVM InitialHeap (MB): 1400
JVMMaximum
Heap (MB):1875
JVM AddressBits: 64
BootFirmware
Version:1.0.2
ManagementFirmware
Version:iDRAC7 1.00 Build 70
WorkloadVersion: SSJ 1.2.9
DirectorLocation: Controller
OtherSoftware:
IBM WebSphere ApplicationServer
Boot Firmware SettingsDisabled Adjacent Cache Line Prefetch in BIOS.Disabled Hardware Prefetcher in BIOS.Disabled DCU Streamer Prefetcher in BIOS.DCU IP Prefetcher Disabled in BIOS.Disabled Data Reuse in BIOSDisabled Turbo Mode in BIOSMemory Speed set to 1067MHz in BIOS.

SPECpower_ssj2008
file:///Z|/...o-B250-M2-vs-Wocket/results/4-blade-power-efficiency-results/mojo/ssj.0069ssj.0069-4-Mojo-1067-2070-best/ssj.0069-main.html[2/20/2012 5:49:07 PM]
HardwareHardware Vendor: Dell Inc.
Model: R410CPU Description: Xeon 5620
Memory amount (GB): 4
SoftwareOperating
System (OS):Microsoft Windows Server2008 Enterprise SP2
JVM Vendor: Oracle Corporation
JVM Version: Jrockit(R) 1.6.0_02 buildR26.4.0-63 (32-bit)
CCS Version: 1.2.5
Power Analyzer pwr1Hardware
Vendor:Yokogawa ElectricInternational Pte. Ltd.
Model: WT210Serial Number: 91KA21978
Connectivity: RS-232Input
Connection: Default
MetrologyInstitute: NIST
Accredited by: Simco ElectronicsCalibration
Label: 5412137
Date ofCalibration: 20-Oct-2011
PTDaemon HostSystem: same as CCS
PTDaemon HostOS: same as CCS
PTDaemon
Power Analyzer pwr2Hardware
Vendor:Yokogawa ElectricInternational Pte. Ltd.
Model: WT210Serial Number: 91KA21980
Connectivity: RS-232Input
Connection: Default
MetrologyInstitute: NIST
Accredited by: Simco ElectronicsCalibration
Label: 5412138
Date ofCalibration: 20-Oct-2011
PTDaemon HostSystem: same as CCS
PTDaemon HostOS: same as CCS
PTDaemon
DAPC Mode Enabled.
Management Firmware Settingsnone
System Under Test Notes
Each JVM instance was affinitized to four cores.Using the local security settings console, "lock pages in memory" was enabled for the user running thebenchmark.Run was started remotely via psexec scriptWindows Power Saver Settings:
Turn off Hard Disk after 1 MinuteTurn off Display after 1 Minute
Controller System
Measurement Devices

SPECpower_ssj2008
file:///Z|/...o-B250-M2-vs-Wocket/results/4-blade-power-efficiency-results/mojo/ssj.0069ssj.0069-4-Mojo-1067-2070-best/ssj.0069-main.html[2/20/2012 5:49:07 PM]
Target Load Average Active Power (W) Minimum Ambient Temperature (°C)100% 1,430 24.890% 1,332 24.880% 1,229 24.870% 1,126 24.960% 1,045 24.950% 982 24.940% 917 24.630% 853 24.420% 803 24.410% 750 24.4
Active Idle 626 24.3Line Standard Minimum Temperature (°C) Elevation (m)
208V / 60 Hz / 1 phase / 1 wire 24.3 255
Target Load Actual Load ssj_opsTarget Actual
Calibration 1 4,155,615Calibration 2 4,173,459Calibration 3 4,180,486
Version: 1.4.1-1271fb18-20110728
SetupDescription:
Connected to SUT powersupply 1, 2, and 3.
Version: 1.4.1-1271fb18-20110728
SetupDescription:
Connected to SUT powersupply 4, 5, and 6.
Temperature Sensor temp1Hardware
Vendor: Digi International Inc.
Model: Watchport/H
Driver Version: Watchport Virtual Port5.30.2.0
Connectivity: USBPTDaemon Host
System: same as CCS
PTDaemon HostOS: same as CCS
SetupDescription:
50 mm in front of SUT mainairflow intake
NotesNone
Aggregate Electrical and Environmental Data
See the Power/Temperature Details Report for additional details.
Aggregate Performance Data

SPECpower_ssj2008
file:///Z|/...o-B250-M2-vs-Wocket/results/4-blade-power-efficiency-results/mojo/ssj.0069ssj.0069-4-Mojo-1067-2070-best/ssj.0069-main.html[2/20/2012 5:49:07 PM]
ssj_ops@calibrated=4,176,972100% 99.6% 4,176,972 4,160,17390% 90.1% 3,759,275 3,761,83480% 79.9% 3,341,578 3,336,00270% 70.0% 2,923,881 2,924,92460% 60.0% 2,506,183 2,505,88250% 50.1% 2,088,486 2,091,37440% 40.0% 1,670,789 1,671,88330% 30.0% 1,253,092 1,254,13920% 20.0% 835,394 835,22210% 10.0% 417,697 417,582
Active Idle 0 0
Copyright © 2007-2012 Standard Performance Evaluation Corporationhttp://www.spec.org - [email protected]
SPECpower_ssj2008 Reporter Version: [SSJ 1.2.9, July 28, 2011]
See the Aggregate Performance Report for additional details.

SPECpower_ssj2008
file:///Z|/...anB/Cisco-B250-M2-vs-Wocket/results/4-blade-power-efficiency-results/wocket/ssj.0035-4-wocket-1333-1756/ssj.0035-main.html[2/20/2012 5:50:32 PM]
Performance PowerPerformance
to PowerRatio
TargetLoad
ActualLoad ssj_ops
AverageActivePower
(W)100% 99.6% 3,749,443 1,467 2,55690% 89.9% 3,385,167 1,363 2,48480% 80.1% 3,016,723 1,267 2,38170% 70.0% 2,636,180 1,189 2,21760% 60.1% 2,260,906 1,112 2,03250% 50.2% 1,888,515 1,052 1,79540% 40.0% 1,507,082 996 1,51330% 30.0% 1,129,437 944 1,19620% 20.0% 754,350 893 84510% 10.0% 377,485 833 453
Active Idle 0 673 0?ssj_ops / ?power = 1,756
Shared HardwareEnclosure: Dell PowerEdge M1000e
Form Factor: 10U
SPECpower_ssj2008Copyright © 2007-2012 Standard Performance Evaluation Corporation
Dell Inc. PowerEdge M710HD SPECpower_ssj2008 = 1,756overall ssj_ops/watt
Test Sponsor: Dell Inc. SPEC License#: 55 Test Method: Multi Node
Tested By: Dell Inc. Test Location: Round Rock,TX, USA Test Date: Jan 25,
2012Hardware
Availability: Oct-2011 SoftwareAvailability: Apr-2011 Publication: Unpublished
SystemSource:
SingleSupplier
SystemDesignation: Server Power
Provisioning:Line-powered
Benchmark Results Summary
Aggregate SUT Data# of
Nodes# of
Chips# of
Cores# of
ThreadsTotal RAM
(GB)# of OSImages
# of JVMInstances
4 8 48 96 768 4 24
System Under Test
Shared Hardware

SPECpower_ssj2008
file:///Z|/...anB/Cisco-B250-M2-vs-Wocket/results/4-blade-power-efficiency-results/wocket/ssj.0035-4-wocket-1333-1756/ssj.0035-main.html[2/20/2012 5:50:32 PM]
Power SupplyQuantity and
Rating (W):6 x 2700
Power SupplyDetails: Dell PN G803N
NetworkSwitch: Dell PowerConnect 8024F
Network SwitchDetails:
24 Port 10Gb EthernetSwitch
KVM Switch: NoneKVM Switch
Details: N/A
OtherHardware:
Dell M1000e ChassisManagement Controller, DellM8024-k Switch
Comment:Dell PowerConnect 8024Fnetwork switch measured forpower
Hardware per NodeHardware Vendor: Dell Inc.
Model: PowerEdge M710HDForm Factor: Blade
CPU Name: Intel Xeon X5675(3.06 GHz)
CPUCharacteristics:
6 Core, 3.06 GHz, 12 MBL3 Cache
CPU Frequency(MHz): 3060
CPU(s) Enabled: 12 cores, 2 chips, 6cores/chip
Hardware Threads: 24 (2 / core)CPU(s) Orderable: 1,2 chips
Primary Cache: 32 KB I + 32 KB D onchip per core
Secondary Cache: 256 KB I+D on chip percore
Tertiary Cache: 12 MB I+D on chip perchip
Other Cache: NoneMemory Amount 192
Software per NodePower
Management:Power Saver Mode in OS (SeeNotes)
OperatingSystem (OS):
Windows 2008 ServerEnterprise x64 Edition
OS Version: R2 SP1Filesystem: NTFS
JVM Vendor: IBM Corporation
JVM Version:
IBM J9 VM (build 2.4, J2RE1.6.0 IBM J9 2.4 WindowsServer 2008 amd64-64jvmwa64 60sr5-20090519_35743 (JIT enabled,AOT enabled)
JVMCommand-
line Options:
-Xmn1400m -Xms1875m -Xmx1875m -Xaggressive -Xcompressedrefs -Xgcpolicy:gencon -XlockReservation -Xnoloa -XtlhPrefetch -Xlp
JVM Affinity: start /affinity [F, F0, F00, F000,F0000, F00000]
JVM 6
Set: 'sut'Set Identifier: sut
Set Description: PowerEdge M710HD# of Identical Nodes: 4
Comment: None

SPECpower_ssj2008
file:///Z|/...anB/Cisco-B250-M2-vs-Wocket/results/4-blade-power-efficiency-results/wocket/ssj.0035-4-wocket-1333-1756/ssj.0035-main.html[2/20/2012 5:50:32 PM]
(GB):# and size of
DIMM: 12 x 16384 MB
Memory Details:
16GB 2Rx4 PC3L-10600R ECC RDIMM,Slots A1-A6, B1-B6populated
Power SupplyQuantity and
Rating (W):None
Power SupplyDetails: N/A
Disk Drive:2 x 73 GB 2.5" 15000RPM SAS (Dell PNR730K)
Disk Controller: PERC H200 Modular# and type of
Network InterfaceCards (NICs)
Installed:
1 X Onboard dual-portBroadcom 57712-k10GbE
NICs Enabled inFirmware / OS /
Connected:2/2/1
Network Speed(Mbit): 10000
Keyboard: NoneMouse: None
Monitor: NoneOptical Drives: No
Other Hardware: None
Instances:JVM InitialHeap (MB): 1400
JVMMaximum
Heap (MB):1875
JVM AddressBits: 64
BootFirmware
Version:4.1.0
ManagementFirmware
Version:iDRAC 3.33 build 2
WorkloadVersion: SSJ 1.2.9
DirectorLocation: Controller
OtherSoftware:
IBM WebSphere ApplicationServer
Boot Firmware SettingsDisabled Adjacent Cache Line Prefetch in BIOS.Disabled Hardware Prefetcher in BIOS.Disabled DCU Streamer Prefetcher in BIOS.Disabled Data Reuse in BIOSDisabled Turbo Mode in BIOSMemory Speed set to 1333 MHz in BIOS.DAPC Mode Enabled.
Management Firmware Settingsnone
System Under Test Notes
Each JVM instance was affinitized to four logical processors.Using the local security settings console, "Lock pages in memory" was enabled for the user running the

SPECpower_ssj2008
file:///Z|/...anB/Cisco-B250-M2-vs-Wocket/results/4-blade-power-efficiency-results/wocket/ssj.0035-4-wocket-1333-1756/ssj.0035-main.html[2/20/2012 5:50:32 PM]
HardwareHardware Vendor: Dell Inc.
Model: R410CPU Description: Xeon 5620
Memory amount (GB): 4
SoftwareOperating
System (OS):Microsoft Windows Server2008 Enterprise SP2
JVM Vendor: Oracle Corporation
JVM Version: Jrockit(R) 1.6.0_02 buildR26.4.0-63 (32-bit)
CCS Version: 1.2.5
Power Analyzer pwr1Hardware
Vendor:Yokogawa ElectricInternational Pte. Ltd.
Model: WT210Serial Number: 91KA21978
Connectivity: RS-232Input
Connection: Default
MetrologyInstitute: NIST
Accredited by: Simco ElectronicsCalibration
Label: 5412137
Date ofCalibration: 20-Oct-2011
PTDaemon HostSystem: same as CCS
PTDaemon HostOS: same as CCS
PTDaemonVersion: 1.4.1-1271fb18-20110728
SetupDescription:
Connected to SUT powersupply 1, 2, and 3.
Power Analyzer pwr2Hardware
Vendor:Yokogawa ElectricInternational Pte. Ltd.
Model: WT210Serial Number: 91KA21980
Connectivity: RS-232Input
Connection: Default
MetrologyInstitute: NIST
Accredited by: Simco ElectronicsCalibration
Label: 5412138
Date ofCalibration: 20-Oct-2011
PTDaemon HostSystem: same as CCS
PTDaemon HostOS: same as CCS
PTDaemonVersion: 1.4.1-1271fb18-20110728
SetupDescription:
Connected to SUT powersupply 4, 5, and 6.
Temperature Sensor temp1Hardware
Vendor: Digi International Inc.
Model: Watchport/H
Driver Version: Watchport Virtual Port5.30.2.0
benchmark.Run was started remotely via psexec scriptWindows Power Saver Settings:
Turn off Hard Disk after 1 MinuteTurn off Display after 1 Minute
Controller System
Measurement Devices

SPECpower_ssj2008
file:///Z|/...anB/Cisco-B250-M2-vs-Wocket/results/4-blade-power-efficiency-results/wocket/ssj.0035-4-wocket-1333-1756/ssj.0035-main.html[2/20/2012 5:50:32 PM]
Target Load Average Active Power (W) Minimum Ambient Temperature (°C)100% 1,467 21.790% 1,363 21.880% 1,267 21.670% 1,189 21.660% 1,112 21.850% 1,052 21.740% 996 21.630% 944 21.620% 893 21.610% 833 21.6
Active Idle 673 21.6Line Standard Minimum Temperature (°C) Elevation (m)
208V / 60 Hz / 1 phase / 1 wire 21.6 255
Target Load Actual Load ssj_opsTarget Actual
Calibration 1 3,762,642Calibration 2 3,763,828Calibration 3 3,766,058
ssj_ops@calibrated=3,764,943100% 99.6% 3,764,943 3,749,44390% 89.9% 3,388,449 3,385,16780% 80.1% 3,011,955 3,016,72370% 70.0% 2,635,460 2,636,18060% 60.1% 2,258,966 2,260,90650% 50.2% 1,882,472 1,888,51540% 40.0% 1,505,977 1,507,08230% 30.0% 1,129,483 1,129,437
Connectivity: USBPTDaemon Host
System: same as CCS
PTDaemon HostOS: same as CCS
SetupDescription:
50 mm in front of SUT mainairflow intake
NotesNone
Aggregate Electrical and Environmental Data
See the Power/Temperature Details Report for additional details.
Aggregate Performance Data

SPECpower_ssj2008
file:///Z|/...anB/Cisco-B250-M2-vs-Wocket/results/4-blade-power-efficiency-results/wocket/ssj.0035-4-wocket-1333-1756/ssj.0035-main.html[2/20/2012 5:50:32 PM]
20% 20.0% 752,989 754,35010% 10.0% 376,494 377,485
Active Idle 0 0
Copyright © 2007-2012 Standard Performance Evaluation Corporationhttp://www.spec.org - [email protected]
SPECpower_ssj2008 Reporter Version: [SSJ 1.2.9, July 28, 2011]
See the Aggregate Performance Report for additional details.

SPECpower_ssj2008
file:///J|/...co/temp/Cisco-B250-M2-SPECPower-Results/192GB-1333-enterprise-mode-java-prefetch-1006/ssj.0003-1006/ssj.0003-main.html[2/20/2012 5:44:28 PM]
Performance PowerPerformance
to PowerRatio
TargetLoad
ActualLoad ssj_ops
AverageActivePower
(W)100% 99.5% 3,419,587 2,203 1,55290% 90.2% 3,097,943 2,085 1,48680% 80.1% 2,752,281 1,981 1,38970% 70.1% 2,408,536 1,881 1,28160% 59.9% 2,060,050 1,781 1,15750% 49.9% 1,713,549 1,692 1,01340% 40.0% 1,375,485 1,614 85230% 30.1% 1,033,523 1,539 67120% 20.0% 687,318 1,467 46810% 10.0% 342,943 1,388 247
Active Idle 0 1,151 0?ssj_ops / ?power = 1,006
Shared HardwareEnclosure: Cisco UCS 5108
Form Factor: 6U
SPECpower_ssj2008Copyright © 2007-2012 Standard Performance Evaluation Corporation
Cisco Inc. Cisco UCS B250 M2 SPECpower_ssj2008 = 1,006overall ssj_ops/watt
Test Sponsor: Dell Inc. SPEC License#: 55 Test Method: Multi Node
Tested By: Dell Inc. Test Location: Round Rock,TX, USA Test Date: Nov 30,
2011Hardware
Availability: Apr-2011 SoftwareAvailability: Feb-2011 Publication: Unpublished
SystemSource:
SingleSupplier
SystemDesignation: Server Power
Provisioning:Line-powered
Benchmark Results Summary
Aggregate SUT Data# of
Nodes# of
Chips# of
Cores# of
ThreadsTotal RAM
(GB)# of OSImages
# of JVMInstances
4 8 48 96 768 4 24
System Under Test
Shared Hardware

SPECpower_ssj2008
file:///J|/...co/temp/Cisco-B250-M2-SPECPower-Results/192GB-1333-enterprise-mode-java-prefetch-1006/ssj.0003-1006/ssj.0003-main.html[2/20/2012 5:44:28 PM]
Power SupplyQuantity and
Rating (W):4 x 2500
Power SupplyDetails:
Delta Model AHF-2DC-2500W
Network Switch:Cisco UCS 6120XP 20Port 1RU FabricInterconnect
Network SwitchDetails: N10-S6100
KVM Switch: NoneKVM Switch
Details: N/A
Other Hardware: Cisco UCS 2104XP 4 PortI/O Module
Comment:Cisco UCS 6120XP fabricinterconnect measured forpower
Hardware per NodeHardware Vendor: Cisco Inc.
Model: Cisco UCS B250 M2Form Factor: Blade
CPU Name: Intel Xeon X5675(3.06 GHz)
CPU Characteristics: 6 Core, 3.06 GHz, 12MB L3 Cache
CPU Frequency(MHz): 3066
CPU(s) Enabled: 12 cores, 2 chips, 6cores/chip
Hardware Threads: 24 (2 / core)CPU(s) Orderable: 1,2 chips
Primary Cache: 32 KB I + 32 KB D onchip per core
Secondary Cache: 256 KB I+D on chipper core
Tertiary Cache: 12 MB I+D on chip perchip
Other Cache: NoneMemory Amount 192
Software per NodePower
Management:Power saver Mode in OS (SeeNotes)
OperatingSystem (OS):
Windows 2008 ServerEnterprise x64 Edition
OS Version: R2 SP1Filesystem: NTFS
JVM Vendor: IBM Corporation
JVM Version:
IBM J9 VM (build 2.4, J2RE1.6.0 IBM J9 2.4 WindowsServer 2008 amd64-64jvmwa64 60sr5-20090519_35743 (JIT enabled,AOT enabled)
JVMCommand-
line Options:
-Xaggressive -Xcompressedrefs-Xgcpolicy:gencon -Xmn1400m-Xms1875m -Xmx1875m -XlockReservation -Xnoloa -Xlp
JVM Affinity: start /affinity [F, F0, F00, F000,F0000, F00000]
JVMInstances: 6
JVM Initial
Set: 'sut'Set Identifier: sut
Set Description: B250 M2# of Identical Nodes: 4
Comment: None

SPECpower_ssj2008
file:///J|/...co/temp/Cisco-B250-M2-SPECPower-Results/192GB-1333-enterprise-mode-java-prefetch-1006/ssj.0003-1006/ssj.0003-main.html[2/20/2012 5:44:28 PM]
(GB):# and size of DIMM: 48 x 4096 MB
Memory Details:4GB 2Rx4 PC3L-10600R ECC RDIMM,All slots populated
Power SupplyQuantity and Rating
(W):None
Power SupplyDetails: Shared
Disk Drive: 2 x 73 GB 2.5" SAS15000 RPM
Disk Controller:LSI SAS 1064E PCI-Express Fusion-MPTSAS
# and type ofNetwork Interface
Cards (NICs)Installed:
1 x Cisco UCSM81KR
NICs Enabled inFirmware / OS /
Connected:1/1/1
Network Speed(Mbit): 10000
Keyboard: NoneMouse: None
Monitor: NoneOptical Drives: No
Other Hardware: None
Heap (MB): 1400
JVMMaximum
Heap (MB):1875
JVM AddressBits: 64
BootFirmware
Version:S5500.2.0.1d.0.081220111423
ManagementFirmware
Version:2.0(1s)
WorkloadVersion: SSJ 1.2.9
DirectorLocation: Controller
OtherSoftware:
IBM WebSphere ApplicationServer V7.0 for Windows onx86-64bit
Boot Firmware SettingsTurbo Boost disabled in UCS Manager.Enhanced Intel Speedstep enabled in UCS Manager.Processor C State enabled in UCS Manager.Processor C1E enabled in UCS Manager.Processor C3 enabled in UCS Manager.Processor C6 enabled in UCS Manager.LV DDR Mode set to "performance-mode" in UCS Manager.USB System Idle Power Optimizing Setting set to "lower idle power" in UCS Manager.CPU Performance set to "Enterprise" in UCS Manager.
Management Firmware Settingsnone
System Under Test Notes
Each JVM instance was affinitized to four cores.

SPECpower_ssj2008
file:///J|/...co/temp/Cisco-B250-M2-SPECPower-Results/192GB-1333-enterprise-mode-java-prefetch-1006/ssj.0003-1006/ssj.0003-main.html[2/20/2012 5:44:28 PM]
HardwareHardware Vendor: Dell Inc.
Model: R410CPU Description: Xeon 5620
Memory amount (GB): 4
SoftwareOperating
System (OS):Microsoft Windows Server2008 Enterprise SP2
JVM Vendor: Oracle Corporation
JVM Version: Jrockit(R) 1.6.0_02 buildR26.4.0-63 (32-bit)
CCS Version: 1.2.5
Power Analyzer pwr1Hardware
Vendor:Yokogawa ElectricInternational Pte. Ltd.
Model: WT210Serial Number: 91KA21978
Connectivity: RS-232Input
Connection: Default
MetrologyInstitute: NIST
Accredited by: Simco ElectronicsCalibration
Label: 5412137
Date ofCalibration: 20-Oct-2011
PTDaemonHost System: same as CCS
PTDaemonHost OS: same as CCS
PTDaemonVersion: 1.4.1-1271fb18-20110728
SetupDescription:
Connected to SUT powersupply 1, 2, 3, and 4.
Temperature Sensor temp1Hardware
Vendor: Digi International Inc.
Model: Watchport/H
Driver Version: Watchport Virtual Port5.30.2.0
Connectivity: USBPTDaemon Host
System: same as CCS
PTDaemon HostOS: same as CCS
SetupDescription:
50 mm in front of SUT mainairflow intake
Using the local security settings console, "lock pages in memory" was enabled for the user running thebenchmark.Run was started remotely via psexec scriptWindows Power mode set to "Power Saver".Windows Power Saver Settings:
Turn off Hard Disk after 1 MinuteTurn off Display after 1 Minute
Controller System
Measurement Devices
NotesNone

SPECpower_ssj2008
file:///J|/...co/temp/Cisco-B250-M2-SPECPower-Results/192GB-1333-enterprise-mode-java-prefetch-1006/ssj.0003-1006/ssj.0003-main.html[2/20/2012 5:44:28 PM]
Target Load Average Active Power (W) Minimum Ambient Temperature (°C)100% 2,203 22.590% 2,085 22.380% 1,981 22.470% 1,881 22.660% 1,781 22.650% 1,692 22.640% 1,614 22.630% 1,539 22.620% 1,467 22.610% 1,388 22.6
Active Idle 1,151 22.6Line Standard Minimum Temperature (°C) Elevation (m)
208V / 60 Hz / 1 phase / 1 wire 22.3 255
Target Load Actual Load ssj_opsTarget Actual
Calibration 1 3,432,684Calibration 2 3,445,062Calibration 3 3,427,677
ssj_ops@calibrated=3,436,370100% 99.5% 3,436,370 3,419,58790% 90.2% 3,092,733 3,097,94380% 80.1% 2,749,096 2,752,28170% 70.1% 2,405,459 2,408,53660% 59.9% 2,061,822 2,060,05050% 49.9% 1,718,185 1,713,54940% 40.0% 1,374,548 1,375,48530% 30.1% 1,030,911 1,033,52320% 20.0% 687,274 687,31810% 10.0% 343,637 342,943
Active Idle 0 0
Copyright © 2007-2012 Standard Performance Evaluation Corporationhttp://www.spec.org - [email protected]
SPECpower_ssj2008 Reporter Version: [SSJ 1.2.9, July 28, 2011]
Aggregate Electrical and Environmental Data
See the Power/Temperature Details Report for additional details.
Aggregate Performance Data
See the Aggregate Performance Report for additional details.

SPECpower_ssj2008
file:///Z|/...anB/Cisco-B250-M2-vs-Wocket/results/4-blade-power-efficiency-results/wocket/ssj.0035-4-wocket-1066-1752/ssj.0035-main.html[2/20/2012 5:50:04 PM]
Performance PowerPerformance
to PowerRatio
TargetLoad
ActualLoad ssj_ops
AverageActivePower
(W)100% 99.7% 3,704,687 1,458 2,54190% 90.1% 3,348,742 1,353 2,47580% 79.9% 2,970,563 1,257 2,36370% 70.0% 2,600,493 1,178 2,20760% 59.9% 2,224,961 1,101 2,02150% 49.9% 1,856,004 1,039 1,78640% 40.1% 1,489,962 985 1,51330% 30.0% 1,116,118 932 1,19720% 20.1% 745,179 879 84710% 10.0% 371,079 820 452
Active Idle 0 660 0?ssj_ops / ?power = 1,752
Shared HardwareEnclosure: Dell PowerEdge M1000e
Form Factor: 10U
SPECpower_ssj2008Copyright © 2007-2012 Standard Performance Evaluation Corporation
Dell Inc. PowerEdge M710HD SPECpower_ssj2008 = 1,752overall ssj_ops/watt
Test Sponsor: Dell Inc. SPEC License#: 55 Test Method: Multi Node
Tested By: Dell Inc. Test Location: Round Rock,TX, USA Test Date: Jan 24,
2012Hardware
Availability: Oct-2011 SoftwareAvailability: Apr-2011 Publication: Unpublished
SystemSource:
SingleSupplier
SystemDesignation: Server Power
Provisioning:Line-powered
Benchmark Results Summary
Aggregate SUT Data# of
Nodes# of
Chips# of
Cores# of
ThreadsTotal RAM
(GB)# of OSImages
# of JVMInstances
4 8 48 96 768 4 24
System Under Test
Shared Hardware

SPECpower_ssj2008
file:///Z|/...anB/Cisco-B250-M2-vs-Wocket/results/4-blade-power-efficiency-results/wocket/ssj.0035-4-wocket-1066-1752/ssj.0035-main.html[2/20/2012 5:50:04 PM]
Power SupplyQuantity and
Rating (W):6 x 2700
Power SupplyDetails: Dell PN G803N
NetworkSwitch: Dell PowerConnect 8024F
Network SwitchDetails:
24 Port 10Gb EthernetSwitch
KVM Switch: NoneKVM Switch
Details: N/A
OtherHardware:
Dell M1000e ChassisManagement Controller, DellM8024-k Switch
Comment:Dell PowerConnect 8024Fnetwork switch measured forpower
Hardware per NodeHardware Vendor: Dell Inc.
Model: PowerEdge M710HDForm Factor: Blade
CPU Name: Intel Xeon X5675(3.06 GHz)
CPUCharacteristics:
6 Core, 3.06 GHz, 12 MBL3 Cache
CPU Frequency(MHz): 3060
CPU(s) Enabled: 12 cores, 2 chips, 6cores/chip
Hardware Threads: 24 (2 / core)CPU(s) Orderable: 1,2 chips
Primary Cache: 32 KB I + 32 KB D onchip per core
Secondary Cache: 256 KB I+D on chip percore
Tertiary Cache: 12 MB I+D on chip perchip
Other Cache: NoneMemory Amount 192
Software per NodePower
Management:Power Saver Mode in OS (SeeNotes)
OperatingSystem (OS):
Windows 2008 ServerEnterprise x64 Edition
OS Version: R2 SP1Filesystem: NTFS
JVM Vendor: IBM Corporation
JVM Version:
IBM J9 VM (build 2.4, J2RE1.6.0 IBM J9 2.4 WindowsServer 2008 amd64-64jvmwa64 60sr5-20090519_35743 (JIT enabled,AOT enabled)
JVMCommand-
line Options:
-Xmn1400m -Xms1875m -Xmx1875m -Xaggressive -Xcompressedrefs -Xgcpolicy:gencon -XlockReservation -Xnoloa -XtlhPrefetch -Xlp
JVM Affinity: start /affinity [F, F0, F00, F000,F0000, F00000]
JVM 6
Set: 'sut'Set Identifier: sut
Set Description: PowerEdge M710HD# of Identical Nodes: 4
Comment: None

SPECpower_ssj2008
file:///Z|/...anB/Cisco-B250-M2-vs-Wocket/results/4-blade-power-efficiency-results/wocket/ssj.0035-4-wocket-1066-1752/ssj.0035-main.html[2/20/2012 5:50:04 PM]
(GB):# and size of
DIMM: 12 x 16384 MB
Memory Details:
16GB 2Rx4 PC3L-10600R ECC RDIMM,Slots A1-A6, B1-B6populated
Power SupplyQuantity and
Rating (W):None
Power SupplyDetails: N/A
Disk Drive:2 x 73 GB 2.5" 15000RPM SAS (Dell PNR730K)
Disk Controller: PERC H200 Modular# and type of
Network InterfaceCards (NICs)
Installed:
1 X Onboard dual-portBroadcom 57712-k10GbE
NICs Enabled inFirmware / OS /
Connected:2/2/1
Network Speed(Mbit): 10000
Keyboard: NoneMouse: None
Monitor: NoneOptical Drives: No
Other Hardware: None
Instances:JVM InitialHeap (MB): 1400
JVMMaximum
Heap (MB):1875
JVM AddressBits: 64
BootFirmware
Version:4.1.0
ManagementFirmware
Version:iDRAC 3.33 build 2
WorkloadVersion: SSJ 1.2.9
DirectorLocation: Controller
OtherSoftware:
IBM WebSphere ApplicationServer
Boot Firmware SettingsDisabled Adjacent Cache Line Prefetch in BIOS.Disabled Hardware Prefetcher in BIOS.Disabled DCU Streamer Prefetcher in BIOS.Disabled Data Reuse in BIOSDisabled Turbo Mode in BIOSMemory Speed set to 1066 MHz in BIOS.DAPC Mode Enabled.
Management Firmware Settingsnone
System Under Test Notes
Each JVM instance was affinitized to four logical processors.Using the local security settings console, "Lock pages in memory" was enabled for the user running the

SPECpower_ssj2008
file:///Z|/...anB/Cisco-B250-M2-vs-Wocket/results/4-blade-power-efficiency-results/wocket/ssj.0035-4-wocket-1066-1752/ssj.0035-main.html[2/20/2012 5:50:04 PM]
HardwareHardware Vendor: Dell Inc.
Model: R410CPU Description: Xeon 5620
Memory amount (GB): 4
SoftwareOperating
System (OS):Microsoft Windows Server2008 Enterprise SP2
JVM Vendor: Oracle Corporation
JVM Version: Jrockit(R) 1.6.0_02 buildR26.4.0-63 (32-bit)
CCS Version: 1.2.5
Power Analyzer pwr1Hardware
Vendor:Yokogawa ElectricInternational Pte. Ltd.
Model: WT210Serial Number: 91KA21978
Connectivity: RS-232Input
Connection: Default
MetrologyInstitute: NIST
Accredited by: Simco ElectronicsCalibration
Label: 5412137
Date ofCalibration: 20-Oct-2011
PTDaemon HostSystem: same as CCS
PTDaemon HostOS: same as CCS
PTDaemonVersion: 1.4.1-1271fb18-20110728
SetupDescription:
Connected to SUT powersupply 1, 2, and 3.
Power Analyzer pwr2Hardware
Vendor:Yokogawa ElectricInternational Pte. Ltd.
Model: WT210Serial Number: 91KA21980
Connectivity: RS-232Input
Connection: Default
MetrologyInstitute: NIST
Accredited by: Simco ElectronicsCalibration
Label: 5412138
Date ofCalibration: 20-Oct-2011
PTDaemon HostSystem: same as CCS
PTDaemon HostOS: same as CCS
PTDaemonVersion: 1.4.1-1271fb18-20110728
SetupDescription:
Connected to SUT powersupply 4, 5, and 6.
Temperature Sensor temp1Hardware
Vendor: Digi International Inc.
Model: Watchport/H
Driver Version: Watchport Virtual Port5.30.2.0
benchmark.Run was started remotely via psexec scriptWindows Power Saver Settings:
Turn off Hard Disk after 1 MinuteTurn off Display after 1 Minute
Controller System
Measurement Devices

SPECpower_ssj2008
file:///Z|/...anB/Cisco-B250-M2-vs-Wocket/results/4-blade-power-efficiency-results/wocket/ssj.0035-4-wocket-1066-1752/ssj.0035-main.html[2/20/2012 5:50:04 PM]
Target Load Average Active Power (W) Minimum Ambient Temperature (°C)100% 1,458 21.490% 1,353 21.580% 1,257 21.670% 1,178 21.660% 1,101 21.650% 1,039 21.640% 985 21.630% 932 21.620% 879 21.610% 820 21.6
Active Idle 660 21.8Line Standard Minimum Temperature (°C) Elevation (m)
208V / 60 Hz / 1 phase / 1 wire 21.4 255
Target Load Actual Load ssj_opsTarget Actual
Calibration 1 3,708,825Calibration 2 3,716,695Calibration 3 3,714,967
ssj_ops@calibrated=3,715,831100% 99.7% 3,715,831 3,704,68790% 90.1% 3,344,248 3,348,74280% 79.9% 2,972,665 2,970,56370% 70.0% 2,601,082 2,600,49360% 59.9% 2,229,499 2,224,96150% 49.9% 1,857,916 1,856,00440% 40.1% 1,486,332 1,489,96230% 30.0% 1,114,749 1,116,118
Connectivity: USBPTDaemon Host
System: same as CCS
PTDaemon HostOS: same as CCS
SetupDescription:
50 mm in front of SUT mainairflow intake
NotesNone
Aggregate Electrical and Environmental Data
See the Power/Temperature Details Report for additional details.
Aggregate Performance Data

SPECpower_ssj2008
file:///Z|/...anB/Cisco-B250-M2-vs-Wocket/results/4-blade-power-efficiency-results/wocket/ssj.0035-4-wocket-1066-1752/ssj.0035-main.html[2/20/2012 5:50:04 PM]
20% 20.1% 743,166 745,17910% 10.0% 371,583 371,079
Active Idle 0 0
Copyright © 2007-2012 Standard Performance Evaluation Corporationhttp://www.spec.org - [email protected]
SPECpower_ssj2008 Reporter Version: [SSJ 1.2.9, July 28, 2011]
See the Aggregate Performance Report for additional details.

SPECpower_ssj2008
file:///Z|/...anB/Cisco-B250-M2-vs-Wocket/results/4-blade-power-efficiency-results/mojo/ssj.0069-4mojo-1333-2054-best/ssj.0069-main.html[2/20/2012 5:47:26 PM]
Performance PowerPerformance
to PowerRatio
TargetLoad
ActualLoad ssj_ops
AverageActivePower
(W)100% 99.6% 4,175,133 1,416 2,94890% 89.9% 3,767,952 1,331 2,83180% 80.1% 3,359,332 1,253 2,68170% 69.9% 2,931,354 1,139 2,57360% 60.0% 2,516,088 1,058 2,37750% 50.0% 2,094,981 997 2,10240% 40.0% 1,677,376 934 1,79630% 30.1% 1,260,863 870 1,44920% 20.1% 841,699 819 1,02810% 10.0% 419,172 766 547
Active Idle 0 634 0?ssj_ops / ?power = 2,054
SPECpower_ssj2008Copyright © 2007-2012 Standard Performance Evaluation Corporation
Dell Inc. PowerEdge M620 SPECpower_ssj2008 = 2,054overall ssj_ops/watt
Test Sponsor: Dell Inc. SPEC License#: 55 Test Method: Multi Node
Tested By: Dell Inc. Test Location: Round Rock,TX, USA Test Date: Feb 3, 2012
HardwareAvailability: Mar-2012 Software
Availability: Feb-2011 Publication: Unpublished
SystemSource:
SingleSupplier
SystemDesignation: Server Power
Provisioning:Line-powered
WARNING: PTDaemon 1.4.1-1271fb18-20110728 is over 6 months old. Checkhttp://www.spec.org/power/docs/SPECpower-Device_List.html to determine if a newerversion is available. (see Run Rules Section 1.1)WARNING: PTDaemon 1.4.1-1271fb18-20110728 is over 6 months old. Checkhttp://www.spec.org/power/docs/SPECpower-Device_List.html to determine if a newerversion is available. (see Run Rules Section 1.1)WARNING: PTDaemon 1.4.1-1271fb18-20110728 is over 6 months old. Checkhttp://www.spec.org/power/docs/SPECpower-Device_List.html to determine if a newerversion is available. (see Run Rules Section 1.1)Set sut WARNING: The highest calibrated throughput in this set (M620-02=1,060,589) is2.5% more than the lowest calibrated throughput (M620-04=1,034,355)
Benchmark Results Summary

SPECpower_ssj2008
file:///Z|/...anB/Cisco-B250-M2-vs-Wocket/results/4-blade-power-efficiency-results/mojo/ssj.0069-4mojo-1333-2054-best/ssj.0069-main.html[2/20/2012 5:47:26 PM]
Shared HardwareEnclosure: Dell PowerEdge M1000e
Form Factor: 10UPower SupplyQuantity and
Rating (W):6 x 2700
Power SupplyDetails: Dell PN G803N
NetworkSwitch: Dell PowerConnect 8024F
Network SwitchDetails:
24 Port 10Gb EthernetSwitch
KVM Switch: NoneKVM Switch
Details: N/A
OtherHardware:
Dell M1000e ChassisManagement Controller, DellM8024-k Switch
Comment:Dell PowerConnect 8024Fnetwork switch measured forpower
Hardware per NodeHardware Vendor: Dell Inc.
Model: PowerEdge M620Form Factor: Blade
CPU Name: Intel Xeon E5-2660(2.20 GHz)
CPUCharacteristics: 8 Core, 2.20 GHz
CPU Frequency(MHz): 2200
Software per NodePower
Management:Power Saver Mode in OS (SeeNotes)
OperatingSystem (OS):
Windows 2008 ServerEnterprise x64 Edition
OS Version: R2 SP1Filesystem: NTFS
JVM Vendor: IBM CorporationIBM J9 VM (build 2.4, J2RE
Aggregate SUT Data# of
Nodes# of
Chips# of
Cores# of
ThreadsTotal RAM
(GB)# of OSImages
# of JVMInstances
4 8 64 128 768 4 32
System Under Test
Shared Hardware
Set: 'sut'Set Identifier: sut
Set Description: M620# of Identical Nodes: 4
Comment: None

SPECpower_ssj2008
file:///Z|/...anB/Cisco-B250-M2-vs-Wocket/results/4-blade-power-efficiency-results/mojo/ssj.0069-4mojo-1333-2054-best/ssj.0069-main.html[2/20/2012 5:47:26 PM]
CPU(s) Enabled: 16 cores, 2 chips, 8cores/chip
Hardware Threads: 32 (2 / core)CPU(s) Orderable: 1,2 chips
Primary Cache: 64KB I + 64KB D onchip per core
Secondary Cache: 256KB I+D on chip perchip
Tertiary Cache: 20 MB I+D off chip perchip
Other Cache: NoneMemory Amount
(GB): 192
# and size of DIMM: 12 x 16384 MB
Memory Details:
16GB 2Rx4 PC3-12800R ECC UDIMM,Slots A1-A6, B1-B6populated
Power SupplyQuantity and
Rating (W):None
Power SupplyDetails: Shared
Disk Drive: 2 x 73 GB 2.5" 15000RPM SAS (RAID 1)
Disk Controller: PERC H310 Modular# and type of
Network InterfaceCards (NICs)
Installed:
1 x onboard Intel X520-kdual-port 10 GigabitEthernet
NICs Enabled inFirmware / OS /
Connected:2/2/1
Network Speed(Mbit): 1000
Keyboard: NoneMouse: None
Monitor: NoneOptical Drives: No
Other Hardware: None
JVM Version:
1.6.0 IBM J9 2.4 WindowsServer 2008 amd64-64jvmwa64 60sr5-20090519_35743 (JIT enabled,AOT enabled)
JVMCommand-
line Options:
-Xmn1400m -Xms1875m -Xmx1875m -Xaggressive -Xcompressedrefs -Xgcpolicy:gencon -XlockReservation -Xnoloa -XtlhPrefetch -Xlp
JVM Affinity:start /affinity [F, F0, F00, F000,F0000, F00000, F000000,F0000000]
JVMInstances: 8
JVM InitialHeap (MB): 1400
JVMMaximum
Heap (MB):1875
JVM AddressBits: 64
BootFirmware
Version:1.0.2
ManagementFirmware
Version:iDRAC7 1.00 Build 70
WorkloadVersion: SSJ 1.2.9
DirectorLocation: Controller
OtherSoftware:
IBM WebSphere ApplicationServer
Boot Firmware SettingsDisabled Adjacent Cache Line Prefetch in BIOS.Disabled Hardware Prefetcher in BIOS.Disabled DCU Streamer Prefetcher in BIOS.DCU IP Prefetcher Disabled in BIOS.

SPECpower_ssj2008
file:///Z|/...anB/Cisco-B250-M2-vs-Wocket/results/4-blade-power-efficiency-results/mojo/ssj.0069-4mojo-1333-2054-best/ssj.0069-main.html[2/20/2012 5:47:26 PM]
HardwareHardware Vendor: Dell Inc.
Model: R410CPU Description: Xeon 5620
Memory amount (GB): 4
SoftwareOperating
System (OS):Microsoft Windows Server2008 Enterprise SP2
JVM Vendor: Oracle Corporation
JVM Version: Jrockit(R) 1.6.0_02 buildR26.4.0-63 (32-bit)
CCS Version: 1.2.5
Power Analyzer pwr1Hardware
Vendor:Yokogawa ElectricInternational Pte. Ltd.
Model: WT210Serial Number: 91KA21978
Connectivity: RS-232Input
Connection: Default
MetrologyInstitute: NIST
Accredited by: Simco ElectronicsCalibration
Label: 5412137
Date ofCalibration: 20-Oct-2011
PTDaemon HostSystem: same as CCS
Power Analyzer pwr2Hardware
Vendor:Yokogawa ElectricInternational Pte. Ltd.
Model: WT210Serial Number: 91KA21980
Connectivity: RS-232Input
Connection: Default
MetrologyInstitute: NIST
Accredited by: Simco ElectronicsCalibration
Label: 5412138
Date ofCalibration: 20-Oct-2011
PTDaemon HostSystem: same as CCS
Disabled Data Reuse in BIOSDisabled Turbo Mode in BIOSMemory Speed set to 1333MHz in BIOS.DAPC Mode Enabled.
Management Firmware Settingsnone
System Under Test Notes
Each JVM instance was affinitized to four cores.Using the local security settings console, "lock pages in memory" was enabled for the user running thebenchmark.Run was started remotely via psexec scriptWindows Power Saver Settings:
Turn off Hard Disk after 1 MinuteTurn off Display after 1 Minute
Controller System
Measurement Devices

SPECpower_ssj2008
file:///Z|/...anB/Cisco-B250-M2-vs-Wocket/results/4-blade-power-efficiency-results/mojo/ssj.0069-4mojo-1333-2054-best/ssj.0069-main.html[2/20/2012 5:47:26 PM]
Target Load Average Active Power (W) Minimum Ambient Temperature (°C)100% 1,416 24.490% 1,331 24.480% 1,253 24.470% 1,139 24.360% 1,058 24.250% 997 24.240% 934 24.330% 870 24.320% 819 24.410% 766 24.4
Active Idle 634 24.4Line Standard Minimum Temperature (°C) Elevation (m)
208V / 60 Hz / 1 phase / 1 wire 24.2 255
Target Load Actual Load ssj_opsTarget Actual
Calibration 1 4,176,532
PTDaemon HostOS: same as CCS
PTDaemonVersion: 1.4.1-1271fb18-20110728
SetupDescription:
Connected to SUT powersupply 1, 2, and 3.
PTDaemon HostOS: same as CCS
PTDaemonVersion: 1.4.1-1271fb18-20110728
SetupDescription:
Connected to SUT powersupply 4, 5, and 6.
Temperature Sensor temp1Hardware
Vendor: Digi International Inc.
Model: Watchport/H
Driver Version: Watchport Virtual Port5.30.2.0
Connectivity: USBPTDaemon Host
System: same as CCS
PTDaemon HostOS: same as CCS
SetupDescription:
50 mm in front of SUT mainairflow intake
NotesNone
Aggregate Electrical and Environmental Data
See the Power/Temperature Details Report for additional details.
Aggregate Performance Data

SPECpower_ssj2008
file:///Z|/...anB/Cisco-B250-M2-vs-Wocket/results/4-blade-power-efficiency-results/mojo/ssj.0069-4mojo-1333-2054-best/ssj.0069-main.html[2/20/2012 5:47:26 PM]
Calibration 2 4,190,720Calibration 3 4,192,631
ssj_ops@calibrated=4,191,676100% 99.6% 4,191,676 4,175,13390% 89.9% 3,772,508 3,767,95280% 80.1% 3,353,341 3,359,33270% 69.9% 2,934,173 2,931,35460% 60.0% 2,515,006 2,516,08850% 50.0% 2,095,838 2,094,98140% 40.0% 1,676,670 1,677,37630% 30.1% 1,257,503 1,260,86320% 20.1% 838,335 841,69910% 10.0% 419,168 419,172
Active Idle 0 0
Copyright © 2007-2012 Standard Performance Evaluation Corporationhttp://www.spec.org - [email protected]
SPECpower_ssj2008 Reporter Version: [SSJ 1.2.9, July 28, 2011]
See the Aggregate Performance Report for additional details.