power factor insulation diagnosis: demystifying standard
TRANSCRIPT

Power Factor Insulation Diagnosis:
Demystifying Standard Practices
Dinesh Chhajer, PE
4271 Bronze Way, Dallas Tx
Phone: (214) 330 3238
Email: [email protected]
ABSTRACT
Power Factor (PF) testing is a very common diagnostic tool for evaluating the insulation condition of
electrical equipment. Many standard practices are applied in the field today but the reason or logic behind
them is rarely questioned. This paper focuses on demystifying some of these practices.
PF testing has been standardized at 10 kV and readings are trended and compared against historical values
at that voltage level. The relationship between applied voltage and PF test is reviewed to determine why
only 10 kV is used as the standard test voltage. The paper analyzes this standard practice by comparing
field test results performed at variable voltage levels for different test objects. Likewise, excitation current
measurements taken at lower voltage levels are normalized to 10 kV using a linear V/I relationship.
However, it is a well known fact that the excitation or magnetization (B-H) curve is non-linear. The paper
addresses as how linear approximation can affect the 10kV equivalent values and possibly introduce error
into the measurements.
PF testing of low-capacitance specimens, at times, reflect negative PF values. Bushings and transformers
with an electrostatic shield between the windings are very common specimens that exhibit negative PF
values. An ideal insulation can at best have a PF value of zero. How can PF readings be negative? This
paper highlights factors that can lead PF values to go negative and provide recommendations on best field
practices to prevent that. PF measurements of all insulation materials vary with temperature. Temperature
Correction Factors (TCF) are used to normalize the values to 20 °C. The use of “average” TCF tables for
specimens subjected to different loading, ageing acceleration and stresses only gives an approximate
value and does not provide accurate temperature compensation. A new technique is proposed to identify
the “accurate” correction factors that are unique to the object under test.
This paper is intended to explain these unusual PF testing facts including PF as a function of voltage, non-
linearity in excitation current measurements, negative PF values and error associated with average
temperature correction factor values. All these testing facts are explained and demystified using case
studies and field test results.
I. INTRODUCTION
With an increasing failure rate of substation electrical equipment, power delivery operators are faced with
a challenge to focus on preventive and predictive maintenance to ensure the power system’s integrity and
stability. Precise and accurate measurements are critical to make correct decisions when it comes to
estimating an asset’s remaining healthy life. Electrical insulation deterioration has been a very common
reason for most of the electrical equipment failures. A lot of time and effort have been put forward to
diagnose and better estimate the condition of insulation as it ages. Deterioration of insulation is dependent
upon various factors like ageing, mechanical stress, thermal and chemical stress, over loading and varying
environmental conditions. Dielectric strength of the insulation can be assessed by various off-line and
online testing techniques.
The Power Factor test is a traditional and reliable way of estimating the condition of insulation of
electrical equipment such as power transformers, circuit breakers, generators, cables and other electrical

apparatus. PF values when trended periodically can help in detecting problems like contamination, high
moisture content and the presence of voids in specimen insulation. Excitation current tests, along with PF
tests performed on power transformers, can help in detecting turn to turn insulation failure and core
related problems.
Diagnostic tests performed as per the IEEE and other international standards recommendations provide
valuable information that can prevent unplanned and unexpected failure of the insulation system.
Maintaining good quality of insulation helps in preventing failures and outages that jeopardize the
reliability of the overall electrical system operation. Extending the life of substation assets results in less
outages, higher reliability, system stability and a substantial financial benefit.
II. POWER FACTOR vs. VOLTAGE
PF tests are usually performed at 10 kV or the readings are converted to 10 kV equivalent. The
appropriate voltage level at which to perform the power factor tests is a frequently debated topic. In
today’s world, the available instrumentation and measurement techniques provide flexibility in
performing the same PF test with a variable test voltage. With the test instruments available, PF can be
performed at any voltage ranging from 27 V to 12 kV. What test voltage is “good enough” for accurate
and reliable measurements? The answer resides in what kind of specimen it is and under what conditions
it is being tested. Power transformers have oil-paper type insulating systems. This type of insulation
exhibits a flat response (no change) when PF is measured at various test voltages as shown in figure 1.
Figure 1: CHL+CHG PF measurements as a function of voltage for three phase delta delta transformer
On the other hand, motors and generators typically have dry or solid type insulation that exhibits PF
values as a function of test voltages. PF value increases with the increase in test voltage due to the
presence of voids as shown in figure 2. Almost all solid insulation materials have voids present in it. The
number of voids present will vary based upon the geometry, age, construction and design of the insulation
system. PF is a measure of losses taking place in the insulation system. The amount of increase in PF
value as a function of voltage corresponds to the degree of ionization taking place in voids.

Figure 2: PF measurements as a function of voltage for 2000 HP, 4000V 3-Φ induction motor
One of the reasons the industry has standardized on 10 kV as a typical test voltage is for immunization
against electrostatic interference. Power transformers operating in high voltage substations are subjected
to a lot of electrical noise and interference around the nominal frequency. A HV test signal provides better
signal to noise ratio (SNR) for precise and accurate measurements. Table 1 below shows a SNR of 1:2 in
765 kV substation on an Ungrounded Specimen Test (UST) measurement.
Table 1: Four repeat UST measurements on a grading capacitor in a 765 k V Substation
Test instruments with very high noise suppression capability are required for measurements in high
voltage substations where electrical noise and interference level can be as high as 15 mA. Since signal
current can be very low when performing AC insulation test, in the worst case scenarios noise can be in
multiples of signal current. With higher test voltage signal, one can obtain more reliable and repeatable
measurements.
With the new developments and advancements in signal processing, future testing methodologies might
incorporate testing being performed at lower voltages delivering similar reliable measurements using
better filtering and noise rejection capabilities.
III. NEGATIVE POWER FACTOR VALUES
For an ideal insulation, the value of PF should be zero. For all practical purposes, any specimen
exhibiting a value close to zero is considered to have a good quality of insulation. PF test sets always try
to model insulation in the form of a capacitor. If it is not an ideal capacitor, the results will be some
positive number indicative of insulation losses. This should give an indication to the user about the
characteristics of the specimen. When performing tests on bushings, three winding transformers or inter-
phase insulation of rotating machinery, the PF values will sometimes turn out to be negative. What does

that mean? PF is a measure of the amount of watts loss taking place in the insulation. Negative PF
corresponds to watts generation as opposed to watts loss. Obviously, insulation cannot generate watts,
which proves that negative PF values are not real.
Figure 3: Specimen in UST mode with surface loss components
Negative phantom values appear for some specimens that have either higher surface leakage loss or
unwanted currents to ground affecting the measurement circuitry. As shown in figure 3, phantom circuits
introduce a surface loss current Is which would cause change in the phase angle of measured test current
(IT) with respect to applied test voltage. The surface loss current (Is) is dominated by mainly a resistive
component (Rs) and has a very small phase angle with respect to the applied voltage. Capacitive coupling
(Cc) may be present as a result of this parallel path of Rs to main insulation under test. Measured test
current (IT) is vector difference of total current (INET) and surface loss current (Is) as shown in equation 1
below.
IT = INET - IS ……… (1)
In UST or Grounded Specimen Test (GST) mode configurations, the smaller phase angles for surface loss
current (Is) can make the measured test current (IT) phase angle go greater than 90 degrees with respect to
reference voltage as shown in figure 4 and can result in negative PF values.
Figure 4: Vector diagram with different Is phase angles
Specimen

Figure 5: Vector diagram with different magnitude of current INET and purely resistive loss current Is
Specimens with low capacitance values (smaller current) are more susceptible to the surface loss current
and thereby have higher probability to show negative PF values as shown in figure 5.
It is important to understand where negative PF values come from. Poor ground practice, humidity, moist
weather conditions, condensation, moisture and tracking on inside surfaces of bushings, all can contribute
to this phenomenon. For some specimens it is just by the virtue of apparatus design. For example, the
presence of electrostatic grounded shield between the inter-windings of a transformer. Another example
of the potential for negative PF values would be the inter-phase insulation of motors because of the way
end windings are terminated. In other cases, where negative values are encountered, users should consider
eliminating all external effects by following best testing practices such as verifying proper grounding
circuits, cleaning external bushing surfaces , avoiding unfavorable weather conditions (especially high
humidity) and effective use of guard circuits. Even after applying these best testing practices, if one
encounters repeated negative values or suddenly improved PF values compared to historical
measurements it could point towards some contamination or a bad insulation system.
IV. EXCITATION CURRENT VS. VOLTAGE
Excitation current test is a very commonly performed test along with traditional PF testing. It is a voltage
dependent test and is always performed in UST mode. Like PF tests, all the excitation current readings are
normalized to 10 kV equivalent values as well. A linear approximation is used to determine the excitation
current value at 10 kV when these tests are performed at some voltage lower than 10 kV.

Figure 6: Typical magnetization curve of a power transformer
For instance, if excitation current test performed at 5kV gives 20 mA, 10 kV equivalent results will show
40 mA. However, when dealing with specimens that are highly inductive, such as power transformers,
voltage and current do not exhibit a linear correlation as shown in Figure 6.
The relationship between V & I is dependent on core characteristics and the material used. As applied
voltage is increased, the inductance of the transformer will change and therefore the excitation current
will change too. Since the change of inductance is not linear with respect to voltage, the change in current
is also non-linear. Assuming a linear relation to determine 10 kV equivalent excitation values would only
give the approximate values. It is very important to perform tests at the same voltage if excitation current
historical data need to be trended and compared with present values. Tests performed at 2 kV and then
corrected to 10 kV may not be comparable to tests performed at 10 kV as shown in Table 2. The ability to
trend and compare data is critical when trying to find out problems associated with core and windings.
Table 2: Excitation current test performed at different voltages on a single phase Transformer
Figure 7: Excitation current measurement on a Delta winding with third leg grounded
When performing excitation current measurements on delta windings, it is very important to ground the
third leg (unused terminal) of the delta configuration in order to obtain correct readings as shown in figure
7.
Since the excitation current is a UST test, grounding the third leg eliminates the current flowing in the
other two windings from the measurement circuit. Pending the inductance and resistance of each winding,
if the third leg is not grounded the results would be approximately 30 to 50% higher than true readings as
shown in Table 3.

Table 3: Excitation current test performed on delta winding with and without third leg grounded
A transformer with magnetized core can cause erroneous readings in excitation current measurements.
The core may have residual magnetism as a result of the transformer being disconnected from the power
line, a short circuit fault or because of application of DC current to it. Presence of residual magnetism
would result in higher excitation current values than normal. IEEE C57.152 2013 section 7.2.11.1.1 states
that “If a significant change in the test results is observed, the only known reliable method of excluding
the effect of residual magnetism is to demagnetize the transformer core. It is recommended that the dc
measurements of the winding resistance be performed after the exciting current tests.”[2]
Excitation current measurements can be affected by various different factors as discussed above and
should be kept in mind before performing the test.
V. TEMPERATURE CORRECTION FACTORS FOR PF READINGS
PF values are highly dependent on temperature. Correction factor tables have traditionally been used to
bring all the recorded data to a common base of 20 °C. It is imperative to only compare a specimen’s PF
values that are either taken at a similar temperature or corrected to the same temperature accurately.
Different specimens behave differently to the effects of change in temperature on PF values. Additionally,
the same specimen will become more temperature dependant as it ages [3].
Each specimen is unique in its construction, design and ratings. They are each subjected to different kinds
of stresses, loading and different environmental conditions. A transformer, with 20 years of service
operating at 95% of its capacity in weather conditions of 45 °C would have a completely different level of
stress on insulation than another transformer with 5 years of service running at 75% of its capacity in an
environmental condition of 15 °C. Figure 8 below shows four transformers with varying degree of
temperature dependence based upon their age, ratings and moisture level [3].
Figure 8: Temperature dependence of different transformers with different levels of ageing

Temperature correction factor values are highly dependent on insulating material, their structure, ageing,
presence of moisture or contamination and various other factors. The available temperature correction
factor data is based upon the average values and are selected solely based upon nameplate information.
Nameplate information does not reflect the operating conditions or the stresses a specimen is subjected to
in its life cycle. Since, each test object is unique; using the average correction factors would introduce
some error into the corrected value. IEEE C57.12.90 section 10.10.4 Note 3 (b) states that “Experience
has shown that the variation in power factor with temperature is substantial and erratic so that no single
correction curve will fit all cases.” [1]
New transformers have relatively weak temperature dependence and use of standard tables would over
compensate as shown in figure 8 above. The measure of error becomes more predominant (in the other
direction) as the object ages. It’s a known fact that insulation deteriorates with aging. Trending of PF
values becomes more critical in the second half of the life cycle. In this second half, effect of correction
factors would be larger because of the increased insulation temperature dependence. Using average
temperature correction values can lead to incorrect trending of results and inaccurate estimation of the
remaining healthy life of the object.
IEEE Std. C57.152-2013 section 7.2.14.5 states that “Testing at temperatures below freezing should be
avoided, since this could significantly affect the measurement.” IEEE C57.12.90 section 10 states that
“When the insulation power factor is measured at a relatively high temperature and the corrected values
are unusually high, the transformer should be allowed to cool and the measurements should be repeated
at or near 20 ºC.” Measuring PF at too high or too low of temperature conditions can introduce error in
PF measurements. IEEE recommends, PF measurements should be performed in a narrow temperature
range close to 20 ºC to avoid errors introduced by temperature correction factors. However, in reality it’s
not always practical to cool down or heat up the transformer or any other test specimen to 20 °C for the
purpose of performing these measurements.
With the advancement of newer technologies, it is possible to accurately correct the PF values to 20 °C
without the use of average correction factor tables. Dielectric Frequency Response (DFR) method
primarily used for moisture estimation in cellulose could be used for determining PF temperature
correction factors as well. Detailed information about DFR method and technology used can be obtained
in reference [3]. Using DFR technique, one can determine the unique temperature correction factors for
each individual test object. The method is based on the fact that a power factor measurement at a certain
temperature and frequency corresponds to a measurement made at different temperature and frequency.
By measuring power factor at different frequencies and at any given insulation temp, one can determine
PF at any temperature [5-50 °C] and at nominal frequency. With technique like this, individual
temperature correction factors (ITC) can be determined and values can be accurately corrected to 20 °C.
The big advantage of this technique is that PF can now be measured at any insulation temperature [5-50
°C] and still can be corrected to 20 °C accurately and precisely.
ITC method using DFR technique was verified and implemented on a new 40 MVA core type three-phase
delta wye transformer. Transformer was tested in a controlled environment at an EFACEC manufacturing
plant as shown in figure 9.

Figure 9: 40 MVA Delta Wye transformer used as a test object for ITC case study
Prior to test, windings were heated using short circuit method and temperature was raised to 75 °C as
shown in figure 10.

Figure 10: Windings heated to 75 °C using short circuit method prior to performing the tests
Windings and oil were allowed to cool down, and the temperature was monitored using winding
resistance, top oil temperature, top and bottom radiator (Rad.) and ambient temperature. The transformer
was allowed to cool for hours to bring the oil and windings temperature closer. The average temperature
of the transformer oil was estimated using the formula listed in IEEE C57.12.90.
Transformer temperature was determined by taking average of high side, low side and average oil
temperature. PF was measured at different temperatures as the transformer was cooling down (50º C - 20º
C). Two different test instruments (Megger Delta 4000 and Megger IDAX 300) were used to perform the
PF measurement at different temperatures as shown in figure 11.

Figure 11: Test setup to perform Power Factor and DFR tests as transformer cools down
Temperatures were measured at the start and end of each test to get a more accurate overall transformer
temperature. All three insulations (CHL, CHG and CLG) were measured for this analysis.
Three different types of correction factors were used in the analysis. Measured Correction Factors (MCF)
were determined at different temperatures using measured PF values at 20º C and measured PF values at
those different temperatures.
MCF @ Temp X =
ITC were obtained at different temperatures using DFR technique from both the test instruments.
Traditional Temperature Correction Factors (TCF) at different temperatures were gathered from industry
available tables using the transformer nameplate information. MCF was then used as reference for all the
comparison and accuracy analysis between ITC and TCF.
The following observations were made when the results were analyzed:
MCF, ITC and TCF were compared for inter winding CHL insulation.

Figure 12: Comparison of ITC and TCF with respect to Measured Correction Factors (MCF) for CHL insulation
As shown in figure 12 above, MCF and ITC obtained using DFR technique were very close to each other.
The ITC had a worst-case scenario in percent error of only 2.1 % as compared to 10.5% for TCF. Percent
error of ITC and TCF with respect to MCF are shown in figure 13.
Figure 13: ITC and TCF percent error with respect to Measured Correction Factors (MCF) for CHL insulation
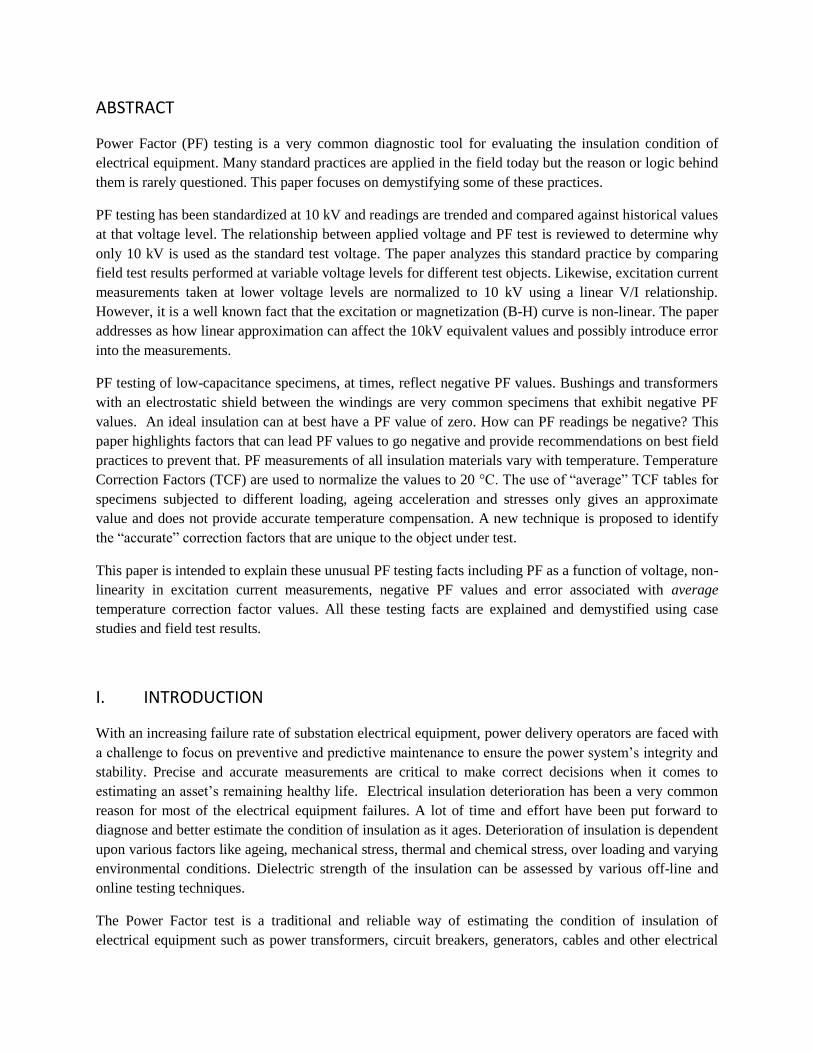
When analyzing CHG, similar readings were observed. MCF and ITC were comparable and TCF had
worst-case percent error of 92%. Figure 14, below shows the difference between MCF, ITC and TCF.
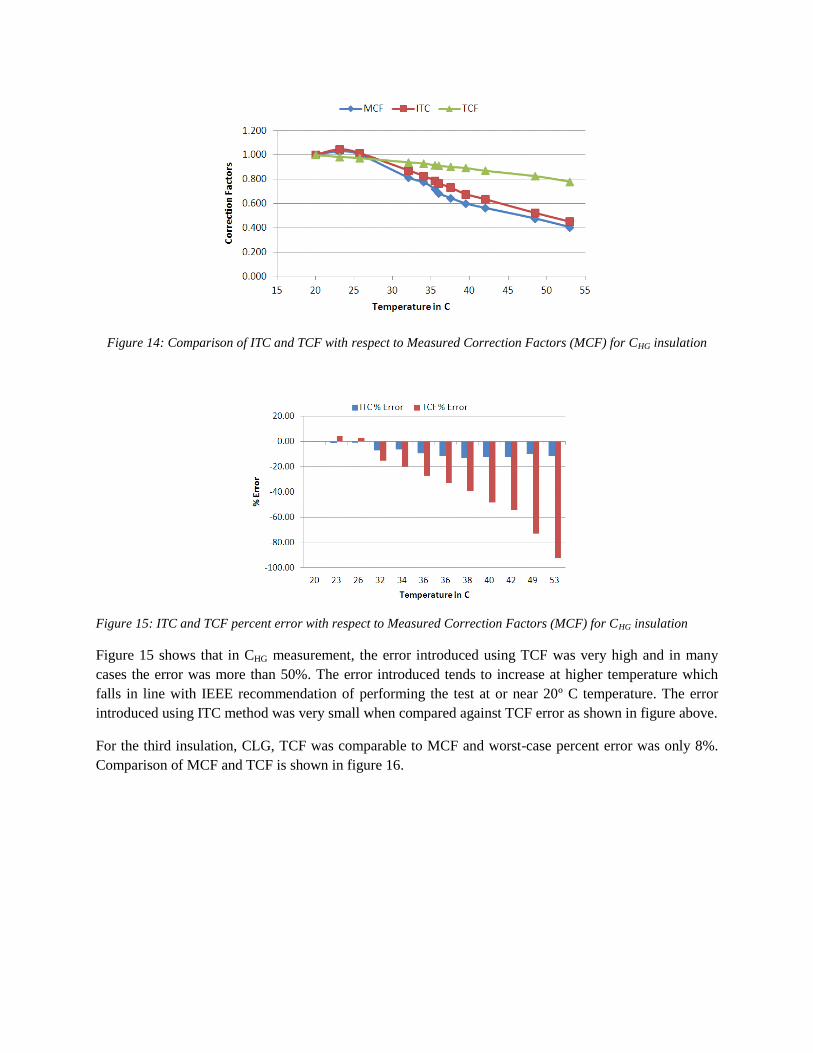
Figure 14: Comparison of ITC and TCF with respect to Measured Correction Factors (MCF) for CHG insulation
Figure 15: ITC and TCF percent error with respect to Measured Correction Factors (MCF) for CHG insulation
Figure 15 shows that in CHG measurement, the error introduced using TCF was very high and in many
cases the error was more than 50%. The error introduced tends to increase at higher temperature which
falls in line with IEEE recommendation of performing the test at or near 20º C temperature. The error
introduced using ITC method was very small when compared against TCF error as shown in figure above.
For the third insulation, CLG, TCF was comparable to MCF and worst-case percent error was only 8%.
Comparison of MCF and TCF is shown in figure 16.

Figure 16: Comparison of MCF and TCF for CLG insulation
As shown in figure 17 below, for CHL insulation when ITC and TCF corrected 20 °C values were
compared against measured PF at 20 °C, ITC showed relatively less error than TCF. The transformer
under test was a brand new transformer. With very good insulation, new transformers typically have very
low temperature dependence. Use of TCF values, tends to overcompensate for the temperature and values
appear to be higher than what they are. ITC on the other hand, takes into account the true temperature
dependence of the insulation and reflects 20 ºC corrected values very close to measured 20 ºC value.
Figure 17: Comparison of ITC and TCF corrected 20 ºC values with respect to measured PF readings at different
temperatures and 20 ºC for CHL insulation
The tests performed and analysis of results indicates that TCF correction values introduce errors varying
from as little as 2% to as high as 92% on the specimen tested. It has therefore been shown that TCF, being
average values, would introduce different amount of error based upon the condition of the transformer
and insulation under test. The analysis was performed on three different insulations within one

transformer only. Other transformers with different aging and operating conditions can have varying
percent errors in measurements when TCF is applied for temperature correction. DFR based ITC method
showed that every transformer being unique in nature would need individual correction factors to
compensate for the effect of temperature on insulation power factor values.
VI. CONCLUSION
Electric apparatus have failed and will continue to fail because of insulation deterioration. A proactive
and smart approach is cardinal to diagnosing and checking the integrity of the insulation system. Power
factor diagnostic test is an important tool in determining the quality of the insulation and estimating its
remaining healthy life.
Power factor readings are dependent on various different factors and it is very important to understand the
effect of these factors. Test voltage, electrostatic interference, temperature, humidity, surface losses and
various other parameters can greatly influence the PF readings. A better understanding of the impact of
these varying parameters would help in obtaining accurate measurements. Those correct PF
measurements would then certainly help in taking a definitive and rightful approach in the decision
making process.
VII. REFERENCES
[1] IEEE Standard Test Code for Liquid-Immersed Distribution, Power, and Regulating Transformers and
Guide for Short-Circuit Testing, IEEE C57.12.90-2006
[2] IEEE Guide for Diagnostic Field Testing of Fluid-Filled Power Transformers, Regulators, and
Reactors, IEEE Std. C57.152-2013
[3] P. Werelius, M Ohlen,” Dielectric Frequency Response and Temperature Dependence of Power
Factor”, Electrical Insulation (ISEI), Conference Record of the 2010 IEEE International Symposium
[4] D Chhajer, ““Power Factor Tip up Test Techniques & Concerns”, paper presented at NETA 2010
[5] Doble manual “Power Factor Testing of electric power apparatus insulation with Doble type M
instruments”, Doble engineering company, 2002
[6] Megger, “Instruction manual for Delta 2000- 10 kV automated insulation test set –Rev. B 2001”
[7] P. Werelius, thesis” Development and Application of High Voltage Dielectric Spectroscopy for
Diagnosis of Medium Voltage XLPE Cables”
[8] Megger, “Application guide for power factor testing of power & distribution transformers “
[9] Alex Rojas, “Power factor testing in transformer condition assessment- Is there a better way?”, 2006
IEEE PES Transmission and Distribution Conference and Exposition Latin America, Venezuela