power for detecting genetic divergence: differences ...evolucao/tge/ref12-3.pdf · power for...
TRANSCRIPT

Molecular Ecology (2006)
15
, 2031–2045 doi: 10.1111/j.1365-294X.2006.02839.x
© 2006 Blackwell Publishing Ltd
Blackwell Publishing Ltd
Power for detecting genetic divergence: differences between statistical methods and marker loci
NILS RYMAN,
*
STEFAN PALM,
*
CARL ANDRÉ,
†
GARY R. CARVALHO,
‡
THOMAS G. DAHLGREN,
†
PER ERIK JORDE,
§
L INDA LAIKRE,
*
LENA C. LARSSON,
*
ANNA PALMÉ
*
and DANIEL E . RUZZANTE
¶
*
Division of Population Genetics, Department of Zoology, Stockholm University, S-106 91 Stockholm, Sweden,
†
Department of Marine Ecology, Göteborg University, Tjärnö Marine Biological Laboratory, S-452 96 Strömstad, Sweden,
‡
Göteborg University, Department of Zoology, Box 463, S-405 30 Göteborg, Sweden,
§
Centre for Ecological and Evolutionary Synthesis (CEES), Department of Biology, University of Oslo, PO Box 1066 Blindern, N-0316 Oslo, Norway, and Institute of Marine Research, Flødevigen, N-4817 His, Norway,
¶
Department of Biology, Dalhousie University, Halifax, NS, Canada B3H 4J1
Abstract
Information on statistical power is critical when planning investigations and evaluatingempirical data, but actual power estimates are rarely presented in population genetic studies.We used computer simulations to assess and evaluate power when testing for geneticdifferentiation at multiple loci through combining test statistics or
P
values obtained byfour different statistical approaches, viz. Pearson’s chi-square, the log-likelihood ratio
G
-test, Fisher’s exact test, and an
F
ST
-based permutation test. Factors considered in thecomparisons include the number of samples, their size, and the number and type of geneticmarker loci. It is shown that power for detecting divergence may be substantial forfrequently used sample sizes and sets of markers, also at quite low levels of differentiation.The choice of statistical method may be critical, though. For multi-allelic loci such asmicrosatellites, combining exact
P
values using Fisher’s method is robust and generallyprovides a high resolving power. In contrast, for few-allele loci (e.g. allozymes and singlenucleotide polymorphisms) and when making pairwise sample comparisons, this approachmay yield a remarkably low power. In such situations chi-square typically represents abetter alternative. The
G
-test without Williams’s correction frequently tends to provide anunduly high proportion of false significances, and results from this test should be inter-preted with great care. Our results are not confined to population genetic analyses butapplicable to contingency testing in general.
Keywords
: chi-square, Fisher’s exact test, Fisher’s method, genetic differentiation,
G
-test, statisticalpower
Received 30 October 2005; revision accepted 14 November 2005
Introduction
A steadily growing number of studies in conservation andevolutionary biology are based on statistical analysis ofgenotypic data. A basic question in many such studies isone of genetic homogeneity, i.e. whether or not two or moresamples are likely to represent the same population orgene pool. Depending on the outcome of the statistical test— significance or not — genetic divergence or homogeneity
is concluded. This conclusion, in turn, may be used forinference on evolutionary processes or for decisions onmanagement and conservation (e.g. Waples 1998; Hedrick1999, 2001).
The typical way of addressing the question of genetichomogeneity is to assay a series of gene loci, and to teststatistically the null hypothesis of identical allele frequencies.Here, all polymorphic loci scored are considered potentiallyinformative regarding overall genetic homogeneity. Acommon approach is to first test for allele frequency homo-geneity at each locus separately, and then to combine theinformation from these single locus tests into an overall
Correspondence: Nils Ryman, Fax: + 46-8 154041; E-mail: [email protected]

2032
N . R Y M A N
E T A L
.
© 2006 Blackwell Publishing Ltd,
Molecular Ecology
, 15, 2031–2045
P
value relating to the joint null hypothesis of no allelefrequency difference among populations at any locus.
A variety of procedures for testing the hypothesis ofidentical allele frequencies is available in the literature andthrough different software, but it is frequently difficult tosee their pros and cons. In particular, there has been littlediscussion on the relative merits of alternative approachesfor how to combine the test results at separate loci into anoverall
P
value (but see Ryman & Jorde 2001 and Petit
et al
.2001).
A central issue in all hypothesis testing refers to thequestion of statistical power, i.e. the probability of rejectingthe null hypothesis (H
0
) when it is false. Knowledge ofstatistical power is important in two basic situations (e.g.Peterman 1990; Erdfelder
et al
. 1996). First, when planninga survey or an experiment it is critical to design it in a waythat makes it likely to detect differences of a magnitudeconsidered relevant for the specific question at hand. Second,in studies where no significance has been obtained, assess-ment of power makes it possible to evaluate the magnitudeof true differences that may have gone unnoticed, giventhe particulars of the investigation conducted.
The concept of power and its importance is frequentlymentioned in studies dealing with genetic divergence.For example, it is often claimed that statistical power (or‘resolving power’) is expected to be ‘high’, or higher thanin other studies, because of the use of large sample sizes orsome particular type of genetic marker. In cases of nosignificance, it is frequently implied that a relevant amountof divergence should have been detected with a high prob-ability. Alternatively, a lack of significance is in some casesdiscussed in terms of a potentially low power. Quantitativeassessments of these claims are typically lacking, though.
An obvious reason for this lack of power estimates is thelarge number of factors affecting it, including the number ofsamples, their size, the magnitude of the true divergence,the number and type of loci assayed, the number of alleles(or haplotypes), and their frequency distributions. Inaddition, different statistical techniques are not expectedto yield identical power (e.g. Goudet
et al
. 1996; Ryman &Jorde 2001).
We use computer simulations to examine the relativeimportance of various factors determining power whentesting for genetic homogeneity at multiple loci, focusingon commonly applied statistical testing methods, samplesizes, and numbers and types of genetic markers. We havepreviously shown that power may vary considerably betweenfrequently used statistical methods. In some situationswhen combining exact
P
values by Fisher’s method, powermay actually decrease with a growing number of loci, ratherthan increase as would typically be expected (Ryman &Jorde 2001). Here, we expand on those results for biologicallymore realistic scenarios, examining power when samplingfrom divergent populations where the amount of hetero-
geneity among loci varies stochastically. We also presentpower estimates for some empirical sets of commonly usedgenetic markers (microsatellites and allozymes) withdifferent numbers of alleles and frequency distributions.
Basic concepts
Important characteristics of a statistical test may be describedin terms of the associated
α
and
β
(or type I and II) errors.Here,
α
signifies the probability of erroneously rejectingthe null hypothesis (H
0
) when it is true, and
β
is theprobability of accepting H
0
when it is false. The quantity1–
β
is referred to as the power of the test, indicating theprobability of rejecting a false H
0
, equivalent to acceptingthe alternative hypothesis (H
1
). In the context of testingfor genetic homogeneity when sampling from two or morepopulations, H
0
typically specifies that all populationshave identical allele frequencies, whereas H
1
implies thatthey have not. Thus, in case of a true divergence, the power(1 –
β
) specifies the probability of detecting genetic structuringthrough a significant outcome of the test.
For any chosen (pre-assigned) level of the
α
error, a‘good’ statistical test should be characterized by as small a
β
error as possible. The
α
and
β
errors are not independent,though, and reducing
α
generally results in a larger
β
andthereby a reduced power (1 –
β
), and vice versa. The
α
erroris typically set to 0.05 in biological testing, and for anyparticular experimental or sampling situation this generallyaccepted error level results in a specific power, which isfrequently unknown but should be assessed.
Checking that the realized
α
level is reasonably close tothe intended one represents a natural starting point whenevaluating the characteristics of a test. An inflated realized
α
implies that the test is ‘unreliable’ producing an undulyhigh proportion of false significances, whereas a too smallrealized
α
implies that the test may be conservative andinefficient in detecting true differentiation. Without knowl-edge of realized
α
levels, power comparisons between testsmay not be very informative because higher power ofone test (when H
0
is false) may merely reflect an excessiveproportion of false significances (when H
0
is true).
Simulations
We mimicked sampling from populations at various levelsof expected divergence through random number computersimulations under a classical Wright–Fisher model withoutmigration or mutation (program written in
turbopascal
7.0). An infinitely large base population segregating for aspecified number of independent, selectively neutral lociwith defined allele frequencies was divided into
s
subpopula-tions of equal effective size (
N
e
) through random samplingof 2
N
e
genes. Each of the subpopulations of size
N
e
wasallowed to drift for
t
generations, and the expected degree

P O W E R F O R D E T E C T I N G D I V E R G E N C E
2033
© 2006 Blackwell Publishing Ltd,
Molecular Ecology
, 15, 2031–2045
of divergence in generation
t
is then
F
ST
= 1 – (1
−
1/2
N
e
)
t
(
e.g. Nei 1987 p. 359).In generation
t
a random sample of 2
n
genes (corre-sponding to
n
diploids) was drawn (with replacement) ateach locus from each subpopulation, and the H
0
of identicalallele frequencies in all the
s
populations was testedusing different statistical approaches. The entire process ofsplitting the base population, random drift, sampling,and testing was repeated 1000 times (runs) for each set ofstarting allele frequencies,
s
,
F
ST
(combination of
N
e
and
t
),and
n
. The proportion of significant outcomes (
P <
0.05)was taken as the estimate of power. Estimates of
α
errorwere obtained in a similar way, using samples drawndirectly from the base population and omitting the driftsteps (i.e.
F
ST
= 0).At each locus the H
0
of identical allele frequencies wastested using four different statistical methods, i.e. Pearson’straditional contingency chi-square, the standard log-likelihood ratio
G
-test
(
e.g. Sokal & Rohlf 1995; chapter 17),an extension of Fisher’s exact test for general rxc tables(as implemented in the
struc
routine in
genepop
3.3;Raymond & Rousset 1995a, b), and a randomized permu-tation test evaluating the probability of obtaining a sample
F
ST
of the magnitude observed or larger when permutinggenes among samples (with
F
ST
calculated according toWeir & Cockerham 1984, equation 6, assuming Hardy–Weinberg proportions within populations). For Fisher’sexact test we used the default values of
genepop
3.3 forthe number of dememorizations (1000) and Markov chainlength (100 000), and 10 000 randomizations was employedin the permutation tests.
With respect to the chi-square and
G
statistics we did notinclude their respective corrections, i.e. Yates’s for 2
×
2chi-square tables and Williams’s for
G
(e.g. Sokal & Rohlf1995). First, these corrections are frequently not applied inpopulation genetic studies (most likely because softwarelike
popgene
(Yeh
et al
. 1997) only provide uncorrectedchi-square and
G
values). Further, our previous analysis(Ryman & Jorde 2001) indicated that Williams’s and Yates’scorrections yield results fairly similar to those of chi-squareand Fisher’s exact test, respectively. The tendency ofWilliams’s
G
(
G
W
) to behave largely as chi-square was alsoobserved when computing
G
W
in the present study, althoughthis was not done systematically (not shown).
When combining the information from multiple single-locus tests we used the same techniques as Ryman & Jorde(2001). That is, for chi-square and
G
we summed the teststatistics (
χ
2
or
G
) from the separate tests (loci) along withtheir associated degrees of freedom (d.f.), assuming thatunder the joint null hypothesis of no difference at any locusthis sum approximately follows a
χ
2
distribution with d.f.=
Σ
d.f.
i
, where
i
is the number of single-locus contingencytests. Similarly, for
P
values produced by Fisher’s exacttest, the quantity
−
2
Σ
ln P
i
was assumed to be distributed as
χ
2
with d.f. = 2
i
when the joint H
0
is true (‘Fisher’s method’as implemented in, e.g.
genepop
; see Ryman & Jorde 2001for details on null hypotheses in this type of testing).
We focus primarily on ‘traditional’ contingency tests,only including one out of several possible alternatives forrandomization or permutation by using
F
ST
to rank thepermuted contingency tables (cf. Goudet
et al
. 1996). Whencombining the
P
values obtained by multiple permutationtests at each of several loci the same strategy as for Fisher’sexact test was used, evaluating the joint H
0
using Fisher’smethod. Note that ‘Fisher’s method’ and ‘Fisher’s exact test’are two different things. Similarly, the G-test examined hereshould not be confused with the test implemented in fstat(Goudet 1995, 2001) that evaluates permuted contingencytables on the basis of the G statistic.
Accuracy of the simulated drift process was checkedby comparing simulated FST distributions with expectedvalues using the recurrence equations of Nei (1975, pp. 121–24), and through comparing means and variances of theobserved allele frequency distributions of the base popula-tions with those expected theoretically (Choy & Weir 1978).The sampling from the base populations was tested in asimilar manner, and the results of our statistical test routines(chi-square, G, and Fisher’s exact test) were compared withthose of several software including genepop, popgene,statxact (Mehta & Patel 1997), and biom (Rohlf 1987).
A few comments may be warranted on the simulationscheme. First, sampling is performed from populationscharacterized by an expected amount of differentiation asdescribed by a particular FST, thus representing the FST thatwould result had an infinite number of selectively neutralloci been scored. This strategy was chosen because webelieve that in practical situations the most adequatequestion on power typically refers to the probability ofdetecting divergence among populations exhibiting someparticular level of ‘true’ differentiation across a large numberof loci affected by the same evolutionary forces.
Further, a specified expected FST may be obtained throughmany combinations of Ne and t. We have used fairly largeNes, typically in the range of 2000–4000, to maintain overallallele frequencies reasonably similar to those of the basepopulation, and to prevent excessive loss of low-frequencyalleles. To permit evaluation of the effect of losses andfixations, our program presents separately the results fromsimulations (runs) maintaining all the alleles in the basepopulation and those where loss has occurred. Thisdistinction turned out to be of little importance within theparameter space employed, however, and we only presentthe pooled results. Thus, when providing results for loci withdifferent number of alleles (e.g. Fig. 1c, d) we consistentlyrefer to the number in the base population, regardless ofthe number that was actually observed in the contingencytables used for statistical testing (i.e. those tests occasionallydiffered somewhat with respect to their degrees of freedom).

2034 N . R Y M A N E T A L .
© 2006 Blackwell Publishing Ltd, Molecular Ecology, 15, 2031–2045
There is clearly an infinite number of scenarios that canbe addressed with the present approach. We have focusedon the effect on power of combining multiple loci withdifferent levels of variation meant to represent commonlyemployed markers such as allozymes, microsatellites, andSNPs (single nucleotide polymorphisms). Most results referto designs using frequently reported sample sizes thatare of the same magnitude, but the effect of unbalancedsampling was also evaluated. We have not dealt with theBonferroni technique for evaluating the joint H0 for multipleloci, because our previous results indicate that this approachmay not be appropriate in the present context (Ryman &Jorde 2001; but see Neuhäuser 2003, 2004 for discussionson alternatives).
Results
We studied the effect on α and power of the number of lociand alleles, sample size and number of samples, balancedvs. unbalanced sampling, and whether or not the numberof ‘independent’ alleles is a good indicator of power. Mostof the simulations refer to ‘hypothetical’ loci, but authenticdata sets are also included.
In a first step power differences between hypotheticalloci with few or several alleles, and uniform or skewedallele frequency distributions, were examined. We focusedon loci with 2 or 10 (and in some cases up to 50) alleles,where uniform indicates that all alleles occur at the samefrequency in the base population (0.5 and 0.1 for 2 and 10alleles per locus, respectively), whereas for the skeweddistributions we let all but one allele be of a ‘low’ frequency(0.01). Thus, for a di-allelic locus the skewed distributionrepresents the allele frequencies of 0.99 and 0.01, and for a10-allelic one the frequencies are 0.91, 0.01, 0.01 … 0.01. Thepower for various numbers of these types of loci wasevaluated for different combinations of FST, s (number ofsampled populations), and n (number of ‘diploids’ sampledfrom each population).
A single locus
Figure 1 (a and b) depict the proportion of significances asa function of FST when sampling 50 individuals (100 genes)from each of five populations with an expected FST rangingfrom 0 (no differentiation) to 0.05. The proportion of signific-ances (out of 1000 runs) signifies the α error when FST = 0,and otherwise power.
Clearly, power may be reasonably high even for a singlelocus with the actual value depending on the true FST, thenumber of alleles, their distribution, and the testing method.Multiple alleles and uniform frequency distributions are‘better’ than few alleles occurring at skewed frequencies. Thedifferent statistical testing methods provide very similarresults at uniform allele frequencies, but there are some
obvious power differences with many low-frequency alleles.In particular, the permutation test performs worse thanthe others, unless FST is so large that power for all testsapproaches unity (Fig. 1b). The α error stays fairly close tothe intended level of 5% for all tests, with the exception ofthe G-test applied to 10 alleles with a skewed distribution,where the realized α is elevated (c. 14%).
The dependence of α and power on the number of alleles(2–50) is further detailed in Fig. 1 (c and d) for s = 2 andn = 50. Here, the unduly large α error of the G-test becomesmore pronounced as the number of alleles increases (exceed-ing 35% for the skewed allele frequency distribution), whereasthis error stays close to or is below the intended 5% for theother three tests (Fig. 1c).
With respect to power (Fig. 1d), we first note that the G-test consistently yields the highest proportion of signifi-cances, but the perceived ‘superiority’ of this test mustnot be taken at face value, because it merely reflects itsinappropriately large α. With uniform allele frequencies,the Fisher’s exact, chi-square, and permutation tests allprovide similarly increasing power that approaches unityat 50 alleles. At skewed frequencies, however, there aremarked power differences between these testing methods,with Fisher’s exact test generally outperforming the twoothers (chi-square and permutations). The exception refersto the case of two alleles, where chi-square exhibits asomewhat higher power (cf. below).
Multiple loci
Figure 2 exemplifies results obtained when combining theseparate test statistics (or P values) for an increasing number(1–40) of the four types of loci for FST = 0 and 0.01, s = 2, andn = 50. With respect to α (left column of plates), the mostobvious observation is that the G-test frequently yields anunduly high proportion of significances in the case of nodifferentiation, also when combining the information frommultiple loci. This is particularly so for loci where lowfrequency alleles are common, including situations withseveral uniformly distributed alleles. For example, for ten 10-allele loci with skewed allele frequencies (Fig. 2g) the G-testresults in a probability of erroneously rejecting the true H0 ofabout 65%. Clearly, such a high realized α is unacceptableand should disqualify this test from use in many situations.
In contrast to the unduly high realized α for the G-test, theother three tests occasionally result in an α that is markedlysmaller than the intended 5% (Fig. 2, left column). The moststriking observations for di-allelic loci are that combiningP values from Fisher’s exact or permutation tests by meansof Fisher’s method results in an α that (i) may decline withan increasing number of loci (Fig. 2a), and (ii) may evenapproach zero regardless of the number of loci (Fig. 2c).For 10-allele loci, however, the realized α for these twotests stays fairly close to the intended 5% (Fig. 2e, g).

P O W E R F O R D E T E C T I N G D I V E R G E N C E 2035
© 2006 Blackwell Publishing Ltd, Molecular Ecology, 15, 2031–2045
When combining multiple chi-squares the α error is lowin cases with low-frequency alleles, but it is never zero, andthere is no obvious relation to the number of loci. Thus,with respect to α, the Pearson chi-square generally appearsto perform better than the other tests considered here(Fig. 2, left column).
Power curves for the same scenarios as presented for theα errors are shown in the right column of Fig. 2. Clearly,the proportion of significances depends on the number ofloci, the number of alleles per locus and their frequencydistributions, and the statistical method. As noted previ-ously for a single locus, the G-test consistently yields a highpower also for multiple loci, but again, the tendency of theG-test to produce excessive α errors indicates that this testis unreliable in many situations (in realistic settings we donot know if H0 is true or false).
Power is generally higher for 10-allele loci than for di-allelic ones, and as expected, it also increases with thenumber of loci. A striking and counter-intuitive exceptionrefers to the permutation and the Fisher’s exact tests in thedi-allelic low-frequency case (Fig. 2d). Here, power initially
is very low and decreases further as the number of locigoes up (in contrast to that of the chi-square that steadilyincreases). This small and decreasing power largely seemsto be a reflection of the realized α being essentially zero inthese cases. A situation where α = 0 implies that the testmethod applied cannot produce a significant result regard-less of how extreme the observations in a sample may be,and power is then necessarily zero.
The chi-square performs better than the permutation andthe Fisher’s exact tests for di-allelic loci with more uniformfrequency distributions (Fig. 2b). Again, this behaviour seemsto be related to the reduced levels of realized α of the twolatter tests.
For 10-allele loci power is high and similar for allapproaches when allele frequencies are uniformly distrib-uted (Fig. 2f). The segregation of infrequent alleles reducespower somewhat when the number of loci is not very large,but the reduction is in most cases fairly modest (Fig. 2h).When power differs between methods (skewed frequencies,few loci), Fisher’s exact test consistently yields the high-est power and the permutation test the lowest, whereas
Fig. 1 Simulated α error and power for asingle locus. Plates (a) and (b): proportionof significances (P < 0.05) obtained throughdifferent statistical methods as a function ofthe true level of differentiation (FST) whentesting the hypothesis of identical allelefrequencies at a di-allelic (a) or a 10-allelic(b) locus with uniform (solid lines) or skewed(dotted lines) allele frequency distributions.The number of populations sampled (s) is 5,and each sample size (n) is 50 diploids. Theproportion of significances corresponds to αwhen FST = 0 and to power when FST > 0.Plates (c) and (d): α error (c) and power (d;FST = 0.01, s = 2, and n = 50) as a function ofthe number of alleles (2–50). Note the differentscales of the y-axes. See text for details.

2036 N . R Y M A N E T A L .
© 2006 Blackwell Publishing Ltd, Molecular Ecology, 15, 2031–2045
chi-square is intermediate. This is in contrast to the di-alleliccases (Fig. 2b, d) where chi-square always performedbest.
Examples of the impact on power from increasing thesample size and the number of samples are shown in Fig. 3.Here, we focus on the effects of combining 10 loci of aparticular type for various combinations of n and s, withFST = 0.01 or 0.001 (FST was reduced to 0.001 for the 10-alleleloci not to consistently provide a power close to unity). Theresults from the G-tests are omitted from this figure becauseof its inflated power.
Regardless of statistical method, increasing total samplesize (s × n) through a larger s or n consistently yields a higherpower. Expressed differently, for a fixed s, power increaseswith a larger n, and vice versa. We have also examined theeffect of allocating between various combinations of s andn resulting in the same total number of individuals (s × n =100 or 250; Fig. 3). For a fixed total sample size the generaleffect of scoring few large samples or several smaller onesseems to be minor at di-allelic loci. For 10-allele loci itappears as if it is most efficient to analyse many individualsfrom each of few samples, although the absolute power
Fig. 2 The α error (FST = 0; left column ofplates) and power at FST = 0.01 (right column)for hypothetical di- and 10-allelic lociwith uniform or skewed allele frequencydistributions when combining the informationfrom 1 to 40 loci of the same type. s = 2, n =50. Note the different scales of the y-axes.

P O W E R F O R D E T E C T I N G D I V E R G E N C E 2037
© 2006 Blackwell Publishing Ltd, Molecular Ecology, 15, 2031–2045
difference is small. The latter observation is similar to thatof Goudet et al. (1996) for single loci in power simulationswhere all individuals in the base population were uniquelyheterozygous, seemingly implying a fairly large number ofalleles in the populations sampled for testing.
An important observation from Fig. 2 was the conspicuouspower difference between test methods for di-allelic lociwith skewed allele frequencies for s = 2 and n = 50 (Fig. 2d).When increasing the total sample size through a larger n ors, however, the power of the Fisher’s exact and permutationtests is no longer close to zero (Fig. 3b). Nevertheless, thechi-square test consistently performs best and appearsto be the method of choice when dealing with few skew-frequency alleles. In contrast, with few alleles at moreuniform frequencies (Fig. 3a) the difference between tests isless pronounced or nonexisting, except for small values ofboth s and n. With 10 alleles (Fig. 3c, d) differences betweenmethods are also minor, although Fisher’s exact test performsslightly better than the others in cases with skewed allelefrequencies (Fig. 3d). It should be noted that in no case arethese power differences between test methods associatedwith an unduly large α error (all α values corresponding tothe simulations of Fig. 3 are around 5% or less; not shown).
Small or unbalanced sample sizes
It is frequently suggested that chi-square may not be suitable
for testing contingency tables with small expected values,as is commonly encountered for loci with infrequent alleles,because of a presumed risk of an excessive proportion offalse significances (e.g. Weir 1996; Agresti 2001). The presentresults, however, indicate that chi-square in some casesperforms as well as, or better than, the other approaches. Asimilar observation was made in the simulation study byRyman & Jorde (2001).
To address the issue of a potentially inflated α for chi-square in greater detail we conducted a series of simulationsanalysing more sparse contingency tables with several cellsexhibiting considerably smaller expectancies than previously.Specifically, we focused on unbalanced sampling with s = 3,letting one sample be large (n1 = 100) and the other two ofa different but mutually identical size (n2 = n3 ranging inthe interval 2–100), and loci with 2, 10, and 50 alleles.
Resulting α errors from simulations with unbalancedsample sizes at one locus are shown in Fig. 4. Several obser-vations can be made from this figure. First, it is clear thatchi-square may result in an inflated α when small samplesare compared with much larger ones. However, thisphenomenon only appears to be an issue when the smallersamples comprise about 20–30 diploids or fewer, and atloci segregating for low-frequency alleles (i.e. loci withskewed frequencies or with so many uniformly distributedalleles that they all occur at low frequencies). Further,the chi-square statistic may not be as sensitive to small
Fig. 3 Power when combining the informa-tion from 10 hypothetical loci with uniformor skewed allele frequency distributions forselected combinations of s and n (s × n = totalsample size). Plates (a) and (b): 10 di-allelicloci; FST = 0.01. Plates (c) and (d): 10 10-allelic loci; FST = 0.001.

2038 N . R Y M A N E T A L .
© 2006 Blackwell Publishing Ltd, Molecular Ecology, 15, 2031–2045
expectancies as is commonly presumed. As an example,we may consider the Fig. 4(f) scenario (50-allelic skewed)for n2 = n3 = 50, where all the 1000 simulated 3 × 50 tablescontain cells with expectancies < 1, and where the meannumber of cells with an expected value of less than 5and less than 1 was 144 and 44 (out of 150), respectively.Nevertheless, realized α for chi-square stays very close tothe intended 5%.
Figure 4 does not include cases where all samples aresmall, say n < 20, but some simulations were conducted tocover that scenario also. Interestingly, small but balancedsamples resulted in an α for chi-square that was very closeto or below the intended level of 5% (s = 2 or 10 and n = 10;not shown). That is, the problem with small expectanciesappears primarily to be a matter of concern when dealing
with highly unbalanced sample sizes in combination withlow-frequency alleles.
In the case of unbalanced sampling, α for the Fisher’sexact and permutation tests always stays close to theintended 5%. In contrast, the G-test behaves quite erratic-ally. In some situations α for G is too large, and in others itis too small, but it is difficult to discern a clear pattern forhow G will deviate in either direction. For example, withone 10-allelic locus with skewed allele frequencies (Fig. 4d)α for G increases continuously from zero to c. 15% as n2 andn3 goes from 2 to 100. In contrast, for a 10-allelic locus withuniform allele frequencies, α starts out at zero, increasesrapidly to about 12%, and then goes down and levels outjust above 5% (Fig. 4c). Similar but much more pronounceddeviations from the intended α of 5% are seen for 50 alleles
Fig. 4 The α error (FST = 0) at a single locuswith different number of alleles (2, 10, and50) when drawing three samples (s = 3) ofdifferent size (n1, n2, and n3). One sample isfixed at 100 diploids (n1 = 100), and the othertwo are of a mutually equal size (n2 = n3)that varies in the interval 2–100. The leftand right columns of plates refer to uniformand skewed allele frequency distributions,respectively. Note the different scales of they-axes.

P O W E R F O R D E T E C T I N G D I V E R G E N C E 2039
© 2006 Blackwell Publishing Ltd, Molecular Ecology, 15, 2031–2045
(Fig. 4e, f ). Combining information from multiple loci resultsin α error graphs resembling those in Fig. 4, except that thedeviations from intended α are reinforced (not shown).
Authentic data
An authentic data set typically consists of a combinationof loci with many or few alleles segregating at variousfrequencies. As indicated by the above results, the actualpower and the performance of various tests under suchcircumstances may be difficult to predict because of themany factors that must be considered. As examples ofpower for different sets of loci from authentic studies,we have conducted simulations based on allozyme andmicrosatellite data from our own research on Atlanticherring (Clupea harengus) and brown trout (Salmo trutta).Figure 5 depicts, by means of bubble diagrams, the numberof loci and their allele frequency distributions for the fourcombinations of locus type and species used as startingpoints for the simulations.
There are obvious differences both between and withinspecies and marker types regarding the number of loci, thenumber of alleles, and their frequency distributions (Fig. 5).
For the herring it appears reasonable that the large numberof microsatellite alleles and their fairly uniform distributionwould yield a higher power than for the less variableallozymes, although the magnitude of this difference isdifficult to anticipate. This difficulty seems even morepronounced for the brown trout, where the number ofallozyme loci is more than twice that of the microsatellites(17 vs. 8), and where the difference between marker typeswith respect to the number of alleles per locus is lesspronounced.
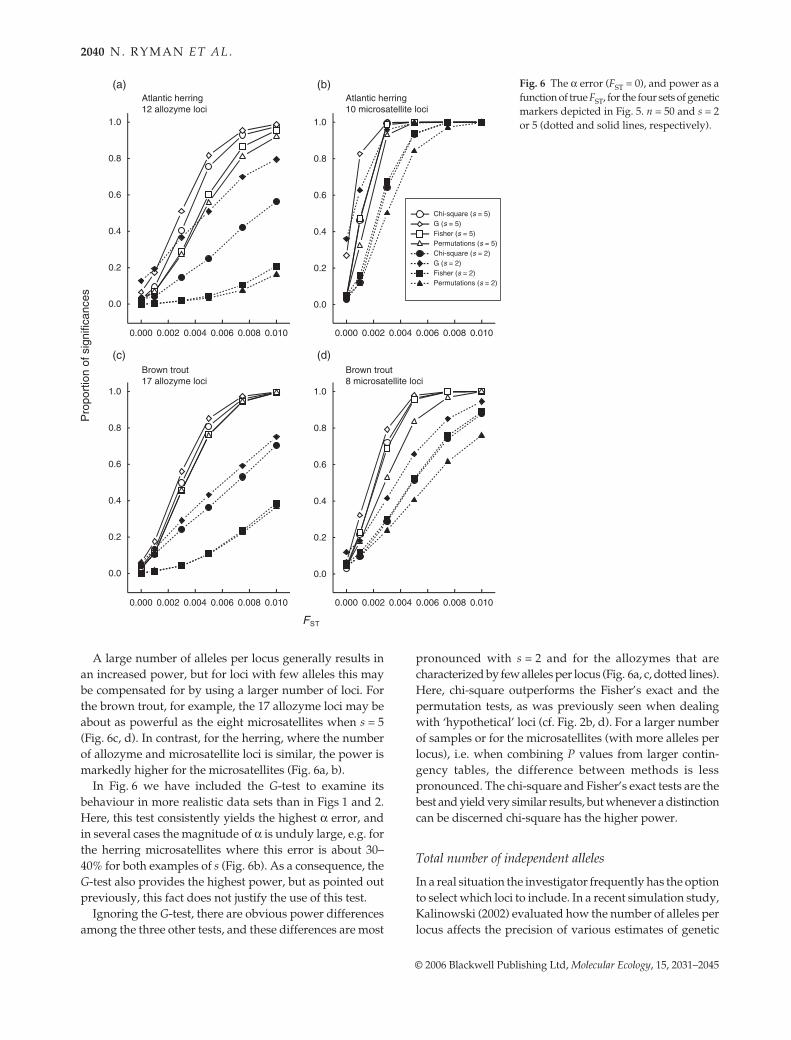
Power curves for the four combinations of species andgenetic markers are shown in Fig. 6 for n = 50, s = 2 or 5,and FST ranging from 0 to 0.01 (FST = 0 representing the αerror). Maybe most important, power may be quite high alsoat fairly low levels of divergence, regardless of statisticalapproach and the set of loci examined. For the herringmicrosatellites, for example, the probability of obtaining asignificant result when sampling from five populationsapproaches 100% for an FST of about 0.003, and the corre-sponding probability is around 50% for an FST as small as0.001 (Fig. 6b). Similarly, power may be high also for theless polymorphic allozymes when a reasonably large numberof loci is scored (Fig. 6a, c).
Fig. 5 Bubble diagram representation ofnumber of loci and average allele frequencydistributions in authentic allozyme andmicrosatellite data sets for Atlantic herring(Ryman et al. 1984; André, unpublished)and brown trout (Palm et al. 2003) used asbase population data in power simulations(Fig. 6). Note that all loci are variable, butthat some variant alleles occur at fairly lowfrequencies (resulting in small ‘bubbles’).
2040 N . R Y M A N E T A L .
© 2006 Blackwell Publishing Ltd, Molecular Ecology, 15, 2031–2045
A large number of alleles per locus generally results inan increased power, but for loci with few alleles this maybe compensated for by using a larger number of loci. Forthe brown trout, for example, the 17 allozyme loci may beabout as powerful as the eight microsatellites when s = 5(Fig. 6c, d). In contrast, for the herring, where the numberof allozyme and microsatellite loci is similar, the power ismarkedly higher for the microsatellites (Fig. 6a, b).
In Fig. 6 we have included the G-test to examine itsbehaviour in more realistic data sets than in Figs 1 and 2.Here, this test consistently yields the highest α error, andin several cases the magnitude of α is unduly large, e.g. forthe herring microsatellites where this error is about 30–40% for both examples of s (Fig. 6b). As a consequence, theG-test also provides the highest power, but as pointed outpreviously, this fact does not justify the use of this test.
Ignoring the G-test, there are obvious power differencesamong the three other tests, and these differences are most
pronounced with s = 2 and for the allozymes that arecharacterized by few alleles per locus (Fig. 6a, c, dotted lines).Here, chi-square outperforms the Fisher’s exact and thepermutation tests, as was previously seen when dealingwith ‘hypothetical’ loci (cf. Fig. 2b, d). For a larger numberof samples or for the microsatellites (with more alleles perlocus), i.e. when combining P values from larger contin-gency tables, the difference between methods is lesspronounced. The chi-square and Fisher’s exact tests are thebest and yield very similar results, but whenever a distinctioncan be discerned chi-square has the higher power.
Total number of independent alleles
In a real situation the investigator frequently has the optionto select which loci to include. In a recent simulation study,Kalinowski (2002) evaluated how the number of alleles perlocus affects the precision of various estimates of genetic
Fig. 6 The α error (FST = 0), and power as afunction of true FST, for the four sets of geneticmarkers depicted in Fig. 5. n = 50 and s = 2or 5 (dotted and solid lines, respectively).

P O W E R F O R D E T E C T I N G D I V E R G E N C E 2041
© 2006 Blackwell Publishing Ltd, Molecular Ecology, 15, 2031–2045
distance, including FST. He showed that similar precisionmay be obtained either by using a large number of loci withfew alleles or fewer loci with many alleles, and that thetotal number of independent alleles is a good indicator ofhow precise the estimates will be. The number of independentalleles at a locus is then defined as the total number ofalleles minus one, and the total number of independentalleles is obtained by summing over loci.
Kalinowski (2002) did not evaluate statistical power, andhis findings are not directly applicable to this issue. This isbecause power is affected, among other things, by the allelefrequency distributions and not only by the number of alleles(e.g. Fig. 2). It is nevertheless interesting to see to whatextent the total number of independent alleles may be anindicator of power.
We conducted a restricted set of simulations aimed ataddressing this question, focusing on a total of 48 independ-ent alleles distributed over 1–48 loci (corresponding to anumber of alleles per locus ranging from 2 to 49; Fig. 7). Underthe conditions of the present simulations (s = 2, n = 50, andFST = 0.005) it appears that power may be about the samewhen examining 48 independent alleles regardless of theirdistribution over loci, provided that (i) all the loci consideredare characterized by the same ‘type’ of allele frequency dis-tributions (uniform vs. skewed), and (ii) the test method ischi-square (Fig. 7). In contrast, when using Fisher’s exact test(or permutations), the total number of independent allelesis not a good indicator of power. As before, combining Pvalues from those tests through Fisher’s method may providean unduly low power for multiple loci with few alleles. Whendealing with many alleles per locus, however, Fisher’s exacttest yields a reasonably good power that may be higher thanfor chi-square at loci segregating for many low-frequencyalleles (Fig. 7b; cf. Fig. 1d). The generality of the extentto which the number of independent alleles is a goodpredictor of power for chi-square warrants further studythough.
Discussion
Our analysis has followed three major lines, i.e. (i) assessingthe magnitude of actual power in some empirical and basichypothetical settings, (ii) comparing the efficiency of a fewstatistical approaches for testing for heterogeneity, and (iii)evaluating in greater detail the phenomenon of a reducedpower when combining multiple exact tests by means ofFisher’s method, particularly in relation to chi-square (cf.Ryman & Jorde 2001).
The major observations may be summarized as follows.First, and as expected, power generally increases with thelevel of differentiation (FST), sample size, number of samples,and the number of loci and alleles, and uniform allelefrequency distributions are better than skewed ones.Second, regardless of the statistical method employed, the
power for detecting divergence may be substantial forfrequently used sample sizes (say 50–100 individuals) andsets of genetic markers (say 5–20 allozyme or microsatelliteloci) also at quite low values of FST (e.g. FST < 0.01). Actually,in many studies using large numbers of highly polymorphicmarkers, the differences that are likely to be detected are so
Fig. 7 Power when scoring 48 independent alleles distributedover different numbers of loci for true FST = 0.005, s = 2, and n = 50.The 48 independent alleles may correspond to a single locuswith 49 alleles, 2 loci with 25 alleles each, etc. (as exemplifiedby numbers in brackets). See text for details. (a) Uniform allelefrequency distributions; (b) skewed allele frequency distributions.All corresponding α errors are around 5% or less (not shown).

2042 N . R Y M A N E T A L .
© 2006 Blackwell Publishing Ltd, Molecular Ecology, 15, 2031–2045
small that it may be questionable if they should be consideredbiologically meaningful for the issue at hand (cf. Waples1998; Hedrick 1999, 2001).
Third, we show that in some situations the choice ofstatistical method may be critical for detecting an existinggenetic structure. Specifically, with a restricted number ofalleles per locus summation of chi-square may outperformFisher’s exact and permutation tests, when the single locusP values from these tests are combined by Fisher’s method.This distinction between methods is most pronounced atskewed allele frequencies and few samples, and some-times the already poor performance of the latter methodsmay decrease further with an increasing number of loci.Single or combined P values from Fisher’s exact test neverdisplay elevated α errors, though, and with large numbersof infrequent alleles the power of this approach may behigher than for chi-square (e.g. Figs 1d and 7b).
Finally, an interesting observation refers to the goodperformance and the apparent robustness of the traditionalchi-square test in situations when it is generally consideredto be unreliable, i.e. for tables with small expected frequencies.On the other hand of the spectrum, the uncorrected G-test(without Williams’s correction) frequently tends to yieldan unduly high proportion of false significances at locisegregating for low-frequency alleles.
Our results extend and support our previous observations(Ryman & Jorde 2001), but here we have examined a widerrange of parameter settings representing more biologicallyrealistic scenarios. In particular, we have focused on average(expected) FST over loci rather than on the same fixedallele frequency difference at all loci, and dealt with alarger assortment of hypothetical and authentic lociincluding those with fairly skewed frequencies. We havealso included unbalanced sampling, and show that thecomparison of quite small samples with large onesrepresents a situation where the chi-square approach mayproduce an excessive rate of false significances at skewedallele frequencies.
Matters not dealt with include tests based on genotypicrather than allelic contingency tables, as suggested forsituations with deviations from random mating (e.g. Goudetet al. 1996; Weir 1996). Our general results on the behaviourof the different test procedures should be valid for any setof contingency tables, however, keeping in mind thatgenotypic tables only contain half as many items and thatthe number of columns (genotypic classes) may be consid-erably larger than for those underlying our present results.Similarly, it remains to be evaluated to what extent othermethods for conducting permutation tests for multipleloci may influence power. We permuted FST at each locusseparately and combined the resulting P values using Fisher’smethod. We recognize, though, that other permutationapproaches are available for multiple loci (e.g. Goudet 1995,2001; Schneider et al. 2000).
We have focused exclusively on power and not addressedthe question of precision of estimates quantifying the amountof genetic divergence. In general, one should expect a higherprecision in situations of high power and vice versa. Forexample, the recent observations of Kalinowski (2005),showing that highly variable loci tend to yield more preciseestimates of genetic distance and FST at similar samplesizes, are in line with our observations that a higher poweris typically obtained with multi-allelic markers.
The tendency of the uncorrected G to provide an inflatedα error has been noted previously (e.g. Sokal & Rohlf 1995).The reason for this phenomenon appears to be that thedistribution of the G statistic frequently exhibits a somewhatlarger mean and variance than the theoretical χ2 distributionit is expected to follow asymptotically. Although notnecessarily constituting a large problem for a single G value,summation of multiple Gs (as when combining informationfrom multiple loci) may yield a distribution located far tothe right of the corresponding one expected for the summedχ2 distribution, thus resulting in a dramatically increased αerror (cf. Ryman & Jorde 2001).
The reason why combining P values from Fisher’s exact(or the permutation) test sometimes yields a poor power isdiscussed by Ryman & Jorde (2001). In brief, Fisher’s exacttest is conditional on both the row and column margins ofthe contingency table evaluated, restricting the number ofpossible P values that can occur for a given set of margins.This discreteness may result in a smaller realized α thanexpected from the intended one, and this phenomenon ismost pronounced for small contingency tables with largedifferences between the row or column totals (as withpronounced unbalanced sampling or highly skewed allelefrequencies). Expressed differently, when H0 is true the pro-portion of significances (e.g. P < 0.05) occurs in a frequencyof less than 5% (cf. Fig. 2 in Ryman & Jorde 2001), and thedifficulty to obtain a significant exact P value is amplifiedwhen combining multiple values by means of Fisher’smethod.
Although Fisher’s exact test is commonly applied whentesting for allele frequency differences, it is arguable whetherthe underlying model is the most appropriate in thiscontext. There is an ongoing discussion among statisticians(e.g. Mehta & Patel 1997; Agresti 2001) on when to applydifferent procedures for conducting an ‘exact’ contingencyprobability test. For example, Sokal & Rohlf (1995; p. 727and onwards) discuss three models (I–III) where the Fishertest is of type III, conditional on both row and column totalsbeing fixed. The type II model has either row or columntotals fixed, whereas type I only has the grand total samplesize fixed. Type I and II model tests are expected to providea smaller degree of discontinuity due to the larger number oftables being evaluated. Thus, it is possible that the problemwith small realized α errors, that in some situations char-acterizes the Fisher test, is less pronounced for type I and

P O W E R F O R D E T E C T I N G D I V E R G E N C E 2043
© 2006 Blackwell Publishing Ltd, Molecular Ecology, 15, 2031–2045
II tests. The issue of the exact test procedure most suitablefor genetic data warrants further investigation, though.
Implications for data analysis
Our present estimates of α and power may serve as guide-lines for investigators evaluating existing data or planninga study. For example, the results for brown trout and herring(Fig. 6) should be possible to use as crude approximationsfor other authentic data sets with similar numbers of lociand allele frequencies. Still, we have only evaluated powerfor a very restricted combination of parameter values. Thus,we recommend power simulations of the type conductedhere whenever there is uncertainty regarding the mostappropriate choice of loci, statistical method, etc. In fact,this is the only way to address central questions raisedby the present paper. Such questions include assessing,for a particular situation, what is to be considered a ‘small’contingency table, ‘few’ alleles or samples, or ‘skewed’allele frequencies. To this effect we have developed andmade available a reasonably user friendly version of thesimulation program used for this study (powsim; Ryman &Palm in press).
Assessment of power does not only provide a means fordesigning a study with ‘high resolution’. It may also help toavoid wasting resources on studies that are unnecessarilypowerful for the question at hand. Considering the herringmicrosatellite results in Fig. 6(b), for example, it is clearthat scoring as much as 10 loci may be excessive for aninvestigator sampling five populations and only beinginterested in detecting divergence corresponding to anFST of 1% or more. Similarly, when scoring these 10 loci itwould be enough to only sample two populations ratherthan five (or to reduce the number of individuals per sample),for maintaining a power close to unity when addressingthis particular question. On the other hand, in situationswhere the interest is focused on detecting very small dif-ferences, such as when testing for temporal changes withina population (where the temporal ‘drift signal’ is inverselyproportional to 2Ne), not even the power provided by the10 herring microsatellites may be sufficient.
The primary focus of this study refers to the questionhow to combine the information from multiple loci. Withrespect to a single locus (contingency table), it is clear thatan exact test should be preferred before an approximateone. With multiple loci, however, the method of choicemay vary from case to case, and it is frequently not clearwhat approach is ‘best’. Most importantly, we have shownthat Fisher’s exact test (with multiple loci) is sometimesassociated with a remarkably low power. Investigatorsshould be aware of this fact and act accordingly whenconsidered appropriate, for example through conductingadditional tests such as chi-square. We have recently madea computer program available that tests for genetic differ-
entiation using both chi-square and Fisher’s exact test(chifish; Ryman 2006).
The apparent superiority of the chi-square approach inmany situations when dealing with few alleles per locusmay seem of minor importance considering the dominanceof highly variable DNA markers in contemporary studies.It must be noted, though, that the generally preferred typeof marker changes continuously, and that loci with fewalleles may again be widely used. For example, di-allelicSNPs are foreseen to be commonly applied in the future(e.g. Brumfield et al. 2003; Morin et al. 2004). Thus, ourresults on remarkably low power when using Fisher’smethod (e.g. as in genepop) to combine exact or permutedP values from multiple loci with two alleles (Fig. 2b, d)seem highly pertinent. This is particularly so because asmall number of alleles per locus, as for SNPs, is likely tobe compensated for by screening an increasingly largernumber of loci (cf. Morin et al. 2004).
Similarly, the fact that the lack of power when combiningP values with Fisher’s method is most pronounced whencomparing two samples may also seem of little importancewhen current studies on population structure are commonlybased on a considerably larger number of samples. However,the extensive use of pairwise sample comparisons as a basisfor data analysis and presentation justifies a serious concernregarding a potential lack of power in studies dealing withfew allele loci.
Concluding remarks
On the basis of the present observations we recommendthe following:
1 Assess power and α before launching a study. This canbe done either through simulation, or more crudelythrough comparisons with estimates from similar inves-tigations. For example, investigators should seriouslyconsider whether the sample sizes and numbers of lociand alleles commonly used are really necessary for theparticular question at hand.
2 When only considering a single locus (e.g. mitochondrialDNA) or contingency table, an exact test should be applied(rather than an approximation such as chi-square).
3 The uncorrected G-test should be avoided because of itstendency to produce excessive rates of false significances.Although not evaluated systematically in this study, itappears that application of Williams’s correction reducesthis rate substantially (to levels similar to those of chi-square).
4 Be aware that combining exact P values from multiplecontingency tables (loci) by means of Fisher’s methodmay under some circumstances result in a very low power.The risk for this phenomenon is most pronounced inpairwise sample comparisons when dealing with di-allelic loci with skewed allele frequencies.

2044 N . R Y M A N E T A L .
© 2006 Blackwell Publishing Ltd, Molecular Ecology, 15, 2031–2045
5 When the results from multiple Fisher’s tests tend toyield an unduly low power, summation of Pearson’straditional chi-square may constitute a good alternative.Chi-square seems to be more robust than commonlyappreciated. The risk for an inflated α error should stillbe considered, though, particularly in situations whencomparing small samples (say n < 20–30) with largerones at loci with skewed allele frequencies.
6 In cases with several multi-allelic loci (e.g. 10 or morealleles), using Fisher’s method to combine P values obtainedby Fisher’s exact test seems to constitute the method ofchoice, because of a generally high power and an apparenttendency not to exceed the intended α level.
7 When in doubt of whether to apply the Fisher’s exactor chi-square test, power (and α) evaluations should beconducted. If this is not feasible we recommend that bothtests are performed and their outcomes reported.
8 The relative merits of various statistical approacheswhen testing for homogeneity at multiple loci need to beexamined in greater detail. In particular, the appropri-ateness of applying Fisher’s exact test (that assumes thatboth column and row totals are fixed) should be reviewed.Similarly, the performance of G with Williams’s correctionand of various multilocus permutation procedures needfurther evaluation.
9 Several conclusions of this paper are not restricted to testsfor genetic heterogeneity; they are valid in general whenanalysing contingency tables separately or in combination.
Acknowledgements
We thank the subject editor Phil Hedrick and three anonymousreviewers for comments on earlier versions of this paper. This workis part of the research project HERGEN (www.hull.ac.uk/hergen/)funded by the European Union within the Framework Programme5. The study was also supported by grants to N.R. from theSwedish Research Council. Additional funding to C.A and L.L.was provided from the Swedish Research Council for Environment,Agricultural Sciences and Spatial Planning (Formas).
References
Agresti A (2001) Exact inference for categorical data: recentadvances and continuing controversies. Statistics in Medicine, 20,2709–2722.
Brumfield RT, Beerli P, Nickerson DA, Edwards SV (2003) Theutility of single nucleotide polymorphisms in inferences ofpopulation history. Trends in Ecology & Evolution, 18, 249–256.
Choy SC, Weir BS (1978) Exact inbreeding coefficients in popula-tions with overlapping generations. Genetics, 89, 591–614.
Erdfelder E, Faul F, Buchner A (1996) gpower: a general poweranalysis program. Behavior Research Methods, Instruments andComputers, 28, 1–11.
Goudet J (1995) fstat (version 1.2): a computer program to calculateF-statistics. Journal of Heredity, 86, 485–486.
Goudet J (2001) FSTAT: A program to estimate and test gene diversities and
fixation indices (version 2.9.3). Available from www.unil.ch/izea/softwares/fstat.html. Updated from Goudet (1995).
Goudet J, Raymond M, de Meeüs T, Rousset F (1996) Testingdifferentiation in diploid populations. Genetics, 144, 1933–1940.
Hedrick PW (1999) Highly variable loci and their interpretation inevolution and conservation. Evolution, 53, 313–318.
Hedrick PW (2001) Conservation genetics: where are we now?Trends in Ecology & Evolution, 16, 629–636.
Kalinowski ST (2002) How many alleles per locus should be usedto estimate genetic distances? Heredity, 88, 62–65.
Kalinowski ST (2005) Do polymorphic loci require large samplesizes to estimate genetic distances? Heredity, 94, 33–36.
Mehta C, Patel N (1997) STATXACT for Windows. Statistical Software forExact Nonparametric Inference. User Manual. CYTEL SoftwareCorporation, Cambridge, Massachusetts.
Morin PA, Luikart G, Wayne RK, the SNP workshop Group (2004)SNPs in ecology, evolution and conservation. Trends in Ecology& Evolution, 19, 208–216.
Nei M (1975) Molecular Population Genetics and Evolution. North-Holland, Amsterdam, The Netherlands.
Nei M (1987) Molecular Evolutionary Genetics. Columbia UniversityPress, New York.
Neuhäuser M (2003) Tests for genetic differentiation. BiometricalJournal, 45, 974–984.
Neuhäuser M (2004) Testing whether any of the significant testswithin a table is indeed significant. Oikos, 106, 409–410.
Palm S, Dannewitz J, Järvi T, Petersson E, Prestegaard T, Ryman N(2003) Lack of molecular genetic divergence between sea-ranched and wild sea trout (Salmo trutta). Molecular Ecology, 12,2057–2071.
Peterman RM (1990) Statistical power analysis can improvefisheries research and management. Canadian Journal of Fisheriesand Aquatic Sciences, 47, 2–15.
Petit E, Balloux F, Goudet J (2001) Sex-biased dispersal in a migratorybat: a characterization using sex-specific demographic parameters.Evolution, 55, 635–640.
Raymond M, Rousset F (1995a) genepop (version 1.2): populationgenetics software for exact tests and ecumenicism. Journal ofHeredity, 86, 248–249.
Raymond M, Rousset F (1995b) An exact test for population differ-entiation. Evolution, 49, 1280–1283.
Rohlf FJ (1987) BIOM. A Package of Statistical Programs to Accompanythe Text of Biometry. Applied Biostatistics, Inc., New York.
Ryman N, Palm S (in press) powsim – a computer program forassessing statistical power when testing for genetic differenti-ation. Molecular Ecology Notes.
Ryman N (2006) chifish: a computer program testing for geneticheterogeneity at multiple loci using chi-square and Fisher’sexact test. Molecular Ecology Notes, 6, 285–287.
Ryman N, Jorde PE (2001) Statistical power when testing forgenetic heterogeneity. Molecular Ecology, 10, 2361–2373.
Ryman N, Lagercrantz U, Andersson L, Chakraborty R,Rosenberg R (1984) Lack of correspondence between geneticand morphologic variability patterns in Atlantic herring (Clupeaharengus). Heredity, 53, 687–704.
Schneider S, Roessli D, Excoffier L (2000) ARLEQUIN: A software forpopulation genetics data analysis, version 2.000. Genetics andBiometry Laboratory, Department of Anthropology, Universityof Geneva, Switzerland.
Sokal RR, Rohlf FJ (1995) Biometry. 3rd edn. W.H. Freeman,New York.

P O W E R F O R D E T E C T I N G D I V E R G E N C E 2045
© 2006 Blackwell Publishing Ltd, Molecular Ecology, 15, 2031–2045
Waples RS (1998) Separating the wheat from the chaff: patterns ofgenetic differentiation in high gene flow species. Journal ofHeredity, 89, 438–450.
Weir BS (1996) Genetic Data Analysis II. Sinauer Associates,Sunderland, Massachusetts.
Weir BS, Cockerham CC (1984) Estimating F-statistics for theanalysis of population structure. Evolution, 38, 1358–1370.
Yeh FC, Yang R-C, Boyle T et al. (1997) POPGENE (version 1.31), theuser-friendly shareware for population genetic analysis. MolecularBiology and Biotechnology Centre. University of Alberta,Canada. http://www.ualberta.ca/∼fyeh/info.htm.
All coauthors share an interest in understanding the mechanismsthat drive population structure in aquatic organisms, both marineand freshwater. This paper resulted from interactions within aEuropean Union funded project, HERGEN, the primary aim ofwhich was to examine the genetic population structure of Atlanticherring in the North Sea and adjacent areas, and to use theinformation in the context of management and sustainable use ofaquatic resources.