power generation from combusted syngas using hybrid
TRANSCRIPT

Journal of Thermal Engineering, Vol. 4, No. 4, Special Issue 8, pp. 2149-2168, June, 2018 Yildiz Technical University Press, Istanbul, Turkey
This paper was recommended for publication in revised form by Regional Editor Balaram Kundu 1Department of Electrical and Electronics Engineering, Karunya University, Coimbatore, Tamil Nadu, India; 2Department of Mechanical Engineering, Karunya University, Coimbatore, Tamil Nadu, India 3Fluid Mechanics, Thermal Engineering and Multiphase Flow Research Lab. (FUTURE), Department of Mechanical Engineering, Faculty of Engineering, King Mongkut’s University of Technology Thonburi, Bangmod, Bangkok 10140, Thailand. 4The Academy of Science, The Royal Institute of Thailand, Sanam Suea Pa, Dusit, Bangkok 10300, Thailand *E-mail address: [email protected]; Manuscript Received 8 August 2017, Accepted 18 October 2017
POWER GENERATION FROM COMBUSTED “SYNGAS” USING HYBRID
THERMOELECTRIC GENERATOR AND FORECASTING THE PERFORMANCE
WITH ANN TECHNIQUE
Appadurai Anitha Angeline1,*, Jayaraj Jayakumar1, Lazarus Godson Asirvatham2,
Somchai Wongwises3,4
ABSTRACT
Gasification and combustion of de-oiled Pongamia Pinnata seed cake is done to produce higher energy
biomass waste heat “syngas” for generating power using hybrid thermoelectric generator (TEG). A test rig is
fabricated and experiments conducted with synthetic oil (Therminol-55) as the heating fluid under water and air-
cooled methods. The hot side temperature is varied from 200 - 250ºC while the coolant temperature is maintained
at 30 oC for both water and air respectively. Experimental results showed 22.27% enhancement in electric power
at a constant hot side temperature of 250 ºC under water cooled method. In addition, simulation results for the
above mentioned conditions using artificial neural networks (ANN) tool in MATLAB also agreed well with the
sample experimental results. The performance parameters such as open circuit voltage, maximum output power
and matched load resistance are forecasted using ANN upto maximum possible hot side temperature of 350ºC.
Further, the financial evaluation of Biomass gasified-thermoelectric system ($0.0018/kWh and in terms of Indian
currency is ₨ 0.0676/kWh) is found to be almost negligible on comparison with other available renewable energy
technologies.
Keywords: Pongamia, ANN, Hybrid, Performance Parameters, Synthetic Oil, Thermoelectric
Generator, Cost Analysis
INTRODUCTION
Despite cyclic changes in climate, generating stations such as thermal, nuclear and geothermal power
plants and large scale industries such as automobile, glass and aluminum factories, waste incinerators operate
incessantly every day, all through the year. These systems give out very high temperature heat as losses to the
atmosphere. In reality, this high temperature waste heat (about 450 – 650ºC) is absorbed using cold water and sent
out to the surroundings as medium temperature waste heat (about 250 – 350ºC) which can be used for directly
converting heat to electricity using the thermoelectric generator. Employing synthetic oil as heating fluid rather
than using ordinary water, results in increased heat transfer rate and is suitable for temperatures upto 350ºC at
atmospheric pressure conditions. This recovered energy can either be harvested or stored in batteries to power
small equipments or used for lighting purposes.
Several researchers have analytically and experimentally studied the performance of different
commercially available thermoelectric generators using waste heat from automobiles, biomass cook stoves, heat
lost from solar panels and so on. Some of their findings are briefly discussed:
Prakash et al [1] recovered the surface waste heat of an IC engine using thermoelectric generators and
observed that about 4 to 9W of power is obtained from a 4×4 cm2 surface area of silencer. Su et al [2] developed
a prototype “Warrior” for harvesting waste energy from automobiles. The performance parameters at 312ºC hot
side temperature and 69ºC cold side temperature were analyzed using the revolving drum test. Chandy et al [3]
developed an Automobile Exhaust Thermoelectric heat exchanger system using ANSYS and analyzed its
performance at 269K cold side temperature and 600 - 1200K hot side temperatures. Results showed that the overall
performance of the system increased with increase in engine speed and a 64.6% enhancement in voltage was
observed when the hot side temperature varied from 600 – 1200K.

Journal of Thermal Engineering, Research Article, Vol. 4, No. 4, Special Issue 8, pp. 2149-2168, June, 2018
2150
Deok et al [4] connected two types of thermoelectric modules to the exhaust port of the diesel engine and
studied the various performance characteristics using different shapes of heat sinks at different thermal conditions.
It was observed that the rectangular heat sink produced maximum power output with 11.29% increase in power
when compared with that of forward and reverse –facing triangular prism heat sinks at 80ºC cold side temperature.
Liu et al [5] proposed a two-stage thermoelectric generator connected to the vehicle exhaust pipe using a heat pipe
and found that a maximum power of 250W and an enhanced thermal efficiency of 5.37% were obtained at the hot
side temperature of 473K. Liu et al [6] conducted experiments on a novel prototype active solar thermoelectric
radiant wall (ASTRW) system for winter operation modes. Results showed that the ASTRW system not only
eliminates conventional building thermal losses but also provide a heating capacity for space heating. As the solar
irradiation intensity increases, the interior surface temperature of the ASTRW system also increased
Alomair et al [7] developed a solar –thermoelectric liquid chiller (STLC) system and analyzed the
performance analytically and experimentally at different temperature conditions. It was observed that the heat
removal rate of the STLC system increases with increasing bulk temperature of the chiller unit. Liu et al [8]
proposed a new active solar thermoelectric radiant wall (ASTRW) system that reduces general requirements of the
air conditioning system in which the mean inner surface temperature of the system was found to be lower than that
of the room temperature. Ӧzdemir et al [9] modeled a solar heating thermoelectric generator employing a cooling
wind chimney for effective electrical power generation. The generated power output depends upon the temperature
differences available across the modules. Liu et al [10] conducted experiments on a prototype solar-thermoelectric
cooled ceiling along with displacement ventilation (STCC-DV) system under heating and cooling modes. Results
showed that any decrease in the temperature difference between ambient and indoor temperature, leads to a
significant increase in the total heat flux and a co-efficient of performance in both the heating and cooling modes.
Killander and Bass [11] integrated two thermoelectric generators placed on an aluminum plate, on the
outer walls of a wood-fed stove in Northern Sweden. During the early hours, the thermoelectric generator output
was about 10W as the ambient temperature was less and the wooden stove was being kindled regularly. When the
temperature became steady during the day, the generator output varied between 4-7W. Shaughnessy et al [12]
integrated a thermoelectric generator to a portable cooking stove. For testing purpose, original heat source was
replaced by cartridge heaters with variable power supply and the cold side temperature was maintained constant
using a water flow loop. An output of 3.9W was obtained at a temperature difference of 230ºC. Champier et al
[13] connected four peltier modules in series and placed it on top of an aluminum block supplied by a 2.2kW gas
heater. The individual performance of each module was verified and the maximum power output of each module
was found to vary between 1.7 - 2.3W. The net series power output of the four modules was about 7W. Rida et al
[14] integrated a thermoelectric generator to the side walls of a wooden stove and obtained an output power of
4.2W at a temperature gradient of about 152ºC. Lertsatithanakorn [15] studied the performance of a thermoelectric
generator integrated to a biomass cook stove (BITE) that produced about 2.4W at 150ºC temperature difference
which was adequate to run a small radio or light an incandescent light bulb.
Moreover, a theoretical study has been carried out by the present authors using the hybrid TEG. The hot
side temperature is varied upto 350°C and a maximum power output of 21.7W was attained at maximum allowable
hot side temperature (350°C) and minimum allowable cold side temperature (30°C) at a matched load resistance
of 0.97Ω [16,31]. Similar studies have also been carried out by different authors [17-30,43].
Based on the above mentioned literature, it is pragmatic that the researchers have performed experimental
investigations on recovered waste heat from biomass cookstoves, automobile exhaust, heat lost from solar panels
for power generation using Bismuth Telluride thermoelectric generators. It is reported that the thermoelectric
power generated varied from 0.5W to 5.3W for an average temperature difference of 80 – 200ºC. Furthermore,
very few work has been reported till date in open literature based on power generation using a hybrid thermoelectric
generator and synthetic oil as heat transfer liquid. Besides, the obtained experimental results clearly indicate that
the power generation rate increases with increase in thermoelectric generator hot side temperature for a fixed cold
side temperature. But there are certain problems faced by the researchers while performing experiments : huge
system losses due to energy imbalance, heat lost to the surroundings due to improper insulation, increase in thermal
contact resistances owing to less clamping force, inaccurate measurement of hot and cold side temperatures using
thermocouples that are inserted into heating blocks leading to non-uniform surface temperature distribution, non-
uniform material properties due to uncertainties in the manufacturing process. These shortcomings lead to reduced
performance of the thermoelectric generators. To overcome these drawbacks, Artificial Neural Networks (ANN) is
Journal of Thermal Engineering, Research Article, Vol. 4, No. 4, Special Issue 8, pp. 2149-2168, June, 2018
2151
one of the most effective and efficient ways of predicting the performance of thermoelectric generators with high
prediction accuracy.
In the present work, an experimental test facility is fabricated. It is suggested that gasified Pongamia de-
oiled seed cake, on combustion produces higher energy biomass waste heat (250 – 350ºC) which can be used for
power generation using the thermoelectric system. Based on the obtained temperature range, laboratory based
experiments are carried out at the hot side temperature ranging from 200 – 250ºC and the coolant temperature
maintained at ambient conditions (about 30ºC). Therminol-55 is used as the heat transfer fluid over the hot side
with water and air cooled techniques employed over the cold side. Using the sample experimental values, the
artificial neural networks tool in MATLAB is utilized and the performance of the hybrid thermoelectric generator
(TEG1-PB-12611-6.0) at the hot side temperatures ranging from 200 – 250ºC and at ambient cold side conditions
(about 30ºC) is analyzed. The simulated ANN parameters are compared with sample experimental results and
based on the closeness between both the methodologies; the performance of thermoelectric system employing
synthetic oil as heat transfer fluid (upto a maximum temperature gradient of 320ºC) is estimated even without
actually performing the experiments.
BIOMASS WASTE MANAGEMENT
Non-edible oil from Jatropha (Jatropha curcas) and Karanja (Pongamia pinnata) plants are recognized
as India’s main source of biodiesel production (Planning Commission, Government of India, 2003). One hectare
of cultivated Pongamia Pinnata trees supply about 7.7 tons of Pongamia seeds that can yield 1.8095 tons of
Pongamia oil and 5.8905 tons of de-oiled seed cake [32]. The de-oiled seed cakes can neither be used as animal
feed or fertilizer due to its bitterness and toxicity. Hence, disposal of these de-oiled cakes is of huge concern. It is,
therefore, recommended to use this de-oiled seed cake for syngas generation. Gasification of the de-oiled Pongamia
seed cake results in production of “syngas”. The generated synthesis gas can be directly used for operating engines,
heating, lighting and cooking purposes. Heat energy produced on combustion of generated “syngas” can be used
for direct conversion of heat into electricity using a thermoelectric generator. The slag left behind gasification
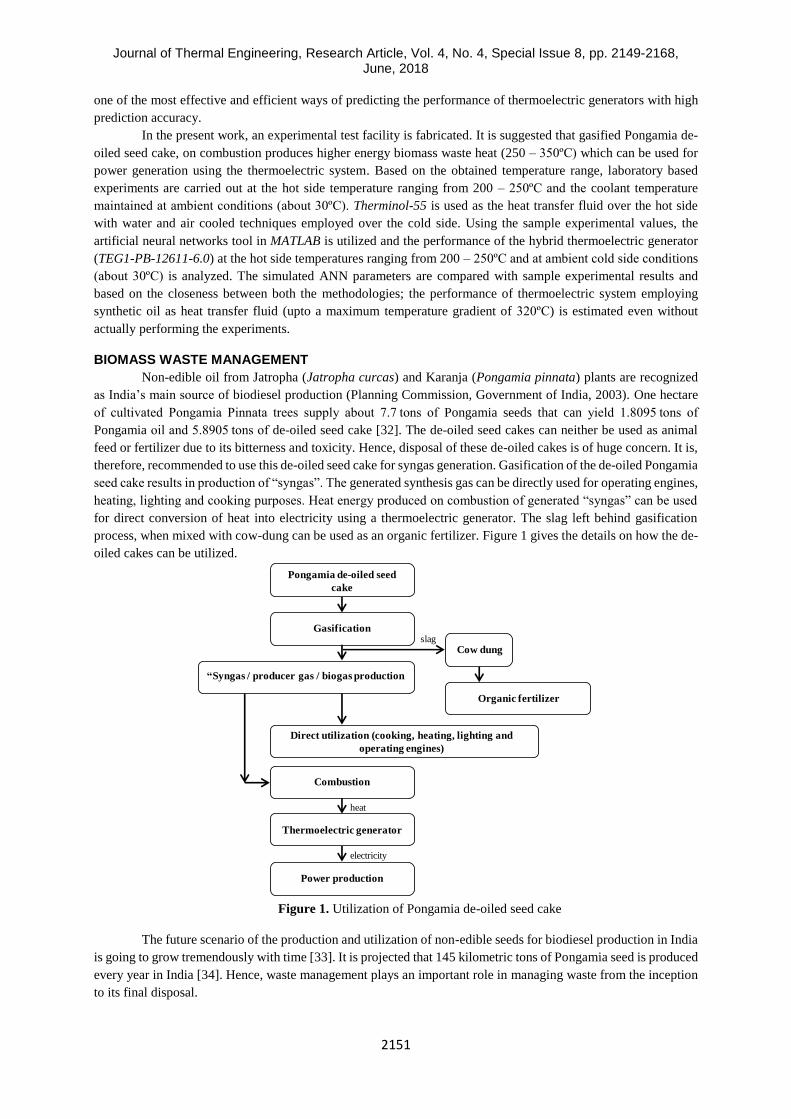
process, when mixed with cow-dung can be used as an organic fertilizer. Figure 1 gives the details on how the de-
oiled cakes can be utilized.
Figure 1. Utilization of Pongamia de-oiled seed cake
The future scenario of the production and utilization of non-edible seeds for biodiesel production in India
is going to grow tremendously with time [33]. It is projected that 145 kilometric tons of Pongamia seed is produced
every year in India [34]. Hence, waste management plays an important role in managing waste from the inception
to its final disposal.
Pongamia de-oiled seed
cake
Gasification
“Syngas / producer gas / biogas production
Direct utilization (cooking, heating, lighting and
operating engines)
Combustion
Thermoelectric generator
Power production
Cow dung
Organic fertilizer
heat
electricity
slag

Journal of Thermal Engineering, Research Article, Vol. 4, No. 4, Special Issue 8, pp. 2149-2168, June, 2018
2152
GASIFICATION PROCESS
Pongamia de-oiled seed cake is gasified at 700ºC using a fluidized bed reactor in which the biomass based
carbon-rich material is converted into a resultant gas mix “syngas”, a combination of carbon monoxide and
hydrogen. Combustion of the resultant gas mix “syngas” resulted in pollution free, low-cost heat energy
(renewable) as the gasified compounds are obtained from organic biomass [35]. Proximate and Ultimate Analysis
of Pongamia de-oiled seed cake is done and the results obtained are given in Table 1. On combustion of the
collected “syngas”, a temperature of about 250 - 350ºC is achieved. This heat energy can be given as an input to
the hot side of the hybrid TEG unit. For experimentation purpose, the heat energy generated by combustion of
gasified Pongamia de-oiled seed cake is mimicked by an electrical heater.
Table 1. Proximate and Ultimate Analysis of Pongamia de-oiled seed cake
Proximate Analysis (wt%) Ultimate Analysis (wt%)
Moisture 7.09 Moisture 7.09
Ash 3.53 Mineral matter 7.80
Volatile Matter 78.03 C 65.84
Fixed Carbon 11.35 H 6.5
N 4.5
S 1.37
O 6.0
GCV (Kcal/kg) 4622
GAS CHROMATOGRAPHY
Gas chromatography is usually done to separate and analyze the different compounds that can be
vaporized without any decomposition at higher temperatures. When the gas mixture is separated into individual
components, it is easy to qualitate and quantitate the amount of the individual samples present in the mixture.
Initially, the biomass waste is burnt in a reactor which is powered by a dimmerstat. The gases obtained are collected
in a bladder through a gas tube. The obtained gas mixture is connected to the gas chromatograph for separation
and further analysis. Figure 2 shows the main structure of a basic gas chromatograph.
Figure 2. Process structure of a basic gas chromatograph.
The gas samples were analyzed using SHIMADZU GC-2014 equipped with TCD detector and shin carbon
ST column (100/120 mesh, 2 m and 1 mm I.D). Nitrogen is used as the carrier gas and the flow rate is maintained
at 10 ml min-1. The nitrogen gas is passed through the purifier before entering in GC and gas sample (about 0.5
ml) is injected into the injection port using a gas sampler. The gas samples are vaporized in the injection port. The
vaporized gases (solutes) are transferred to the column using the carrier gas. The column is usually placed in a
temperature controlled oven and the oven temperature is kept at 40oC for 3 minutes and then raised to 250oC at a
rate of 8oC min-1 and then the same temperature is maintained for about 10 minutes. Now, the solutes move through
the column at different rates. The fastest moving solute leaves the column first pursued by the other solutes in the
consequent order. The standard gas with known composition is used for calibration prior to the analysis of gas
samples. The eluted solutes enter the heated detector. When a solute hits the detector, a signal is being generated.
The size of the generated electronic signal is recorded using a data processor and a graph is plotted against the
Gas Chromatograph
Injection port
Gas Cylinder
Carbon ST Column TCD Detector
DataProcessor
Carrier gas controller
Temperature controlled
oven

Journal of Thermal Engineering, Research Article, Vol. 4, No. 4, Special Issue 8, pp. 2149-2168, June, 2018
2153
elapsed time to create a chromatogram. The chromatogram of syngas obtained by gasification of Pongamia de-
oiled seed cake is shown in Figure 3. The details of the concentration and peak retention time of the various gas
components are given in Table 2. The various syngas compositions generated at 700ºC and ER 0.19 is tabulated
in Table 3.
Figure 3. Chromatogram of “syngas” by gasification of Pongamia de-oiled seed cake
Table 2. Peak Values of “syngas” components
Peak
No
Name Retention
Time
Concentration Unit Area
(mm2)
Height
(mm)
1 H2 1.022 8.744 % 594441 69002
2 CO 2.271 9.656 % 53407 4914
3 CH4 4.520 7.118 % 291268 16825
4 CO2 8.894 8.603 % 323265 7083
5 C2H2 14.243 0.428 % 18934 1395
6 C2H4 15.608 6.510 % 86729 3874
7 C2H6 17.930 1.541 % 46764 2787
Total 1414809 106600
Table 3. “Syngas” compositions generated at 700oC, ER 0.19
EXPERIMENTAL INVESTIGATION
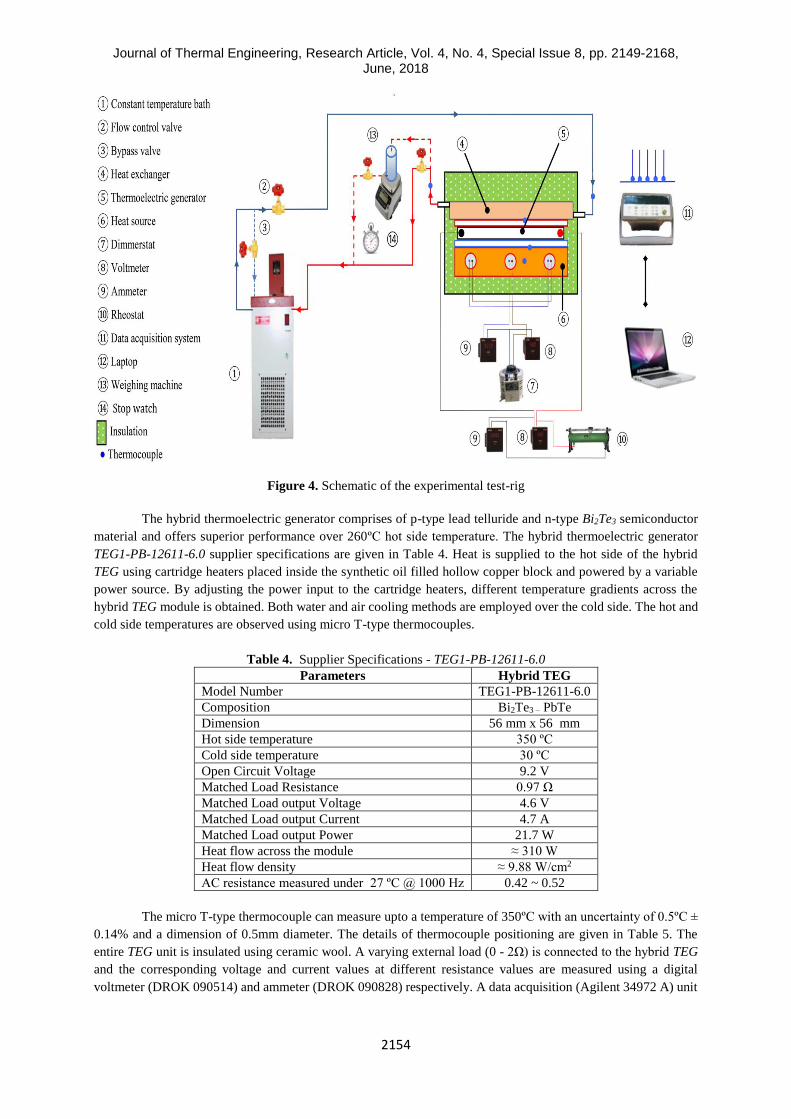
In order to study the performance of the hybrid thermoelectric generator at different temperatures, an
experimental test facility is fabricated. The schematic of the experimental test facility is given in Figure 4. The
details of fabrication of test facility are published elsewhere [36]. The solid copper block is replaced by an
equivalent hollow copper block filled with synthetic oil (Therminol-55). It consists of a hollow copper block,
hybrid TEG, heat exchanger, external load resistance and a data acquisition unit. The hybrid TEG is placed between
the hollow copper block over the hot side and a heat exchanger on the cold side. Two Cartridge heaters with
variable power supply are placed inside the hollow copper block filled with heating fluid to maintain a temperature
gradient across the hybrid TEG. The whole TEG unit is insulated using ceramic wool to avoid the heat loss into
the atmosphere. The hybrid TEG module is held tightly between the copper block on the hot side and a heat
exchanger unit on the cold side of the hybrid TEG module by compression method. Clamping is done using two
stainless steel screws of 5mm diameter on either side of the hybrid TEG at a distance of 0.5inches from the sides
of the TEG with 0.3kgm torque per screw. A clamping force of 5kgs is applied to hold tightly the hybrid TEG
module in order to reduce the thermal contact effect. The pressure load is calculated to be 0.176kgcm-2 based on
the applied 5kg weight. The screws were tightened evenly in small increments. The design, screw diameter, number
of screws and the torque per screw are chosen based on the power module installation notes supplied by Thermal
Electronics Corporation, Canada.
Gas Composition (mole %) and Lower heating value (LHV)
H2 CO CO2 CH4 C2H2 C2H4 C2H6 LHV
(MJ/Nm3)
8.744 9.656 8.603 7.118 0.428 6.51 1.541 5.22
Journal of Thermal Engineering, Research Article, Vol. 4, No. 4, Special Issue 8, pp. 2149-2168, June, 2018
2154
Figure 4. Schematic of the experimental test-rig
The hybrid thermoelectric generator comprises of p-type lead telluride and n-type Bi2Te3 semiconductor
material and offers superior performance over 260ºC hot side temperature. The hybrid thermoelectric generator
TEG1-PB-12611-6.0 supplier specifications are given in Table 4. Heat is supplied to the hot side of the hybrid
TEG using cartridge heaters placed inside the synthetic oil filled hollow copper block and powered by a variable
power source. By adjusting the power input to the cartridge heaters, different temperature gradients across the
hybrid TEG module is obtained. Both water and air cooling methods are employed over the cold side. The hot and
cold side temperatures are observed using micro T-type thermocouples.
Table 4. Supplier Specifications - TEG1-PB-12611-6.0
Parameters Hybrid TEG
Model Number TEG1-PB-12611-6.0
Composition Bi2Te3 – PbTe
Dimension 56 mm x 56 mm
Hot side temperature 350 ºC
Cold side temperature 30 ºC
Open Circuit Voltage 9.2 V
Matched Load Resistance 0.97 Ω
Matched Load output Voltage 4.6 V
Matched Load output Current 4.7 A
Matched Load output Power 21.7 W
Heat flow across the module ≈ 310 W
Heat flow density ≈ 9.88 W/cm2
AC resistance measured under 27 ºC @ 1000 Hz 0.42 ~ 0.52
The micro T-type thermocouple can measure upto a temperature of 350ºC with an uncertainty of 0.5ºC ±
0.14% and a dimension of 0.5mm diameter. The details of thermocouple positioning are given in Table 5. The
entire TEG unit is insulated using ceramic wool. A varying external load (0 - 2Ω) is connected to the hybrid TEG
and the corresponding voltage and current values at different resistance values are measured using a digital
voltmeter (DROK 090514) and ammeter (DROK 090828) respectively. A data acquisition (Agilent 34972 A) unit

Journal of Thermal Engineering, Research Article, Vol. 4, No. 4, Special Issue 8, pp. 2149-2168, June, 2018
2155
is used to record the necessary vital data for additional processing. Laboratory based experiments are carried out
and the corresponding findings are noted.
Table 5. Thermocouple positioning
Thermocouple Position Measurement (ºC)
T1 Hot side copper block Heater temperature
T2 Between copper block and hot side of TEG Hot side temperature
T3 Between cold side of TEG and copper block Cold side temperature
T4 Water inlet port Inlet water temperature
T5 Water outlet port Outlet water temperature
WATER-COOLING TECHNIQUE
In water cooling method – forced convection method, water is being used as the coolant. A hollow copper
block filled with water is fixed to the cold side of the hybrid TEG to remove the residual heat energy. A constant
temperature bath is used to maintain the coolant water temperature at 30ºC. The flow rate of the coolant was
controlled using a flow control valve. The flow rates are measured by direct weighing of the fluid (100ml). The
time measurements were repeated for more than ten times and the average value was considered and the measuring
error of the flow rate was found to be less than 1.5%. The flow rate of the coolant is fixed at 0.5l/min using a flow
control valve [36]. The test-section of the hybrid TEG with water as the coolant is shown in Figure 5a.
Figure 5a. Test section – forced convection
The water flow loop heat exchanger is a hollow copper block with a single inlet and outlet port. Water is
being used as a coolant and the inlet water temperature is being maintained at 30ºC using a constant temperature
bath. Water flows inside the hollow copper block placed above the cold side of hybrid TEG through the inlet port
and leaves the hollow copper block through the outlet port. The micro T-type thermocouple is placed exactly at
about 28mm from either side of the hybrid TEG, over the cold side to measure the cold side temperature. In
addition, two thermocouples, one at the inlet side and the other at the outlet side are placed to measure the water
inlet and outlet temperature. In the same manner, thermocouple was placed over the hot side of the hybrid TEG.
Since it is a single module performance analysis, only a single thermocouple is used to measure the relevant cold
side temperature. The hot side and cold side temperatures are monitored using the DAQ (Agilent 34972 A) unit.
AIR-COOLING TECHNIQUE
In air cooled method – natural convection method, a copper block with small fins is attached to the cold
side of the hybrid TEG. The copper block with small fins used in natural convection air-cooling system has been
designed inhouse. A 60 mm x 60mm solid copper block is taken and copper has been extruded or skived using
sharp and accurately controlled blade such that the fin thickness is about 4 mm and length is about 20mm with 8
fins. The cold side of the hybrid TEG is maintained at ambient conditions (around 30 ºC). The test-section of the
hybrid TEG with natural convection air cooling method is shown in Figure 5b.
Thermoelectric generator
Hot side
(synthetic oil)
Cold side (Water)
T1 T2
T3
T4
T5
T1 ,T2 ,T3 ,T4 ,T5 - micro T-type thermocouples
H1 , H2 – Cartridge Heaters
H1 H2
Water
Inlet Port
Water
Outlet Port
Load

Journal of Thermal Engineering, Research Article, Vol. 4, No. 4, Special Issue 8, pp. 2149-2168, June, 2018
2156
Figure 5b. Test section – natural convection
DATA REDUCTION
The output power, P is the product of output voltage and current; it is calculated as given in Equation 1
IVP (1)
where, V is the measured output voltage, I is the measured output current.
Maximum power output is attained when the internal resistance of the hybrid TEG (Ri) matches with the
externally connected load resistance (RL), This is termed as the matched load resistance (RmL). The maximum
power output is calculated using Equation 2,
LmRP
4
22
max
(2)
where, α is the seebeck co-efficient defined as the ratio of the open circuit voltage, Voc to the temperature gradient
across the hot and cold sides of the hybrid TEG, ΔT = TH –TC as given in Equation 3.
ocV
(3)
The thermoelectric generator efficiency is calculated using the relation given in equation 4 as follows,
Q
P (4)
where, P is the output power of the hybrid TEG obtained as in Equation 1; Q is the heat input to the system and
can be calculated as given in Equation 5.
2
2
i
HCHm
RIITTTKQ (5)
where, α is the Seebeck co-efficient calculated as in Equation 3, Km is the thermal conductance Ri is the internal
resistance of the TEG module and calculated as in Equation 6 and 7 [37].

Journal of Thermal Engineering, Research Article, Vol. 4, No. 4, Special Issue 8, pp. 2149-2168, June, 2018
2157
max
maxmaxmax
2
H
H
mT
IVTK (6)
1
V
VRR OC
Li (7)
where, RL is the load resistance, VOC is the open circuit voltage and V is the measured load voltage.
UNCERTAINTY ANALYSIS
Type A Uncertainty Analysis
Type A analysis involves calculation of uncertainties based on statistical analysis of data such as random
errors, repeatability test, bias and so on. An error analysis for hot side temperature of 250˚C and a flow rate of 0.5
l/min under both water and air cooled techniques is done and the uncertainty values are given in Table 6.
Measurement has been taken for approximately 15 data sets but only 3 data sets are shown for reference. For each
individual quantity, the mean and standard deviation values are obtained using the following equations 8,9 and 10
[38].
n
i
iXn
X1
1 (8)
21
2
1
)(1
1
n
i
i XXn
SD (9)
The uncertainty is given by, 100%
X
SDU (10)
The uncertainty in the hot side temperature on the basis of repeatability test is found to be around 0.13%
and in cold side, it was found to be 1.15% for water cooled technique and 0.77% for air-cooled method. The
uncertainties based on Type A Evaluation technique is tabulated in Table 6.
Table 6. Type A Uncertainty Analysis
Method Variable I II III Mean SD Uncertainty U%
TH (ºC) 250.07 250.68 250.51 250.42 0.314802 0.001257 0.13
Water
cooled
flow rate (mins) 3.29 3.25 3.34 3.293333 0.045092 0.013692 1.4
TC (ºC) 50.63 49.48 50.05 50.05364 0.57547 0.011497 1.15
ΔT (ºC) 199.37 200.52 199.95 199.9464 0.57547 0.002878 0.29
Voc (V) 3.82 3.79 3.84 3.816667 0.025166 0.006593 0.66
Pmax (W) 6.51 6.47 6.54 6.506667 0.035119 0.005397 0.54
Air
cooled
TC (ºC) 70.15 70.83 69.77 70.25 0.537029 0.007644 0.77
ΔT (ºC) 179.85 179.17 180.23 179.75 0.537029 0.002987 0.3
Voc (V) 3.38 3.34 3.28 3.3333 0.050332 0.0151 1.68
Pmax (W) 5.06 5.19 5.11 5.12 0.065574 0.012807 1.28
The uncertainty in power is calculated based on scientific judgment using all of the significant information
included in manufacturer’s specification. Power is calculated by multiplying measured voltage and current as given
in Equation 1. Hence the uncertainties in voltage and current measurement affect the measured output power to
some extent. The uncertainty of maximum output power based on voltage and current values measured using
voltmeter and ammeter and their uncertainties is calculated using equation 11 [38],

Journal of Thermal Engineering, Research Article, Vol. 4, No. 4, Special Issue 8, pp. 2149-2168, June, 2018
2158
2
2
2
2
ivp uI
Iu
V
VU
(11)
where, V
V and
I
I are the voltage and current values measured using voltmeter and ammeter respectively; uv
and ui are the uncertainties of voltmeter and ammeter respectively. For water-cooled technique, uncertainty of
maximum output power is calculated as 2222)01.0(04.4)01.0(62.1 = ± 4.35%. For air-cooled
technique, uncertainty of maximum output power is calculated as 2222)01.0(65.2)01.0(91.1 =
± 2.9%.
Type B Uncertainty Analysis
Before conducting experiments, the instruments are calibrated in order to resolve the uncertainties. The
uncertainties associated with instrument calibration are reported in Type B Evaluation. The instruments, their
operating range and percentage uncertainty values as reported in instruments instruction manual are listed in Table
7. The relative standard uncertainty of the power can be calculated using equation 12.
22
3
1IVp uustdU = 22 001.001.0
3
1stdU p = 1.41% (12)
where, uV and uI are the worst case relative uncertainties of voltmeter and ammeter; the co-efficient3
1 is used to
convert the worst case uncertainty to standard uncertainty. The relative standard uncertainty of power based on the
measuring equipments is found to be 0.082%.
Table 7. List of Equipment Uncertainty
Equipment Operating Range Uncertainty
T-type thermocouple Upto 350 ºC 0.5ºC ± 0.14%
Heater Upto 400 ºC 0.1ºC ± 0.02%
Flow meter 0.5 to 1.5 lit/min 0.01 lit/min ± 0.7%
Voltmeter 0 to 10 V 0.01 V ± 0.1%
Ammeter 0 to 9.99 A 0.01 A ± 2%
An uncertainty calculation that takes into account both repeatability errors and systematic effects is done
by taking the root sum of squares of both Type A and Type B relative standard uncertainties. The combined
uncertainty in maximum power output under water-cooled technique is found to be,
%35.40141.00435.0 22 wcomU . Similarly, the combined uncertainty in maximum power output
under air-cooled technique is found to be, %2.30141.0029.0 22 acomU .
ARTIFICIAL NEURAL NETWORKS
The Backpropagation neural network is a multilayered, feedforward neural network that is most
commonly used for supervised training of artificial neural networks. Selection of proper architecture plays an
important role in predicting the classification accuracy. In the present work, a three layered network – an input
layer, one hidden layer and an output layer is developed. For each input vector, a desired output is required. The
proposed structure of ANN is shown in Figure 5.
Initially, one input value is propagated forward through the ANN, layer-by-layer, until it reaches the
output layer. The computed output vector is then compared with the required desired output to determine the errors.
These errors are propagated backwards from the output layer to the input layer through the ANN. The above
process is repeated either till the desired output is reached or till the errors are minimized. There are quite a lot of

Journal of Thermal Engineering, Research Article, Vol. 4, No. 4, Special Issue 8, pp. 2149-2168, June, 2018
2159
training algorithms available for feed forward networks. These training algorithms use the gradient of performance
function to determine the bias correction term and adjust the network weights in the direction in which the
performance minimizes at faster rate. The gradient is found using a technique called back propagation in which
the computation is carried out backwards through the network.
Figure 6. Proposed structure of ANN
RESULTS AND DISCUSSION
The temporal-temperature distribution of the hot (TH) end at an input temperature of 250˚C and the
obtained temperature gradient using water and air cooling techniques is shown in Figure 7. On practical
application, it was seen that the difference between the heater temperature and the hot side temperature (Th ~ TH)
of the hybrid TEG module was found to be below 1ºC. The variation in temperature is very small and insignificant.
Hence, the heater temperature and hot side temperature is considered to be approximately the same (Th ≈ TH). From
Figure 7, it is observed that the hot side temperature of the hybrid TEG module increases swiftly upto 240ºC in
11.20 minutes. At about 23.34 minutes, the hot side temperature almost reaches steady state and the graph
becoming almost straight.
Figure 7. Variation in temperature with time
Input
layer
Hidden
layer
Output
layer
Tra
inin
g
inp
uts
Est
ima
ted
ou
tpu
ts
w v
Expected
outputBias
correction term
b
Σ= 0
0
30
60
90
120
150
180
210
240
270
0 5 10 15 20 25
tem
per
ature
(ºC
)
Time (minutes)
hot side temperature
delT (water cooling)
delT (air cooling)
ANN
Journal of Thermal Engineering, Research Article, Vol. 4, No. 4, Special Issue 8, pp. 2149-2168, June, 2018
2160
Experiments have been performed for a hot side temperature range of 200 - 250ºC. But, only a sample
result for 250ºC hot side temperature is shown for reference. The water temperature on the cold side was maintained
constant at 30ºC using a constant temperature bath throughout the practical implementation. Evaluation of ANN
data based on sample data is done to prove the closeness between both the techniques. Depending on the acquired
accurate results, performance of hybrid TEG is estimated beyond 250ºC hot side temperature with a temperature
difference of 200ºC for water cooling method and 180ºC for air cooling method. The heater input temperature is
varied from 200 - 250˚C with the coolant temperature being maintained at 30ºC. A flow rate of 0.5 l/min was fixed
for the coolant in water cooled technique [36]. Sample experimental values are noted down. The obtained
experimental data is utilized to train the ANN network and based on the obtained results; the closeness between
both the methodologies is checked and proved.
Using the sample experimental data, the ANN was trained and it was found that the hot side temperature
reached steady state in about 22.86 minutes, which is more or less similar to outcome of experimental approach.
The variation between the experimental method and ANN based approach is about 0.48 minutes. This shows the
proximity or closeness between both the methodologies. Thus, it can be confirmed that ANN approach can give
excellent outcome without the need of carrying out experiments.
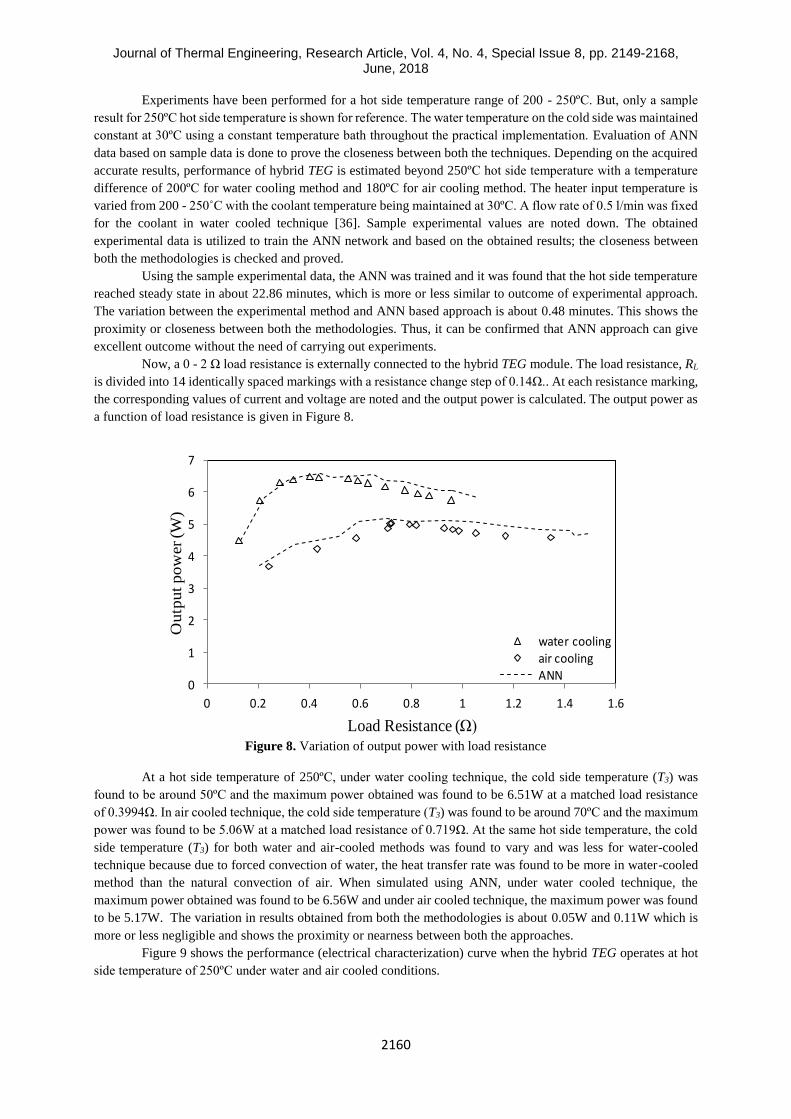
Now, a 0 - 2 Ω load resistance is externally connected to the hybrid TEG module. The load resistance, RL
is divided into 14 identically spaced markings with a resistance change step of 0.14Ω.. At each resistance marking,
the corresponding values of current and voltage are noted and the output power is calculated. The output power as
a function of load resistance is given in Figure 8.
Figure 8. Variation of output power with load resistance
At a hot side temperature of 250ºC, under water cooling technique, the cold side temperature (T3) was
found to be around 50ºC and the maximum power obtained was found to be 6.51W at a matched load resistance
of 0.3994Ω. In air cooled technique, the cold side temperature (T3) was found to be around 70ºC and the maximum
power was found to be 5.06W at a matched load resistance of 0.719Ω. At the same hot side temperature, the cold
side temperature (T3) for both water and air-cooled methods was found to vary and was less for water-cooled
technique because due to forced convection of water, the heat transfer rate was found to be more in water-cooled
method than the natural convection of air. When simulated using ANN, under water cooled technique, the
maximum power obtained was found to be 6.56W and under air cooled technique, the maximum power was found
to be 5.17W. The variation in results obtained from both the methodologies is about 0.05W and 0.11W which is
more or less negligible and shows the proximity or nearness between both the approaches.
Figure 9 shows the performance (electrical characterization) curve when the hybrid TEG operates at hot
side temperature of 250ºC under water and air cooled conditions.
0
1
2
3
4
5
6
7
0 0.2 0.4 0.6 0.8 1 1.2 1.4 1.6
Outp
ut pow
er (W
)
Load Resistance (Ω)
water coolingair coolingANN

Journal of Thermal Engineering, Research Article, Vol. 4, No. 4, Special Issue 8, pp. 2149-2168, June, 2018
2161
Figure 9. Electrical characterization at TH = 250ºC – water cooling & air cooling
The straight line represents the voltage-current (V-I) characteristics and the curved line represents the
power-current (P-I) characteristics of the TE device. The open-circuit voltage (VOC) is the voltage at which the
TEG terminals are open-circuited and no current is drawn by the load resistance. The short-circuit current (ISC) is
the current obtained when the TEG terminals are short-circuited. The maximum power is obtained when VL = VOC
/2 and IL= ISC /2 and at matched load resistance – the resistance value at which the externally connected load
resistance (RL) and the internal resistance (Ri) of the TEG are equal. Initially, when the TEG operates till the
maximum power point, less current flows through the thermoelectric device and as the current increases, Peltier
effect becomes prevalent due to which the thermal conductivity of the device is lesser than the energy that flows
at maximum power point. Hence a lower thermal load is imposed on the system leading to increased thermal
system efficiency. After the maximum power point, thermal conductivity of the device increases and is greater
than the energy that flows at maximum power point leading to decreased thermal system efficiency. At a hot side
temperature of 250ºC, the maximum power obtained under water cooled condition is about 6.52W and 5W under
air cooled condition.
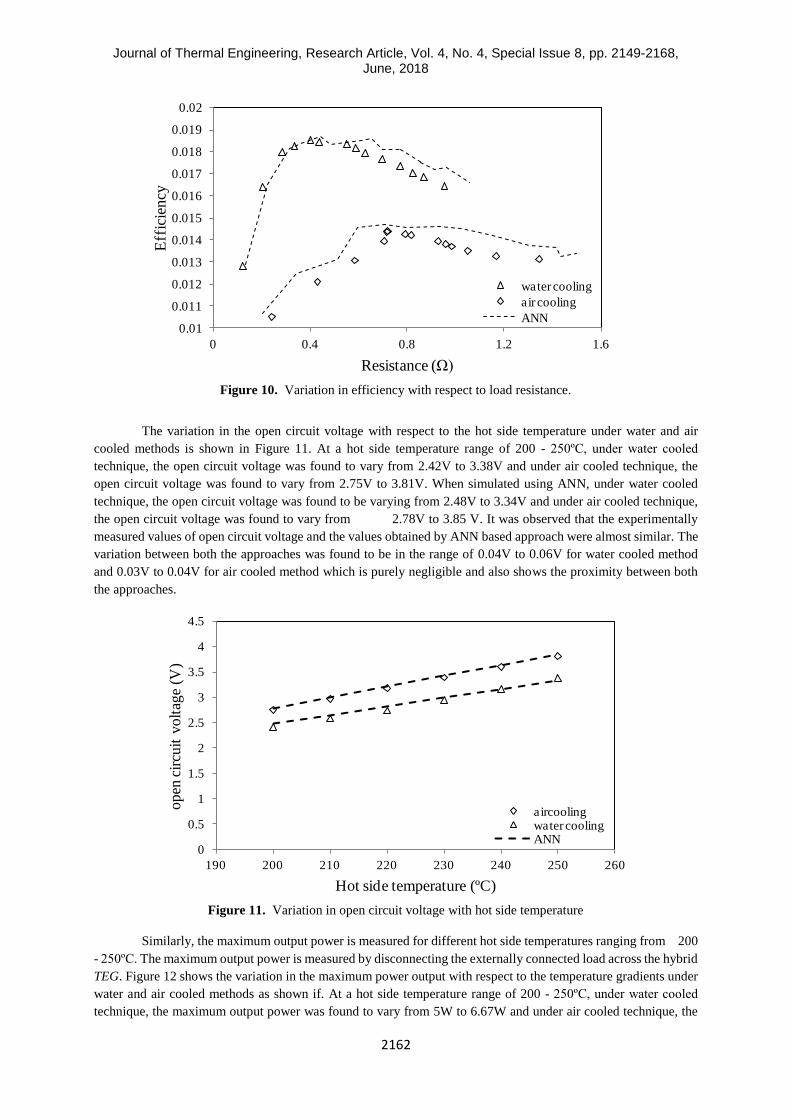
Figure 10 gives the relation between the efficiency of the system and the load resistance. From Figure 10,
it is evident that the efficiency of the system increases till the maximum power point and then decreases beyond
the maximum power point. This variation in system efficiency depends mainly on the energy that flows at the
maximum power point. At a hot side temperature of 250 ºC, when the load resistance is increased from 0 - 2Ω,
under water cooled technique, the efficiency was found to vary from 1.29% to 1.65% and under air cooled
technique, the efficiency was found to vary from 1.05% to 1.31%. When simulated using ANN, under water cooled
technique, the efficiency was found to be varying from 1.29% to 1.66% and under air cooled technique, the
efficiency was found to vary from 1.06% to 1.34%. It was observed that the experimentally measured values of
open circuit voltage and the values obtained by ANN based approach were almost similar. The variation between
both the approaches was found to be in the range of 0 – 0.02% for water cooled method and 0.01 – 0.03% for air
cooled method which is purely negligible and also shows the proximity between both the approaches.
The open circuit voltage is measured for different hot side temperatures ranging from 200 - 250ºC, at a
fixed coolant temperature. For various hot side temperatures, the open circuit voltage is measured by disconnecting
the externally connected load across the hybrid TEG.
6.52 W
1.6 V
3.23 V
5 W
1.91 V
3.82V
0
1
2
3
4
5
6
7
0 1 2 3 4 5 6 7 8
outp
ut volt
age (V
), p
ow
er
(W)
output current (A)
Power (water)Voltage (water)Power (air)Voltage (air)
Journal of Thermal Engineering, Research Article, Vol. 4, No. 4, Special Issue 8, pp. 2149-2168, June, 2018
2162
Figure 10. Variation in efficiency with respect to load resistance.
The variation in the open circuit voltage with respect to the hot side temperature under water and air
cooled methods is shown in Figure 11. At a hot side temperature range of 200 - 250ºC, under water cooled
technique, the open circuit voltage was found to vary from 2.42V to 3.38V and under air cooled technique, the
open circuit voltage was found to vary from 2.75V to 3.81V. When simulated using ANN, under water cooled
technique, the open circuit voltage was found to be varying from 2.48V to 3.34V and under air cooled technique,
the open circuit voltage was found to vary from 2.78V to 3.85 V. It was observed that the experimentally
measured values of open circuit voltage and the values obtained by ANN based approach were almost similar. The
variation between both the approaches was found to be in the range of 0.04V to 0.06V for water cooled method
and 0.03V to 0.04V for air cooled method which is purely negligible and also shows the proximity between both
the approaches.
Figure 11. Variation in open circuit voltage with hot side temperature
Similarly, the maximum output power is measured for different hot side temperatures ranging from 200
- 250ºC. The maximum output power is measured by disconnecting the externally connected load across the hybrid
TEG. Figure 12 shows the variation in the maximum power output with respect to the temperature gradients under
water and air cooled methods as shown if. At a hot side temperature range of 200 - 250ºC, under water cooled
technique, the maximum output power was found to vary from 5W to 6.67W and under air cooled technique, the
0.01
0.011
0.012
0.013
0.014
0.015
0.016
0.017
0.018
0.019
0.02
0 0.4 0.8 1.2 1.6
Eff
icie
ncy
Resistance (Ω)
water cooling
air cooling
ANN
0
0.5
1
1.5
2
2.5
3
3.5
4
4.5
190 200 210 220 230 240 250 260
open
cir
cuit
volt
age
(V)
Hot side temperature (ºC)
aircoolingwater coolingANN

Journal of Thermal Engineering, Research Article, Vol. 4, No. 4, Special Issue 8, pp. 2149-2168, June, 2018
2163
maximum output power was found to vary from 3.81W to 5.27W. When simulated using ANN, under water cooled
technique, the maximum output power was found to be varying from 4.88W to 6.5W and under air cooled
technique, the maximum output power was found to vary from 3.66W to 5.06W. It was observed that the
experimentally measured values of maximum power output and the values obtained by ANN based approach were
almost similar. The variation between both the approaches was found to be in the range of 0.15W to 0.21W for
water cooled method and 0.12W to 0.16W for air cooled method which is almost equal and also shows the
proximity or nearness between both the approaches.
Figure 12. Variation in maximum output power with temperature difference
The matched load resistance is measured for different hot side temperatures ranging from 200 - 250ºC.
Matched load resistance is the resistance value at which the internal resistance of the TEG matches with the
externally connected load resistance. Also, maximum power output occurs at matched load resistance. Figure 13
shows the variation in the matched load resistance with respect to the temperature gradients under water and air
cooled methods as shown if. At a hot side temperature range of 200 - 250ºC, under water cooled technique, the
matched load resistance was found to vary from 0.299Ω to 0.399Ω and under air cooled technique, the matched
load resistance was found to vary from 0.52Ω to 0.72Ω. When simulated using ANN, under water cooled technique,
the matched load resistance was found to be varying from 0.33Ω to 0.44Ω. and under air cooled technique, the
matched load resistance was found to vary from 0.55Ω to 0.74Ω. It was observed that the experimentally measured
values of matched load resistance and the values obtained by ANN based approach were almost similar. The
variation between both the approaches was found to be in the range of 0.031Ω to 0.045Ω, for water
cooled method and 0.02Ω to 0.03Ω, for air cooled method which is almost equal and also shows the proximity or
nearness between both the approaches.
From Figures 7 to 13, it is can be concluded that both the performance of ANN based approach and
experimental method is comparable. This proves that ANN provides precise results even without the need of
performing experiments. Hence, performance parameters such as open circuit voltage and maximum output power
can be estimated using ANN which is shown in the consequent results. Thus, it can be confirmed that ANN
approach can give excellent outcome for hot side temperatures beyond 250ºC without the need of carrying out
experiments.
3
3.5
4
4.5
5
5.5
6
6.5
7
120 140 160 180 200 220
maxim
um
pow
er
outp
ut (W
)
Temperature gradient (ºC)
water cooling
air cooling
ANN

Journal of Thermal Engineering, Research Article, Vol. 4, No. 4, Special Issue 8, pp. 2149-2168, June, 2018
2164
Figure 13 Variation in matched load resistance with temperature difference
Table 8. Estimation of Open circuit voltage and maximum power output at different temperature gradients –
water cooling
Temperature
gradient (ΔT)
in ºC
Open circuit voltage
(Voc)in V
Maximum Power output
(Pmax)in W
Matched Load Resistance
(RmL)in Ω
Experimental
Approach
ANN
Approach
Experimental
Approach
ANN
Approach
Experimental
Approach
ANN
Approach
150 2.419 2.48 4.883 5 0.299
0.33
160 2.58 2.65 5.208 5.33 0.320
0.35
170 2.741 2.82 5.534 5.67 0.339
0.38
180 2.95 2.99 5.859 6 0.359
0.39
190 3.164 3.16 6.185 6.33 0.379
0.42
200 3.38 3.34 6.51 6.67 0.399 0.44
230 - 3.84 - 7.76 - 0.51
260 - 4.62 - 8.63 - 0.58
290 - 4.87 - 9.75 - 0.64
320 - 5.44 - 10.72 - 0.71
The variations in open circuit voltage, maximum output power and matched load resistance with respect
to the various temperature gradients under water cooled and air cooled techniques are shown in are shown in Tables
8 and 9.
Table 9. Estimation of Open circuit voltage and maximum power output at different temperature gradients – air
cooling
Temperature
gradient (ΔT)
in ºC
Open circuit voltage
(Voc)in V
Maximum Power output
(Pmax)in W
Matched Load Resistance
(RmL)in Ω
Experimental
Approach
ANN
Approach
Experimental
Approach
ANN
Approach
Experimental
Approach
ANN
Approach
130 2.756 2.78 3.655 3.81 0.52 0.55
140 2.968 2.99 3.936 4.09 0.56 0.59
150 3.18 3.21 4.217 4.39 0.6 0.63
160 3.392 3.43 4.498 4.68 0.64 0.66
170 3.604 3.64 4.779 4.97 0.68 0.70
180 3.816 3.85 5.06 5.27 0.72 0.74
200 - 4.28 - 5.86 - 0.86
230 - 4.92 - 6.73 - 0.98
260 - 5.56 - 7.61 - 1.02
290 - 6.20 - 8.49 - 1.14
300 - 6.41 - 8.78 - 1.18
0
0.1
0.2
0.3
0.4
0.5
0.6
0.7
0.8
120 140 160 180 200 220
mat
ched
load
res
ista
nce
(Ω)
temperature difference (ºC)
water cooling
air cooling
ANN

Journal of Thermal Engineering, Research Article, Vol. 4, No. 4, Special Issue 8, pp. 2149-2168, June, 2018
2165
COST ANALYSIS
The unit cost of the hybrid thermoelectric module TEG1-PB-12611-6.0, supplied by Thermal Electronics
Corporation, Canada, used in the current study, is about $69. The unit cost is further reduced to $7 when the
quantity is increased to a higher number (~10,000 units). Initial investment cost of setting up a biomass gasification
plant is about $1500 [39]. The solid residue that is left after removal of oil from the non-edible Pongamia Pinnata
seed is Pongamia de-oiled seed cake, also termed as Biomass waste; is gasified, combusted and used as input heat
source to the thermoelectric generator. Since the disposal of de-oiled Pongamia seed cake is of huge concern, while
evaluating the cost of power generated from Biomass gasified-thermoelectric system, the fuel cost is considered
to be negligible/zero. The simplified levelized cost of electricity, sLCOE is the ratio of the total annual cost to the
total amount of electricity generation and is mathematically expressed as in Equation 9 [40].
MCOheatrateFC
citysystemcapaCF
MCfixOCRFCCsLCOE &var)(
24365
&
(9)
where, CC is the capital cost (includes cost of the modules, heat sink, cooling system, electronic control system),
CF is the capacity factor, FC is the fuel cost and CRF is the capital recovery factor and is calculated using Equation
10.
1)1(
)1(
t
t
d
idCRF (10)
where, d is the decimal interest rate and t is the number of years of repayment of loan. If a 5 year loan at an interest
rate of 4% is assumed, the CRF is calculated using Equation 10 and is found to be 0.2246. The fixed Operation
and Maintenance cost (fixO&MC) is found to be either 3% or 6% of the annual capital cost [41]. The variable
Operation and Maintenance cost (varO&MC) is found to $3.7/MW hr [41]. Based on the above mentioned data
and using equation 9, the cost of Biomass gasified-thermoelectric system is estimated to be $0.0018/kW h and in
terms of Indian currency is rupees 0.0676/kWh. Hence, it can be concluded that the power generated using
thermoelectric generators is almost negligible when compared with that of the other renewable energy resources.
Similar analysis has also been reported by Seijiro et al [42] and found that the cost involved in using TEG
technology for power generation is negligible. Table 10 gives the list of electric power generation cost of various
generating methods.
CONCLUSIONS
Based on the current study, the following conclusions are drawn:
i. Proximate and Ultimate analysis of Pongamia de-oiled seed cake showed the presence of high amount of
carbon content. Gasification of Pongamia de-oiled seed cake resulted in a “Syngas” and on combustion
produced higher energy biomass waste heat with a temperature of about 250 - 350ºC.
ii. Results showed that an enhancement in electric power of 22.27% is obtained when water is used on the cold
side of the TEG at a constant hot side temperature of 250ºC.
iii. By using ANN based approach, the open circuit voltage and maximum power output for hot side temperatures
beyond 250ºC is estimated using ANN based approach for water and air cooled conditions. At a hot side
temperature of 350ºC, the open circuit voltage under water and air cooled techniques were estimated to be
5.44V and 6.84V respectively. Similarly, the maximum output power under water and air cooled techniques
were estimated to be 10.72W and 8.78W respectively at a matched load resistance of 0.71Ω and 1.21Ω.
iv. Cost of Biomass gasified-thermoelectric system is estimated to be $0.0018/kWh and in terms of Indian
currency is rupees 0.0676/kWh, which is almost negligible when compared with other renewable energy
technologies.
Journal of Thermal Engineering, Research Article, Vol. 4, No. 4, Special Issue 8, pp. 2149-2168, June, 2018
2166
NOMENCLATURE
sLCOE simplified levelized cost of electricity (cost/kWh)
CC capital cost
CF capacity factor
CRF capital recovery factor
FC fuel cost
d decimal interest rate (%)
t loan repayment time (years)
I current (A)
K thermal conductance (W/K)
P output power (W)
Q heat input (W)
R resistance (Ω)
T temperature (oC or K)
U uncertainty (%)
V voltage (V)
α seebeck co-efficient (V/K)
ŋ efficiency (%)
ΔT TEG hot side to cold side temperature difference (oC or K)
a air
com combined
h heater
i internal
max maximum of given quantity
mL matched load
OC open circuit
w water
w1 water inlet
w2 water outlet
C TEG cold side
H TEG hot side
L load
CONFLICT OF INTEREST
The authors confirm that this article content has no conflict of interest among the authors.
ACKNOWLEDGEMENT The first, second and third authors gratefully acknowledge the financial support provided by the funding
agency, the Department of Science and Technology (DST), Science and Engineering Research Board (SERB),
(SB/FTP/ETA-362/2012), New Delhi, India. The fourth author acknowledges the support provided by the
"Research Chair Grant" National Science and Technology Development Agency (NSTDA), the Thailand Research
Fund (TRF), the National Research University Project (NRU) and King Mongkut’s University of Technology
Thonburi through the “KMUTT 55th Anniversary Commemorative Fund”. The authors would like to thank Mr.
Jaya Seelan R of Karunya University for helping in the fabrication of the experimental test facility.
REFERENCES [1] Prakash, R., Christopher, D., & Kumarrathinam, K. (2015). Analysis of Surface Waste Heat Recovery in IC
Engine by Using TEG. In Applied Mechanics and Materials (Vol. 787, pp. 782-786). Trans Tech Publications.
[2] Liu, X., Deng, Y. D., Li, Z., & Su, C. Q. (2015). Performance analysis of a waste heat recovery thermoelectric
generation system for automotive application. Energy Conversion and Management, 90, 121-127.
[3] Chandi, R. M., & Rajeev, R. (2015). Design and Analysis of Heat Exchanger for Automotive Exhaust based
Thermoelectric Generator [TEG]. International Journal for Innovative Research in Science & Technology, 1(11).
[4] Deok In, B., ik Kim, H., wook Son, J., & hyung Lee, K. (2015). The study of a thermoelectric generator with
various thermal conditions of exhaust gas from a diesel engine. International Journal of Heat and Mass
Transfer, 86, 667-680.
[5] Liu, C., & Li, W. Z. (2015). An Experimental Study of a Two-stage Thermoelectric Generator Using Heat Pipe
in Vehicle Exhaust. Distributed Generation and Alternative Energy Journal, 30(1), 15-37.
[6] Liu, Z., Zhang, L., Gong, G., Luo, Y., & Meng, F. (2015). Evaluation of a prototype active solar thermoelectric
radiant wall system in winter conditions. Applied Thermal Engineering, 89, 36-43.

Journal of Thermal Engineering, Research Article, Vol. 4, No. 4, Special Issue 8, pp. 2149-2168, June, 2018
2167
[7] Alomair, Y., Alomair, M., Mahmud, S., & Abdullah, H. A. (2015). Theoretical and experimental analyses of
solar-thermoelectric liquid-chiller system. International Journal of Refrigeration, 56, 126-139.
[8] Liu, Z., Zhang, L., Gong, G., & Han, T. (2015). Experimental evaluation of an active solar thermoelectric
radiant wall system. Energy Conversion and Management, 94, 253-260.
[9] Özdemir, A. E., Köysal, Y., Özbaş, E., & Atalay, T. (2015). The experimental design of solar heating
thermoelectric generator with wind cooling chimney. Energy Conversion and Management, 98, 127-133.
[10] Liu, Z., Zhang, L., & Gong, G. (2014). Experimental evaluation of a solar thermoelectric cooled ceiling
combined with displacement ventilation system. Energy Conversion and Management, 87, 559-565.
[11] Killander, A., & Bass, J. C. (1996, March). A stove-top generator for cold areas. In Thermoelectrics, 1996.,
Fifteenth International Conference on (pp. 390-393).
[12] O’Shaughnessy, S. M., Deasy, M. J., Kinsella, C. E., Doyle, J. V., & Robinson, A. J. (2013). Small scale
electricity generation from a portable biomass cookstove: prototype design and preliminary results. Applied
Energy, 102, 374-385.
[13] Champier, D., Bedecarrats, J. P., Rivaletto, M., & Strub, F. (2010). Thermoelectric power generation from
biomass cook stoves. Energy, 35(2), 935-942.
[14] Nuwayhid, R. Y., Shihadeh, A., & Ghaddar, N. (2005). Development and testing of a domestic woodstove
thermoelectric generator with natural convection cooling. Energy Conversion and Management, 46(9-10), 1631-
1643.
[15] Lertsatitthanakorn, C. (2007). Electrical performance analysis and economic evaluation of combined biomass
cook stove thermoelectric (BITE) generator. Bioresource technology, 98(8), 1670-1674.
[16] Jayakumar, J. (2015, March). Analysis of (Bi 2 Te 3-PbTe) hybrid thermoelectric generator for effective
power generation. In Innovations in Information, Embedded and Communication Systems (ICIIECS), 2015
International Conference on (pp. 1-6).
[17] Elghool, A., Basrawi, F., Ibrahim, T. K., Habib, K., Ibrahim, H., & Idris, D. M. N. D. (2017). A review on
heat sink for thermo-electric power generation: Classifications and parameters affecting performance. Energy
conversion and management, 134, 260-277.
[18] O'Shaughnessy, S. M., Deasy, M. J., Doyle, J. V., & Robinson, A. J. (2014). Field trial testing of an electricity-
producing portable biomass cooking stove in rural Malawi. Energy for Sustainable development, 20, 1-10.
[19] Montecucco, A., Siviter, J., & Knox, A. R. (2017). Combined heat and power system for stoves with
thermoelectric generators. Applied Energy, 185, 1336-1342.
[20] O'Shaughnessy, S. M., Deasy, M. J., Doyle, J. V., & Robinson, A. J. (2015). Adaptive design of a prototype
electricity-producing biomass cooking stove. Energy for sustainable development, 28, 41-51.
[21] Montecucco, A., Siviter, J., & Knox, A. R. (2015). A combined heat and power system for solid-fuel stoves
using thermoelectric generators. Energy Procedia, 75, 597-602.
[22] Mal, R., Prasad, R., & Vijay, V. K. (2016). Multi-functionality clean biomass cookstove for off-grid
areas. Process Safety and Environmental Protection, 104, 85-94.
[23] O’Shaughnessy, S. M., Deasy, M. J., Doyle, J. V., & Robinson, A. J. (2015). Performance analysis of a
prototype small scale electricity-producing biomass cooking stove. Applied energy, 156, 566-576.
[24] Toghyani, S., Ahmadi, M. H., Kasaeian, A., & Mohammadi, A. H. (2016). Artificial neural network, ANN-
PSO and ANN-ICA for modelling the Stirling engine. International Journal of Ambient Energy, 37(5), 456-468.
[25] Pourkiaei, S. M., Ahmadi, M. H., & Hasheminejad, S. M. (2016). Modeling and experimental verification of
a 25W fabricated PEM fuel cell by parametric and GMDH-type neural network. Mechanics & Industry, 17(1),
105.
[26] Ahmadi, M. H., Ahmadi, M. A., Mehrpooya, M., & Rosen, M. A. (2015). Using GMDH neural networks to
model the power and torque of a stirling engine. Sustainability, 7(2), 2243-2255.
[27] Ahmadi, M. H., Ahmadi, M. A., Sadatsakkak, S. A., & Feidt, M. (2015). Connectionist intelligent model
estimates output power and torque of stirling engine. Renewable and Sustainable Energy Reviews, 50, 871-883.
[28] Ahmadi, M. H., Aghaj, S. S. G., & Nazeri, A. (2013). Prediction of power in solar stirling heat engine by
using neural network based on hybrid genetic algorithm and particle swarm optimization. Neural Computing and
Applications, 22(6), 1141-1150.
[29] Koten, H., Yilmaz, M., & Zafer Gul, M. (2014). Compressed biogas-diesel dual-fuel engine optimization
study for ultralow emission. Advances in Mechanical Engineering, 6, 571063.
[30] Yilmaz, M., Köten, H., & Gul, M. Z. (2012). Effects of the injection parameters and compression ratio on the
emissions of a heavy-duty diesel engine. International Journal of Vehicle Design, 59(2/3), 147-163.
[31] Anitha, A. A., Jayakumar, J., & Asirvatham, L. G. (2017). Performance analysis of (Bi2Te3-PbTe) hybrid
thermoelectric generator. International Journal of Power Electronics and Drive Systems, 8(2), 917.
[32] Khandelwal, S., & Chauhan, R. Y. (2013). Life cycle assessment of Neem and Karanja biodiesel: an
overview. International Journal of ChemTech Research, 5(2), 659-665.
[33] Chandra, R., Vijay, V. K., & Subbarao, P. M. V. (2009). Biogas production from de-oiled seed cakes of
Jatropha and Pongamia. Renewable Energy (Akshay Urja), 3(2), 17-22.

Journal of Thermal Engineering, Research Article, Vol. 4, No. 4, Special Issue 8, pp. 2149-2168, June, 2018
2168
[34] Radhakrishna, P. (2003). Tree borne oil seeds as a source of energy for decentralized planning. Government
of India, Ministry of Non-Conventional Energy Sources, New Delhi, India.
[35] “Clean Renewable Fuel from the Plasma Gasification of Waste”, http://www.waste-management-world.com
[36] Angeline, A. A., Jayakumar, J., Asirvatham, L. G., Marshal, J. J., & Wongwises, S. (2017). Power generation
enhancement with hybrid thermoelectric generator using biomass waste heat energy. Experimental Thermal and
Fluid Science, 85, 1-12.
[37] Zhang, H. Y., Mui, Y. C., & Tarin, M. (2010). Analysis of thermoelectric cooler performance for high power
electronic packages. Applied thermal engineering, 30(6-7), 561-568. [38] Chen, W. H., Liao, C. Y., Hung, C. I., & Huang, W. L. (2012). Experimental study on thermoelectric modules
for power generation at various operating conditions. Energy, 45(1), 874-881.
[39] https://www.ashden.org/biomass-gasification
[40] Purohit, I., Purohit, P., & Shekhar, S. (2013). Evaluating the potential of concentrating solar power generation
in Northwestern India. Energy policy, 62, 157-175.
[41] “Renewable Energy Technologies: Cost Analysis series”, http://www.irena.org, Power Sector, Vol.1, Issue
1/5, June 2012.
[42] Sano, S., Mizukami, H., & Kaibe, H. (2003). Development of high-efficiency thermoelectric power generation
system. Komat’su Technical Report, Report No.
[43] Decker, B. Y., Calderon, S., & Gan, Y. (2015). Thermoelectric Properties of Bismuth Telluride Filled
Silicone. Journal of Thermal Engineering, 1(6), 402-407.