power generation from low temperature geothermal resources
TRANSCRIPT
PROCEEDINGS, Thirty-Seventh Workshop on Geothermal Reservoir Engineering
Stanford University, Stanford, California, January 30 – February 1, 2012
SGP-TR-194
ELECTRICAL POWER GENERATION FROM LOW TEMPERATURE CO-PRODUCED
GEOTHERMAL RESOURCES AT HUABEI OILFIELD
Shouliang Xin1, Hongbin Liang
1, Bing Hu
1, and Kewen Li
2,3 *
1Huabei Oilfield Co., PetroChina, China
2Dept. of Energy and Resources, China University of Geosciences, Beijing 100871, China
3Stanford University, *Corresponding Author
e-mail: [email protected]
ABSTRACT
Some important aspects of power generation using
the co-produced hot oil and water from LB reservoir,
Huabei oil field were studied. The temperatures of
the formation and the produced liquids were about
120°C and 110°C respectively. One of the main
differences between geothermal and oil wells is the
production rate. Usually the production rate in oil
wells is much less than that in geothermal wells. The
possibility of significantly increasing the total liquid
injection and production rates of the injectors and the
oil wells in LB reservoir was investigated. Some pilot
tests were conducted in the wells. A 400 kW power
generator, which was a binary screw expander
system, was installed and put into operation after the
feasibility and field studies. Operation data over
several months since April 2011 were measured and
collected.
INTRODUCTION
Water cut in many mature oil and gas fields is very
high, up to almost 98%. The traditional “oil” field has
become a “water” field. The produced water is
usually considered a nuisance to oil and gas
producers because it is required to dispose or re-
inject the water into reservoirs. This process costs a
lot and reduces the net profit value of the oil and gas
producers. In many of the high water cut oil and gas
reservoirs, the temperature of the produced water is
over 100°C, high enough to generate electricity using
modern power generation technologies. Electricity
generation from the produced water may give new
life to low yield oil and gas producers because of
high water cut.
There is a huge amount of geothermal resource
associated with oil and gas reservoirs for power
generation and other purpose (Li, et al., 2007; Erdlac
et al., 2007; Zhang, et al., 2009; Sun and Li, 2010;
Johnson and Walker, 2010). For example, Milliken
(2007) reported that the geothermal resources at
Naval Petroleum Reserve #3 located at Teapot Dome
field in Natrona County, Wyoming. Fractured
Precambrian basement granitic rocks at depths of
over 7000 ft may yield large volumes of water at
temperatures exceeding 250°F (121°C). Gross power
potential at NPR-3 from 130 MBWPD at 220°F
would be 76 MW. The initial power generation unit
was installed at the Naval Petroleum Reserve No. 3
and was put into service in September 2008. The
ORC power unit was designed to use 40,000 bpd of
170 °F produced water from the field’s Tensleep
formation to vaporize the working fluid, isopentane.
This power unit has averaged about 180 kW net
power output (Johnson and Simon, 2009; Johnson
and Walker, 2010).
Erdlac et al (2007) reported that Texas has thousands
of oil and gas wells that are sufficiently deep to reach
temperatures of over 250°F (121°C) and sometimes
400°F (204°C) (also see the reports by Swift et al,
1999; Erdlac et al, 2004; McKenna et al, 2005;
Erdlac et al, 2006). The possible electricity
generation from the hot water, estimated by Erdlac,
was about 47-75 billion MWh (equivalent to about
29-46 billion bbls of oil).
Geothermal power generation in China has not been
increased significantly in over twenty years. However
more and more attention has been paid to the power
generation by utilizing hot fluids co-produced from
oil and gas reservoirs as well as other geothermal
resources. In this study, we reported a pilot 400 kW
power plant which used the hot fluids co-produced
from LB oil reservoir. The power generator was a
binary screw expander system. The pilot geothermal
power plant has been in service for a couple of
months since April 2011. This was the first low-
temperature, geothermal power plant ever built in
China using fluids co-produced from an oil field.

GEOLOGICAL BACKGROUND OF LB OIL
RESERVOIR
LB oil reservoir is part of Huabei oilfield owned by
PetroChina. Huabei oilfield (see Figure 1) is located
150 kilometers south of Beijing, China. LB oil
reservoir has an area of 44.9 km2 and is a buried hill
oilfield in the east of Huabei. The peak surface
morphology of LB buried hill is a nose structure
along the direction of north east. The west side of LB
buried hill is cut by the main fault, and the buried
depth of high spot is 3216 m. The oil layer is located
in Mesoproterozoic Jixian System Dolomite.
Figure 1: Location of LB reservoir in Huabei
oilfield
The reservoir characteristics of LB buried hill are as
follows. The rock is a dual porosity porous media
with a porosity of about 6.0% and a permeability of
around 158 md. The density of micro fractures is
great, about 1~2 fractures/cm2. However the fracture
aperture is small. The rock is dominated by small
vuggs, and the fractures are the main channel for
fluid flow. The structural fractures are characteristic
of high-angle, whose dip angle ranging from 70º to
90º. These high-angle fractures accounted for 87.8%.
The fracture aperture ranged from 0.1 to 5 mm; those
with aperture between 0.1 and 0.2 mm accounted for
74.5%.
The temperatures of the produced water from many
wells in LB reservoir were over 100℃. In some of
the wells, the produced water even had a temperature
of about 120℃. The geothermal gradient was about
3.5℃/100 m and the average formation temperature
was around 120 ℃.
HISTORY OF OIL PRODUCTION
The commercial oil production in LB reservoir was
begun in June 1978, and water injection started about
four months later. The liquid production rate per well
decreased significantly because of the characteristics
of naturally fractured carbonate reservoirs, from
about 700m3/day at the early production period to
about 150m3/day at the late stage.
The reservoir had a total of 27 wells at the end of
October 2009. Currently, there were only 6
production wells. Water cut of the entire reservoir
was very high, about 97.8%.
PILOT TEST OF INCREASING LIQUID
PRODUCTION AND REINJECTION
In order to increase the output of electricity generated
from the coproduction, it is necessary to enhance the
total liquid production. Several questions may arise
from the enhancement. For example, can the total
liquid production rate be improved significantly? Is
there any significant temperature decline in oil
reservoirs? What are the effect on oil production and
water cut? To answer these questions, we have
investigated these problems using a numerical
simulation technique (Gong, et al., 2011). In this
study, we have conducted the pilot field test because
of the positive results from numerical simulation. To
do so, 3 producers (Wells 1, 2, and 3) and 1
reinjection well in LB buried hill reservoir have been
chosen. The pilot field test was also designed for the
possibility to increase the water reinjection rates.
Effect on Well Head Temperature The pilot field test results are described briefly as
follows (see Table 1 too). The liquid production rate
of Well 1 increased from 54.2 to 727 t/d, and the well
head temperature increased from 54 to 115℃. Well 2
was a well put in production again after being
abandoned. The average production rate was about
1385.2t/d in October 2008, and the average
temperature of well head was about 114℃. The liquid
production rate of Well 3 increased from 49 to 821.6
t/d, and the well head temperature increased from 77
to 110℃. In addition, Well 4 was producing with a
300 m3
ESP (Electric submersible pump) since
September 2003. The liquid production rate stayed at
350~450t/d, and the well head temperature was
around112℃.

Table 1: Temperature variation before and after the
enhancement of production rate in LB reservoir
Well No. Date Before After
ql (t/d) T (℃) ql (t/d) T (℃)
Well 1 2006.9 54.2 54 727 115
Well 2 2008.9 Abandoned well* 1385 114
Well 3 2008.11 49.1 77 821.6 110
Average 51.7 65.5 977.9 113.0
*Production ceased in November 2008 because of pump problems, data taken in October 2008.
One can see from Table 1 that the well head
temperature increased greatly after the enhancement
of production rate in LB reservoir.
All of the pilot test results at different production
rates are demonstrated in Figure 2. The well head
temperature increased with the liquid production rate.
When the production rate is lower, the well head
temperature increased faster. The temperature
increased slower while the production rate became
higher. The well head temperature could be kept
around 110°C at high production rates. Note that the
well head temperature did not change significantly
after the production rate is greater than about 400 t/d.
Figure 2: the relationship between temperature
and liquid production of LB buried hill
Effect on Oil Production Rates The enhanced oil production because of the increase
in total liquid production is described briefly as
follows (see Table 2 too).
Table 2: Oil production before and after the
enhancement of production rate
Well
No. Date
Before After
Enhancement ql qo fw ql qo fw
Well 1 2006.9 54.2 1.4 97.4 727 16.5 97.7 15.1
Well 2 2008.9 Abandoned
well 1385 12.2 98.7 12.2
Well 3 2008.11 49.1 1.6 96.8 821.6 15.1 98.2 13.5
Average 51.7 1.5 97.1 977.9 14.6 98.2 13.6
The oil production of Well 1 increased from 1.4 to
16.5 t/d. The water cut did not increase very much.
Well 2 had an oil production rate around 12.2 t/d and
a water cut of 98.7% after being reactivated from
abandonment. The oil production rate of Well 3 also
increased significantly, from 1.6 to15.1 t/d.
One can see from Table 2 that the average
incremental oil production rate of the tested three
wells was about 13.6t/d because of the enhanced total
liquid production.
Effect on Formation Energy
The test data of Well 1 illustrated that the liquid level
in the well bore descended to 498 m away from the
well head after the enhancement of production rates.
However, oil gushed out from the wellhead after an
hour of shut-in. Since oil production decreased in
December 2007, liquid level increased slowly. The
data of Well 3 showed that its liquid level stayed
unchanged at the well head since the production
enhancement in November 2008. It can be seen that
the energy of LB buried hill reservoir was kept well
and the liquid supply was sufficient during the pilot
test.
Effect on Reinjection
The reinjection amount of formation water into Well
5, which is 2000 m away from Well 6, increased
from 100 to 2319 m3 since July 2008. Formation
pressure of Well 7 increased quickly from 8.795 to
9.688 MPa in July 2009. The liquid level in Well 1
began to pick up, and it reached the well head in May
2009. The liquid level of Well 3 stayed around the
well head during the test. It can be seen from these
data and the observation that the connectivity
between wells in LB buried hill reservoir was good
and the reinjection capacity was great. The enormous
enhancement in total liquid production from Wells 1,
2 and 3 might result in the decline in the formation
energy but the effect was not very significant. The
test data showed that the formation energy could be
compensated properly by the reinjection and the total
liquid production could be kept at high values for a
long time.
The lifting Ability of ESP
Three new kinds of ESPs (600 m3-600 m, 800 m
3-800
m, 1000 m3-1000 m) have been tested respectively in
LB buried hill reservoirs. The pump of 600 m3-600 m
was tested in three wells. The average liquid
production rates reached 727, 755, and 837 t/d in
Wells 1, 2, and 3 respectively. The pump of 800 m3-
800 m was tested in one well. Its average liquid
production reached about 1100 t/d. The pump of
1000 m3-1000 m was also tested in one well, and its
y = 13. 938Ln( x) + 19. 376
R2 = 0. 7152
0
20
40
60
80
100
120
140
0 200 400 600 800 1000 1200 1400 1600 1800
系列1
对数 ( 系列1)
产液量( t / d)
温度
(℃
)
Liquid production(t/d)
Tem
pe
ratu
re( ℃
)
average liquid production reached about 1176 t/d.
The lifting capacity of these new ESPs was good.
Table 3 lists the test data of the three kinds of ESPs
(new) and the old pumps.
Table 3: the capacity of the ESPs
Pump
rate
m3/d
Average liquid
production m3/d Average
enhancement
m3/d
Pump
inspection
cycle, d old new
600 55 773 718 200
800 55 1100 1045 -
1000 55 1176 1121 30
RESULTS AND DISCUSSION
One set of 400 kW screw expander manufactured by
Jiujiang Power was chosen for power generation. In
early April of 2011, the geothermal power plant was
put into operation. The temperature of the initial
stage of hot water was 110 ℃. The water flow rate
was 2880 m3/d. The entering pressure in the screw
pump expander was 0.38 MPa. The inlet temperature
of circulating cooling water was 21.1℃ and the outlet
temperature was 35.8℃.
The design of the unit was based on the relatively
low produced water temperature of 110℃ and the
total liquid production rate in LB reservoir. At the
design conditions, the nominal 400 kW unit would
produce a gross power of 360 kW and the net power
of 310 kW. By the end of 2011, the effective power
generation time was 2880 hour, the cumulative
energy generated was about 31 × 104
kWh. The
electricity was all successfully transmitted into the
local power grid with the permission obtained prior
to the power generation. The operation data and
parameters are listed in Table 4.
Table 4: Operation data
Water flow rate (m3/d) 2880
Inlet water temperature (℃) 110
Outlet water temperature (℃) 85-90
Working fluid R123
Installed power (kW) 400
Output power (kW) 360
Net power (kW) 310
Total energy generated (kWh) 31×104
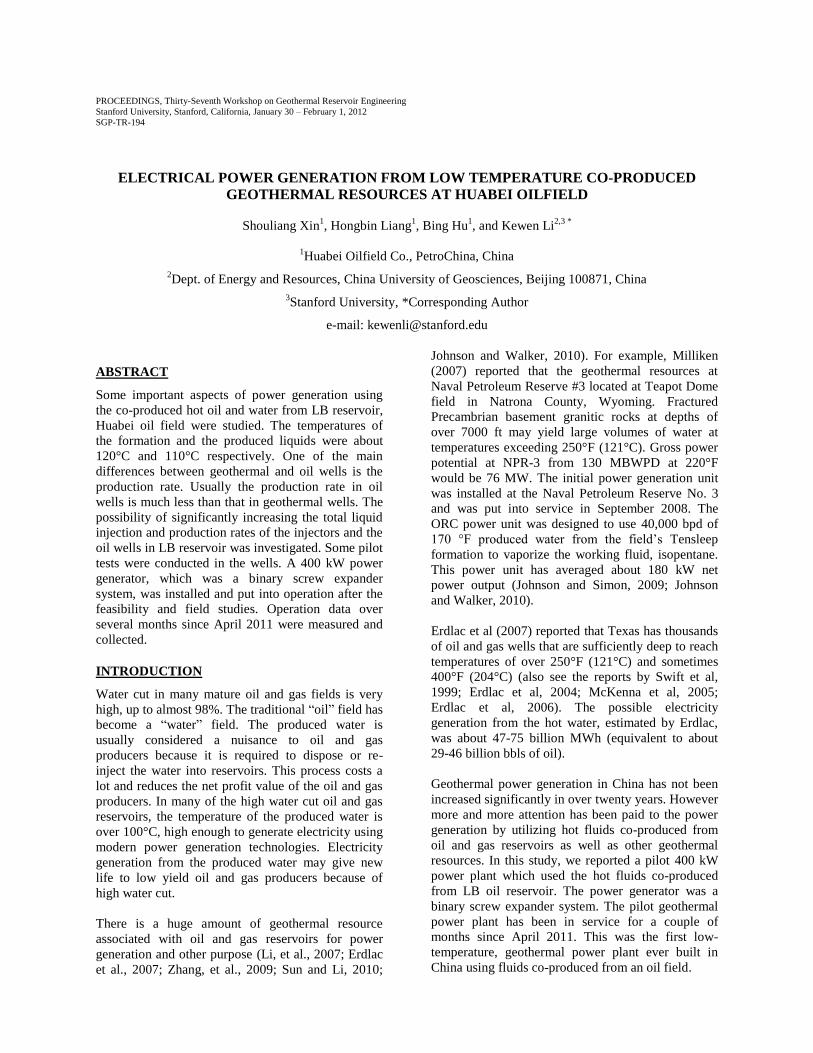
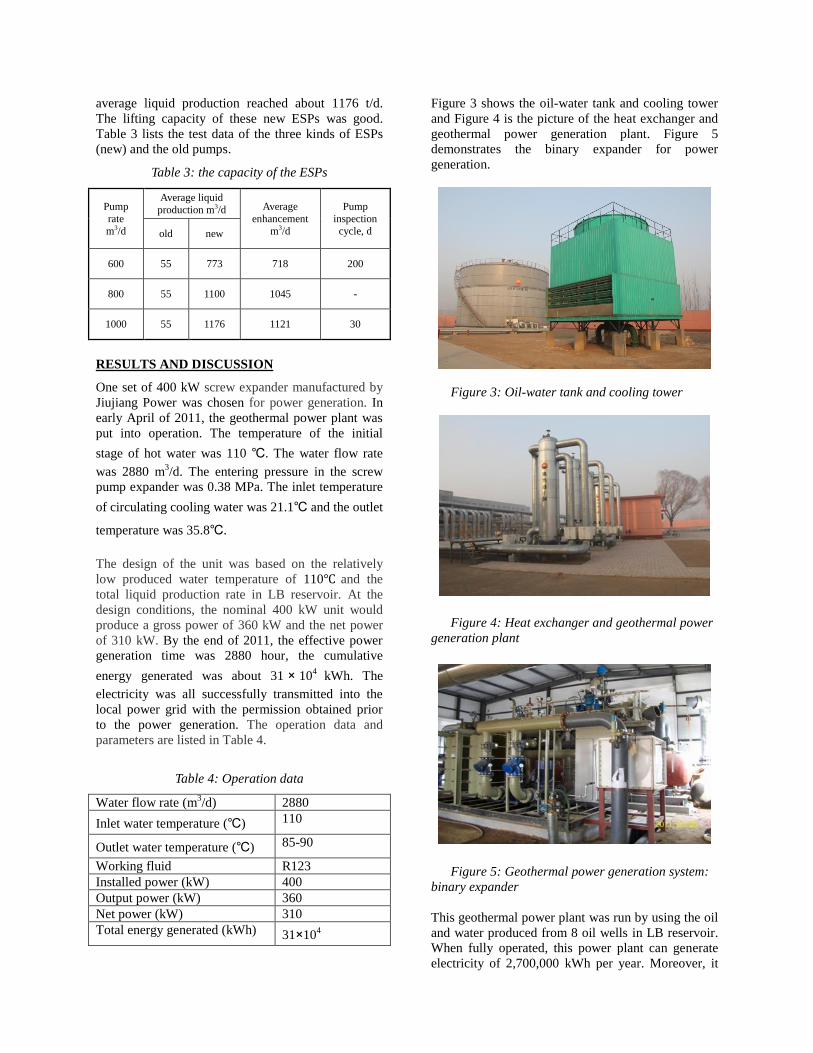
Figure 3 shows the oil-water tank and cooling tower
and Figure 4 is the picture of the heat exchanger and
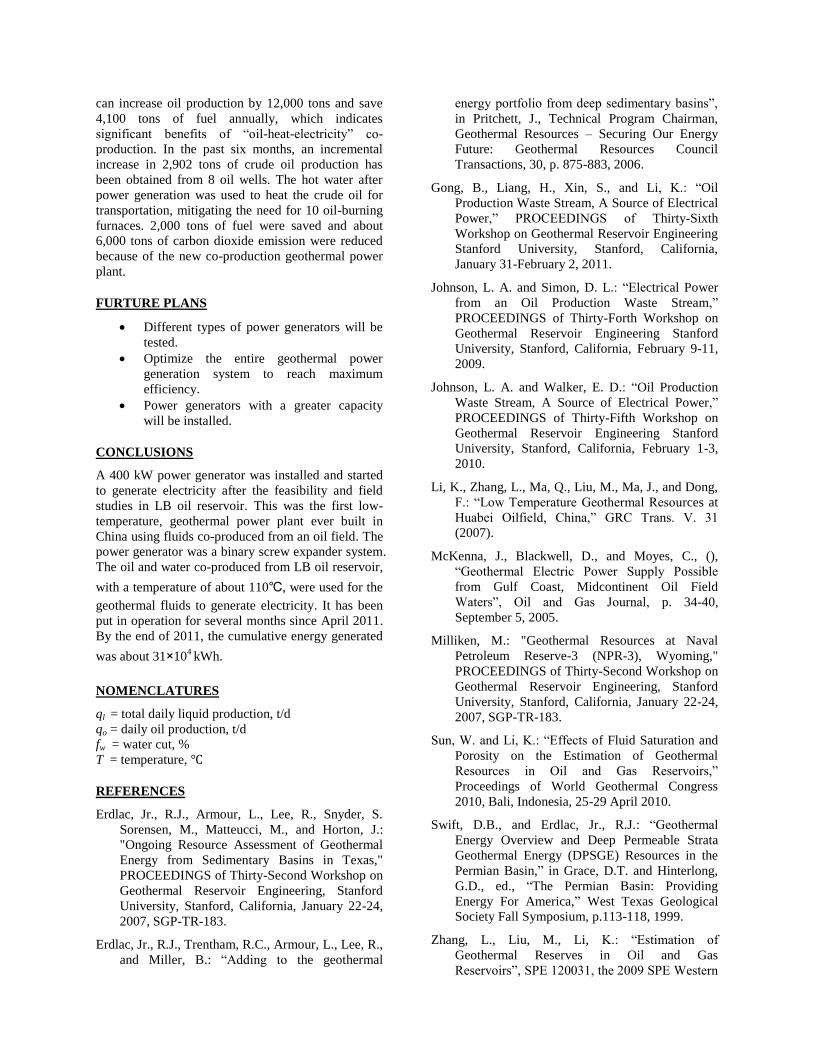
geothermal power generation plant. Figure 5
demonstrates the binary expander for power
generation.
Figure 3: Oil-water tank and cooling tower
Figure 4: Heat exchanger and geothermal power
generation plant
Figure 5: Geothermal power generation system:
binary expander
This geothermal power plant was run by using the oil
and water produced from 8 oil wells in LB reservoir.
When fully operated, this power plant can generate
electricity of 2,700,000 kWh per year. Moreover, it
can increase oil production by 12,000 tons and save
4,100 tons of fuel annually, which indicates
significant benefits of “oil-heat-electricity” co-
production. In the past six months, an incremental
increase in 2,902 tons of crude oil production has
been obtained from 8 oil wells. The hot water after
power generation was used to heat the crude oil for
transportation, mitigating the need for 10 oil-burning
furnaces. 2,000 tons of fuel were saved and about
6,000 tons of carbon dioxide emission were reduced
because of the new co-production geothermal power
plant.
FURTURE PLANS
Different types of power generators will be
tested.
Optimize the entire geothermal power
generation system to reach maximum
efficiency.
Power generators with a greater capacity
will be installed.
CONCLUSIONS
A 400 kW power generator was installed and started
to generate electricity after the feasibility and field
studies in LB oil reservoir. This was the first low-
temperature, geothermal power plant ever built in
China using fluids co-produced from an oil field. The
power generator was a binary screw expander system.
The oil and water co-produced from LB oil reservoir,
with a temperature of about 110℃, were used for the
geothermal fluids to generate electricity. It has been
put in operation for several months since April 2011.
By the end of 2011, the cumulative energy generated
was about 31×104 kWh.
NOMENCLATURES
ql = total daily liquid production, t/d
qo = daily oil production, t/d
fw = water cut, %
T = temperature, ℃
REFERENCES
Erdlac, Jr., R.J., Armour, L., Lee, R., Snyder, S.
Sorensen, M., Matteucci, M., and Horton, J.:
"Ongoing Resource Assessment of Geothermal
Energy from Sedimentary Basins in Texas,"
PROCEEDINGS of Thirty-Second Workshop on
Geothermal Reservoir Engineering, Stanford
University, Stanford, California, January 22-24,
2007, SGP-TR-183.
Erdlac, Jr., R.J., Trentham, R.C., Armour, L., Lee, R.,
and Miller, B.: “Adding to the geothermal
energy portfolio from deep sedimentary basins”,
in Pritchett, J., Technical Program Chairman,
Geothermal Resources – Securing Our Energy
Future: Geothermal Resources Council
Transactions, 30, p. 875-883, 2006.
Gong, B., Liang, H., Xin, S., and Li, K.: “Oil
Production Waste Stream, A Source of Electrical
Power,” PROCEEDINGS of Thirty-Sixth
Workshop on Geothermal Reservoir Engineering
Stanford University, Stanford, California,
January 31-February 2, 2011.
Johnson, L. A. and Simon, D. L.: “Electrical Power
from an Oil Production Waste Stream,”
PROCEEDINGS of Thirty-Forth Workshop on
Geothermal Reservoir Engineering Stanford
University, Stanford, California, February 9-11,
2009.
Johnson, L. A. and Walker, E. D.: “Oil Production
Waste Stream, A Source of Electrical Power,”
PROCEEDINGS of Thirty-Fifth Workshop on
Geothermal Reservoir Engineering Stanford
University, Stanford, California, February 1-3,
2010.
Li, K., Zhang, L., Ma, Q., Liu, M., Ma, J., and Dong,
F.: “Low Temperature Geothermal Resources at
Huabei Oilfield, China,” GRC Trans. V. 31
(2007).
McKenna, J., Blackwell, D., and Moyes, C., (),
“Geothermal Electric Power Supply Possible
from Gulf Coast, Midcontinent Oil Field
Waters”, Oil and Gas Journal, p. 34-40,
September 5, 2005.
Milliken, M.: "Geothermal Resources at Naval
Petroleum Reserve-3 (NPR-3), Wyoming,"
PROCEEDINGS of Thirty-Second Workshop on
Geothermal Reservoir Engineering, Stanford
University, Stanford, California, January 22-24,
2007, SGP-TR-183.
Sun, W. and Li, K.: “Effects of Fluid Saturation and
Porosity on the Estimation of Geothermal
Resources in Oil and Gas Reservoirs,”
Proceedings of World Geothermal Congress
2010, Bali, Indonesia, 25-29 April 2010.
Swift, D.B., and Erdlac, Jr., R.J.: “Geothermal
Energy Overview and Deep Permeable Strata
Geothermal Energy (DPSGE) Resources in the
Permian Basin,” in Grace, D.T. and Hinterlong,
G.D., ed., “The Permian Basin: Providing
Energy For America,” West Texas Geological
Society Fall Symposium, p.113-118, 1999.
Zhang, L., Liu, M., Li, K.: “Estimation of
Geothermal Reserves in Oil and Gas
Reservoirs”, SPE 120031, the 2009 SPE Western

Regional Meeting held in San Jose, California,
USA, 24-26 March 2009.