power potential - uk power networks
TRANSCRIPT

07 May 2021
Power Potential (Transmission & Distribution Interface 2.0)
SDRC 9.5 Cost Benefit Analysis

Power Potential (Transmission & Distribution Interface 2.0) SDRC 9.5 Cost Benefit Analysis 2
Contents
Definition of Terms 3
Executive Summary 4
1. Introduction 5
1.1. Background and Project Objectives.......................................................................................................... 5
1.2. Purpose of Document ............................................................................................................................... 7
1.3. SDRC 9.5 Key Evidence Criteria .............................................................................................................. 7
2. Insights from University of Cambridge’s Cost Benefit Analysis 9
2.1. Objectives ................................................................................................................................................. 9
2.2. Methodology ............................................................................................................................................. 9
2.3 Results ...................................................................................................................................................... 9
2.4 Additional Potential Benefits ................................................................................................................... 11
3. Exploration of the costs for DERMS delivery beyond the trial 13
3.1 Understanding DERMS costs ...................................................................................................................... 13
3.2 Benefits of DERMS beyond Power Potential .............................................................................................. 13
3.3 Approach to DERMS costs within CBA ....................................................................................................... 14
4. Insights from Replication Studies 15
4.1 Objectives .................................................................................................................................................... 15
4.2 Methodology ................................................................................................................................................ 15
4.3 Results ......................................................................................................................................................... 15
4.4 Comparisons of Results with the TDI 2.0 Bid CBA ..................................................................................... 16
5. Summary 17
5.1. CBA ......................................................................................................................................................... 17
5.2. Replication Studies ................................................................................................................................. 17
5.3. Future improvement for the CBA analysis .............................................................................................. 18
Appendix A: Cambridge CBA
Appendix B: Replication Studies

Power Potential (Transmission & Distribution Interface 2.0) SDRC 9.5 Cost Benefit Analysis 3
Definition of Terms
Term Definition
AC Alternating Current
CBA Cost Benefit Analysis
CIM Common Information Model
CUSC Connection and Use of System Code
DER Distributed Energy Resources
DERMS Distributed Energy Resources Management System
DNO Distribution Network Operator
ETYS Electricity Ten Year Statement
FES Future Energy Scenarios
GSP Grid Supply Point
Gvar Giga-var-amperes (unit of Reactive Power)
HVDC High Voltage Direct Current
ICCP Inter-Control Centre Protocol
LCC Line Commutated Converter
Mvar Mega-var-amperes (unit of Reactive Power)
NGET National Grid Electricity Transmission
NGESO National Grid Electricity System Operator
NPV Net Present Value
ORPS Obligator Reactive Power Service
PP Power Potential
PV Photo Voltaic
RP Reactive Power
S1 Scenario 1
S2 Scenario 2
S3 Scenario 3
SCADA Supervisory Control and Data Acquisition
SDRC Successful Delivery Reward Criterion
SHE Scottish Hydro Electric
SPT Scottish Power Transmission
STATCOM Static Compensator
VSC Voltage Source Converter

Power Potential (Transmission & Distribution Interface 2.0) SDRC 9.5 Cost Benefit Analysis 4
Executive Summary
This report summarises the cost benefit analysis of the techniques trialled in Power Potential to enable voltage control services from DER to the transmission system. The CBA has been calculated using a Net Present Value methodology, compared against the cost of building transmission connected STATCOMs. If applied post-trial, benefits were identified of £19.5m by 2050 for the trial region, and then £96m by 2050 if replicated across GB.
The University of Cambridge analysed the benefit of the project within the trial region, formed by four GSPs. The analysis has determined the Power Potential project could save £19.5.m (2018 equivalent) by 2050. The difference in the benefits between the original project bid and University of Cambridge’s cost benefit analysis is a reduction of £5m. The difference comes as a result of the different input data assumptions:
• The University of Cambridge’s cost benefit analysis uses an asset annuity duration of 45 years consistent with Ofgem’s CBA approach. In the original bid, a value of 20 years for annuity duration was used. At the time that was a standard annuity duration based on transmission owner’s asset valuations. The Cambridge University CBA was later updated with Ofgem latest annuity asset duration.
• In the original CBA, the forecasted amount of DER connected in the trial region included DER in size greater than 100 MW. In the University of Cambridge’s cost benefit analysis, generators with capacity greater than 100 MW were not considered for contribution to the Power Potential service as they are part of the Obligatory Reactive Power Service.
• The different annuity duration contributes to 60% of the cost difference. The rest of the cost difference comes from not using generators greater than 100 MW or interconnectors.
However, additional types of benefits were highlighted by University of Cambridge, and additional DER reactive power service volume could also be identified by comparison with the trial. It is also noted that the CBA methodology considers the long-run transmission-investment alternative, and not the current system costs for maintaining voltage levels on the network from Grid Code compliant generators.
Following the CBA, replication studies have been carried out by National Grid ESO. This filters the GSP replicability according to network requirements, choosing only the ones that present dynamic voltage management requirement needs for containment and recovery to manage post-disturbance voltage, not steady-state regulation. The expansion of Power Potential as a dynamic service as trialled could save energy consumers over £96m by 2050 when rolled out to 19 (out of 36) transmission voltage zones within Great Britain. These results update the initial benefits calculated in the project bid which assumed replication in all transmission voltage zones and did not account for specific DER projections in each GSP (using the Future Energy Scenarios which is consistent with the Cambridge University CBA report).
Power Potential trialled a dynamic service design with fast response including steady state use case, and this CBA only reflects these benefits. Additional benefits and any wider learning are outside of the values captured in this CBA, which only reflects the benefits associated with dynamic service. Sections 2.4 and 5.3 set out the potential additional benefits that could be accessed from a competitive DER reactive market and expansion of the CBA. However even without those additional aspects, the scale of benefits estimated in the first year of roll-out would significantly exceed the full cost of DERMS for reactive power provision from DER for the transmission system.

Power Potential (Transmission & Distribution Interface 2.0) SDRC 9.5 Cost Benefit Analysis 5
1 Introduction
1.1 Background and Project Objectives
1.1.1 Context and Challenge
The south-east of England has seen significant growth in DER connections to the distribution network due to the region’s geographical position and excellent solar and wind resources. This growth trend is being replicated in other areas of the country. The south-east coast transmission network interfaces with UK Power Networks’ distribution system at four GSPs: Bolney, Ninfield, Sellindge and Canterbury North, located in Sussex and Kent. Apart from the growth in DER, the south-east coast network is influenced by the presence of three interconnectors with continental Europe and has plans for two more in the future. The south-east coast network includes 2 GW1 of peak demand and 5.5 GW of large generation including wind farms, nuclear power stations and a combined cycle gas-fired power plant. Existing and future interconnections and generation projects include:
• Interconnectors:
o IFA HVDC (LCC): connected at Sellindge substation (live).
o NEMO HVDC (VSC): connected at Richborough substation (it went live 30 January 2019).
o ELECLINK HVDC (VSC): to be connected at Sellindge substation (expected to be operational
in 2022)
• Generators connected at transmission level:
o Dungeness (two machines): connected at Dungeness substation at 400kV.
• Offshore wind farms connected at transmission level:
o London Array: connected at Cleve Hill substation at 400 kV.
o Rampion: connected to Bolney substation via Twineham substation at 150 kV.
The growing levels of intermittent renewable generation means National Grid ESO is facing increasing operational challenges managing the voltage and thermal limitations under certain network conditions, while still being able to transfer electricity to the country’s load centres. Capacity to connect more generation on the south-east of England, namely at the Grid Supply Points (GSPs) in Canterbury, Sellindge, Ninfield and Bolney, is being restricted due to upstream constraints on National Grid's transmission network. The constraints include:
• Dynamic voltage stability: requiring reactive power delivery at short notice.
• High voltage: managing the voltage on the network during low load periods.
• Thermal capacity: potentially leading to generation curtailment during the summer maintenance season.
The high voltage at low load scenario now occurs regularly at weekends in the summer period, but the voltage stability constraint is most prominent if a double circuit fault occurs on the route between Canterbury and Kemsley substations. This leaves only one long heavily loaded westerly route to deliver the south-east’s green energy into London.
If such a fault occurs the consequences can be very serious for the system. The line remaining after the fault will be required to transfer a significant amount of power. This double circuit can be characterised as a long radial line, and its electrical characteristics will lead to a rapid voltage drop across the network seconds after the fault. If the voltage drop is not contained in time, this could lead to voltage collapse and, ultimately, a potential ‘blackout’ of the network. Even if a full collapse is averted, a dramatic deviation of the transmission voltage away from statutory limits can cause severe problems. Domestic appliances, building controls, elevators, air conditioning, and small generators for example,
1 Figures derived from National Grid’s Electricity 10-year statement 2020 https://www.nationalgrideso.com/research-publications/etys-2020
Power Potential (Transmission & Distribution Interface 2.0) SDRC 9.5 Cost Benefit Analysis 6
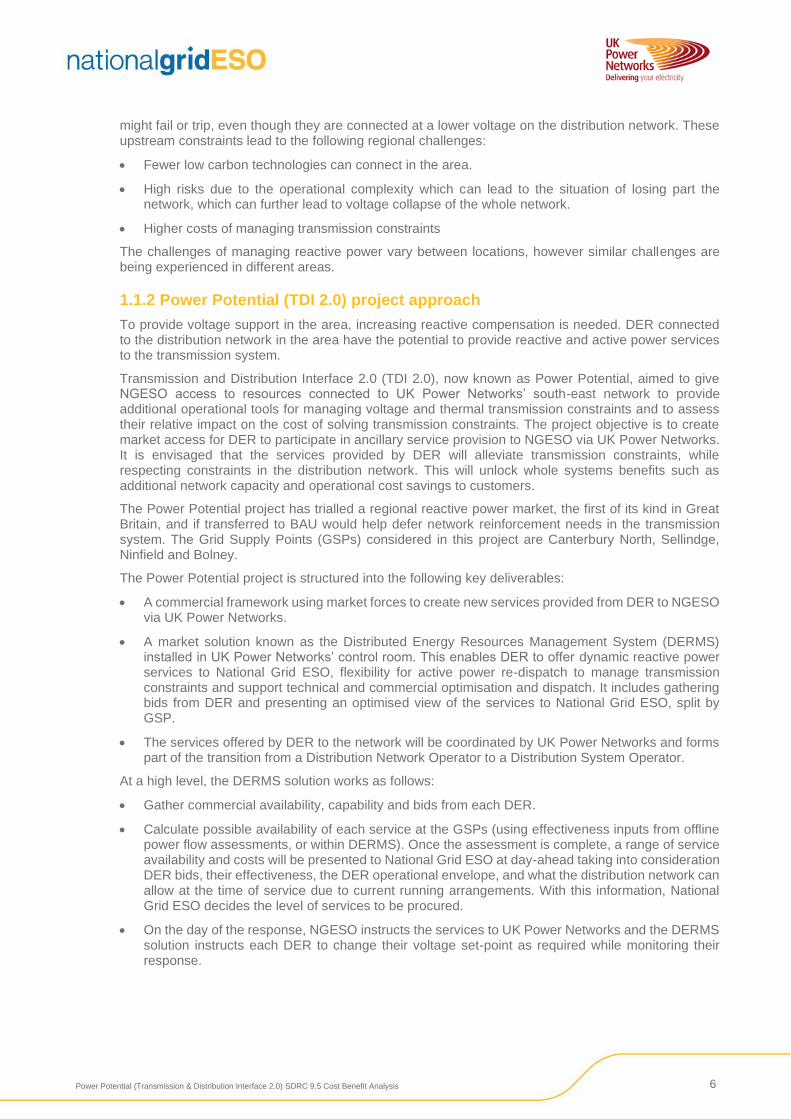
might fail or trip, even though they are connected at a lower voltage on the distribution network. These upstream constraints lead to the following regional challenges:
• Fewer low carbon technologies can connect in the area.
• High risks due to the operational complexity which can lead to the situation of losing part the network, which can further lead to voltage collapse of the whole network.
• Higher costs of managing transmission constraints
The challenges of managing reactive power vary between locations, however similar challenges are being experienced in different areas.
1.1.2 Power Potential (TDI 2.0) project approach
To provide voltage support in the area, increasing reactive compensation is needed. DER connected to the distribution network in the area have the potential to provide reactive and active power services to the transmission system.
Transmission and Distribution Interface 2.0 (TDI 2.0), now known as Power Potential, aimed to give NGESO access to resources connected to UK Power Networks’ south-east network to provide additional operational tools for managing voltage and thermal transmission constraints and to assess their relative impact on the cost of solving transmission constraints. The project objective is to create market access for DER to participate in ancillary service provision to NGESO via UK Power Networks. It is envisaged that the services provided by DER will alleviate transmission constraints, while respecting constraints in the distribution network. This will unlock whole systems benefits such as additional network capacity and operational cost savings to customers.
The Power Potential project has trialled a regional reactive power market, the first of its kind in Great Britain, and if transferred to BAU would help defer network reinforcement needs in the transmission system. The Grid Supply Points (GSPs) considered in this project are Canterbury North, Sellindge, Ninfield and Bolney.
The Power Potential project is structured into the following key deliverables:
• A commercial framework using market forces to create new services provided from DER to NGESO via UK Power Networks.
• A market solution known as the Distributed Energy Resources Management System (DERMS) installed in UK Power Networks’ control room. This enables DER to offer dynamic reactive power services to National Grid ESO, flexibility for active power re-dispatch to manage transmission constraints and support technical and commercial optimisation and dispatch. It includes gathering bids from DER and presenting an optimised view of the services to National Grid ESO, split by GSP.
• The services offered by DER to the network will be coordinated by UK Power Networks and forms part of the transition from a Distribution Network Operator to a Distribution System Operator.
At a high level, the DERMS solution works as follows:
• Gather commercial availability, capability and bids from each DER.
• Calculate possible availability of each service at the GSPs (using effectiveness inputs from offline power flow assessments, or within DERMS). Once the assessment is complete, a range of service availability and costs will be presented to National Grid ESO at day-ahead taking into consideration DER bids, their effectiveness, the DER operational envelope, and what the distribution network can allow at the time of service due to current running arrangements. With this information, National Grid ESO decides the level of services to be procured.
• On the day of the response, NGESO instructs the services to UK Power Networks and the DERMS solution instructs each DER to change their voltage set-point as required while monitoring their response.
Power Potential (Transmission & Distribution Interface 2.0) SDRC 9.5 Cost Benefit Analysis 7
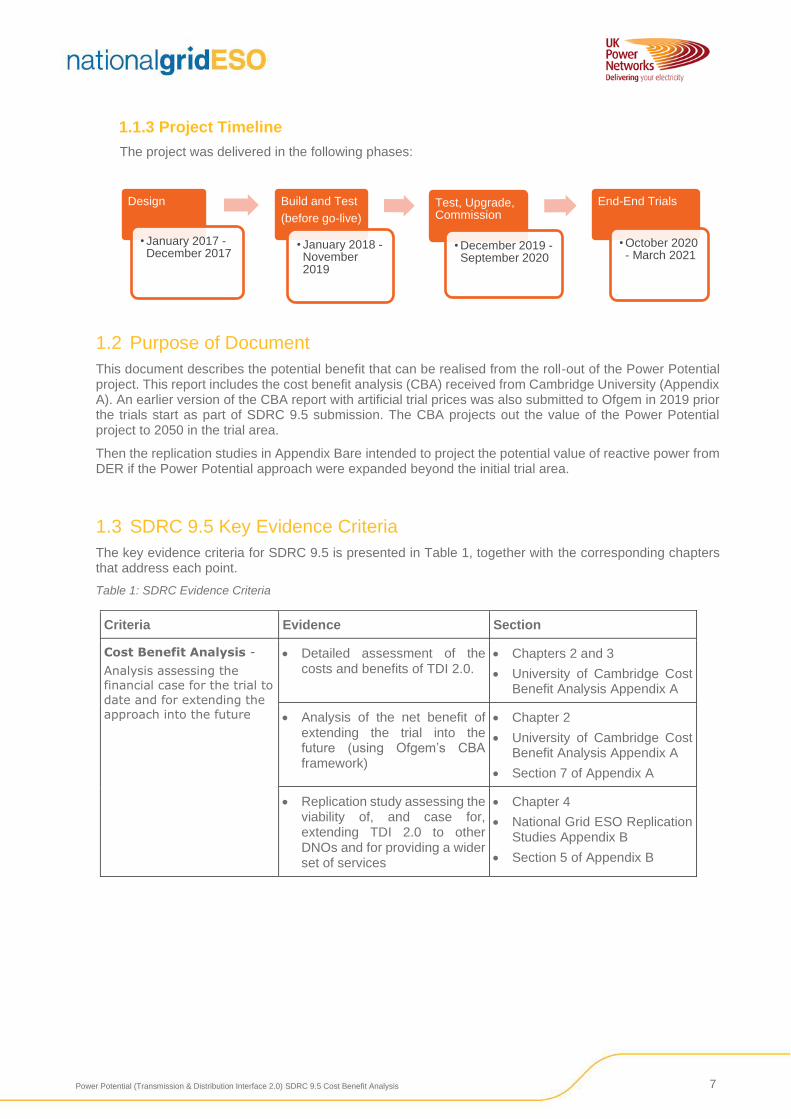
1.1.3 Project Timeline
The project was delivered in the following phases:
1.2 Purpose of Document
This document describes the potential benefit that can be realised from the roll-out of the Power Potential project. This report includes the cost benefit analysis (CBA) received from Cambridge University (Appendix A). An earlier version of the CBA report with artificial trial prices was also submitted to Ofgem in 2019 prior the trials start as part of SDRC 9.5 submission. The CBA projects out the value of the Power Potential project to 2050 in the trial area.
Then the replication studies in Appendix Bare intended to project the potential value of reactive power from DER if the Power Potential approach were expanded beyond the initial trial area.
1.3 SDRC 9.5 Key Evidence Criteria
The key evidence criteria for SDRC 9.5 is presented in Table 1, together with the corresponding chapters that address each point.
Table 1: SDRC Evidence Criteria
Criteria Evidence Section
Cost Benefit Analysis -
Analysis assessing the financial case for the trial to
date and for extending the approach into the future
• Detailed assessment of the costs and benefits of TDI 2.0.
• Chapters 2 and 3
• University of Cambridge Cost Benefit Analysis Appendix A
• Analysis of the net benefit of extending the trial into the future (using Ofgem’s CBA framework)
• Chapter 2
• University of Cambridge Cost Benefit Analysis Appendix A
• Section 7 of Appendix A
• Replication study assessing the viability of, and case for, extending TDI 2.0 to other DNOs and for providing a wider set of services
• Chapter 4
• National Grid ESO Replication Studies Appendix B
• Section 5 of Appendix B
Design
• January 2017 -December 2017
Build and Test
(before go-live)
• January 2018 -November 2019
Test, Upgrade, Commission
• December 2019 -September 2020
End-End Trials
• October 2020 - March 2021

Power Potential (Transmission & Distribution Interface 2.0) SDRC 9.5 Cost Benefit Analysis 8

Power Potential (Transmission & Distribution Interface 2.0) SDRC 9.5 Cost Benefit Analysis 9
2 Insights from University of Cambridge’s Cost Benefit Analysis
2.1 Objectives
An initial CBA was undertaken by National Grid ESO as part of the bid document for TDI2.0. The main objective of the University of Cambridge’s CBA reported in this document was to provide an updated and independent assessment of the value of reactive power services from DER.
The CBA builds upon a 2018 report completed by the University of Cambridge: ‘Reactive Power Management and Procurement Mechanisms: Lessons for the Power Potential Project’2. This report helped inform the Power Potential approach to the reactive power procurement process; this process is being used as the basis of the CBA. The analysis considers paying providers both availability and utilisation payments for the reactive power service.
2.2 Methodology
The CBA completed by the University of Cambridge focused on the benefit of using DER to deliver lead reactive power capability, when compared to the alternative option of building a Static Compensator (STATCOM). A STATCOM was chosen as the comparator, as this is the only standard available reactive device that can provide a fully dynamic reactive range, comparable to the Power Potential requirements. The dynamic reactive range is critical for post-fault voltage containment and forms a large component of the System Operator’s reactive power requirements. It is assumed that the same volume of DER will also contributes to the steady state reactive power as part of dynamic service to maintain voltage stability
The CBA from the University of Cambridge focuses on Net Present Value (NPV), comparing the difference between maintaining the current approach to asset investment compared with the use of DER for reactive power. Three main scenarios were considered:
• the current approach to asset investment (Scenario 1) - new assets are represented by STATCOMs only;
• market based procurement from DER (Scenario 2) – a combination of STATCOMs and DER in a smart selection to minimise cost
• a combination of STATCOMs, market-based procurement from DER and ‘free’ optimisation of DNO assets (Scenario 3).
The data assumptions were taken from NG ESO and UK Power Networks information as outlined in Section 5 of the CBA report in Appendix A.
2.3 Results
A complete version of the University of Cambridge’s CBA can be found in Appendix A, including full description of all scenarios and cases used in methodology.
The CBA assumes that a market-based solution is available for DER participation nominally from 2020.
Tables 2 and 3 below (taken from Table 10 and 11 in Cambridge University CBA report) summarise the results of comparing scenario 1 (asset solution) and scenario 2 (smart combination of STATCOM assets and PP DER services) and scenario 1 (asset solution) and 3 (smart combination of STATCOM assets, PP DER services plus free distribution network optimisation). This is based on a DER Availability Price (shown as AP) and Utilisation Price (shown as UP) from trials and STATCOM expenditure of £24.4m per 200 Mvar unit (based on ETYS average price, 200 Mvar standard unit), connected to the transmission network.
2 The Reactive Power Management and Procurement Mechanisms: Lessons for the Power Potential Project formed part of SDRC 9.3 and can be found: https://www.nationalgrid.com/sites/default/files/documents/EPRG%20Report%20SDRC%209.3.pdf

Power Potential (Transmission & Distribution Interface 2.0) SDRC 9.5 Cost Benefit Analysis 10
Table 2: Benefits for the Case 1 with central case for DER prices (Scenario 2 v Scenario 1)
Table 3: Benefits for the central case considering network optimisation (Scenario 3 v Scenario 1)
Results from the trials indicated average accepted prices for availability and utilisation of £1.46/Mvarh and £4.80/Mvarh respectively (DER prices discounted to 2018 prices and before adjusting for effectiveness) and an average effectiveness factor of 74.1%.
A utilisation factor of 19.2% has been applied in the CBA (i.e. historical average for transmission-connected plant), 18.1% utilisation factor was seen in the trials. As explained in 2.2 the CBA consider only lead reactive power capability.
As noted in SDRC 9.6, the accepted prices in trials were guided by the project budget. A target Average Cost was used in assessment logic to ensure service nominations were kept within the budget limit. The prices were subsequently compared to average prices of alternative options reported in SDRC 9.6.
The benefit in 2050 is calculated to be between £8.7 million and £42.3 million depending on how DERMS is used i.e. whether additional benefit is assumed from distribution network optimisation (Table 2 v Table 3), and the DER participation rate within the region (25% to 100%). The headline figure for 100% DER participation and without additional network optimisation is £19.5m benefit in 2018 prices.
In an optimal combination of STATCOM and DER services (Scenario 2), and 75% DER participation, Cambridge’s analysis indicates on an NPV basis in 2030 that the STATCOM cost would be ~£30m and the DER services market would be ~£8m. In the 100% participation scenario for 2050 which gives net benefits of £19.5m in the trial area, this would be delivered with a STATCOM cost of ~£115m and a DER services market worth nearly £40m in the trial region, on a net present value basis.
year 25% 50% 75% 100%
(£m) (£m) (£m) (£m)
2020 1.0 1.0 1.3 2.5
2030 3.9 6.6 8.3 9.0
2040 6.4 10.6 12.3 14.2
2050 8.7 14.1 17.0 19.5
% DER Participation
Note: Based on AP of £1.46/Mvar/h, UP of £4.80/Mvarh
year 25% 50% 75% 100%
(£m) (£m) (£m) (£m)
2020 3.4 3.4 3.4 4.8
2030 16.0 18.4 18.9 20.7
2040 25.0 29.0 30.1 32.3
2050 32.0 36.7 39.4 42.3
% DER Participation
Note: Based on AP of £1.46/Mvar/h, UP of £4.80/Mvarh

Power Potential (Transmission & Distribution Interface 2.0) SDRC 9.5 Cost Benefit Analysis 11
2.4 Additional Potential Benefits
Further impacts of the Power Potential procurement approach were identified in the University of Cambridge’s CBA. These additional benefits have not been quantified, however do contribute to the overall success and value of the project.
Future competitive procurement
If competitive procurement were extended to transmission connected generators (not just DER) this might significantly increase liquidity and reduce the delivered cost of reactive power procurement via the mandatory reactive power market in Great Britain. This only applies, if the tendered prices are below the current ORPS pricing mechanism outlined in the CUSC3.
Smart operation of distribution network
In Scenario 3 the potential additional contribution of extra Mvars from optimising the operation of distribution networks assets (setting of tap changing transformers, reactive compensators, network reconfiguration) was identified. The CBA evaluates the value from this additional benefit, assuming zero additional costs4 to enable that optimisation (as in Strbac et al., 2018). It was assumed that the size of these extra Mvars (leading) is 185 Mvar5.The cost of these ‘free’ Mvars was not estimated as the focus in Power Potential was on utilisation of distributed generation in addressing voltage problems at the transmission level.
Lagging reactive capability
The focus of the CBA was on the value realised by deferring or avoiding investment in reactive assets on the transmission system to manage periods of high active power flows out of the Power Potential trial area. In times of low flows on the transmission system there is an even greater need for lagging reactive capability, the additional benefit that can be realised for using DER to meet this need has not been assessed as part of this work. Further work could be undertaken to consider the full range of the dynamic response in the assessment of the benefits in the CBA.
Cambridge indicated that if competitive procurement of lagging reactive power were modelled, there would be some smaller additional benefits arising from situations where the procurement of lagging reactive power from DER was cheaper than other sources. This situation is likely to be much less common than for leading reactive power and the unit savings likely less because they would arise from savings in utilisation payments to transmission connected generators and not in the numbers of reactive assets, which drives the NPV calculation.
However, any unit savings may depend on the level of voltage management actions that also include the cost associated with synchronising generating plant. National Grid ESO has seen increased synchronisation and utilisation costs to manage voltage requirements in the South East. The cost has increased from £7.26m in 2019 to £9.2m in 2020.
Drive innovation in reactive assets
Competitive procurement may also drive further innovation in reactive assets. The CBA completed by the University of Cambridge assumes the same real price of a STATCOM over the whole time period of the analysis, in the same 200 Mvar unit. If competitive procurement drove innovation in reactive assets, increasing flexibility in their size and unit cost, this would be a further benefit of Power Potential.
3 The default payment rate calculation for Obligatory Reactive Power Service (ORPS) is outlined in Appendix 1 of Schedule 3 in the CUSC. 4 This is an important assumption made in this study, in agreement with Strbac et al. (2018). However, there would be additional costs for the DNO in releasing this capability. 5 We assume free Mvars from Bolney (75 Mvar), Ninfield (60 Mvar) and Sellindge (50 Mvar). See Strbac et al. (2018), Section 3.

Power Potential (Transmission & Distribution Interface 2.0) SDRC 9.5 Cost Benefit Analysis 12
Losses
More flexible use of DER to provide reactive power can also reduce system losses. To the extent that more reactive power capability in the distribution system leads to better constraint management and that additional thermal transfer capacity reduces the need to thermally stress network assets, this might be an additional benefit from DER participation in reactive power markets.
In 2020, UK Power Networks worked with Imperial College to understand the potential impact of Power Potential on distribution losses in a BAU application6.. This identified that the Power Potential approach could marginally affect losses on the 132kV and 33kV networks. If Power Potential services were used in a preventive mode (as studied), they could increase distribution losses, but these could be offset by reductions in transmission losses. However, in a corrective mode (as trialled), dispatched only when needed to alleviate voltage problems at transmission, the impact on distribution losses would be negligible. Further, if Power Potential is used in a corrective mode, the market platform could manage energy losses when voltage management was not required to address system constraints and could reduce losses at those voltage levels by 1.3%. In the future, reactive power optimisation algorithms in DERMS could explicitly consider network energy losses and promote stronger coordination between ESO and DSO, to bring the maximum benefit of voltage and reactive power management to both distribution and transmission networks.
Reduce curtailment
If competitive provision also freed up additional thermal capacity for export from the four GSPs that would further enhance the value of Mvar reduction at the GSP. It would do this by reduced DG curtailment or even more connection on the distribution system behind the four GSPs. Either of these would significantly enhance the benefits of the procurement exercise. For instance, if better reactive power management increased thermal capacity by 100 MW for 180 hours in one year in 10 years’ time, this would add £0.6m to our NPV (at £50/MWh)7.
6 UK Power Networks_ICL_Impact-of-Power-Potential-on-Distribution-Network-Losses_Jan_2020_Final-update (ukpowernetworks.co.uk) 7 See page 9 of Appendix A

Power Potential (Transmission & Distribution Interface 2.0) SDRC 9.5 Cost Benefit Analysis 13
3 Exploration of the costs for DERMS delivery beyond the trial
3.1 Understanding DERMS costs
The DERMS (Distributed Energy Resources Management System) is the system that has been developed within the Power Potential project to support the technical and commercial optimisation and dispatch of DER. The DERMS system is essential as the enabler to the participation of DER in reactive power provision and therefore the cost of DERMS is a key assumption for the cost benefit analysis. The capital and operational costs of developing and implementing this new system for the Power Potential trial are covered by the project budget (£6.2m budgeted total for UK Power Networks and ZIV Automation, to develop DERMS and all associated UK Power Networks infrastructure). The DERMS software is a shared development between NGESO and UK Power Networks as project partners.
A large portion of the costs of setting up DERMS are associated with delivering the services as a trial for the first time. As a pioneer of this new approach, the project needed to define the requirements for the solution to be developed and procured, identify a developer, develop a detailed system and integration design, The project partner and developer then worked together to create and integrate the solution, addressing issues arising during testing, integration and trials. So, as an example, while the design and requirements would need to be reviewed based on the trial learning for BAU application, and the new implementation retested, this would benefit from the build, test and trial experience as outlined in SDRC 9.6. Moreover, the costs of deploying and commissioning the control system and each DER would be expected to decrease over time due to the learning process involved in the trial. In addition, economies of scale would apply to a large-scale roll-out, so the cost of implementing the DERMS system would decrease significantly.
Thus, when extending beyond the trial area as BAU, the total cost of developing and implementing DERMS (which includes developer costs and DNO costs) is estimated approximately £1.2m per DNO licence and £0.33m per additional GSP. Operational costs including DER recruitment, DERMS licensing and support, etc. are estimated to be around £0.3m per year.
However as outlined in section 6 of SDRC 9.6, the trial has identified additional development areas for DERMS, PAS and the associated systems to be able to transition to BAU. These additional developments have not yet been costed.
Furthermore, as outlined in section 7 of SDRC 9.6, future DERMS developments would be part of the platform for enabling a wide variety of DER flexibility services, not just reactive power services. Thus, only a proportion should be assigned to Power Potential versus to other additional functionalities and benefits achieved by DERMS. Estimating this proportion is not straightforward and would require quantifying the costs and benefits from implementing DERMS for other activities beyond the trial, such as whole system solutions and those outlined in the next section.
The CBA has considered an indicative DERMS cost figure for Power Potential, which is 10% of the estimated cost of developing and implementing DERMS in the trial area network (equivalent to a capital cost of £0.12m and an annual operational cost of £0.03m). The indicative 10% factor represents a UK Power Networks estimate, and is based on the DERMS costs being shared with other services additional to the reactive power provision from DER.
National Grid ESO costs associated with upgrades of its Platform for Ancillary Services to deliver the Power Potential assessment and nomination process are included in the CBA.
3.2 Benefits of DERMS beyond Power Potential
The DERMS has been designed and was used as part of the Power Potential project specifically focused on the dispatch of DER to offer dynamic voltage control (through the provision of reactive power). However, such a system could bring other benefits too.
We can classify potential benefits considering whether investment is avoided, or operational cost reduced in the transmission system or distribution system, or whether balancing costs or generation costs are reduced.

Power Potential (Transmission & Distribution Interface 2.0) SDRC 9.5 Cost Benefit Analysis 14
• Transmission
o The Power Potential project tackles the provision of reactive power to the transmission system, which results in delayed/avoided investment in reactive power assets. Power Potential also allows procuring flexibility from DER in respect to active power, which could help defer network reinforcements linked to thermal capacity (constraint management). Power Potential provides evidence that could enable whole system solutions.
• Distribution
o Enhanced visibility of the distribution network e.g. highlighting specific monitoring improvements on the network, at DERs, and state estimation, may allow for optimised maintenance on the network, shifting towards more predictive maintenance and faster response to faults and other technical issues.
o The provision of flexibility from DER in terms of active and reactive power could be used by the DNO for voltage control and constraint management in the distribution network, avoiding network reinforcement and voltage control assets (subject to additional operational costs), in the same way as Power Potential is demonstrating for the transmission system. The DERMS itself could be adapted or designed to enable additional functionalities for reactive power services, such as static requirements.
o In combination with DERMS and flexibility from DER, further distribution investment aimed at increasing controllability of the network would enable a more optimal operation of the system, allowing reconfiguration of the network which could enhance the effect of the benefits described above. A more optimised operation of the distribution system could avoid network reinforcement further, reduce technical losses and improve fault management.
• Generation and balancing costs
o Enhancing flexibility provision from DER would reduce network technical losses and balancing costs, which would reduce total generation costs. Furthermore, the contribution of DER flexibility to peak demand reduction would lead to a reduction of required generation investment.
Some advanced aspects of the costs of delivering DERMS (e.g. export of a network model in CIM-compliant format from a network management system to DERMS, load flow and state estimation) are included in the estimates above, but would also be used with development of other services such as active network management and flexibility services. Thus, the costs of the network model for DERMS in IEC CIM format, state estimator, load flow, and associated IT infrastructure would be split among the different services, where reactive power provision from DER would be associated with a fraction of this. As noted in SDRC 9.6, the trial DERMS delivered reactive power services without CIM, state estimation or load flows so these were not necessary pre-requisites for service delivery within the trial scenario.
3.3 Approach to DERMS costs within CBA
The NPV benefits from Tables 2 and 3 can also be interpreted to provide insights as to when the benefit of Power Potential DER services is greater than the investment in DERMS for BAU. Under the central assumptions for Scenario 1 v Scenario 2 in Table 2 (based on DER participation factor of 75%, availability price of £1.46/Mvar/h and utilisation price of £4.80/Mvarh), the NPV benefits are £1.3m for 2020, £8.2m for 2030; and £12.3m for 2040. This indicates the benefits of implementing DERMS and DER reactive power provision (compared to business-as-usual use of just STATCOMs) would surpass the indicative capital cost of the DERMS (£0.12m, based on a 10% factor) from the first year, based on nominal 2020 start of the service. Even if the whole initial cost of DERMS were assigned to Power Potential (£1.2m), this indicates the benefits of implementing DERMS and DER reactive power provision would surpass the indicative capital cost of the DERMS of £1.2m in the first year, based on nominal 2020 start of the service.
This review of the break-even point indicates the business case would be positive even if no other benefits were considered from DERMS, and the full cost of DERMS were assigned to reactive power provision from DER for the transmission system.

Power Potential (Transmission & Distribution Interface 2.0) SDRC 9.5 Cost Benefit Analysis 15
4 Insights from Replication Studies
4.1 Objectives
Replication studies were completed to understand and identify other areas of the system where the Power Potential philosophy could be successfully implemented. The aim was to evaluate the total system benefits that could be obtained in future. A complete write up of the replication studies can be found in Appendix B.
4.2 Methodology
The replication studies build on the cost benefit analysis from the University of Cambridge, therefore assumptions, such as DERMS cost that are built into the initial cost benefit analysis, continue throughout the replication studies.
Due to the regional nature of reactive power, which is dependent on network configuration, generation and demand patterns, it is not necessarily appropriate or valuable to implement the project philosophies across the whole country. In some areas, there was the potential for it to be beneficial, however the reactive requirements in these regions were different to the trial region, and therefore the cost benefit would be different. Network and statistical studies were carried out to determine the most appropriate regions, only areas with similar characteristics have been used for the replication studies. The requirements for dynamic voltage control were assessed across 36 voltage zones. This filtered the GSP replicability according to network requirements, choosing only the ones that present dynamic voltage management requirement needs for containment and recovery to manage post-disturbance voltage. In the selected zones, dynamic voltage control requirements include the steady state cases.
Only 17 zones fulfilled these criteria. This is in addition to the two voltage zone regions that are part of the Power Potential trial area, the benefit of which have been calculated in the University of Cambridge’s CBA. This equated to a total of 220 GSPs out of a possible 355 GSPs on the GB transmission system (62%), for these 19 voltage zones. Figure 1 in Appendix B illustrates the location of the additional regions captured by the replication studies.
4.3 Results
The replication studies demonstrate the expansion of the Power Potential project could save energy consumers over £96m by 2050 when rolled out to 19 transmission voltage zones within Great Britain. Table 4 outlines the different potential benefits depending on different participation rates within the DER community. This calculation uses the central case outlined in the University of Cambridge’s CBA, where scenario 1 and scenario 2 are compared to calculate the benefit.
Table 4: Calculation of benefit of applying Power Potential across GB (following replication studies)
Year
% DER Participation
25% 50% 75% 100%
Benefit (£m) Benefit (£m) Benefit (£m) Benefit (£m)
2020 5.0 5.0 6.5 12.6
2030 20.2 34.1 42.9 46.5
2040 31.7 52.6 61.0 70.4
2050 43.1 69.9 84.3 96.7
The generators above 100 MW were excluded from the project framework, as they are subject to Grid Code reactive power requirements.
It is evident from these results that, increased DER participation significantly increases the potential benefit from the service. It should be noted when deployed to multiple regions, even with reasonably low DER participation, the benefits are significant.

Power Potential (Transmission & Distribution Interface 2.0) SDRC 9.5 Cost Benefit Analysis 16
4.4 Comparisons of Results with the TDI 2.0 Bid CBA
The roll out of the Power Potential service has a lower benefit than initially forecasted in the bid, as both studies followed different assumptions. These replication studies update the initial benefits calculated in the project bid and are more precise. The bid results followed an initial high-level analysis that assumed replication in all transmission voltage zones and did not account for specific DER projections in each GSP (with input from the Future Energy Scenarios), which explains the difference.
The methodology used in the replication studies, identified areas with similar reactive power need to the Power Potential trial region. This has reduced the number of regions where the University of Cambridge’s analysis can be extended (62% of the GB transmission system) potentially reducing the benefit.
The requirements have not been updated with latest FES scenario, in order to keep the consistency with original DER prediction used in the Cambridge University CBA report. However, this is something to be considered in the further CBA work.
Finally, plants with a capacity greater than 100 MW and the reactive power support from the interconnectors (which were originally accounted in the bid) have not been considered in the replication studies as these are subject to an Obligatory Reactive Power Service and, at the moment, cannot replicate the Power Potential concept. This has significantly affected the overall benefit from the original bid CBA. A summary of these different assumptions in the two CBA studies is shown in Table 5.
Table 2: Assumptions in TDI 2.0 bid CBA vs. assumptions in updated Power Potential CBA
Assumption TDI 2.0 Bid Power Potential SDRC 9.5
Replicability 1. All Great Britain 2. Only in a defined number of voltage zones, according to network requirements for dynamic voltage service for containment and recovery post-disturbance
DER projections 3. Growth projection, assumed to be the same for all considered zones
4. DER projection per GSP (DER prediction used in the Cambridge University CBA report)
DER size 5. All DER can participate 6. DER sized above 100MW cannot participate
7. DER sized below 1 MW cannot participate
Other 8. Interconnector contribution included
9. No interconnectors contribution included
Whilst steady state operation requires absorption of reactive power as the system experiences high voltage in steady state, National Grid Electricity System Operator is required to secure the system following sudden and unexpected loss of plant and apparatus, as specified in the Security and Quality of Supply Standards (SQSS8). This loss of plant and apparatus will generate low system voltages, which will de-stabilise the system unless lagging reactive capability (reactive power) is available to support the system voltages. Hence, the dynamic nature of the PP solution, requires suppliers to automatically and quickly change reactive power state in response to voltage change.
8 https://www.nationalgrideso.com/codes/security-and-quality-supply-standards
Power Potential (Transmission & Distribution Interface 2.0) SDRC 9.5 Cost Benefit Analysis 17
5 Summary
This report has provided the cost benefit analysis completed by the University of Cambridge and a discussion of this.
5.1 CBA
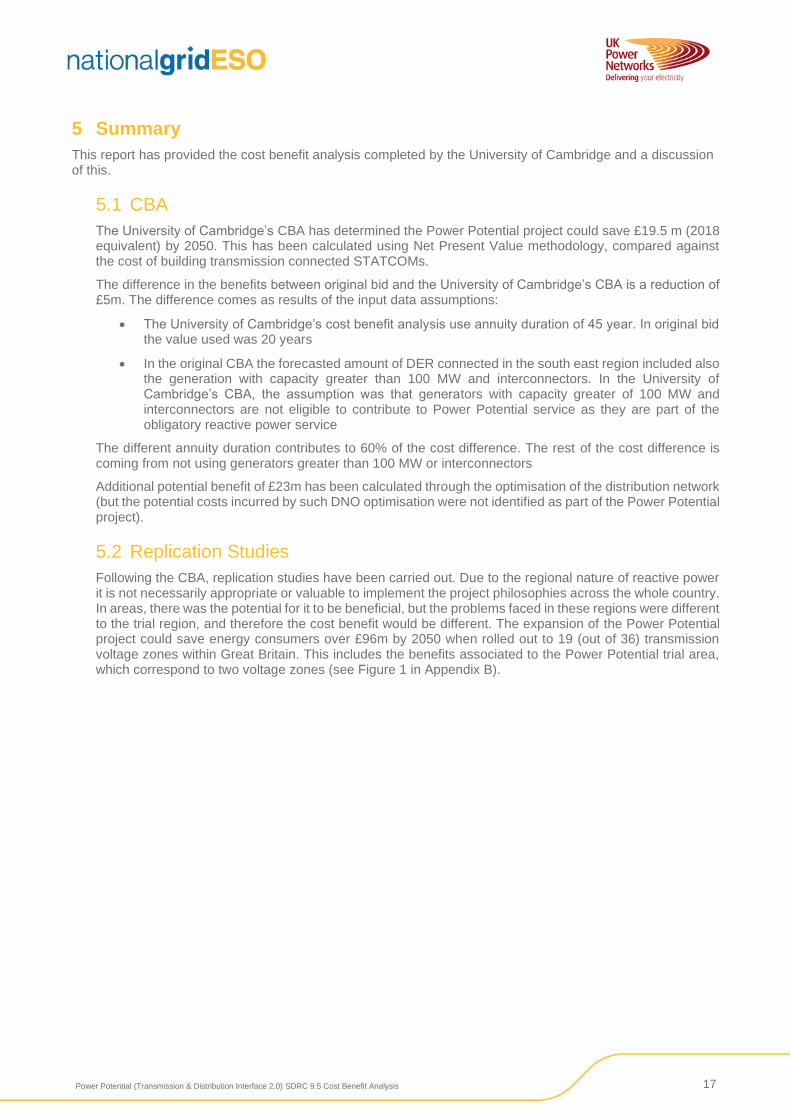
The University of Cambridge’s CBA has determined the Power Potential project could save £19.5 m (2018 equivalent) by 2050. This has been calculated using Net Present Value methodology, compared against the cost of building transmission connected STATCOMs.
The difference in the benefits between original bid and the University of Cambridge’s CBA is a reduction of £5m. The difference comes as results of the input data assumptions:
• The University of Cambridge’s cost benefit analysis use annuity duration of 45 year. In original bid the value used was 20 years
• In the original CBA the forecasted amount of DER connected in the south east region included also the generation with capacity greater than 100 MW and interconnectors. In the University of Cambridge’s CBA, the assumption was that generators with capacity greater of 100 MW and interconnectors are not eligible to contribute to Power Potential service as they are part of the obligatory reactive power service
The different annuity duration contributes to 60% of the cost difference. The rest of the cost difference is coming from not using generators greater than 100 MW or interconnectors
Additional potential benefit of £23m has been calculated through the optimisation of the distribution network (but the potential costs incurred by such DNO optimisation were not identified as part of the Power Potential project).
5.2 Replication Studies
Following the CBA, replication studies have been carried out. Due to the regional nature of reactive power it is not necessarily appropriate or valuable to implement the project philosophies across the whole country. In areas, there was the potential for it to be beneficial, but the problems faced in these regions were different to the trial region, and therefore the cost benefit would be different. The expansion of the Power Potential project could save energy consumers over £96m by 2050 when rolled out to 19 (out of 36) transmission voltage zones within Great Britain. This includes the benefits associated to the Power Potential trial area, which correspond to two voltage zones (see Figure 1 in Appendix B).

Power Potential (Transmission & Distribution Interface 2.0) SDRC 9.5 Cost Benefit Analysis 18
5.3 Future improvement for the CBA analysis
DER service comparison against current voltage management costs
The CBA methodology considers the long-run transmission-investment alternative to procuring voltage support from DER, but not the shorter-term or current system costs for maintaining voltage levels on the network from Grid Code compliant generators. NGESO currently accesses voltage support from a mixture of TO network assets and the Obligatory Reactive Power Service (ORPS) as defined in the Grid Code. The Grid Code also defines how all large generators are instructed with reactive capability to provide Mvar support via the ORPS. A payment is made at a standard £/Mvarh rate to instructed generators and this rate is updated monthly in line with the methodology in Section 4 of the CUSC.
NGESO also incurs synchronisation costs for bringing on additional out of merit generators to provide voltage support on the system, these costs will vary from region to region. The generator will also provide several other benefits such as stability, inertia, increased fault levels, frequency response.
Data is provided by NGESO on out turn system costs for maintaining voltage levels on the network, and indicates in the South East England region, these costs were £9.2m in 2020. More information can be found here: https://data.nationalgrideso.com/constraint-management/outturn-voltage-costs
The time-of-day and year of the Mvar requirement is expected to be particularly relevant in shorter-term analysis, due to the need to ‘trade on’ specific generators to meet a requirement for voltage support. This variation in cost by time of day is not relevant to an asset-based solution such as a STATCOM. National Grid ESO’s ‘Future of Reactive Power’ work should consider the value of DER in providing an alternative to the current short-term cost options of addressing voltage support. This will need to be done by undertaking a detailed assessment of the various benefits and challenges associated with each option.
Additional benefits for extended reactive power services
The scope of the original CBA assesses the benefits associated with dynamic lead voltage control including steady state case, given that the South East has a need for dynamic control to support sudden drops in voltage due to faults on the network. Despite the CBA using only leading reactive for the analysis, due to the limitations of the CBA tool, the replication studies have included GSPs where dynamic voltage control for both pre and post faults support is required. For future development, a comprehensive CBA tool that can cover the full dynamic range (lead and lag) needs to be developed to present the benefits more accurately.
In addition to dynamic voltage control services, the Power Potential project also provides relevant learning for the development of other future reactive power services from DER. If the additional learning is evaluated that could potentially lead to greater benefits.
Higher available volume of DER reactive power resources
The CBA uses the DER MW capacity forecast, and then makes a simple assumption that DER can offer Mvar based on their installed MW capacity and a 0.95 power factor. The trialled DERMS approach is based on a defined operational envelope per DER rather than offering reactive response up to a 0.95 power factor restriction. The DERMS approach removes power factor restrictions and allows each DER to operate within a defined ‘PQ’ operational envelope i.e. with a permitted Mvar range at each level of active power MW output.
Future updates of the CBA could consider this wider reactive operating range and the higher value of the reactive power from DER.
However, on the scale of Mvar available during the Power Potential trials, this did not have big impact on final CBA results in aggregate. However, greater flexibility to offer more reactive power was an outcome during the trials for certain generator types (solar, battery) and when the DER were operating at low active power levels.
In addition, it may be possible in future to access reactive volume from smaller generators less than 1 MW, by developing an API and aggregator solution for DERMS to request reactive power services. SDRC 9.6 explains that this was explored but not trialled.

Power Potential (Transmission & Distribution Interface 2.0) SDRC 9.5 Cost Benefit Analysis 19
Quicker DER connections
An increase in reactive capability available to manage the electricity system, can increase active power exports between the distribution and transmission networks. It would therefore be possible to allow more providers to connect in the same area before investment in new assets is required. In congested areas of the network, like the south coast, this would facilitate quicker connections with a reduced need to curtail these new generators in times of high active power output.
Most new generation looking to connect in the distribution network are either small storage providers (such as batteries) or renewable sources of generation (such as PV or wind). The ability to facilitate such connections is critical to the delivery of the de-carbonisation agenda, and Power Potential could help with this.
Update of other CBA inputs
The CBA analysis was initially run in 2019 and was updated in 2021 to reflect the average effectiveness of trial participants, and the average accepted availability price and average accepted utilisation price in Wave 2 trials. Other inputs remain at their original values including the nominal start year of the services, currently connected transmission-connected and distribution-connected generation, and their forecasts. The reactive requirement in the base year could also be reviewed against current system needs. A future update for these factors needs to be considered for any further modelling of the CBA that could increase or decrease the overall benefits.

Appendices Appendix A – Cambridge CBA

Power Potential (Transmission & Distribution Interface 2.0) SDRC 9.5 Cost Benefit Analysis 1
A Cost Benefit Analysis for the Power Potential project9
Final Report (updated)
by
Karim L. Anaya
Michael G. Pollitt
Energy Policy Research Group
University of Cambridge
A report prepared for National Grid ESO
23 April 2021
9 The authors wish to thank all of their colleagues on the Power Potential project at National Grid and UK Power Networks. Their input has
been very significant and extremely helpful. Funding from National Grid via the Network Innovation Competition is acknowledged. All errors are our own.

Power Potential (Transmission & Distribution Interface 2.0) SDRC 9.5 Cost Benefit Analysis 2
Contents – Appendix A
Executive Summary 4
1. Introduction 5
2. Background on Reactive Power 7
3. Reactive Power Procurement in GB 8
4. Cost-Benefit Analysis Methodology and Scenarios 11
4.1. About the CBA methodology .................................................................................................................. 11
4.2. Scenarios ................................................................................................................................................ 12
5. Data Collection and Assumptions 14
6. Understanding the Empirical Analysis 15
6.1. Reactive Power System Requirements 15
6.2. Reactive Power Availability 16
6.3. RP Procurement from DER under PP 17
7. Results and Discussion 19
7.1. The Business As Usual approach (S1) ................................................................................................... 19
7.2. Case 1 (S1-S2) ....................................................................................................................................... 19
7.3. Case 2 (S1-S3) ....................................................................................................................................... 22
7.4. The impact of transmission capacity issues on the CBA ........................................................................ 24
8. Testing the CBA robustness with live trial results 25
8.1. About the live trial 25
8.2. Pricing information, effectiveness and utilisation factors 25
8.3. Case 1 (S1-S2) 26
8.4. Case 2 (S1-S3) 27
9. Conclusions 29
References 30
Appendix 1: Variables, sources and assumptions 31

Power Potential (Transmission & Distribution Interface 2.0) SDRC 9.5 Cost Benefit Analysis 3
List of Figures
Figure 1: GSPs Location .........................................................................................................
.............................................................................................. Error! Bookmark not defined.
Figure 2: Generation mix at each GSP (only units connected at distribution) ..........................
.............................................................................................. Error! Bookmark not defined.
Figure 3: Share of generation mix (aggregated figure for the four GSPs) ................................
.............................................................................................. Error! Bookmark not defined.
Figure 4: Reactive Power Capability of a Generating Unit .......................................................
.............................................................................................. Error! Bookmark not defined.
Figure 5: Reactive power system requirements at transmission (due to generation connected at
transmission and distribution networks) ..................................................................................
.............................................................................................. Error! Bookmark not defined.
Figure 6: Available reactive power support from different sources ..........................................
.............................................................................................. Error! Bookmark not defined.
Figure 7: Trend of average utilisation profile of reactive power in the PP region (period April 2016-
April 2018) ..............................................................................................................................
.............................................................................................. Error! Bookmark not defined.
Figure 8: Total bid value (availability and utilisation prices) over time under different scenarios of
DER participation (50, 75 and 100%) ......................................................................................
.............................................................................................. Error! Bookmark not defined.
Figure 9: Reactive power system requirement versus baseline availability .............................
.............................................................................................. Error! Bookmark not defined.
Figure 10: Contracted DER versus full DER availability – with smarter selection ....................
.............................................................................................. Error! Bookmark not defined.
Figure 11: Contracted DER versus full DER availability – DER come first...............................
.............................................................................................. Error! Bookmark not defined.
Figure 12: Sensitivity Analysis for Availability Prices – Case 1 (75% participation of DER) .....
.............................................................................................. Error! Bookmark not defined.
Figure 13: Contracted DER under Case 1 and Case 2 (75% participation of DER) .................
.............................................................................................. Error! Bookmark not defined.
Figure 14: Sensitivity Analysis for Availability Prices – Case 2 (75% participation of DER) .....
.............................................................................................. Error! Bookmark not defined.
Figure 15: Reactive power system requirements and released capacity under BAU ...............
.............................................................................................. Error! Bookmark not defined.
Figure 16: Hours accepted and Mvars utilised per type of technology in live trial (period Jan.-March.
2021) ......................................................................................................................................
.............................................................................................. Error! Bookmark not defined.
Figure 17: Benefits expressed as % of BAU solution for Case 1 (with prices from live trial) ....
.............................................................................................. Error! Bookmark not defined.
Figure 18: Bid and Stacom costs (NPV) for Case 1 (with prices from live trial) .......................
.............................................................................................. Error! Bookmark not defined.
Figure 19: Benefits expressed as % of BAU solution for Case 2 (with prices from live trial) ....
.............................................................................................. Error! Bookmark not defined.
Figure 20: Bid and Stacom costs (NPV) for Case 1 (with prices from live trial) .......................
.............................................................................................. Error! Bookmark not defined.
List of Tables

Power Potential (Transmission & Distribution Interface 2.0) SDRC 9.5 Cost Benefit Analysis 4
Table 1: Reactive power costs under the ORPS and voltage constraint management scheme at 38
GSPs in the area that includes our 4 GSPs ............................................................................
.............................................................................................. Error! Bookmark not defined.
Table 2: Summary of Scenarios ..............................................................................................
.............................................................................................. Error! Bookmark not defined.
Table 3: Summary Table of Sensitivities covered in the CBA ..................................................
.............................................................................................. Error! Bookmark not defined.
Table 4: Descriptive Figures at the four GSPs ........................................................................
.............................................................................................. Error! Bookmark not defined.
Table 5: Interconnector Characteristics ...................................................................................
.............................................................................................. Error! Bookmark not defined.
Table 6: Benefits for the Case 1 with central case for DER prices .......................................... 10
Table 7: Sensitivity Analysis for Utilisation Prices – Case 1 (75% participation of DER) ..........
.............................................................................................. Error! Bookmark not defined.
Table 8: Benefits for the central case considering network optimisation .................................. 10
Table 9: Sensitivity Analysis for Utilisation Prices – Case 2 (75% participation of DER) ..........
.............................................................................................. Error! Bookmark not defined.
Table 10: Benefits (with prices from live trial) ..........................................................................
.............................................................................................. Error! Bookmark not defined.
Table 11: Benefits considering network optimisation (with prices from live trial) ......................
.............................................................................................. Error! Bookmark not defined.
Executive Summary
This study forms part of the Power Potential project which looks at the scope for creating reactive power markets in a specific trial area, as part of the Network Innovation Competition.
This study considers the contribution distributed energy resources (DER) could make by displacing conventional network assets (i.e. STATCOMs) in supplying reactive power support to a specific area in the South of England in combination with the current approach (which consists of both a planning and an operational element).
We introduce the definition of reactive power (measured in Mvars) and discuss reactive power management and procurement methods in GB.
We discuss the rising need for absorptive reactive power in our trial area, driven by the rapid connection of renewable generation in an area of low demand growth.
We construct two cases of how competitive procurement from DER of leading (absorptive) reactive power might reduce the need for conventional reactive assets (STATCOMs). A cost-benefit methodology is used for estimating the benefits of introducing the participation of DER in reactive power supply. Benefits are given by the difference (cost effectiveness) of net present value (NPV) of two alternative cases (Case 1 and Case 2) that involve the participation of DER. We then use price information from the PP live trial conducted between January and March 2021 to evaluate the robustness of the CBA and to estimate benefits using actual prices.
Case 1 considers how competitive procurement of variable amounts of reactive power can reduce the need for the addition of STATCOMs which must be invested in ahead of need and in fixed increments of capacity. The results suggest a NPV of £14.3m from competitive procurement (at 100% DER participation, by 2050). This net benefit is equivalent to approximately 8% of the cost of the business as usual (BAU) solution. Lower competitive prices and higher DER participation increase these benefits.

Power Potential (Transmission & Distribution Interface 2.0) SDRC 9.5 Cost Benefit Analysis 5
Case 2 includes the additional impact of better utilization of the existing reactive potential of the distribution system to reduce the demand for Mvars. This gives a further increase in NPV for our central case of around £23m (average figure) by 2050, or 13% of BAU cost.
Results from the live trial suggest that the estimated weighted average prices submitted by DER (availability and utilisation) are within the range of prices proposed in the CBA. Higher discounted savings are observed when these prices are incorporated in the analysis. For instance, if the prices observed in the trial were to be sustained over the whole period of the analysis, this would further increase the NPV of competitive procurement by around £5m out to 2050 (at 100% DER participation) in Case 1 and Case 2.
In our conclusions, we discuss five potential sources of additional benefits on top of those we identify. These arise from increasing the thermal capacity of lines due to improved reactive power management; reduced system losses; reduced reactive asset unit costs due to competition with DERs; savings on lagging reactive power procurement; and competition with transmission connected generators who currently provide reactive power.

Power Potential (Transmission & Distribution Interface 2.0) SDRC 9.5 Cost Benefit Analysis 6
Introduction
Power Potential (PP) is a first of a kind initiative in Great Britain (funded under the Network Innovation Competition run by the GB energy regulator, Ofgem) that promotes the use of distributed energy resources (DER)10 in the provision of reactive power support to the transmission system operated by National Grid using a market-based mechanism. PP seeks to procure reactive power from DER located in the distribution network operated by UK Power Networks (UKPN). In contrast with transmission connected generators, DER improve the spatial distribution of reactive resources in the system. For more details on the PP project and a discussion of theory and evidence on reactive power procurement from around the world see our earlier PP paper: Anaya and Pollitt (2020).
The aim of this study is to produce a cost-benefit analysis (CBA) to quantify the benefits of the PP project. The CBA involves three different scenarios: Business As Usual (BAU) - scenario (S1) - which consists in matching the gap between reactive power system requirements and existing reactive power capability by acquiring network assets for reactive power (specifically, STATCOMs). The other two scenarios (S2, S3) involve a more competitive approach with the provision of reactive power support from DER and potential additional resources from the distribution network (S3).
This study considers the contribution DER could make (by displacing conventional network assets) in supplying reactive power support (injection/absorption)11 to a specific area in the South of England (part of the Southern Power Network (SPN) service area owned by UK Power Networks) in combination with the current approach (which consists of both a planning and an operational approach to reactive power provision)12. This area involves four Grid Supply Points (GSPs) where transmission network capacity is limited by voltage stability and the available thermal capacity. The four GSPs and their location is depicted in Figure 1. At these GSPs the voltage steps down from 400kV to 132kV.
Figure 1: GSPs Location
Source: NG - UK Power Networks (2017, slide 2)
The four GSPs’ service area has a total connected distributed generation (i.e. DER)13 of 1,546 MW (September 2018), 2,546 MW transmission connected generation (excluding interconnectors) and 915 Mvar and 760 Mvar
10 The qualifying DER are those over 1 MW. They are connected at 11 kV or above. 11 The provision of active power is also within PP, however this study looks only at reactive power. 12 The planning approach relates to the acquisition of capacitive/reactive assets and the operational approach in near real time uses different
steps including procurement (via the Balancing Mechanism). See Section 3 for further details. 13 DER is a broad concept that involves distributed generation, energy storage, demand side response, among other things. In this report

Power Potential (Transmission & Distribution Interface 2.0) SDRC 9.5 Cost Benefit Analysis 7
of capacitive (Mvar generation) and reactive (Mvar absorption) capability respectively14. The existing installed capacity at the four GSPs is illustrated in Figure 2 and the total mix of generation technologies is shown in Figure 3.
Figure 2: Generation mix at each GSP (only units connected at distribution)
Figure 3: Share of generation mix (aggregated figure for the four GSPs)
Out of the four GSPs, Bolney connects the largest generator, Shoreham, a CCGT power station with a total capacity of 425 MW (UK Power Networks, 2018). Due to its size (over 100 MW), this generator must comply with Grid Code requirements (under the Obligatory Reactive Power Service scheme), which precludes its participation in the PP market but not necessarily its involvement in RP provision. Thanet (a wind generator) connected at the Canterbury GSP is the other generator precluded from PP due to its size (315 MW). The rest of the generators with capacity under 100 MW connected to the four GSPs are allowed to participate in PP. The
we use the term DER mainly to refer to DG (the majority of DER that aim to participate in the PP trial are generators) however other sources of reactive power might participate but in limited amounts (battery storage).
14 The reactive and capacitive capability comes from transmission connected assets. With the following additions expected in the coming years: 1515 (Mvar generation) and 1060 (Mvar absorption), NG (2017).
Note: Insta l led capacity over 1 MW only. Source: UK Power Networks (2018).
0
50
100
150
200
250
300
350
400
450
500
Others CHP Battery Storage Photovoltaic Gas Wind
exis
tin
g in
sta
lled
ca
pa
city
(MW
)
Bolney Canterbury Ninfield Sellindge
Source: UK Pow er Netw orks (2018).
10%
4%
4%
18%
30%
34%Others
CHP
Battery Storage
Photovoltaic
Gas
Wind

Power Potential (Transmission & Distribution Interface 2.0) SDRC 9.5 Cost Benefit Analysis 8
full list of generators and their respective associated GSP, point of connection voltage and size can be found in Appendix 1.
The report is organised as follows. Section two introduces the definition of reactive power. Section three provides a brief introduction to reactive power management and procurement methods in GB. Section four discusses the CBA methodology as well as the scenarios, cases and sensitivity analysis. Section five provides details about the data collection and the main assumptions. Sections six and seven discuss the empirical analysis and results. Section eight provides details of the live trial, evaluates the robustness of the CBA, and extends the empirical analysis by incorporating actual pricing information from the live trial. Section nine concludes the report.
1. Background on Reactive Power
Reactive power (Q) is produced in an AC circuit when current and voltage are not in phase. Ideally if reactive power is equal to zero, apparent power (S) is equal to real power (P). Reactive power is represented under the
following equation: 𝑆2 = 𝑃2 + 𝑄2. The ratio of real power to apparent power is represented by the power factor (PF) and can be used as an indicator of system efficiency. Loads usually absorb reactive power (Kundur, 1994, p. 625)15. In situations of low demand there is an excess of reactive power in the system and voltages increase, meaning that reactive power must be absorbed. By contrast, in a situation of heavy load or demand the system consumes reactive power which then needs to be generated to support the system voltage. Reactive power requirements not only depend on demand level but on the configuration of the transmission system and generation (Kirby and Hirst, 1997). Generators and other devices (e.g. capacitors, SVCs, STATCOMs) can help to maintain the system voltage in appropriate limits16 usually +/- 5% of the nominal voltage. A generator operating in leading mode (or under-excited mode in a synchronous generator) absorbs reactive power from the system, while in lagging mode (or over-excited mode in a synchronous generator) produces and delivers reactive power to the system17. The amount of reactive power that generators can provide (in both modes) in order to meet voltage schedules is limited by their power factor. The lower the power factor the lesser the real power output. Power factor requirements (for lagging and leading) can differ depending on the type of generator. For instance, in GB synchronous generators (e.g. fossil fuel power plants) are required to operate with 0.85 (lagging) and 0.95 (leading) power factors while for non-synchronous generators (e.g. wind and solar) a power factor of 0.95 is required for both, leading and lagging18. The following figure illustrates this dynamic for a generator with a PF of 0.95.
15 Especially if we refer to industrial demand, however this can be partially true for the majority of domestic demand, due to the use of LED
light bulbs and power electronics which do not necessarily absorb reactive power. 16 The voltage limits may vary in line with the size of voltage point of connection and whether they refer to TO or DNO assets. (i.e. in GB:
+/-5 at 400 kV, -5/+9 at 275 kV). 17 Under or overexcitation refers to synchronous plants only. 18 See: https://www.nationalgrideso.com/balancing-services/reactive-power-services

Power Potential (Transmission & Distribution Interface 2.0) SDRC 9.5 Cost Benefit Analysis 9
Figure 4: Reactive Power Capability of a Generating Unit
2. Reactive Power Procurement in GB
There are different ways in which the system operator in GB, National Grid Electricity System Operator (NGESO), can deal with reactive power issues in its planning and operational approaches. The planning approach involves investment decisions such as the acquisition of network assets for reactive power (which includes shunt reactors/capacitors, SVCs, STATCOMs, etc.19) in line with the recommendations provided in the Network Options Assessment (NOA) publication20. These kinds of equipment are cost effective and have provided historically the majority of NG baseload reactive power (NG, 2018b). These assets are connected to the transmission system (and owned and operated by National Grid Electricity Transmission – NGET) and funded via the transmission network use of system (TNUoS) charges which are split between generators and suppliers as users of the transmission system. The decision to invest in new assets for reactive power support occurs when the NGESO identifies insufficient capability to maintain the voltage levels within the appropriate limits under specific scenarios or through economic assessment using BID321, identifying the build solution as the most cost efficient one. The NOA publication (NG, 2018a), released by the NGESO, recommends the kind of investments that transmission owners across Great Britain need to make in agreement with the future network requirements identified by NGESO in their Future Energy Scenarios (FES)22. These are only recommendations and it is ultimately the responsibility of the transmission owners to decide on what to invest. In terms of investment in network assets for reactive power supply (i.e. STATCOMs), the most recent NOA publications (2016/17, 2017/18) have identified the need for extra reactive power compensation in the South East Coast area (SCRC) and in Bolney and Ninfield (two of the GSPs that are within the PP trial area).
The future situation that we are studying for the four GSPs is one where the peak requirements for reactive power are assumed to be driven by situations of low demand and high generation from DG, leading to excess reactive power (and high voltage). In this case equipment must be adjusted to absorb reactive power, or
19 SVC and STATCOM are a specific types of Flexible Alternating Current Transmission Systems (FACTS) that can provide dynamic
reactive compensation. 20 See: https://www.nationalgrid.com/sites/default/files/documents/Network-Options-Assessment-2017-18.pdf 21 BID3 is an economic dispatch utilisation model. For further details see Pöyry and NG (2017). 22 FES comprises four scenarios: Two degrees, Slow progression, Steady state and Consumer power.
Leading mode Lagging mode
-Q (Mvar) +Q(Mvar)
RP capability range
P(MW)
• High demand• Low system voltages
• Low demand• High system voltages
S1
RP flowRP flow
ϴϴ
P1
Q1
Consumption Production
Where: = ,

Power Potential (Transmission & Distribution Interface 2.0) SDRC 9.5 Cost Benefit Analysis 10
switched out of service, reducing the flow of generation. This inability to expand or fully utilise available generation because of transmission constraint problems has driven the interest in PP.
Whilst steady state operation required absorption of reactive power as the system experienced high voltage in steady state, National Grid System Operator is required to secure the system following sudden and unexpected loss of plant and apparatus, as specified in Security and Supply Standards (SQSS23). This loss of plant and apparatus will generate low system voltages, which will de-stabilise the system unless lagging reactive capability (reactive power) is available to support the system voltages. Hence, the dynamic nature of the Power Potential solution, required suppliers to automatically and quickly change reactive power state in response to voltage change. Because these events are unpredictable, the full dynamic capabilities of Power Potential are more difficult to include in the CBA.
Once the new assets have been acquired the next step is to make use of their ability to supply reactive power support, this refers to the operational approach. This involves a set of steps that NGESO takes to meet reactive power needs in real time utilising these kinds of assets. These start with the cheapest available sources of reactive power at the point of dispatch such as adjusting/configuring existing network assets for reactive power (if they are available) and other intermediate operations. It then involves the procurement of reactive power support from third party providers such as transmission connected generators, under three different mechanisms explained below. This is mainly funded by the Balancing Service Use of System (BSUoS) charge. Here we have three schemes, the Obligatory Reactive Power Service (ORPS), the Enhanced Reactive Power Service (ERPS) and constraint management. Under the Grid Code generators are required to produce or absorb reactive power as instructed by the System Operator, generators are compensated using the ORPS methodology outlined in the Connection and Use of System Code (CUSC). ORPS generators are required to produce or absorb reactive power in order to keep the system voltage within appropriate limits, in agreement with the Grid Code requirements. Generators receive a fixed rate (utilisation rate) in this case (around £2.8/ Mvarh, averaged over the last 5 years), see Table 1 below. ERPS refers to a more competitive scheme, a six-monthly procurement round and is appropriate for generators that can provide reactive power support beyond the Grid Code requirements and also for those who wished to be paid at a rate different from ORPS. NGESO has not contracted for this service since October 2009 and has not received any responses to tenders since January 2011. As of March 2021, this ancillary services product was still theoretically available. For further details about the two mechanisms, see Anaya and Pollitt (2020). The procurement of reactive power via constraint management involves tenders or bilateral contracts between NGESO and individual providers in particular locations (like a single large generator in a constrained part of the network). According to NGESO the most recent voltage constraint contracts have been tendered for. However, contracts with generators in constrained parts of the network are often not subject to direct competition and can be expensive. Finally, actions to procure reactive power can also be taken via the balancing mechanism (which is used by the system operator to match energy supply and demand in real time), whereby parties are paid to change their real power positions to meet reactive power requirements. Table 1 shows the payments made to generators under the ORPS scheme and voltage constraint management in the last five years in a specific region that comprises a total of 38 GSPs, including the four GSPs that are part of PP. Constraint costs are around £8.14/Mvarh on average per year with a peak of £13.7 Mvarh in 2013/14, while under the ORPS scheme the annual average costs is around £2.8/Mvarh. It is also noted that leading reactive power utilisation is much more significant under the ORPS scheme, representing around 83.3% of the total contracted capacity via this scheme. Recent figures (period Oct. 2020-Feb. 2021) indicate that leading reactive power is still more usually required, with around 80% over the total24.
23 https://www.nationalgrideso.com/codes/security-and-quality-supply-standards 24 See: ESO Data Portal: Reactive Utilisation-Feb-2021 - Dataset| National Grid Electricity System Operator (nationalgrideso.com)

Power Potential (Transmission & Distribution Interface 2.0) SDRC 9.5 Cost Benefit Analysis 11
Table 3: Reactive power costs under the ORPS and voltage constraint management scheme at 38 GSPs in the area that includes our 4 GSPs
PP is a new way of procuring reactive power services using DER capability. DER can help to displace or defer the acquisition of dedicated network assets for reactive power by introducing additional Mvars in the system. This may have a positive impact by reducing or deferring investments in network assets for reactive power supply. This translates into lower TNUoS charges, paid by demand and generators. The economic characteristics of procurement from DER versus from network assets differ significantly. One of the advantages of using DER capability is that it is divisible (a smaller amount of Mvars from DER can be contracted in contrast with a much larger amount of Mvars from transmission assets, such as those in units of 200 Mvar). The other advantage is that it can be incrementally procured and paid for, unlike transmission assets which must be procured ahead of full utilisation. In addition, the advantage of procuring reactive power from DER (in comparison to other sources) is that their spatial distribution can increase their effectiveness in providing reactive power. DER can also be better located to deal with other issues that occur periodically. The disadvantage is that even if prices (i.e. availability, utilisation) are low, Mvars do not travel well and decay with distance. Thus, DER effectiveness in reactive power support matters. On the other hand, network assets for reactive power connected at transmission can be better located to increase effectiveness and they may be more reliable and cheaper in the longer term. Network assets for reactive power are dedicated to reactive power and hence not in competition with generation25 (and indeed do not rely on base load generation to be available) which must be running to be capable for providing variable reactive power (with some exceptions such as batteries, overnight solar or units operating in synchronous condenser mode26). Varying the type of network assets for reactive power in the mix has further controllability advantages over given mixes of generation. The disadvantage is that these assets are indivisible and can only be added in minimum block sizes (which are quite large, of the order 200 Mvar capacity). A particular economic feature of these available options is that fixed network assets for reactive power are likely to be more economic if they are expected to be fully and regularly utilised27, while reactive power from DER is going to be particularly useful in delaying the need for incremental additions of reactive power asset capability, especially in conditions of rising/volatile demand for reactive power. The other situation when DER can be more cost effective, in comparison with network assets, is in periods with high reactive requirements but low expected utilisation. It is also important to note that in line with the connection agreements, DER have to deliver Mvar without affecting the output (MW) at no/little marginal cost but always subject to their effectiveness and to bid prices (in comparison with the fixed rates paid to generators under the ORPS scheme) if a market-based mechanism is used, which is the case in PP. In our CBA, we particularly focus on this use of DER to delay the need to make incremental investments in conventional reactive power assets, relative to a business-as-usual (BAU) projection of reactive power demand and investments in reactive power assets. Other potential benefits,
25 An expansion and clarification to this statement is the fact that even although there is currently no direct competition, the decision to
procure reactive power is made considering market costs. 26 Refers to the reactive power capability (generation or absorption) when the generating unit is not producing active energy (Anaya and
Pollitt, 2020). 27 The average current utilisation rate is around 70% according to National Grid.
Scheme 2013/14 2014/15 2015/16 2016/17 2017/18
Mandatory
total costs £(m) 6.33 5.63 5.31 7.65 5.39
Lead (%) 83.4% 84.4% 82.0% 85.2% 80.9%
utilisation (Mvarh) 2,121,596 2,089,260 2,003,812 2,737,748 1,867,694
Lead (%) 83.6% 84.7% 81.9% 85.0% 81.4%
average cost (£/Mvarh) 2.98 2.69 2.65 2.80 2.89
Constraint
total costs £(m) 1.05 5.57 0.73 2.22 2.82
capability (Mvarh) 76,733 631,552 119,005 359,396 474,274
average cost (£/Mvar/h) 13.7 8.8 6.1 6.2 5.9
Source: National Grid

Power Potential (Transmission & Distribution Interface 2.0) SDRC 9.5 Cost Benefit Analysis 12
which are beyond this study, could include the displacement of transmission level generators by DER in the supply of reactive power support (when some DER are cheaper than the transmission connected generators).
3. Cost-Benefit Analysis Methodology and Scenarios
Our CBA focuses on the calculation of the Net Present Value (NPV) of the difference between the BAU and alternative scenarios. The baseline assumption in all the scenarios is that the acquisition of additional network assets for reactive power, reactive power support from DER and from other sources (network optimisation) come after considering the existing reactive power sources which include transmission connected generators, embedded generators over 100 MW28, network assets for reactive power and interconnectors. Further details about the reactive power support from interconnectors is provided in Section 6.2. We have assumed that the demand for leading reactive power drives the reactive power requirements at our four GSPs (in line with Table 1). Thus, only the leading capability of the different reactive power sources has been included in the CBA. The future situation that we are studying for the four GSPs is one where peak requirements for reactive power are driven by situations of low demand and high generation from DG, leading to excess reactive power (and high voltage). In this case equipment must be adjusted to absorb reactive power, or switched out of service, reducing the flow of generation. This inability to expand or fully utilise available generation because of transmission constraint problems has driven the interest in PP.
The CBA evaluates the benefit of migrating from the current system (based on reactive asset investment decisions and operational mechanisms described above) to one which includes an element of competitive procurement. Our CBA draws on the original CBA methodology undertaken for the PP bid in 2016 to the Network Innovation Competition, however it is a new and independent analysis29 undertaken in the light of updated information since the bid.
Cost-benefit analysis of DER projects is of great interest globally, and we undertake an analysis which reflects best practice in this area. EPRI in the US (EPRI, 2015) and the Advanced Energy Economy Institute (Woolf et al., 2014) have published or commissioned helpful guides to undertaking cost- benefit analyses in the context of DER. Our methodology is in line with these and draws on our previous published cost benefit analyses on the connection of distributed generation (Anaya and Pollitt, 2015) and on electrical energy storage (Sidhu, Pollitt and Anaya, 2018). As in our previous papers, we evaluate the Net Present Value (NPV) smart energy solutions from the perspective of the electricity system as a whole, rather than any single private party to the system.
Our analysis takes into account outturn competitive procurement information (live trial), see Section 8.
The time frame for the analysis is up to 2050 with the evaluation of intermediary years (e.g. 2030, 2040). All the values are discounted back to 2018.
3.1. About the CBA methodology
The estimation of benefits is given by the difference between the NPV of total costs in S1 (BAU) and those from S2 and S3 for the period 2020-2050 (S1-S2, S1-S3)30. The net benefits of S1-S2 and S1-S3 are discussed as Case 1 and Case 2 respectively in Section 7. S1 costs include the costs of the acquisition of network assets for reactive power. S2 and S3 costs include the additional bid costs of competitive procurement but lower costs for network assets. Network assets are assumed to be repaid (financed) over a 45-year period and also depreciated over the same period and earn the real regulated rate of return on their initial cost and have no running cost31. Bid costs correspond to the payments made to those DER providing reactive power with winning bids. Bid costs are composed of bid prices (availability and utilisation)
28 Transmission connected generators and embedded generators considering their maximum capability range. 29 In contrast with the previous CBA, this study looks at the whole reactive power system requirements and potential sources of reactive
power supply within the PP trial area, including transmission connected generators, DER, capacitive and reactive assets, other potential sources of reactive power such as interconnectors.
30 The acquisition of assets is done during this period however the payment for some of them extends beyond 2050 (out to 2070), due to their 45-year asset lifetime. Based on this, assets are replaced every 45 years. The assumption of 45 years is in line with the new TO asset lives set by Ofgem under RIIO-T1 (Ofgem, 2012, p.6).
31 Due to the fact that the repayment period goes beyond 2050 and DER projections are limited to 2050 (data provided by UK Power Networks), we considered convenient to limit the CBA to 2050 instead of 2070.

Power Potential (Transmission & Distribution Interface 2.0) SDRC 9.5 Cost Benefit Analysis 13
payable to DER. Other expenses in the transmission network have been included in S2 and S3, which amount to £0.03m per year32.
In addition, the capital and operational costs for the distribution operator in running reactive power procurement in S2 and S3 need to be considered. The DERMS (Distributed Energy Resources Management System) is the system used to support both the technical and commercial optimisation and dispatch of DER.
The capital and operational costs of developing and implementing this new system for the PP trial are covered by the project budget33. A large portion of the costs are associated to a trial and would not need to be re-incurred beyond the PP trial. Moreover, the costs of this system would be expected to decrease over time due to the learning process involved in the trial. In addition, economies of scale would apply to a large-scale roll-out, so the cost of implementing the DERMS system would decrease very significantly34.
Furthermore, the DERMS has been designed as part of the PP project specifically focused on the dispatch of DER to provide reactive power to the transmission system. However, such a system could be designed to enable accessing further benefits (for instance integrating further functionalities such as distribution network optimisation), so that the total cost would be split among the different functionalities/benefits.
The CBA in this document has considered an indicative DERMS cost figure for PP, based on the estimated cost of developing and implementing DERMS in the PP network (equivalent to a capital cost of £0.12m and an annual operational cost of £0.03m)35.
3.2. Scenarios
The CBA involves three scenarios and two cases:
a. Scenario 1 - business as usual- (S1), where the supply of reactive power support in case of Mvar
capacity shortage is through the acquisition of new network assets for reactive power only. In this
scenario, the acquisition of assets comes after considering all of the different existing and available
reactive power sources mentioned previously. New assets are represented by STATCOMs only,
with capacity increments of 200 Mvar. Price assumptions are in line with the average prices from
National Grid’s Electricity Ten Year Statement (ETYS), which amount to £24.4m for STATCOMs
(based on ETYS average price, 200 Mvar), connected to the transmission network (NG, 2015). No
other costs have been included in the estimation of the NPV for this scenario36.
b. Scenario 2 (S2), where participation of DER in the provision of reactive power support is allowed
using a market-based approach37. This allows the displacement of STATCOMs (reducing the
number of additional network assets needed for reactive power) by DER but using an optimal
selection of both resources explained in Section 7.2. The use of DER also increases the costs due
to the compensation given to DER (via the bid prices: for both availability and utilisation) and
additional PP operational expenses (at transmission and distribution levels).
c. Scenario 3 (S3), similar to (S2), with DER providing reactive power, including the potential
additional contribution of extra Mvars from optimising the operation of distribution networks assets
(setting of tap changing transformers, reactive compensators, network reconfiguration). The CBA
32 Data provided by National Grid. This is equivalent to around £0.2m of operational expenses every 8 years, in line with the assumptions made in the previous CBA. 33 The budgeted total cost for developing DERMS within the trail is £6.2m. 34 According to UK Power Networks, the total cost of developing and implementing DERMS (which includes developer costs – ZIV and
DNO costs) is around £1.2m per new licence and £0.33m per additional GSP. Operational costs including DER recruitment, DERMS licensing and support, etc. are estimated to be around £0.3m per year.
35 UK Power Networks has provided and indicative cost figure for the CBA computed as 10% of the estimated costs of DERMS accounting for the use of DERMS (with the state estimator and CIM deployment) for distribution network operation, asset management and to deliver other flexibilities.
36 Even though the provision of reactive power support from transmission connected generators, embedded generators over 100 MW and interconnectors imply a cost (these are getting paid under the ORPS scheme), when comparing the NPV of S1 versus S2 and S1 versus S3, all these costs are common to all scenarios. This means we do not need to calculate them in order to generate our Case 1 and Case 2 results.
37 Shoreham and Thanet cannot participate in PP due to their size (over 100 MW).

Power Potential (Transmission & Distribution Interface 2.0) SDRC 9.5 Cost Benefit Analysis 14
evaluates the value from this additional benefit, assuming zero additional costs38 to enable that
optimisation (as in Strbac et al., 2018). We have assumed that the size of these extra Mvars
(leading) is 185 Mvar39. We assume these ‘free’ Mvars arise from the focus in PP on better utilisation
of distributed assets in addressing voltage problems at the transmission level. Table 2 summarises
the three scenarios. Table 4: Summary of Scenarios
In Case 1 we compare the NPV of S1 and S2. This case captures the benefits of displacing assets by contracting more DER for reactive power support. In Case 2, we compare the NPV of S1 and S3. The following table describes the sensitivities including the central case and the range of values analysed for each one and discussed in the CBA.
Table 5: Summary Table of Sensitivities covered in the CBA
Results from Case 1 and Case 2 are then compared with those discounted savings estimated using the outcome competitive information from the live trial.
38 This is an important assumption made in this study, in agreement with Strbac et al. (2018). However, it may be that there are some
additional costs for the DNO of releasing this capability. 39 We assume free Mvars from Bolney (75 Mvar), Ninfield (60 Mvar) and Sellindge (50 Mvar). See Strbac et al. (2018), Section 3.
Scenario
Mvars from New
reactive power
assets (TO)
Mvars from
DER
Mvars for network
optimisation
Elements that provide RP support
and to take into account in each
scenario
Cost figures considered in the
CBA
S1 ✓
Mvars from: T-connected
generators, interconnectors,
existing RP assets, new RP assets new RP assets
S2 ✓ ✓
Mvars from: T-connected
generators, interconnectors,
existing RP assets, new RP assets,
DER
new RP assets , bid prices
(availability, utilisation)
S3 ✓ ✓ ✓
Mvars from: T-connected
generators, interconnectors,
existing RP assets, DER, network
optimisation
new RP assets , bid prices
(availability, utilisation)
Note: RP assets include only STATCOMS.
Sensitivities Central Case Range of values analysed
Percentage of DER
participation 75% 25, 50, 75, 100%
Availability price £1.5/Mvar/h 0, 0.5, 1, 1.5, 2, 2.5, 3, 4
Utilisation price £7/Mvarh 0, 4, 7 , 10, 13, 15
NPV (years) 2050 2020, 2030, 2040, 2050

Power Potential (Transmission & Distribution Interface 2.0) SDRC 9.5 Cost Benefit Analysis 15
4. Data Collection and Assumptions
We have developed the underlying data on the possible demand for reactive power at the four GSPs in association with our colleagues at National Grid and UK Power Networks. We have endeavoured to carefully account for all the actual or planned connections of generation and transmission assets in the area, while pointing out that some key features of our modelling, such as the assumed future growth of distributed generation can, in reality, only be estimated with wide uncertainty. However, it is important to remember that the motivation for the PP project was the high and rising amount of DG connecting to the relevant parts of the distribution network that we are modelling.
Data have been provided by National Grid and UK Power Networks, collected from National Grid’s Electricity Ten Year Statement (ETYS) reports and from different studies. Some assumptions are in agreement with those made in the former CBA performed by Imperial College London (NG, 2016). Appendix B summarises the list of variables, their sources and the assumptions made for the CBA. Table 4 shows the projections40 for installed capacity (at transmission and distribution), reactive power system requirements and reactive power availability taking into consideration all the existing and identified potential reactive power sources, such as DER41 and interconnectors.
Table 4 shows the projected increase in transmission and distribution connected generators in the area of interest and the associated peak requirements for reactive power absorption given their connection to the grid. Table 4 further shows the ability of the various sources of reactive power capability to provide those requirements. In the absence of any investment in reactive equipment or in competitive procurement there is a rising gap between the need and the availability.
Table 6: Descriptive Figures at the four GSPs
40 2020 figures refer to projections made in our former CBA report (submitted to National Grid ESO in Dec. 2018), no updates were made. 41 Here it is assumed that DER have the capability to provide reactive power support and that can be controlled via DERMS (this implies
the installation of appropriate equipment).
Description 2020 2030 2040 2050
Installed capacity (MW) 4,308 4,989 6,461 9,264
Transmission connected generators 2,375 2,632 3,093 3,998
DER (over 100 MW) 720 720 720 720
DER (below 100 MW) - PP 1,213 1,637 2,648 4,546
RP Need (Mvar) at trans. 3,389 3,892 5,236 7,349
Transmission connected generators 2,159 2,393 3,093 3,998
DER (over 100 MW) 458 458 458 458
DER (below 100 MW) - PP 772 1,042 1,685 2,893
RP Availability (Mvar) at trans. 2,264 2,442 2,916 3,659
Transmission connected generators 781 865 1,118 1,445
DER (over 100 MW) 158 158 158 158
DER (below 100 MW) - PP 266 359 580 996
Reactive equipment (baseline) 1,060 1,060 1,060 1,060
Interconnectors (Mvar)
Converter capability (from 3 interconnectors) 999 999 999 999
Network optimisation (Mvar)
Additional reactive power capacity 185 185 185 185
Gap (RP system requirements and available sources) 59 (267) (1,136) (2,505)
Note: For RP avai labi l i ty i t i s assumed a participation of 100% from DER and lead capabi l i ty only (@0.95 PF).
Network assets for reactive power includes SVC and reactors . The gap includes the network optimisation.
Source: UK Power Networks (2018), ETYS (2017, Appendix A and B), ETYS (2015, Appendix F).

Power Potential (Transmission & Distribution Interface 2.0) SDRC 9.5 Cost Benefit Analysis 16
5. Understanding the Empirical Analysis
5.1. Reactive Power System Requirements
Reactive power requirements are estimated as set out below for both transmission connected generators and DER. Information about the transmission connected generators was obtained from the ETYS (NG, 2015, NG, 2017). The list of transmission connected generators included in the analysis are those that operate within the zones B1, C4, C7, C9, comprising the four GSPs, and also one generator (London Array) from C3 (connected in Cleve Hill) due to its proximity to the Canterbury North GSP (see ETYS 2017, Appendix A, Fig. A5)42. Projections about the size of transmission connected generators are based on those made in ETYS 2015 (Annex F) see NG (2015), with a fixed installed capacity until 2026. After this year an annual growth rate of 2.6% was taken for doing the projections until 205043. Cumulative projected DER installed capacity (2020-2050) were provided by UK Power Networks44. With the installed capacity projections (for both transmission and distribution) we proceed to estimate the reactive power system requirements at the transmission level. Based on National Grid’s dynamic voltage analysis in the South East area, it is assumed that for 1 GW of transmission capacity required, a total of 900 Mvar is needed at the transmission level, see the Transmission and Distribution Interface 2.0 (TDI) bid document (NG-UK Power Networks, 2016, p.22). In addition, the required capacity at the transmission level due to the connection of DER units takes into account the coincidence factor (e.g. an increase of 10 MW in DG requires an increase of 7 MW at transmission (10 MW * (CF=70%) = 7 MW). The same value of CF has been assumed over the whole period. Figure 5 depicts the reactive power system requirements for transmission connected generators and DER for the period 2020-2050. We observe that the requirement is slightly larger for transmission connected generators than for DER.
Figure 5: Reactive power system requirements at transmission (due to generation connected at transmission and distribution networks)
42 This is also in agreement with the study made by MPE (2016) where this generator was included in the analysis. 43 We do expect some increase in transmission connected generating capacity after 2026: an annual increase of 2.6% after this year. This
rate was estimated based on the average annual growth of installed capacity according to ETYS 2013 (Annex F, Table F2.2). This assumption is also aligned with the compound annual growth rate of transmission-connected capacity for the period 2020-2050 from FES 2020 (leading the way scenario, estimated at 2.6%), see FES 2020 Data Workbook (Electricity Supply, SV.25) at FES 2020 documents National Grid ESO.
44 These are the same projections as used in the previous CBA in 2016. The compound annual growth rates of installed decentralised capacity for the period 2020-2050 from FES (Leading the way and Consumer Transformation scenarios) are also aligned with the annual rate estimated here from DER projections (around 4.5%). In addition, projections from DFES 2020 (UK Power Networks) for SPN regarding distributed generation and battery storage, suggest compound annual growth rates of 4.4% and 3.7% for consumer transformation and leading the way scenarios respectively (period 2019-2050), see DFES 2020 UK Power Networks.
0
1000
2000
3000
4000
5000
6000
7000
8000
2020
2021
2022
2023
2024
2025
2026
2027
2028
2029
2030
2031
2032
2033
2034
2035
2036
2037
2038
2039
2040
2041
2042
2043
2044
2045
2046
2047
2048
2049
2050
Mva
r
Transmission connected generators DER (includes emb. generators over 100 MW)

Power Potential (Transmission & Distribution Interface 2.0) SDRC 9.5 Cost Benefit Analysis 17
5.2. Reactive Power Availability
Reactive power availability refers to the existing and potential sources of reactive power support. If there are not enough anticipated sources of reactive power, then investments in network assets for reactive power are required (i.e. purchase of STATCOMs). Existing and potential sources of reactive power include STATCOMs and SVCs45, generators (transmission connected and distributed generation), and interconnectors among other things. Only reactive power provided by DER is assumed to be acquired through a competitive mechanism (i.e. bids) in line with PP. In the calculation of the available sources of reactive power support, the current and future capacitive/reactive equipment have been considered according with the ETYS reports (Appendix B, System Data). Reactive equipment figures remain the same for the whole period, which means no projections have been made in addition to the ones already estimated by National Grid (based on the latest figures from ETYS 2017)46, see NG (2017). The idea is to potentially cover, any shortage of Mvar with other more competitive methods. It is important to note that the current costs of reactive equipment including expected additions have not been included in the CBA (National Grid has already planned to make these investments in the ETYS regardless of PP and has already committed costs to them). Reactive power support from generators has been estimated assuming a power factor of 0.9547. This is a simplification – noting that the DERMS approach removes power factor restrictions and allows each DER to operate within a defined ‘PQ’ operational envelope i.e. with a permitted Mvar range at each level of active power MW output.
Transmission connected and embedded generators (above 50 MW) are ruled by the Grid Code. These generators are required to have the capability to provide reactive power service and are paid under the ORPS scheme and cannot be part of PP48. In the estimation of the Mvar supported by DER, a dV/dQ sensitivity of 1.5 has been considered (MPE, 2016)49, which means that for 1.5 Mvar at distribution only 1 Mvar is compensated at transmission. Interconnectors using modern technology are another source of reactive power support50. Interconnectors can be based on Voltage Source Converter (VSC)-HDVC or Line Commuted Converters (LCC)-HDVC technology. The VSC converter has the capability to absorb and/or generate both active and reactive power without the acquisition of additional equipment, in contrast with LCC converters (SKM, 2013). There are three interconnectors (ElecLink, Nemo and IFA2) with VSC-HDVC technology that are placed inside the four GSPs’ region. Table 5 shows all the interconnectors that are inside the four GSPs’ region, including IFA (1) which does operate using LCC-HDVC. According to National Grid, the converters placed at each end have a capability range of +/-0.95 PF. Even though there is no single market framework in place for interconnectors yet (which would facilitate the provision of different ancillary services), the three interconnectors are required to provide reactive power support in line with their connection agreements. The interconnectors can be instructed for pre-fault voltage support and get paid via the mandatory ORPS price (similar to a transmission connected generator). We assume that the interconnectors have the same size (1 GW) and can contribute up to +/- 333 Mvar each.
45 STATCOMs and SVCs are the ones that provide dynamic response, in contrast with the shunt units. 46 Table B.4.1c (current) and Table B.4.2c (additions) from ETYS 2017. Looking at the ETYS reports (2012-2017), there are four types of
assets: mechanically switched capacitors, reactors, SVCs and series reactors. The last of these has been excluded because they don’t provide voltage support but increased impedance over a route. Mechanically switched capacitors have been also excluded because we are focusing only on leading capability (1060 Mvar absorption).
47 For simplicity we have assumed the same power factors across all type of generators. However, we acknowledge that synchronous and non-synchronous generators are subject to different power factors for lagging (0.85 and 0.95 respectively). For further details see: Obligatory reactive power service (ORPS) | National Grid ESO.
48 Even though generators with a capacity between 50 and 100 MW are ruled by the Grid Code, their participation is optional. We have considered in this study the participation of two wind power plants in the PP trial with a capacity between 50 and 100 MW.
49 This ratio was also used in the CBA performed by Imperial College in 2016. 50 Interconnectors, depending on their technology (i.e. VSC-HVDC) can provide additional ancillary services to the transmission system.
These include frequency response and reserve services, black start capability and boundary capability (NG, 2016).

Power Potential (Transmission & Distribution Interface 2.0) SDRC 9.5 Cost Benefit Analysis 18
Table 7: Interconnector Characteristics
Figure 6 summarises the different sources of reactive power support across the four GSPs. A quick comparison between this figure and Figure 5, indicates that there is a shortage of Mvars (even with 100% DER participation in the provision of reactive power). This shows that, based on the assumptions made, DER alone cannot solve the reactive problem (that they partly create). Thus, we still require more network assets for reactive power (or other potential sources of reactive power support) to match the reactive power system requirements.
Figure 6: Available reactive power support from different sources
5.3. RP Procurement from DER under PP
In order to conduct the CBA, we need to put a price on the competitive procurement of reactive power from DER in this analysis (the outturn prices from the PP auction are discussed in Section 8). The price of the competitively procured DER is a key driver of the relative benefit of competitive procurement vs conventional reactive asset investments. However competitive procurement has the additional advantage that it is divisible (which means that DER capability can be contracted in smaller quantities in line with the capability range) in comparison with traditional network assets for reactive power which must be added in blocks ahead of being utilised at full capacity (i.e. 200 Mvar).
Based on the specifications from Wave 2 of the PP project, the bid price has two components:
- Availability price (£/Mvar/h)
- Utilisation price (£/Mvarh)
For the availability price, it has been assumed that DER are contracted for a minimum of 1800 hours (in agreement with the PP Market Procedures). In the long run, the contracted hours could be reduced, given actual evidence on demand for competitively supplied reactive power and its reliability in meeting demand.
Name Developers
Connected
to Technology
DC Voltage
(kV)
Power
(MW)
Commissioning
date
Transmission
Length (km)
Cap and Floor
Regime Manufacturers
IFA (1) NGIH and RTE France LCC - HDVC 270 2000 1986 70 No
GEC, Alcatel,
BICC, Pirelli
ElecLink
Star Capital Partners
Limited and Groupe
Eurotunnel France VSC-HDVC 320 1000 2019 69
No (merchant
basis)
Siemens,
Prysmian
Nemo NGIH and Elia Belgium VSC-HDVC 400 1000 2019 141 Yes
Siemens/J-
Power System
IFA (2) NGIH and RTE France VSC-HDVC 320 1000 2020 240 Yes ABB, Prysmian
Source: Ofgem website (Interconnectors), Interconnectors website, NG (2016), Barnes (2017).
Note: It was assumed a 100% of DER participation, only lead reactive capabi l i ty (for generators , @ 0.95 PF)
0
500
1000
1500
2000
2500
3000
3500
4000
4500
5000
Mva
r
Transmission connected generators Embedded generators (>100MW) DER (PP) Reactive equipment Interconnectors

Power Potential (Transmission & Distribution Interface 2.0) SDRC 9.5 Cost Benefit Analysis 19
The effectiveness of the DER (also known as sensitivity value51) in the provision of reactive power support is reflected by adding the estimation of both price and the variable “effectiveness” 52. For instance, a generator with an actual availability price of £1.5/Mvar/h and with an effectiveness of 80% at the GSP is equivalent to a delivered availability price of £1.875/Mvar/h (=1.5/0.8) at the GSP. For the estimation of the utilisation cost we have assumed that utilisation is a percentage of the total available hours, set at 19.2% (which means a total of 345 hours)53.
Figures 7(a) and 7(b) depict the trend in average utilisation (as a percentage of availability) in the PP region per day (up to 24h) and per month, lead only. As expected, (due to low demand), the utilisation rate is much higher during the period between 1am-7am and during the summer period. The other thing is that reactive power is more required during weekends than in weekdays within day and across the year.
Figure 7: Trend of average utilisation profile of reactive power in the PP region (period April 2016-April 2018)
Figure 8 depicts the total bid value (£m) to 2050 under different scenarios of DER participation. The bid values (both) increase over time which suggests a slight upward trend in the use of DER for reactive power supply. However, this trend is not smooth. There are peak and non-peak bid values. The lowest bid values occur when it is more convenient to utilise STATCOMs rather than DER, which we call optimal selection (further details are provided in Section 7.2.).
Figure 8: Total bid value (availability and utilisation prices) over time under different scenarios of DER participation (50, 75 and 100%)
51 See NG-UK Power Networks (2018, p.16). 52 The CBA looks at average figures of effectiveness, however we are aware this figure can vary across the different generators that take
part in the bid. 53 Related to the average lead (-) utilisation profile from transmission connected generators connected within the PP region between April
2016 and April 2018.
Source: National Grid (his toric uti l i sation profi le of RP in the PP region). Exclude bank hol idays .
7 (a) 7 (b)
-50%
-45%
-40%
-35%
-30%
-25%
-20%
-15%
-10%
-5%
0%
0:0
0
1:3
0
3:0
0
4:3
0
6:0
0
7:3
0
9:0
0
10
:30
12
:00
13
:30
15
:00
16
:30
18
:00
19
:30
21
:00
22
:30
% o
f u
tili
sati
on
weekday weekend
-40%
-35%
-30%
-25%
-20%
-15%
-10%
-5%
0%
Jan Feb Mar Apr May Jun Jul Aug Set Oct Nov Dec%
uti
lisa
tio
n
weekday weekend
Note: Figures were estimated assuming £1.5 /Mvar/h avai labi l i ty price and £7 /Mvarh uti l i sation price.
0.0
0.2
0.4
0.6
0.8
1.0
1.2
£m
(a
dju
sted
figu
res)
availability (100% DER) utilisation (100% DER) availability (75% DER)
utilisation (75% DER) availability (50% DER) utilisation (50% DER)

Power Potential (Transmission & Distribution Interface 2.0) SDRC 9.5 Cost Benefit Analysis 20
6. Results and Discussion
6.1. The Business As Usual approach (S1)
In the business as usual approach the solution is to buy the required assets in order to match the anticipated shortage of Mvars for the period 2020-205054. Figure 9 shows that there is a clear shortage even with reactive power support from different sources (transmission connected generators, embedded generators over 100 MW, reactive assets, and interconnectors). The extra reactive power capacity is covered by the acquisition of STATCOMs (19 units with a total capacity of 3,800 Mvar over the period 2020-2050).
Figure 9: Reactive power system requirement versus baseline availability
The participation of DER in the provision of reactive power support can also help to match the existing gap between reactive power system requirements and availability. The reduced investment in reactive assets due to the use of DER, and potential additional reactive power network optimisation at distribution and then looks like a more cost-effective approach (when comparing their respective NPVs). Thus, two specific cases are discussed in this section, Case 1 and Case 2 which compare alternatives options for providing the necessary reactive power capability.
6.2. Case 1 (S1-S2)
In this case, DER supports reactive power, reducing or delaying the requirements to purchase STATCOMs. The exercise is done using four different rates of DER participation (25%, 50%, 75%, 100%). Table 6 shows the results for different periods, the central case (with an availability price of £1.5/Mvar/h and utilisation price of £7/Mvarh).
54 In order to avoid any shortage of Mvars in a specific year, the acquisition of the asset(s) is made in the previous year. This applies in both
Case 1 and Case 2.
0
1000
2000
3000
4000
5000
6000
7000
8000
2020
2021
2022
2023
2024
2025
2026
2027
2028
2029
2030
2031
2032
2033
2034
2035
2036
2037
2038
2039
2040
2041
2042
2043
2044
2045
2046
2047
2048
2049
2050
Mva
r
RP availability (T generators, embedded over 100 MW) RP availability (reactive assets)
interconnectors RP system requirement

Power Potential (Transmission & Distribution Interface 2.0) SDRC 9.5 Cost Benefit Analysis 21
Table 8: Benefits for the Case 1 with central case for DER prices
Table 6 shows that there are savings in using an optimal combination of reactive assets and DER reactive power support in comparison with the BAU solution. By 2050 discounted savings amount to £14.3m. We also observe that the benefits are higher when the % of DER participation increases. Benefits reduce to £8.1m by 2050 with a 25% of DER participation. Looking at the number of reactive assets, this decreases when the % of DER participation increases, as expected, with a total of 14 and 18 units required at 100% and 25% of DER participation respectively, compared with the 19 units required under the business as usual approach. In terms of the quantity of DER contracted, we observe that especially during the first ten years the full reactive capacity that can be provided by DER is not required. However, after this, there is an increase in contracted reactive capacity from DER with an average value of 83% of the total reactive capacity available during the last ten years. Figure 10 shows the 75% of DER participation case.
Figure 10: Contracted DER versus full DER availability – with smarter selection
An interesting observation about contracting reactive power capacity from DER is that the order to selecting first DER over the asset or selecting first the asset over DER or a smarter selection (optimal selection) when the surplus/shortage is zero or close to zero, matters. Figure 10 shows the results of contracting DER reactive power capacity smartly however Figure 11 refers to the first case, contracting DER first and then covering any shortage with STATCOMs. We notice that the trend of contracted reactive power from DER is much smoother. In terms of savings, we observe around £6.3m savings when a smarter selection is applied.
year 25% 50% 75% 100%
(£m) (£m) (£m) (£m)
2020 1.0 1.0 1.1 2.3
2030 3.8 6.2 7.4 7.6
2040 6.1 9.8 10.3 11.2
2050 8.1 12.2 13.4 14.3
% DER Participation
Note: Based on AP of £1.5/Mvar/h, UP of £7/Mvarh
0
100
200
300
400
500
600
700
800
Mva
r
Case 1, DER (75%) Case 1, DER (75%) contracted

Power Potential (Transmission & Distribution Interface 2.0) SDRC 9.5 Cost Benefit Analysis 22
Figure 11: Contracted DER versus full DER availability – DER come first
In terms of prices, the sensitivity analysis shows that, as expected, a change in availability price (AP) produces a major change in the estimated benefits (computed by the difference in the NPVs) in comparison with the utilisation price (UP). Figure 12 shows the benefits of replacing some reactive assets by contracting DER for reactive power support. Benefits are higher with lower availability prices, and vary between £28.3m (AP=0) and £3.5m (AP=2.5) by 2050, assuming a fixed value of utilisation price set at £7/Mvarh and 75% of DER participation. However higher values of availability prices do not produce any savings at all by 2050. This means that the BAU option is more cost efficient when availability price exceeds £4/Mvar/h on average.
Figure 12: Sensitivity Analysis for Availability Prices – Case 1 (75% participation of DER)
In terms of the utilisation price, the sensitivity analysis indicates that there are larger benefits from lower prices, see Table 7. A maximum of £26.7m (UP=0) and a minimum of £2m is observed even with a higher value of utilisation price (UP=13) out to 2050, assuming a fixed availability price of £1.5/Mvar/h and 75% of DER participation. However, no savings are observed for utilisation prices that are over £15/Mvarh out to 2050.
0
100
200
300
400
500
600
700
800
Mva
r
Case 1, DER (75%) Case 1, DER (75%) contracted

Power Potential (Transmission & Distribution Interface 2.0) SDRC 9.5 Cost Benefit Analysis 23
Table 9: Sensitivity Analysis for Utilisation Prices – Case 1 (75% participation of DER)
6.3. Case 2 (S1-S3)
In this case, some extra Mvars are added, in addition to the ones provided by DER, to help match the reactive power system requirements. The optimisation of the distribution network is estimated to result in the provision of extra Mvars (185 Mvar). This CBA calculates the higher savings that can be expected in comparison with the previous case assuming no additional costs of releasing this capability55. Table 8 shows the results for different rates of DER participation (in agreement with the previous case) assuming an availability price of £1.5/Mvar/h and a utilisation price of £7/Mvarh.
Table 10: Benefits for the central case considering network optimisation
Benefits vary between £31.4m and £37m by 2050. These figures are higher than those in Table 6. This means that the contribution of extra Mvars due to network optimisation, which reduces the amount of contracted DER and the acquisition of extra assets, has an average value of around £23m by 205056. In agreement with Table 6, we also note that benefits are larger with higher % of DER participation. In terms of number of assets, the participation of DER and extra Mvars due to network optimisation reduces the number of reactive assets, with a total of 13 and 17 units required with 100 and 25% of DER participation respectively, compared with the 19 units required under the business as usual approach.
In relation to the size of DER contracted, it is observed that the extra Mvars reduce the number of STATCOMs (1 less) for the period 2020-2050, which is reflected by higher benefits in Table 8. Figure 13 illustrates the contracted DER differences between Case 1 and Case 2. It is bigger during the first year, after that a similar trend is observed in both, Case 1 and Case 2, but with specific reductions in 2031, 2038 and 2049, which is explained by the contribution of free Mvars.
55 A system like DERMS could enhance visibility and monitoring of the distribution network. The additional costs potentially required to
enable distribution network optimisation has not been quantified in this CBA. 56 Refers to the average of the four % DER participation figures.
Period
UP (0) UP(4) UP(7) UP(10) UP(13) UP (15)
2020 1.7 1.4 1.1 0.9 0.7 0.5
2030 10.7 8.8 7.4 6.0 4.5 3.6
2040 17.7 13.5 10.3 7.2 4.0 1.9
2050 26.7 19.1 13.4 7.7 2.0 -1.7
Benefits (£m) with different Utilisation price (UP) figures
Note: Based on AP of £1.5/Mvar/h, %DER:75%
year 25% 50% 75% 100%
(£m) (£m) (£m) (£m)
2020 3.4 3.4 3.4 4.7
2030 15.9 17.9 18.1 19.1
2040 24.7 28.0 28.3 29.3
2050 31.4 34.7 36.1 37.0
% DER Participation
Note: Based on AP of £1.5/Mvar/h, UP of £7/Mvarh

Power Potential (Transmission & Distribution Interface 2.0) SDRC 9.5 Cost Benefit Analysis 24
Figure 13: Contracted DER under Case 1 and Case 2 (75% participation of DER)
The sensitivity analysis for availability prices shows, as expected, bigger benefits in comparison with Case 1. The lower the prices the bigger the benefits with a maximum and minimum value of £50.2m (AP=0) and £12.5m (AP=4) out to 2050 respectively, see Figure 14. Benefits drop below zero for availability prices that are over £5.5/Mvar/h out to 2050.
Figure 14: Sensitivity Analysis for Availability Prices – Case 2 (75% participation of DER)
In terms of utilisation prices, the benefits range from £21.6m and £48.7m out to 2050 for the largest
(UP=15) and smallest (UP=0) value of utilisation prices respectively, assuming an availability price of
£1.5/Mvar/h and 75% of DER participation (see Table 9). However, benefits are not observed for much
higher values of utilisation prices. The sensitivity analysis results suggest that for utilisation prices over
£27/Mvarh, there are no benefits out to 2050.
Table 11: Sensitivity Analysis for Utilisation Prices – Case 2 (75% participation of DER)
0
100
200
300
400
500
600
700
800
Mva
r
Case 1, DER (75%) contracted Case 2, DER (75%) contracted
Period
UP (0) UP(4) UP(7) UP(10) UP(13) UP (15)
2020 3.4 3.4 3.4 3.4 3.4 3.4
2030 21.2 19.4 18.1 16.7 15.3 14.4
2040 35.1 31.2 28.3 25.4 22.6 20.6
2050 48.7 41.5 36.1 30.6 25.2 21.6
Benefits (£m) with different Utilisation price (UP) figures
Note: Based on AP of £1.5/Mvar/h, %DER:75%
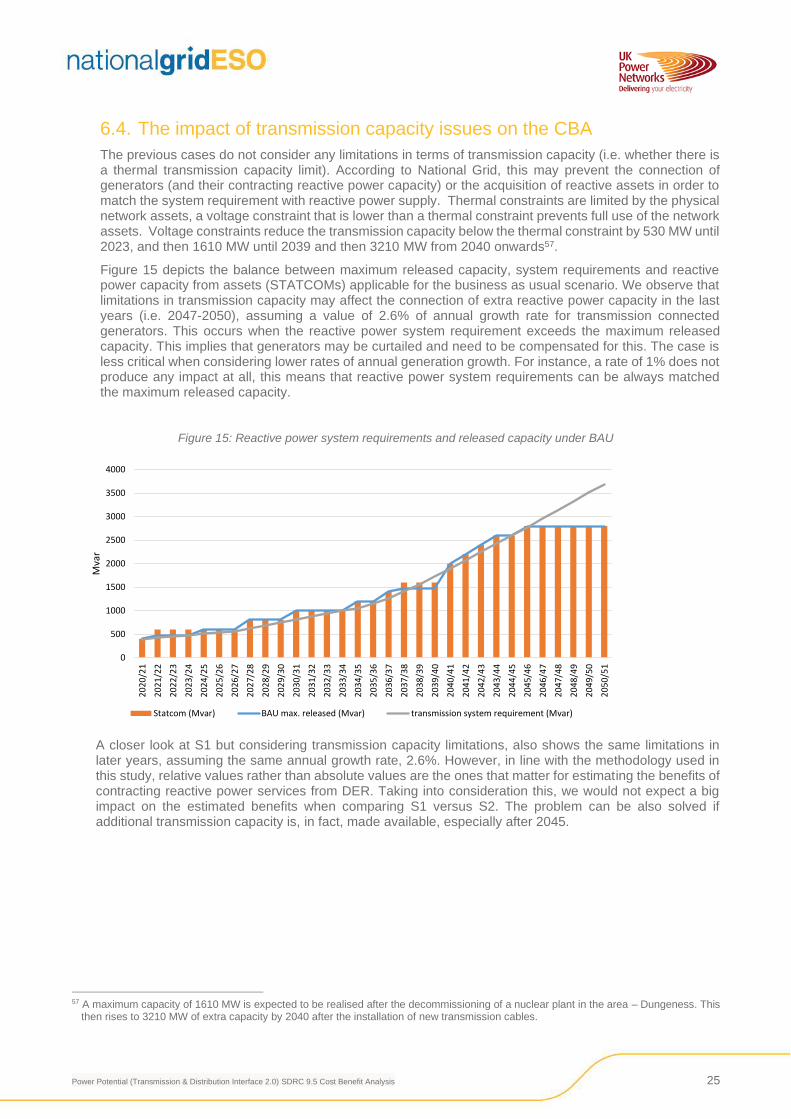
Power Potential (Transmission & Distribution Interface 2.0) SDRC 9.5 Cost Benefit Analysis 25
6.4. The impact of transmission capacity issues on the CBA
The previous cases do not consider any limitations in terms of transmission capacity (i.e. whether there is a thermal transmission capacity limit). According to National Grid, this may prevent the connection of generators (and their contracting reactive power capacity) or the acquisition of reactive assets in order to match the system requirement with reactive power supply. Thermal constraints are limited by the physical network assets, a voltage constraint that is lower than a thermal constraint prevents full use of the network assets. Voltage constraints reduce the transmission capacity below the thermal constraint by 530 MW until 2023, and then 1610 MW until 2039 and then 3210 MW from 2040 onwards57.
Figure 15 depicts the balance between maximum released capacity, system requirements and reactive power capacity from assets (STATCOMs) applicable for the business as usual scenario. We observe that limitations in transmission capacity may affect the connection of extra reactive power capacity in the last years (i.e. 2047-2050), assuming a value of 2.6% of annual growth rate for transmission connected generators. This occurs when the reactive power system requirement exceeds the maximum released capacity. This implies that generators may be curtailed and need to be compensated for this. The case is less critical when considering lower rates of annual generation growth. For instance, a rate of 1% does not produce any impact at all, this means that reactive power system requirements can be always matched the maximum released capacity.
Figure 15: Reactive power system requirements and released capacity under BAU
A closer look at S1 but considering transmission capacity limitations, also shows the same limitations in later years, assuming the same annual growth rate, 2.6%. However, in line with the methodology used in this study, relative values rather than absolute values are the ones that matter for estimating the benefits of contracting reactive power services from DER. Taking into consideration this, we would not expect a big impact on the estimated benefits when comparing S1 versus S2. The problem can be also solved if additional transmission capacity is, in fact, made available, especially after 2045.
57 A maximum capacity of 1610 MW is expected to be realised after the decommissioning of a nuclear plant in the area – Dungeness. This
then rises to 3210 MW of extra capacity by 2040 after the installation of new transmission cables.
0
500
1000
1500
2000
2500
3000
3500
4000
20
20
/21
20
21
/22
20
22
/23
20
23
/24
20
24
/25
20
25
/26
20
26
/27
20
27
/28
20
28
/29
20
29
/30
20
30
/31
20
31
/32
20
32
/33
20
33
/34
20
34
/35
20
35
/36
20
36
/37
20
37
/38
20
38
/39
20
39
/40
20
40
/41
20
41
/42
20
42
/43
20
43
/44
20
44
/45
20
45
/46
20
46
/47
20
47
/48
20
48
/49
20
49
/50
20
50
/51
Mva
r
Statcom (Mvar) BAU max. released (Mvar) transmission system requirement (Mvar)

Power Potential (Transmission & Distribution Interface 2.0) SDRC 9.5 Cost Benefit Analysis 26
7. Testing the CBA robustness with live trial results
7.1. About the live trial
This section evaluates the robustness of the CBA performed in Section 7 using the outcomes of the live trial. The trial started in January 2021 (w.c. on the 3rd of January 2021) for a period of 12 weeks. Bids were submitted from DER located in three GSPs with a combination of bids being received from solar, battery and wind power units. The maximum range of reactive power58 associated to each DER varies, with values from 2 to 39.6 Mvar. Figure 16 depicts the weekly trend of hours (accepted and available) and Mvars utilised (lag and lead combined) per type of technology for 12 weeks. Most of the accepted hours and Mvars utilised are from wind power units (due to their large range of reactive power capacity). In terms of settlement, most of the payments correspond to availability payments, representing around 76% of the total (c. £223k).
Figure 16: Hours accepted and Mvars utilised per type of technology in live trial (period Jan.-March. 2021)
7.2. Pricing information, effectiveness and utilisation factors
Estimations of average prices (availability and utilisation), average effectiveness and utilisation factors were required to compute the benefits of procuring reactive power from DER. Weighted average figures were estimated using the maximum range of reactive power associated with each DER59. Only prices with an “accepted” production schedule response60 were considered in the estimation of weighted average prices. No variation was made in the rest of variables61.
Results from the analysis suggest average prices for availability and utilisation of £1.46/Mvar/h and £4.80/Mvarh respectively62, an average effectiveness factor of 74.1% and utilisation factor of 19%. For instance, looking back at Tables 7 and 9 and Figures 12 and 14, we can observe that these prices are within the range of values we originally proposed. An evaluation of absolute maximum and minimum availability and utilisation prices submitted by DER in the live trials suggests that these are also within the
58 The maximum range of reactive power is the sum of maximum lag (+) and maximum lead (-) reactive power capacity declared by each
DER. 59 Other options were also evaluated (i.e. weighted by payments) however those with the highest value (worst case) were the ones selected. 60 There are different categories of responses such as accepted, no bid, no trial, rejected. 61 Results from the live trials provide mainly new information about prices, effectiveness and utilisation factors. 62 Average prices estimated based on data submitted for the whole period (12 weeks).

Power Potential (Transmission & Distribution Interface 2.0) SDRC 9.5 Cost Benefit Analysis 27
suggested range (i.e. with a maximum price of £10/Mvarh for utilisation and £9/Mvar/h for availability). These results add to confidence in our initial assumptions and CBA estimations.
The following two sections discuss the size of the discounted benefits using actual average prices from the live trial and compare them with the estimates from the central case evaluated in Section 7. An increase in discounted savings is observed when actual average prices and effectiveness factor are introduced. Similar to Section 7, all the figures are in 2018 prices. Average availability and utilisation prices were discounted back to 2018 using the retail price index.
7.3. Case 1 (S1-S2)
Similar to the analysis performed in Section 7.2, benefits are estimated under four rates of DER participation, see Table 10. The use of average weighted prices (availability and utilisation), effectiveness and utilisation factors from the live trial, produces bigger benefits than those computed in Section 7.2 for the central case. For instance, by 2050 discounted savings amount to £19.5m (with DER participation of 100%). This implies an increase of around 36% in comparison with the central case (AP: £1.5/Mvar/h; UP: £7/Mvarh). The average increase of discounted savings across all the years is around 21.7%63.
It is also observed that the results are quite sensitive to the size of the effectiveness factor, estimated at 74.1% from the live trials (average). With no variation of the effectiveness factor (i.e. 80% former value), discounted savings would be bigger on average (i.e. 32.8% higher rather than 21.7%)64.
Table 12: Benefits (with prices from live trial)
When comparing with the BAU solution, benefits by 2050 are equivalent to approximately 11% of these costs assuming 100% of DER participation with a peak of 21% by 2030. Figure 17 depicts the percentages for 2030, 2040 and 2050 with different rates of DER participation.
Figure 17: Benefits expressed as % of BAU solution for Case 1 (with prices from live trial)
63 This refers to 2020, 2030, 2040 and 2050. 64 The consideration of an average effectiveness factor of 80% in the main CBA analysis is plausible considering that more DER will be
available over time and closer to specific GSPs. This means that their effectiveness to provide reactive power would increase.
year 25% 50% 75% 100%
(£m) (£m) (£m) (£m)
2020 1.0 1.0 1.3 2.5
2030 3.9 6.6 8.3 9.0
2040 6.4 10.6 12.3 14.2
2050 8.7 14.1 17.0 19.5
% DER Participation
Note: Based on AP of £1.46/Mvar/h, UP of £4.80/Mvarh

Power Potential (Transmission & Distribution Interface 2.0) SDRC 9.5 Cost Benefit Analysis 28
In terms of costs, by 2050 bid costs65 represent around 25% of the total costs, assuming 100% of DER participation. As expected, we note that the costs of STATCOMS decrease when the level of DER participation increases, and vice versa in each of the years in evaluation, with a peak of around £157m by 2050 (25% of DER participation). In this case, STATCOMS costs are always higher than bid costs.
Figure 18: Bid and Statcom costs (NPV) for Case 1 (with prices from live trial)
7.4. Case 2 (S1-S3)
We also consider the value of the extra Mvar due to the optimisation of the distribution network (up to 185 Mvar), which we valued in Section 7.3. As before, the NPV is higher using the actual trial results, see Table 11. A comparison with the central case scenario analysed in Section 7.3 shows that discounted savings by 2050 are 14% higher (assuming 100% DER participation), with an average of around 9% across all the years considering also 100% of DER participation.
Table 13: Benefits considering network optimisation (with prices from live trial)
This also results in a saving in cost relative to business as usual of approximately 25% by 2050 (with DER participation of 100%), with a peak of around 50% by 2030. Higher levels are expected in comparison with
65 These costs are composed of bid costs (availability and utilisation prices), DERMS costs and PP opex, for details of these costs see
Appendix B.
year 25% 50% 75% 100%
(£m) (£m) (£m) (£m)
2020 3.4 3.4 3.4 4.8
2030 16.0 18.4 18.9 20.7
2040 25.0 29.0 30.1 32.3
2050 32.0 36.7 39.4 42.3
% DER Participation
Note: Based on AP of £1.46/Mvar/h, UP of £4.80/Mvarh

Power Potential (Transmission & Distribution Interface 2.0) SDRC 9.5 Cost Benefit Analysis 29
Case 1 because business as usual costs are the same for both, but with higher savings in Case 2 due to the addition of extra Mvars (i.e. 185 Mvars). See Figure 19 for further details.
Figure 19: Benefits expressed as % of BAU solution for Case 2 (with prices from live trial)
Looking at the costs, a similar trend to the one in Figure 18 is observed. However, in this case bid costs and the STATCOMS costs would be approximately the same by 2030 with 100% of DER participation (c. £11m), see Figure 20. By 2050 and assuming the same level of participation, bid costs represent around 30% of the total costs. Lower total costs are mainly driven by the reduction in STATCOM costs rather than bid costs, due to the extra Mvars which requires a lower number of STATCOMs. For instance, on average by 2050 and across different levels of DER participation, bid costs are relatively similar in Case 1 and Case 2 but STATCOM costs are around 17% lower in Case 2.
Figure 20: Bid and Statcom costs (NPV) for Case 1 (with prices from live trial)

Power Potential (Transmission & Distribution Interface 2.0) SDRC 9.5 Cost Benefit Analysis 30
8. Conclusions
The paper presents a cost-benefit analysis of the competitive procurement of reactive power from DER within the PP area. We work out what the NPV of competitive procurement vs conventional procurement would be given the costs of conventional reactive assets and the possible market prices from DER offering reactive power. We use price information from the PP live trial conducted between January and March 2021 to evaluate the robustness of the CBA and to estimate the net benefits using actual prices. Our analysis focuses on leading reactive power where the reactive power needs are driven by the need to increase the capacity to absorb excess Mvars.
What we model is the growing requirement for reactive power arising from low demand-high generation situations on the distribution system, giving rise to the need for additional leading reactive power to absorb excess volts (in the form of Mvars). While transmission connected assets, embedded generators over 100 MW and interconnectors can provide some contribution to the required Mvars at the four grid supply points (GSPs) in the trial area, additional absorption capacity is required. If this were to come from DER at reasonable prices this would yield a significant saving in NPV.
We calculate that the savings from competitive procurement could be of the order of £14.3m in 2018 money (out to 2050, assuming 100% of DER participation). These savings are driven by the deferment of the purchasing of reactive assets which can occur if DER can provide RP. Given that there are other regions across the country with similar characteristics to the South East of England in terms of reactive power requirements, the value of a competitive procurement solution across the whole of Great Britain might be several times larger than the value we calculate.
We also show the potential value of increased reactive power capability from optimisation by the distribution network operator (DNO) of their assets. This could produce a significant capacity to absorb Mvars given the enhanced focus on RP requirements arising from competitive procurement and its associated needs for enhanced modelling, measurement and control within the distribution system. This produces a large additional benefit of the order of £23m in 2018 money (average figure) out to 2050, disregarding the potential costs entailed by such DNO optimisation.
Results from the live trial suggest that the estimated weighted average prices submitted by DER (availability and utilisation) are within the range of prices proposed in the CBA. Higher discounted savings are observed when these prices are incorporated in the analysis. For instance, further increases in NPV equivalent to approximately £5m is observed by 2050 (at 100% DER participation) in relation to Case 1 and Case 2.
We present some sensitivity analysis of our results showing how the procurement price and the availability of competitive procurement influences the NPV. It would also be interesting to carry out additional sensitivity analysis around the cost of reactive power assets, interest rates or the growth of renewables.
In closing we discuss how competitive procurement might give rise to even larger benefits than the ones we discuss above.
First, if competitive provision also freed up additional thermal capacity for export from the four GSPs that would further enhance the value of Mvar reduction at the GSP. It would do this by reduced DG curtailment or even more connection on the distribution system behind the four GSPs. Either of these would significantly enhance the benefits of the procurement exercise. For instance, if better reactive power management increased thermal capacity by 100 MW for 180 hours in one year in 10 years time, this would add £0.6m to our NPV (at £50/MWh)66.
Second, more flexible use of DER to provide RP can also reduce system losses. To the extent that more RP capability in the distribution system leads to better constraint management and that additional thermal transfer capacity reduces the need to thermally stress network assets, this might be an additional benefit from DER participation in RP markets.
Third, we might envisage that a long run benefit of competitive procurement from DER is increased innovation in reactive assets that would face direct competition from flexible DER. We have assumed that STATCOMs remain at the same real price and in units of 200 Mvar. If competitive procurement from DER drove innovation in reactive assets, reducing their unit size and unit cost this would be a further benefit of PP.
Fourth, we do only consider leading reactive power. If we were to model competitive procurement of lagging reactive power, there would be some smaller additional benefits arising from situations where the procurement
66 (£50 * 100 MW * 180 hours) / ((1+0.035)^10).

Power Potential (Transmission & Distribution Interface 2.0) SDRC 9.5 Cost Benefit Analysis 31
of lagging reactive power from DER was cheaper than other sources. This situation is likely to be much less common than for leading reactive power and the unit savings likely less because they would arise from savings in utilisation payments to transmission connected generators and not in the numbers of reactive assets, which drives our NPV calculation.
Finally, if competitive procurement were extended to transmission connected generators (not just DER) who could provide reactive power, this might significantly reduce the delivered cost of reactive power procurement via the mandatory reactive power market in Great Britain, if the prices were below the current mandatory price level.
References
Anaya, K.L., Pollitt, M.G. (2020), ‘Reactive Power Procurement: A Review of current trends’, Applied Energy, 270, 114939.
Anaya, K.L. and Pollitt, M.G. (2015), ‘Options for allocating and releasing distribution system capacity: deciding between interruptible connections and firm DG connections’, Applied Energy, 144: 96-105.
Barnes, M. (2017), VSC-HVDC Newsletter (2017), Vol. 4, Issue 12, Jan. 2017.
EPRI (2015), The Integrated Grid: A Benefit-Cost Framework, EPRI, Palo Alto, CA. 3002004878
Kirby, B., Hirst, E. (1997), Ancillary Service Details: Voltage Control. ORNL/CON-453. Oak Ridge National Laboratory, Dec. 1997.
Kundur, P. (1994), Power System Stability and Control. The EPRI Power System Engineering Series, McGraw-Hill.
MPE (2016), Power system simulation studies for National Grid Network Innovation Competition Project (TDI 2.0). Prepared for National Grid. MEP Report 2016 107172, Jul. 2016.
NG (2015), Electricity Ten Year Statement 2015. Appendix F. National Grid, Nov. 2015.
NG (2016), UK Electricity Interconnection: Driving competition and innovation in the HVDC supply chain. National Grid, Nov. 2016.
NG (2017), Electricity Ten Year Statement 2017. Appendix A, B. National Grid, Nov. 2017.
NG (2018a), Network Options Assessment 2017/18. UK Electricity Transmission. National Grid, Jan. 2018.
NG (2018b), Product Roadmap for Reactive Power. National Grid, May 2018.
NG-UK Power Networks (2016), Transmission and Distribution Interface 2.0 (TDI). Bid Document to Ofgem. National Grid and UK Power Networks.
NG-UK Power Networks (2017), Power Potential: A New Market for Reactive Power. Presentation made at LCNI Conference, Dec. 2017.
NG-UK Power Networks (2018), Power Potential Market Procedures. National Grid and UK Power Networks, Aug. 2018.
Ofgem (2012), RIIO-T1 Final Proposal for National Grid Electricity Transmission and National Grid Gas. Finance Supporting document. Dec. 2012.
Pöyry and NG (2017), Backcasting the GB Balancing Mechanism with BID3. Pöyry and National Grid joint report. Sep. 2017.
Sidhu, A.S., Pollitt, M.G. and Anaya, K.L. (2018), ‘A social cost benefit analysis of grid-scale electrical energy storage projects: a case study’, Applied Energy, 212: 881-894.
SKM (2013), Review of Worldwide Experience of Voltage Source Convertor (VSC) High Voltage Direct Current Technology (HCDC) Installations. Report Final Rev 0. Sinclair Knight Merz, Mar. 2013.
Strbac, G., Pudjianto, D., Djapic, P. (2018), Market Framework for Distributed Energy Resources-based Network Services. Imperial College London, Jun. 2018.
UK Power Networks (2018), Contracted connections register. UK Power Networks, Sep. 2018.
Woolf, T., Whited, M., Malone, E., Vitolo, T. and Hornby, R. (2014), Benefit-Cost Analysis for Distributed Energy Resources, Synapse Energy Economics Inc.

Power Potential (Transmission & Distribution Interface 2.0) SDRC 9.5 Cost Benefit Analysis 32
Appendix 1: Variables, sources and assumptions
CBA analysis (Main)
Concept Value Sources/Notes
Capacitive/Reactive assets
Mvar Absorption (ETYS) 1060 From ETYS 2017/2016/2015/2014/2013, appendix B
Reactive power capacity (Mvar) 200 minimum unit
STATCOM costs 24.4 From ETYS 2015 average figure
STATCOM lifetime (years) 45 Based on RIIO-ET1 Final Proposal (Ofgem, 2012)
DERMS cost (£m)
Shared costs 0.12 From UK Power Networks
DER Participation Rate
Percentage of the total Mvars available 75% Authors' assumption, central case
Estimation of Mvar Ratio of distribution and transmission dV/dQ
sensitivity 1.5 MPE (2016) (in agreement with former CBA)
Released transmission capacity, MVA (MW) per
MVAr 1.1
NG (2016), in agreement with former CBA, for 1 GW around 900Mvar is
needed at transmission
Installed capacity
DER 4 GSP
current capacity (MW) 1546 UK Power Networks (2018)
Transmission at 4 GSP
current capacity (MW) 2375
From ETYS 2013 - generation capacity in zones: B1, C4, C7, C9 and in C3
only London Array
Generators' growth rate after 2026 2.60% From ETYS 2013
Interconnectors (voltage support) - Mvar
NEMO 333 From National Grid
ElecLink 333 From National Grid
IFA2 333 From National Grid
Network optimisation extra Mvars
Number of extra Mvars 185.00 From ICL Report (Strbac et al., 2018)
PP Bid
number of hours available 1800 Minimum number of hours required (NG-UK Power Networks, 2018)
availability price (£/Mvar/h) 1.50 Authors' assumption, central case
% util isation (over total hours available) 19.2% Average value of utilisation (lead) in the PP region from National Grid
util isation price (£/Mvarh) 7.00 Authors' assumption, central case
average effectiveness 80% Authors' assumption
PP Costs (£m), annual
opex at transmission and distribution 0.03 From UK Power Networks/National Grid
Rates
TO WACC 4.55% Based on RIIO-ET1 Final Proposal (Ofgem, 2012)
STPR (social time preference rate) 3.50% Based on Green Book, 3% after the first 30 years
Concept Value Sources/Notes
PP Bid
availability price (£/Mvar/h) 1.46 Live trial results
utilisation price (£/Mvarh) 4.80 Live trial results
utilisation factor 19% Live trial results
average effectiveness 74% Live trial results

Appendices Appendix B – Replication Studies

Power Potential (Transmission & Distribution Interface 2.0) SDRC 9.5 Cost Benefit Analysis 34
Replication Studies
Extension of Power Potential Cost Benefit Analysis (CBA) to the Great Britain (GB) transmission network
1. Background
This appendix presents the extension of the Cost Benefit Analysis (CBA) results performed by Cambridge University (2021, Anaya and Pollitt) for the Power Potential trial area to the entire Great Britain (GB) transmission network. The aim is to evaluate the total system benefits that could be obtained in future if the reactive power market for DER developed under the Power Potential project were to be extended to the transmission network.
In GB, there are a total of 355 Grid Supply Points (GSPs), identified as per their Elexon ID (2018, ETYS, Appendix E). These GSPs are defined as the interface point between transmission and distribution and do not include the connection point of transmission connected generators. A total of 201 GSPs are located in the National Grid Electricity Transmission (NGET) network, 85 in the Scottish Power Transmission (SPT) network and 69 in the Scottish Hydro Electric Transmission (SHE) network.
This study identifies the suitable GSPs across GB where the Power Potential project could be replicated in future and the economic benefits associated to it.
2. Extension Methodology
The starting point for this extension study is the Case 1 comparison between scenarios S1 and S2 presented in Table 10 from the Cambridge University report and replicated again in Table B1.
Table B1: Benefits for the central case (replication of Table 10, CBA report)
This table is applicable to the entire Power Potential trial region (which consists of 4 GSPs), considering DER growth projections using UK Power Network 2018 data and data from ETYS 2017 and 2015 for network infrastructure, for the trial area considering different years, with wind load factor of 70%.
Table B2 summarises the considered DER levels for each future year in the Power Potential area, following the baseline data and assumptions. The values for years 2020, 2030, 2040, 2050 are extracted from Table 4 of the Cambridge University report.
Table B2: Installed DER capacity projections in Power Potential area
2020 2030 2040 2050
(MW) (MW) (MW) (MW)
DER 1,213 1,637 2,648 4,546
year 25% 50% 75% 100%
(£m) (£m) (£m) (£m)
2020 1.0 1.0 1.3 2.5
2030 3.9 6.6 8.3 9.0
2040 6.4 10.6 12.3 14.2
2050 8.7 14.1 17.0 19.5
% DER Participation
Note: Based on AP of £1.46/Mvar/h, UP of £4.80/Mvarh

Power Potential (Transmission & Distribution Interface 2.0) SDRC 9.5 Cost Benefit Analysis 35
If we individualise the results above, we can obtain an expected benefit per GSP and per MW peak output, as shown in Table B3.
Table B3: Generic individual GSP benefit
% DER Participation
year 25% 50% 75% 100%
Benefit (£k/MW) Benefit (£k/MW) Benefit (£k/MW) Benefit (£k/MW)
2020 1.178 1.178 1.531 2.944
2030 3.403 5.760 7.243 7.854
2040 3.453 5.719 6.636 7.661
2050 2.734 4.431 5.342 6.128
The next steps focus on identifying the suitable GSPs to replicate the project and the expected DER growth levels to determine the absolute benefit (£) of extending the Power Potential project across the GB grid in the future.
3. GSP replicability
For network studies, the transmission network in GB is divided in zones according to their geographic location. Alternatively, the transmission network can also be divided in voltage zones. These correspond to areas that are electrically close (with comparable short-circuit levels) and in which the network presents similar sensitivity to voltage changes. There are in total 36 coherent voltage zones in the GB transmission grid. The CBA extension study presented here is based on this classification and the GSPs allocated to each voltage zone.
Theoretically, the Power Potential project could be replicated across all the GSPs in the network. However, we filter the GSP replicability according to network requirements, choosing only the ones that present dynamic voltage management requirement needs to implement the Power Potential concept. The reactive power requirement in a zone can be for regulation to manage steady-state voltage or for containment and recovery to manage post-disturbance voltage. Given that the Power Potential service offers reactive power, providing dynamic voltage support, we use this last requirement to establish replicability. Power Potential provided additional learning for other voltage services, which could lead to greater financial benefits in zones across the GB network. However further work will be required to understand and compare this benefit against existing solutions. Therefore, direct replication of the benefits is not appropriate at this stage.
Requirements67 have been calculated regionally for each voltage zone in the network for the Two Degrees FES scenario for the year 2020, to be consistent with Cambridge University CBA. The Two Degrees scenario assumes high levels of low carbon energy and moderate decentralisation with limited participation for end consumers and is considered by the project as a good future base for these studies.
From the Two Degrees FES scenario in 202068 the maximum requirement level of 90.64 Gvar was divided across all 36 voltage zones giving an average of 2.5 Gvar per voltage zone. The replicability considered here is based on the zones where dynamic voltage control is required and is calculated on the average reactive requirement of 2.5 Gvar and is valid across the whole CBA study period under the assumption that the requirement on each zone will only worsen (not improve) in future.
The requirements have not been updated with latest FES scenario, in order to keep the consistency with original DER prediction used in the Cambridge University CBA report. However, this is something to be considered in the further CBA work.
67 Voltage containment and recovery requirement defined as post-disturbance requirement at 500ms. The total requirement range corresponds to the sum of the minimum and maximum requirement need. Negative values correspond to reactive power absorption (lead) and positive values correspond to reactive power generation (lag). 68 Year 2020 was selected from the available data as a good representation of current system requirements (year is less affected by overlying assumptions than others ahead of time).

Power Potential (Transmission & Distribution Interface 2.0) SDRC 9.5 Cost Benefit Analysis 36
Figure 21 Replicable voltage zones across GB (marked in orange) and Power Potential project area (marked in green)
The transmission system has a total of 36 voltage zones. From these, the number of zones which require high dynamic voltage requirements to support the system voltages is 17. Due to the different nature of voltage requirements, the benefits in the rest of the zones are expected to be very small and are not expected to significantly change the overall benefits presented in this study. Benefits in those zones can be estimated under other reactive power services, outside the Power Potential concept. The considered 17 voltage zones are shown in Figure 16 in orange. The two voltage zones for the Power Potential project in the South East of England are marked in green. The selected (orange) regions correspond to all the GSPs in the SPT and SHE networks and to 62 GSPs in the NGET network. Approximately, 62% of the number of GSPs in GB. This data is summarised in Table B4.
Table B4: GSP replicability according to voltage requirements (2.5 Gvar criteria)
Total GSP Voltage zones Replicable GSP Replicable
no no voltage zones
NGET NGET (PP)
201 27 zones 62
4 9 zones 2 zones
SPT 85 4 zones 85 4 zones
SHE 69 4 zones 69 4 zones
TOTAL 355 36 Zones 220 19 zones

Power Potential (Transmission & Distribution Interface 2.0) SDRC 9.5 Cost Benefit Analysis 37
4. DER growth projections
As mentioned in the main CBA report, growth of distributed generation can only be estimated with wide uncertainty and based on different assumptions and scenarios. The values used here correspond to the DER output projections, for purpose of consistency were used the same DER prediction used in Cambridge University CBA study, winter peak. DER expected output data is available up to the year 2040. From the year 2040 to 2050 a DER yearly growth rate of 5.04%, has been assumed, in line with the previous trends.
Table B5 presents the total expected DER output, per year, for the (orange) voltage zones in which the project can be replicated. It is important to note that distribution-connected generators with a size below 1MW have been excluded from the analysis, as they do not qualify to participate in the Power Potential service. The volumes of these small generators vary across time, being 4% of the total DER output level in 2020 with great dependency on the assumed DER growths for this scenario.
Table B5: Total DER generation (above 1MW) output projections for replicable voltage zones in GB for Two Degrees winter peak scenario (in line with DER predictions from Cambridge University CBA report)
2020 2030 2040 2050
(MW) (MW) (MW) (MW)
DER 6,948 8,748 12,340 21,185
In addition, generators with a size above 100MW were initially excluded from the CBA study as they are subject to Grid Code requirements to provide reactive power. With this consideration, the total DER output volumes that can be considered further reduces, as shown in Table B6.
Table B6: Total DER generation (above 1MW, below 100MW) output projections for replicable voltage zones in GB for
Two Degrees winter peak scenario (in line with DER predictions from Cambridge University CBA report)
2020 2030 2040 2050
(MW) (MW) (MW) (MW)
DER 3,420 4,779 7,339 12,599
5. Results
Table B7 shows the system benefits in the replicable voltage zones, per year, for different DER participation levels under the assumptions detailed above. The expansion of the Power Potential project could save energy consumers over £77m by 2050 when rolled out to 17 other transmission voltage zones within Great Britain. The total system benefits are show in Table B8, which includes the benefits reported in B1 for the two voltage zones in the Power Potential area, which raises the total benefit to over £96m by 2050 for the roll out in 19 transmission voltage zones.
Table B7 Total benefit of GB extension (17 voltage zones) for the central case
% DER Participation
year 25% 50% 75% 100%
Benefit (£m) Benefit (£m) Benefit (£m) Benefit (£m)
2020 4.0 4.0 5.2 10.1
2030 16.3 27.5 34.6 37.5
2040 25.3 42.0 48.7 56.2
2050 34.4 55.8 67.3 77.2

Power Potential (Transmission & Distribution Interface 2.0) SDRC 9.5 Cost Benefit Analysis 38
Table B8 Total benefit of GB extension (19 voltage zones, including Power Potential areas) for the central
% DER Participation
year 25% 50% 75% 100%
Benefit (£m) Benefit (£m) Benefit (£m) Benefit (£m)
2020 5.0 5.0 6.5 12.6
2030 20.2 34.1 42.9 46.5
2040 31.7 52.6 61.0 70.4
2050 43.1 69.9 84.3 96.7
If, however in the future the contribution from DER sized above 100MW were to be included within the project framework, total benefits could raise up to £161m by 2050 as estimated in Table B9.
Table B9 Benefit of GB extension (17 voltage zones) for the central case (including DER above 100MW)
% DER Participation
year 25% 50% 75% 100%
Benefit (£m) Benefit (£m) Benefit (£m) Benefit (£m)
2020 11.5 11.5 15.0 28.9
2030 40.5 68.6 86.3 93.5
2040 56.0 92.7 107.5 124.2
2050 72.1 116.9 140.9 161.7
References
Anaya, K.L., Pollitt, M.G. (2018), Towards a Cost Benefit Analysis for the Power Potential project. Energy Policy Research Group, Cambridge University, Dec. 2018.
NG (2018), Electricity Ten Year Statement (ETYS) 2018. Appendix E. National Grid, Nov. 2018. [Online] https://www.nationalgrideso.com/insights/electricity-ten-year-statement-etys
NG (2016), System Operability Framework (SOF) 2016. National Grid, Nov. 2016. [Online] https://www.nationalgrideso.com/insights/system-operability-framework-sof

Faraday House, Warwick Technology Park, Gallows Hill, Warwick, CV346DA
https://www.nationalgrideso.com/future-energy/projects/power-potential