power prices - matuwid na singil sa...
TRANSCRIPT

Power pricesWhere we are and how do we reduce the bill
AUGUST 28, 2014
1

Key policy questions
Why are power prices higher in the Philippines than in most other countries in the region (and can this gap be lowered)?
Where does the customers’ money go (and how can we contain or reduce the customers’ bill)?

Regional Comparison of Electricity PricesFindings of the International Energy Consultants
Philippine tariffs are “fully cost-reflective, which is sound economic policy”◦ Policy is similar to Singapore, Japan, and Australia
Rates in Thailand, Malaysia, South Korea, Taiwan, & Indonesia are low due to “government subsidies”◦ “Tariffs remain well below the cost”
◦ “Poor economic policy … unsustainable”
John Christopher Morris, Ph.D.
Managing Director

Comparison of Average Retail Electricity Tariffs
Notes:
1. Weighted average tariff (all customer categories), excluding VAT
2. Tariffs are for January 2012
Source: International Energy Consultants
“Cost-reflective” “Government subsidized”

Government subsidies in other Countries• Subsidy is up to 54% of the power cost
• Through subsidized fuel, cash grants, additional debt, deferred expenditures
Source: International Energy Consultants

Other Findings of the International Energy ConsultantsPhilippine dependence on the price of imported fuel◦ “Fuel is the largest component of the tariff. Approx. 80% of
generation on Luzon is fuelled with imported coal & oil (at full international market prices) & domestic gas (pegged to international prices)”
◦ “Several (but not all) other countries with lower tariffs provide fuel to their utilities at below-market rates”
◦ Their government-owned power generation, transmission, and/or distribution companies are subsidized, absorb costs, and/or incur losses

Historical Fuel Costs vs. Tariffs
0
25
50
75
100
125
150
0.00
5.00
10.00
15.00
20.00
25.00
30.00
2000
2001
2002
2003
2004
2005
2006
2007
2008
2009
2010
2011
2012
$/to
nn
e -
$/b
bl
c/kW
h
Coal Oil Australia Singapore Indonesia Korea Meralco
Source: IECNB. Meralco, Indonesia & Korea are averages of all tariff classes; Singapore, Australia are residential tariffs only
Over the past decade, some markets have passed rising fuel costs on to customers (eg. Singapore, Australia, Philippines) but others have not (eg. Indonesia, Korea)

Key Policy Responses/ Actions Philippine electricity prices are higher due to no
government subsidies, fully-priced and “heavily”-taxed
across the supply chain.
Inadequate and unreliable capacity vs. demand forces the
use of expensive oil-fired power plants and creates market
price spikes, ergo, new cost-competitive capacity, such as
high efficiency coal-fired plants, must be built quickly.
Other countries are starting to reduce their own subsidies.

Key policy questions
Why are power prices higher in the Philippines than in most other countries in the region (and can this gap be lowered)?
Where does the customers’ money go (and how can we contain or reduce the customers’ bill)?

Ave. Retail Rate, 2013Generation Charge, largest component in customer’s bill, 57.1%; Meralco 17.5%; NGCP 9.1%
PARENT
* Generation Retail Rate (applies to captive customers only)
** Other Charges are based on total captive and contestable customers in Meralco Franchise Area
Share of All customers
BILL COMPONENT2013
Overall Ave,
P/kWh
Generation Charge* 5.39
Distribution Charge**
(MERALCO)1.66
Transmission Charge**
(NGCP)0.86
System Loss Charge** 0.46
Taxes, Univ Charge** 1.08
TOTAL 9.45

0.00
1.00
2.00
3.00
4.00
5.00
6.00
7.00
8.00
9.00
10.00
11.00
Jan
-12
Feb
-12
Mar
-12
Ap
r-12
May
-12
Jun
-12
Jul-
12
Au
g-12
Sep
-12
Oct
-12
No
v-1
2
Dec
-12
Jan
-13
Feb
-13
Mar
-13
Ap
r-13
May
-13
Jun
-13
Jul-
13
Au
g-13
Sep
-13
Oct
-13
No
v-1
3
Dec
-13
Jan
-14
Feb
-14
Mar
-14
Ap
r-14
May
-14
Jun
-14
Jul-
14
5.94*6.12
5.41
PH
P P
ER K
WH
BILLING MONTH
39
*based on estimate
Meralco Generation Charge relatively stable
At regulated WESM prices
WESM price cap reduced from P62/kwh
to P32/kWh
Secondary price cap implemented

2012 2013 2014
January 5.6% (0.1%) 2.2%
February 5.9% 1.3% 3.5%
March 8.4% 3.0% 3.9%
April 5.0% 4.8% 3.4%
May 6.3% 5.5% 4.3%
June 7.2% 6.0% 5.6%
July 14.8% 7.1% 7.0%
August 4.0% 2.5%
September 8.0% 8.3%
October 7.9% 9.2%
November 6.7% 11.5%
December 9.4% 14.1%
AVERAGE 7.5% 5.9% 3.9%
Meralco WESM Purchases% Share to Total Volume reduced
Increase in Nov
and Dec 2013 due
to 21 forced
outages and 7
scheduled/
extended
maintenance
shutdowns

Meralco system lossConsistent reduction = Savings to customers*
11.10
10.21 10.109.65
9.28
8.617.94
7.35 7.04 6.92
2004 2005 2006 2007 2008 2009 2010 2011 2012 2013
System Loss Cap8.5%
9.5%
1.5
8%
*Since 2008, a total of P12.6Bn or equivalent to 7.02¢/kWh

•VAT•Royalty/Tax on
indigenous fuels or Duty/Tax on imported fuels
•Real Property Tax•Other taxes & fees
•3% franchise tax, in lieu of all other taxes
Transmission
•VAT•Local Franchise Tax on pass
through gen/ trans/ system loss charges *
•Local Franchise Tax on distribution charges
•Real Property Tax•Energy Tax on residentials•Universal Charges incl FIT•Other taxes & fees
* not applicable to electric coops
Distribution
DELIVERYGENERATION
Phl Power Market is a fully-priced market. No Subsidies and heavily “taxed”
The power sector is heavily taxed

Impact of government proceeds from Malampaya Natural Gas (2001-2012)
In PhP billions
Estimated add-onto the Luzon power rate (PhP/kWh)
Gross Proceeds, Net of Cost Recovery & Contractor Revenue
300.072 0.70
National Govt Share, Net of Taxes & LGU Assistance 106.955 0.25

Value-Added Tax (VAT) on electricityBeginning November 2005
As VAT is a percentage tax (unlike excise taxes), the VAT burden increases with any increase in the other electric rate components
In 2013, VAT accounted for P0.74/kWh in the average customer bill
BILL COMPONENT2013
Overall Ave,
P/kWh
Generation Charge* 5.39
Distribution Charge** (MERALCO) 1.66
Transmission Charge** (NGCP) 0.86
System Loss Charge** 0.46
VAT 0.74
Other Taxes, Univ Charge** 0.34
TOTAL 9.45
* Generation Retail Rate (applies to captive customers only)** Other Charges are based on total captive and contestable
customers in Meralco Franchise Area
0.0025 0.0025 0.0025 0.0025 0.0025 0.0025
0.0373
0.0978
0.0454
0.1163 0.1163
0.1561
0.1938
0.1938
0.0398
0.1003
0.0479
0.1188
0.3126
0.3524
0.00
0.05
0.10
0.15
0.20
0.25
0.30
0.35
0.40
June 2003 - Sept 2009 Oct 2009 - Sept 2010 Oct 2010 - Aug 2011 Sept 2011 - Feb 2013 March 2013 - Dec2013
Jan 2014 - Feb 2014
PES
OS
PER
KW
H
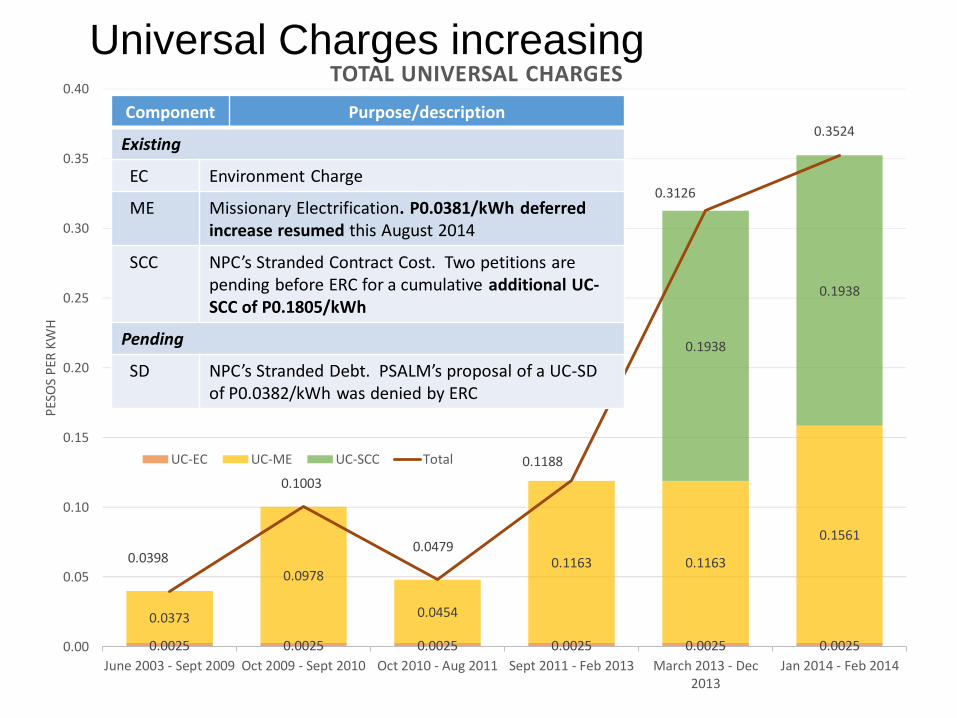
TOTAL UNIVERSAL CHARGES
UC-EC UC-ME UC-SCC Total
Component Purpose/description
Existing
EC Environment Charge
ME Missionary Electrification. P0.0381/kWh deferred increase resumed this August 2014
SCC NPC’s Stranded Contract Cost. Two petitions are pending before ERC for a cumulative additional UC-SCC of P0.1805/kWh
Pending
SD NPC’s Stranded Debt. PSALM’s proposal of a UC-SD of P0.0382/kWh was denied by ERC
Universal Charges increasing

How can we contain or reduce the customers’ bill?
POWER SUPPLY COST & RELIABILITY(57% of Ave. Customer Bill)
Build highly fuel-efficient and reliable new capacity
Seek more cost competitive fuel sources (coal, indigenous nat gas and LNG), local and offshore
Better scheduling of maintenance turnaround of power plants
Enhanced reliability of existing power plants
Resolve transmission congestions

How can we contain or reduce the customers’ bill?TRANSMISSION & DISTRIBUTION RELIABILITY AND COST(27 % of Ave. Customer Bill)
Flat Distribution charge/kWh for 2012-2015
About 60-65% of Transmission Charge/kWh will be relatively flat until 2015, the balance of 35-40% constituting ancillary service charges which may fluctuate.
Undertake required Capex investments to further strengthen T & D system, to resolve transmission congestions and to modernize the T & D infrastructure
Drive for more effective T & D coordination / synchronization to minimize supply interruptions

How can we contain or reduce the customers’ bill?SYSTEM LOSS (5 % of Ave. Customer Bill)
Incentivize further reduction through fair saving sharing program for DUs and Electric Coops

How can we contain or reduce the customers’ bill?
TAXES & UNIVERSAL CHARGES(10% of Ave Customer Bill)
Carefully consider reducing government take. Reduced VAT rate and RPT rate during interim period of tight supply
“Correct” tax base for VAT and LFT, to eliminate ‘tax on tax’ and royalty
Apply part of Natural Gas royalty take to reduce power rates
Extend BOI fiscal incentives for required new plants, targeted to reduce power prices
Judicious action on any new Universal Charges, e.g., Stranded Debt recovery, Feed-In Tariff Allowance (FIT-All)

How can we contain or reduce the customers’ bill?
CONTAIN CONSUMER SPEND ON POWER
Actively drive energy efficiency and consumption for Industrial, Commercial and Residential customersEnergy saving campaigns / conservation-tips for households
Energy advise and services for commercial and industrial customers

THANK YOU
53