power quality analysis and improvements in a hot rolling
TRANSCRIPT

International Conference on Renewable Energies and Power Quality (ICREPQ’14) Cordoba (Spain), 8th to 10th April, 2014
exÇxãtuÄx XÇxÜzç tÇw cÉãxÜ dâtÄ|àç ]ÉâÜÇtÄ (RE&PQJ) ISSN 2172-038 X, No.12, April 2014
Power Quality Analysis and Improvements in a Hot Rolling Mill using a STATCOM
Pablo Ardura1, Gonzalo Alonso1, José M. Cano1, Joaquín G. Norniella1, Francisco Pedrayes1, Fernando Briz1, Manés F. Cabanas1, Manuel G. Melero1, C. H Rojas
1, José Ramón G. Suárez2
1 Electrical Engineering Department University of Oviedo
Gijón, Spain [email protected]
2 Global Research & Development Department Arcelor Mittal Avilés, Spain
Abstract. This paper presents an analysis of the electric power flows in a hot rolling mill plant using a power quality analyzer and developing simulation models with Matlab-Simulink. The model inputs have been taken from process data by the process computer of the plant. A STATCOM with a control strategy based on the d-q coordinates is used as solution to improve the reactive compensation as well as to minimize the voltage fluctuations and sags effect. The overall electric model has been simulated with the STATCOM to check the improvement in the voltage stability and the consumption.
Key words Cycloconverter, dq reference frame, Hot rolling mill, STATCOM, Static VAR Compensator, voltage sag
1. Introduction Rolling mill plants are one of the main facilities in the steel manufacturing with the highest power consumption. Several high power drives are installed in this type of industry, including 6 and 12-pulse cycloconverters with synchronous motors and 6 and 12-pulse rectifiers with shunt dc motors. These motors are used to move the rolls in all the stands of the rolling mill. Due the performance of these type of power electronic drives, there is an important reactive energy consumption, as well as, harmonic content. Reactive power increases the transmission system losses, reduces the power transmission capability of transmission lines and maintains a voltage profile within no permissible values. It is necessary to add devices that are able to compensate these reactive power flows and improve the efficiency and power quality in the grid. In addition, power quality disturbances like voltage sags, could make the drives disconnect, with several economical and technical problems for the process. Therefore, the compensation
device should be able to avoid or, at least, minimize, the effects of these disturbances [1]-[2]. In order to design the compensation system, it is necessary to do a power quality analysis in the plant. Through this analysis, active and reactive power flows will be evaluated as well as the main power quality disturbances. In addition, it is useful to develop electric models for the plant and the compensation systems to evaluate and simulate the well performance in different conditions and with harmonic contents. These models will allow analyzing the voltage stability and the transients when voltage sags appear.
2. Electric models and power flows in a hot rolling mill
A. Description of the plant
The hot rolling mill chosen has a roughing stand with two high synchronous motors driven by 12-pulse cycloconverters. This stand is reversing. In addition, the finishing rolling mill consists of 7 stands, some of them with synchronous motors driven by 6-pulse cycloconverter and, the other ones with shunt dc motors driven by 12-pulse rectifiers.
Table I. – Hot strip mill drives
Stand Drive type Rated Power
Roughing mill (top and bottom motors)
12-pulse cycloconverter + synchronous motor
2 x 10 MW
F0 (top and bottom motors)
12-pulse rectifier + DC motor 2 x 2.98 MW
F1, F2, F3, F4 6-pulse cycloconverter +
synchronous motor 4 x 8 MW
F5 12-pulse rectifier + DC motor 6 MW
F6 12-pulse rectifier + DC motor 3.7 MW
https://doi.org/10.24084/repqj12.417 582 RE&PQJ, Vol.1, No.12, April 2014

Stands with cycloconverter are F1, F2, F3 and F4 and each one has a rated-power of 8 MW. On the other hand, stand with rectifiers and DC motors are F0, F5 and F6. The features and rated values of these drives are shown in the Table 1.
Fig. 1: 30 kV Substation Single phase diagram
Fig. 2: Main layer of the electric model. The seven finishing
rolling mill stands are shown as F0-F7.
Fig. 3: AC drive (6-pulse cycloconverter). Main parts.
The hot strip mill main substation is fed by two 32 kV electrical lines from a 32 kV bar in other substation. PCC is considered in the main substation bar, at 32 kV, where all the drives are connected through transformers. In the figure bellow a schematic view of the general connection model is represented.
Fig. 4: 6-pulse cycloconverter topology
Fig. 5: DC drive (12-pulse rectifier). Main parts.
The main parts of the facilities have been modeled, including the roughing rolling mill and the finishing rolling mill stands. That represents almost the 80% of the overall power installed and the main loads of the manufacturing process. Most of the rest of the elements are auxiliary systems, pumps, furnace blowers, coilers and motors for the roller conveyors. The overall rated power modeled almost reaches 70 MW. In the Fig. 1 global electric model of the plant is shown. B. Process and manufacturing data. Several data registers have been done in the hot rolling mill, measuring the time evolution of drive speeds, rolling torques, currents, powers, etc, with the objective of validating models and having inputs for them. Rolling torques are used as load torques for the model drives, as well as speeds are used to set the references of speed control in them. Input data are loaded into Matlab Workspace through an Excel file.
150
200
250
300
150
200
250
300
62.5 63 63.5 64 64.5 65 65.5 66 66.5150
200
250
300
time (min)
F4
F5
Fig. 6: Speed profiles [rpm]
https://doi.org/10.24084/repqj12.417 583 RE&PQJ, Vol.1, No.12, April 2014

-0.2
-0.2
0
0.2
0.4
-0.2
0
0.2
0.4
10 11 12 13 14 15 16 17 18 19 20-0.05
0
0.05
0.1
time (min)
F6
F4
F5
Fig. 7: Torque profiles [kN.m]
C. Simulation results.
Fig. 8: Active and reactive power in an input line.
After including all the drives and the two supply lines in the main 32 kV substation, a simulation of the electric consumption has been done, taken results of the active and reactive power flows as well as currents and voltages waveforms or drives speed evolution during a slab pass through the finishing rolling mill (having several passes in the roughing rolling mill). In the Fig. 8, the simulation time is around 200 s with a sample time of 40 ms.
It can be observed that reactive power is even higher than active power with the result of a very bad power factor. Therefore the compensation of the huge reactive energy is very important, overall, taking the huge values of power into account, in the range of tens of MVA.
D. Measurements. Active and reactive power flows and consumptions.
In addition, several measurement campaigns have been done using a power quality analyzer that allows to measure voltages and currents with 8 channels. Moreover, this equipment also allows to measure maximum, average and minimum values of active and reactive power flows, harmonic content, signal RMS, flicker parameters, frequency, unbalance and registering several power quality disturbances, like voltage sags, transients or overvoltages. The power quality analyzer has been connected to measure in one of the two lines that feed the hot rolling mill main substation. Measurements have been taken each 1 s, registering a maximum, an average and a minimum value. In these figures below, the active and reactive maximum values are shown during 3 minutes. Five passes in the roughing rolling mill can be observed for each slab. Active and reactive power profiles are the composition of the roughing rolling mill passes and the previous slab in the finishing rolling mill, appreciating five peaks due the roughing rolling mill passes. Active power flows reach 20-30 MW for most of the rolling conditions. Although simulation results (Fig. 8) and measurements shown in Fig. 9 and Fig. 10 are from different rolling campaigns, important similarities can be observed.
Fig. 9: Active Power in an input line.
Fig. 10: Reactive Power in an input line.
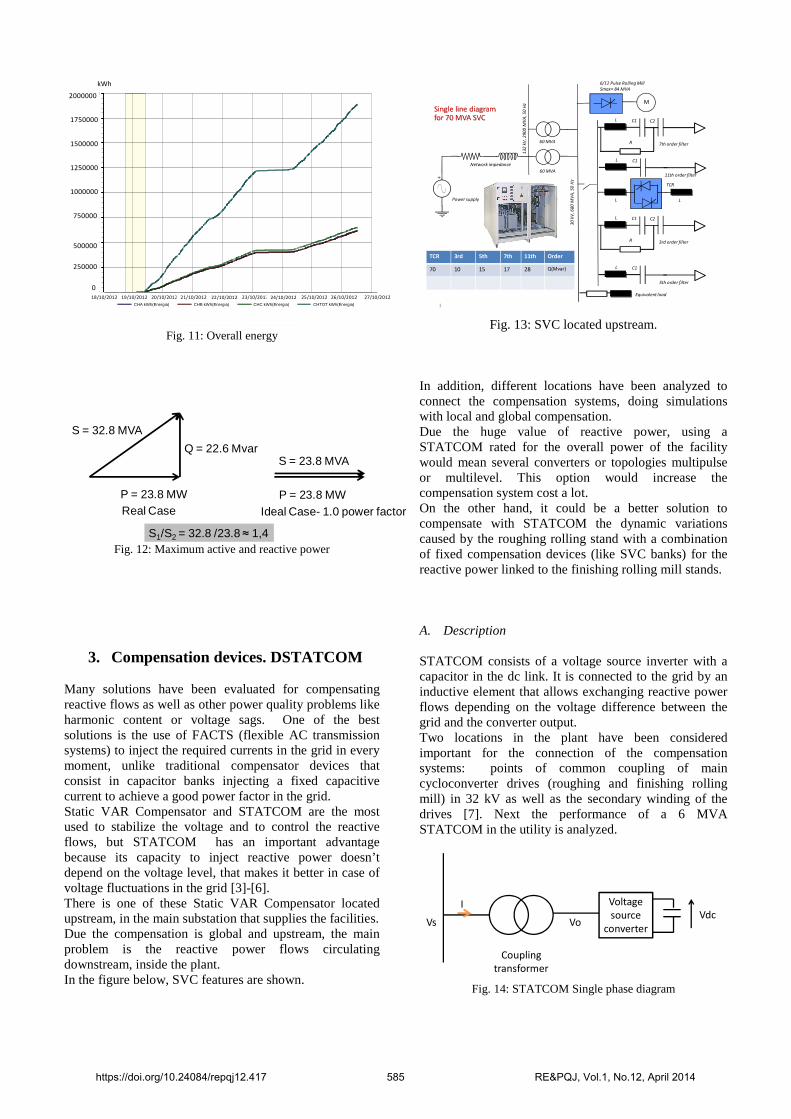
Electric energy evolution during a week is shown in the figure 11, observing a standstill without any energy rise in that period. The energy consumption of the plant is around double because two identical lines supply the electricity to the main substation. Therefore the overall energy during the week was around 2 lines x1900MWh/line=3800 MWh. During the measurement campaign, maximum of average values of active and reactive power have been taken. In the figure 10, a power flow analysis with the average values is presented. On the left side of the figure, average apparent power that flows into through the line is calculated from active and reactive power flow. On the right side of the figure the real case is compared with an ideal case under reactive power compensation. There is a current ratio of 1.4 between the two cases, that means a reduction of losses about a half (considering losses proportional to the current square). During the measurement campaign it could be observed that the supply voltage has a maximum THD index always around of 5% and less of 8%. Then, this parameter satisfies the restrictions imposed by the standard. This is due to the high short circuit power in the point of common coupling. For this reason it is not necessary any harmonic compensation system.
0
5000
10000
15000
20000
25000
30000
35000
40000
1 60 120 180
t[s]
Q[kvar]
0
5000
10000
15000
20000
25000
30000
35000
40000
45000
50000
0 60 120 180
Active Power
P [kW] Slab pass
t[s]
https://doi.org/10.24084/repqj12.417 584 RE&PQJ, Vol.1, No.12, April 2014
Carta del diagrama del tiempo
18/10/2012 17:25:00,00 - 26/10/2012 12:41:18,99
CHA kWh(Energia) CHB kWh(Energia) CHC kWh(Energia) CHTOT kWh(Energia)
18/10/2012 19/10/2012 20/10/2012 21/10/2012 22/10/2012 23/10/2012 24/10/2012 25/10/2012 26/10/2012 27/10/2012
kWh
0
250000
500000
750000
1000000
1250000
1500000
1750000
20000002000000
1750000
1500000
1250000
1000000
750000
500000
250000
kWh
0
18/10/2012 19/10/2012 20/10/2012 21/10/2012 22/10/2012 23/10/2012 24/10/2012 25/10/2012 26/10/2012 27/10/2012
Fig. 11: Overall energy
P = 23.8 MW
Q = 22.6 Mvar
S = 32.8 MVA
P = 23.8 MW
S = 23.8 MVA
Real Case Ideal Case- 1.0 power factor
S1/S2 = 32.8 /23.8 ≈ 1,4 Fig. 12: Maximum active and reactive power
3. Compensation devices. DSTATCOM
Many solutions have been evaluated for compensating reactive flows as well as other power quality problems like harmonic content or voltage sags. One of the best solutions is the use of FACTS (flexible AC transmission systems) to inject the required currents in the grid in every moment, unlike traditional compensator devices that consist in capacitor banks injecting a fixed capacitive current to achieve a good power factor in the grid. Static VAR Compensator and STATCOM are the most used to stabilize the voltage and to control the reactive flows, but STATCOM has an important advantage because its capacity to inject reactive power doesn’t depend on the voltage level, that makes it better in case of voltage fluctuations in the grid [3]-[6]. There is one of these Static VAR Compensator located upstream, in the main substation that supplies the facilities. Due the compensation is global and upstream, the main problem is the reactive power flows circulating downstream, inside the plant. In the figure below, SVC features are shown.
1
+
Power supply
M
6/12 Pulse Rolling Mill
Smax= 84 MVA
13
2 k
V,
29
00
MV
A,
50
Hz
30
kV
, 6
80
MV
A,
50
Hz
TCR
Network impedance
60 MVA
60 MVA
L L
L
R 3rd order filter
C1 C2
L
5th order filter
C1
L
R 7th order filter
C1 C2
L
11th order filter
C1
Equivalent load
TCR 3rd 5th 7th 11th Order
70 10 15 17 28 Q(Mvar)
Single line diagram for 70 MVA SVC
Fig. 13: SVC located upstream.
In addition, different locations have been analyzed to connect the compensation systems, doing simulations with local and global compensation. Due the huge value of reactive power, using a STATCOM rated for the overall power of the facility would mean several converters or topologies multipulse or multilevel. This option would increase the compensation system cost a lot. On the other hand, it could be a better solution to compensate with STATCOM the dynamic variations caused by the roughing rolling stand with a combination of fixed compensation devices (like SVC banks) for the reactive power linked to the finishing rolling mill stands. A. Description
STATCOM consists of a voltage source inverter with a capacitor in the dc link. It is connected to the grid by an inductive element that allows exchanging reactive power flows depending on the voltage difference between the grid and the converter output. Two locations in the plant have been considered important for the connection of the compensation systems: points of common coupling of main cycloconverter drives (roughing and finishing rolling mill) in 32 kV as well as the secondary winding of the drives [7]. Next the performance of a 6 MVA STATCOM in the utility is analyzed.
Voltage
source
converter
Coupling
transformer
VdcVs
I
Vo
Fig. 14: STATCOM Single phase diagram
https://doi.org/10.24084/repqj12.417 585 RE&PQJ, Vol.1, No.12, April 2014

+
M
No linear “Hot RollingMill” plant
D-STATCOM
Utility
32 kV
132 kV
Fig. 15: STATCOM connection
B. 6-pulse STATCOM model
+
M
No linear “Hot RollingMill” plant
STATCOM
Utility
32 kV
132 kV
dq/abc
dq/abc
Phase-
Locked
Loop
id,iq
Vd,Vq
AC voltage
controller
Current
regulator
Vdc
iq*Vd
id* ed*,eq* Modulation-
index
generator
Vdc
MI, α
PWM
generator
DC voltage
controller
Vdc
Fig. 16: STATCOM control model
The first proposed solution is the local compensation of the dynamic variations in the roughing rolling drives using 6-pulse, 2-level STATCOMs connected in the secondary winding of the drive transformers. Using Matlab/Simulink, a 2-level STATCOM simulation model has been developed with a rated power of 6 MVA and a dc voltage level of 3760 V. The converter uses GTO’s.[8]-[11].
Table II. – STATCOM parameters
C. Reactive Control STATCOM basic control strategy used is based in dq reference frame. A PLL is used in order to orient d axis with the voltage vector. Then, currents in the d axis direction mean active currents, in opposite of q axis components which are reactive currents. Therefore, d axis current is used to control the losses in the converter and the capacitor and it is set by the dc link control. On the other hand, q axis is used to control the reactive flows between the converter and the grid. In reactive control mode, q axis current reference is set to compensate the reactive current demanded by the load.
0 5 10 15 20 25 30-12
-10
-8
-6
-4
-2
0
2
4
6
8 x 10⁶
t[s]
Q[V
AR
]
STATCOMLoad
Fig. 17: STATCOM VAR control. Reactive power evolution
under load changes
4. STATCOM in hot rolling mill model
0 10 20 30 40 50 602.55
2.6
2.65x 10
4
t[s]
Ugr
id[V
]
0 10 20 30 40 50 60
-12
-10
-8
-6
-4
-2
0
x 106
t[s]
Q[V
AR
]
QstatcomQload
VrefUgrid
Fig. 18: STATCOM VAR control in the plant
45 50 55 60 65 70 75 80 85 90-6
-4
-2
0
2
4
6
8
x 106
t[s]
P[W
] Q
[VA
R]
P[W]Q[VAR]
Fig. 19: Roughing rolling mill active and reactive power flows
after local compensation with STATCOMs
STATCOM Data
Nominal Power [MVA] 6
Nominal PCC voltage [V] 1150
DC voltage level [V] 3760
Transformer reactance [Ω] 0.22
Transformer rate 1
Capacitance [mF] 50
https://doi.org/10.24084/repqj12.417 586 RE&PQJ, Vol.1, No.12, April 2014

The modeling of the STATCOM has been included in the model of the plant. The reactive power compensation capability of the STATCOM is illustrated by simulation results shown in Fig. 18 (a) an (b). In the figure, the PCC voltage as well as the reactive power evolution in response to load changes associated with different cycles. Using four of these STATCOM, local compensation has been developed in the secondary windings of the drive transformer. In figure 19, active and reactive power flows due the roughing rolling mill can be observed, appreciating that the reactive power average value is very low, avoiding reactive flow upstream.
5. Conclusions
This paper investigates a proposal for the reactive compensation system used in a hot strip mill plant. The proposed model is based on a review of the power quality measurements taken at key locations in the Rolling Mill electrical distribution system, around different operation points. Power quality measurements allow confirm analytical results and can also serve as a basis for the plant model in conducting the simulations. Several topologies and connection points for the STATCOM have been analyzed, calculating it for compensating the dynamic reactive flows due to the roughing rolling mill drives. The use of a compensation system like STATCOM, allows minimizing the reactive flow demanded by the plant, reducing the system losses as well as increasing the power transmission capability of lines and transformers. STATCOM is used for voltage regulation and voltage sag mitigation. Acknowledgement The authors would like to thank Arcelor Mittal and the European Commission Research fund for Coal and Steel for their financial and technical support in the development of this paper. References [1] R. Cai, M. Bongiorno, and A. Sannino, “Control of D-STATCOM for voltage dip mitigation,” in Future Power Systems, 2005 International Conference on, 2005, p. 6 pp. –6.
[2] F. Carlsson, “On impacts and ride through of Voltage sags exposing line operated ac-machines and metal processes,” Royal Institute of Technology, Stockholm, 2003. [3] A. Cetin and M. Ermis, “VSC-Based D-STATCOM With Selective Harmonic Elimination,” Industry Applications, IEEE Transactions on, vol. 45, no. 3, pp. 1000 –1015, Jun. 2009. [4] F. Issouribehere, J. L. Agüero, and P. E. Battaiotto, “Diseño de un STATCOM para la mitigación del Flicker producido por hornos de arco eléctrico,” XII ERIAC- Encuentro Regional Ibero-americano del CIGRÉ Foz do Iguazú-Pr, Brasil, May 2007. [5] P. K. Jin, M. S. A. Dahidah, and C. Klumpner, “Nine-level SHE-PWM VSC based STATCOM for VAR compensation,” in Power and Energy (PECon), 2010 IEEE International Conference on, 2010, pp. 135 –140. [6] G. P. Kornilov, A. A. Nikolaev, A. Y. Kovalenko, and E. A. Kuznetsov, “Means and Trends of Reactive Power Management at Large Ironworks,” Allerton Press, vol. 79, no. 5, pp. 248–253, 2008. [7] H. K. Tyll and F. Schettle, “Historical overview on dynamic reactive power compensation solutions from the begin of AC power transmission towards present applications,” in Power Systems Conference and Exposition, 2009. PSCE ’09. IEEE/PES, 2009, pp.1–7. [8] M. K. Mishra and K. Karthikeyan, “A Fast-Acting DC-Link Voltage Controller for Three-Phase DSTATCOM to Compensate AC and DC Loads,” Power Delivery, IEEE Transactions on, vol. 24, no. 4, pp. 2291 –2299, Oct. 2009. [9] K. Somsai and T. Kulworawanichpong, “Instantaneous power control of D-STATCOM with consideration of power factor correction,” in Electrical Engineering/Electronics Computer Telecommunications and Information Technology (ECTI-CON), 2010 International Conference on, 2010, pp. 1186 –1190. [10] Z. Xue-song, L. Yi-qi, M. You-jie, Y. Hai-shan, and Z. Xuan-zheng, “STATCOM control research and analysis,” in Computer, Mechatronics, Control and Electronic Engineering (CMCE), 2010 International Conference on, 2010, vol. 3, pp. 1 –4. [11] Q. Yu, P. Li, W. Liu, and X. Xie, “Overview of STATCOM technologies,” in Electric Utility Deregulation, Restructuring and Power Technologies, 2004. (DRPT 2004). Proceedings of the 2004 IEEE International Conference on, 2004, vol. 2, pp. 647 – 652 Vol.2.
https://doi.org/10.24084/repqj12.417 587 RE&PQJ, Vol.1, No.12, April 2014