power raise through improved reactor … side divider plate may also be allowing some...
TRANSCRIPT

POWER RAISE THROUGH IMPROVEDREACTOR INLET HEADER TEMPERATURE MEASUREMENT
AT BRUCE A NUCLEAR GENERATING STATION
Dr. S. Basu —Design Superintendent
Bruce A NGSOntario Hydro CA9900086
D. BruggemanDesign Engineer Specialist
Bruce A NGSOntario Hydro
SUMMARY
For optimal performance, CANDU reactors are operated within a small reactorinlet header (RIH) temperature range during normal operation. The upper limiton reactor inlet header temperature is one of several parameters which affectscritical heat flux in the reactor channel, and hence the integrity of the fuel. Thislimit, including an allowance for instrument accuracy, is a nuclear safetyrequirement which cannot be exceeded. As the boilers and feedwater pre-heaters have aged they have become less efficient at removing heat. The boilerprimary side divider plate may also be allowing some inlet-to-outlet bypass flowon the primary heat transport (D2O) side. Over time this has caused the boileroutlet temperature and the reactor inlet temperature to slowly rise.
At present the Bruce A units are de-rated to compensate for the increased RIHtemperature. A more accurate temperature measurement would reduce theuncertainty allowance in the safety analysis and allow the station to raise theRIH temperature to a value closer to the safety limit. Hence, it could increase theplant power output and, therefore the plant's revenue. Based on the presentoperating state of the Bruce A units, increasing the RIH temperature by 1°Cwould increase the Boiler Pressure 83 kPa, which could increase the output by15 MW per unit.
Currently, the nominal RIH temperature is 250°C, and includes an inaccuracy ofas much as +3 CC. This inaccuracy is made up of process flow stratification,instrument tolerances and drift, and environmental effects. A detailed analysisof the measurement loop errors was performed and it was demonstrated that byusing commercially available digital technology, the measurement loop error canbe reduced to ±0.72°C. This could result in an improvement of 2.28°C or 34 MWper unit.

The use of calibrated high quality dual element RTD's (Resistance TemperatureDetectors) installed in the existing spare thermowells provides redundancy atlow cost. Using different transmitter manufacturers on opposite legs of the RTDtemperature measurement loop provides diversity in measurement and permitsthe use of commercially available 'smart' digital transmitters at no extrasignificant cost or safety impact.
1. INTRODUCTION
Reactor Inlet Header (RIH) temperature has become a factor limiting theperformance of the Ontario Hydro Bruce A units. Specifically, the RIHtemperature is one of several parameters that is preventing the Bruce A unitsfrom returning to 94% power operation.
RIH temperature is one of several parameters which affect the critical heat fluxin the reactor channel, and hence the integrity of the fuel. Ideally, RIHtemperature should be lowered, but this cannot be done without improving theheat transfer performance of the boilers and feedwater pre-heaters.Unfortunately, the physical performance of the boilers and pre-heaters hasdecayed and continues to decay over time, and as a result the RIH temperaturehas been rising and approaching its defined limit.
At reduced reactor power levels, the RIH temperature has been controlled bylowering the boiler (secondary side) pressure, which lowers the RIH temperatureby increasing the heat transfer rate. But lowering the boiler pressure will alsolimit the turbine power output capacity; as the boiler pressure goes down sodoes the turbine capacity, below 94%.
In order to raise the unit power output, a solution to the rising RIH temperatureproblem must be found. The long term solution to this problem will beimprovement of the boiler and preheater performance, which to date has notbeen achieved, but work continues on this issue. In the short term, moreaccurately defining the actual RIH temperature limit and/or reducing themeasurement uncertainty (error) incorporated in the operating margin wouldallow improvements in unit performance.
The remainder of this paper deals with methods of reducing the measurementuncertainty. It is recognized that even small improvements in measurementaccuracy will allow the unit to operate closer to the true RIH temperature limit.Based on the present operating state of the units, even a 1CC improvement inRIH temperature measurement would allow boiler pressure to increase 83 kPa,which can correspond to approximately 15 MW output power improvement.

To reduce the measurement error, an understanding of the following items isessential:
• Reactor Inlet Header design and processes affecting the temperaturemeasurement,
• existing measurement loop and location,• measurement loop errors sources, and• the quantification of the errors in the measurement loop.
With an understanding of the current RIH temperature measurement loop andmethods available to improve it, a solution to reduce the measurementuncertainty is presented.
2. RIH DESIGN
Four (4) Reactor Inlet Headers form part of the CANDU system Primary HeatTransport (PHT) system. There are two (2) Outer Zone Inlet Headers (ROZIH)and two (2) Inner Zone Inlet Headers (RIZIH). There is one RIZIH and oneROZIH at each end of the reactor core, (see figure 1). There are also 2 ReactorOutlet Headers, again one at each end.
The PHT is a closed circulating system; the flow is from the Reactor InletHeaders through the reactor to the Outlet Header, and on to the PHT pumps thatmaintain the flow. From the PHT pumps the flow splits into 3 paths; one path tothe ROZIH, one path bypasses the preheater, and one path through thepreheater. From the preheater the flow is mixed with the bypass flow, and thenproceeds to the RIZIH. Note that the preheater actually cools the PHT side andwarms the secondary side.
The headers are enclosed in feeder cabinets. These cabinets are essentiallyconstructed as small, well insulated rooms around both the inlet and outletheaders. The flow enters the inlet headers from both ends, and therefore splitsthe headers in half, which results in a quadrant arrangement, (NW, NE, SW,SE). Specifically, it must be assumed that each end of a given header will be ata slightly different temperature. For convenience the header temperature can bereferred to by header and quadrant, (e.g. NE RIZIH would refer to the North endtemperature of the East Reactor Inner Zone Inlet Header.).

Present Outer ZoneMeasuring Point (4)
J Present Inner ZoneMeasuring Point {8) - - _nng Point (8)
Header Temperatures
Auxiliary Bay andthen Cabled to
the ControlEquipment Room
Figure 1 Reactor Header Simplified General Arrangement
Of particular interest is the location of the Inner Zone measuring point, (seeFigure 2). It is located near the junction of two (2) flow streams; the preheateroutlet and the preheater bypass flows. According to pipe fluid mechanics thecomplete mixing of two fluid streams will not occur for at least 2 pipe diametersfrom the junction. Incomplete mixing will skew the temperature measurement,either high or low depending on which flow stream is dominant.
Region of Incomplete Mixing
Reactor I nner Zone I met Header
Inner Zone RIHTemperatureMeasurementLocation
Figure 2 Relative Location of Inner Zone RIH Temperature Measurement
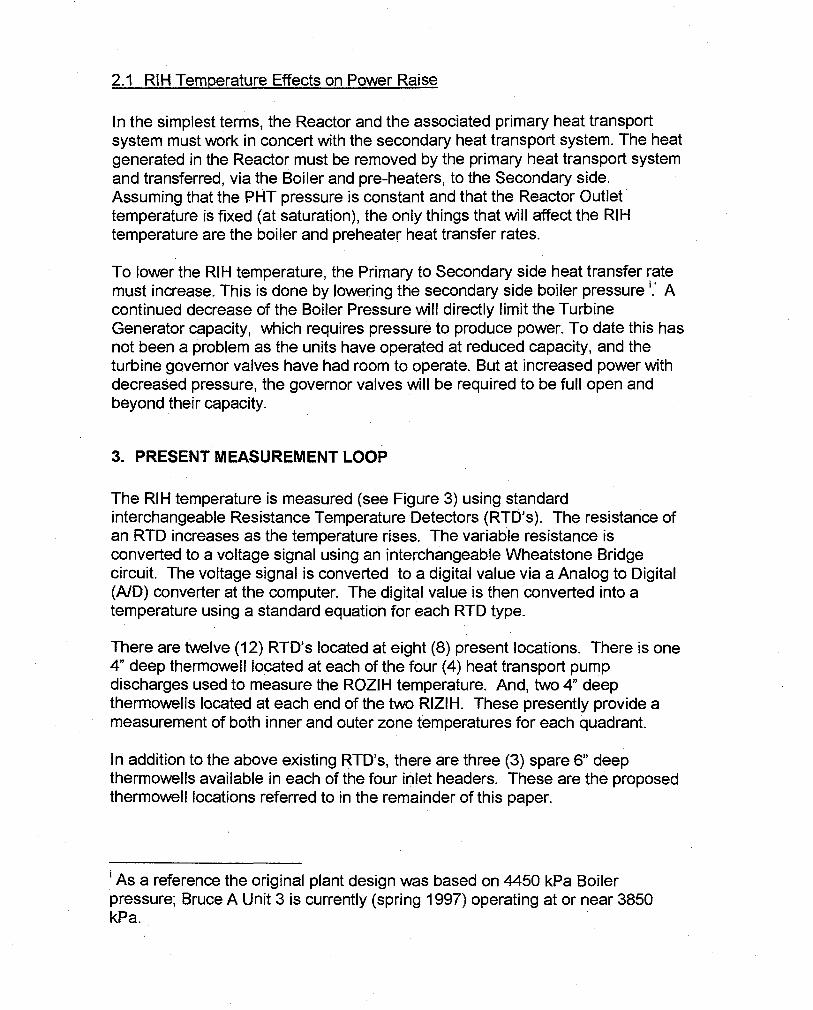
2.1 RIH Temperature Effects on Power Raise
In the simplest terms, the Reactor and the associated primary heat transportsystem must work in concert with the secondary heat transport system. The heatgenerated in the Reactor must be removed by the primary heat transport systemand transferred, via the Boiler and pre-heaters, to the Secondary side.Assuming that the PHT pressure is constant and that the Reactor Outlettemperature is fixed (at saturation), the only things that will affect the RIHtemperature are the boiler and preheater heat transfer rates.
To lower the RIH temperature, the Primary to Secondary side heat transfer ratemust increase. This is done by lowering the secondary side boiler pressure'.' Acontinued decrease of the Boiler Pressure will directly limit the TurbineGenerator capacity, which requires pressure to produce power. To date this hasnot been a problem as the units have operated at reduced capacity, and theturbine governor valves have had room to operate. But at increased power withdecreased pressure, the governor valves will be required to be full open andbeyond their capacity.
3. PRESENT MEASUREMENT LOOP
The RIH temperature is measured (see Figure 3) using standardinterchangeable Resistance Temperature Detectors (RTD's). The resistance ofan RTD increases as the temperature rises. The variable resistance isconverted to a voltage signal using an interchangeable Wheatstone Bridgecircuit. The voltage signal is converted to a digital value via a Analog to Digital(A/D) converter at the computer. The digital value is then converted into atemperature using a standard equation for each RTD type.
There are twelve (12) RTD's located at eight (8) present locations. There is one4" deep thermowell located at each of the four (4) heat transport pumpdischarges used to measure the ROZIH temperature. And, two 4" deepthermowells located at each end of the two RIZIH. These presently provide ameasurement of both inner and outer zone temperatures for each quadrant.
In addition to the above existing RTD's, there are three (3) spare 6" deepthermowells available in each of the four inlet headers. These are the proposedthermowell locations referred to in the remainder of this paper.
1 As a reference the original plant design was based on 4450 kPa Boilerpressure; Bruce A Unit 3 is currently (spring 1997) operating at or near 3850kPa.

Reactor Building Auxliary BayControl Equipment
Room
TemperatureElement
lOOOhmRTDWell Type
ffl
Junction Box
Header
Figure 3 Present RTD Measurement Loop - Simplified
As can be seen in Figure 3, there are three (3) physically distinct parts, to themeasurement loop:
• the RTD in the Reactor Building; from the thermowell to the JunctionBox,
• the Wheatstone Bridge in the Auxiliary Bay; from the Junction Box tothe Control Distribution Frame, and
• the computer in the Control Equipment Room; from the ControlDistribution Frame to the computer.
Each of these parts has a different physical environment but are connectedusing standard shielded cable as shown.
3.1 Environmental Conditions
The environmental conditions associated with each part of the measurementloop vary significantly and will affect the accuracy of the measurement loop.

In the Reactor Building and specifically within the feeder cabinet, theenvironmental conditions (design) and radiation levels are:
• Temperature ambient to 350°C• Humidity 0-95%• Radiation 75% full power Gamma, 80 Rad/h• Radiation 95% full power Gamma, 100 Rad/h• Radiation Slow Neutron, equivalent to 0.7-1 Rad/h
In the Auxiliary equipment bay, the environmental conditions are:• Temperature 10°C to 40°C, (normal operation)• Humidity 20-95%
In the Computer Room and Control Equipment Room, the environmentalconditions are:
• Temperature 10-40°C• Humidity 20-95%
3.2 Measurement Loop Errors
The following section is a review of 17 identified RTD measurement loop errors,their sources and the methods available to reduce them. The effects of theseerrors are summarized at the end of this section, in Table 1.
3.2.1 Reactor Building Environmental Effects
Gamma Ray Heating Gamma radiation can cause a thermocouple or RTD toread falsely high. This is due to the physical heating of the temperature elementitself. At full reactor power the In-Core gamma field is 200Mrad/h which wouldcause a heating effect1 of 5W/cm3 which, in turn, would cause the readings to be14°C higher.
As the RIH RTD's are not exposed to the same magnitude of radiation this effectis not expected to be as large. Assuming the RIH's are only exposed to10Orad/h of gamma radiation and assuming a linear relationship with radiationlevel, the average effect would be 0.000007°C. Although the physical RTDdesigns are not the same, (i.e. heat transfer co-efficient and physical volumes ofthe In-Core RTD's versus RIH temperature RTD's). The gamma radiationheating was confirmed to be 'negligible' as part of a CANDU Owners Group(COG) study.
Transmutation causes a change in the atomic structure of the sensing element,causing the RTD to have a different resistance versus temperaturecharacteristic. This change may appear as a temperature drift with time, or asan erratic measurement. Transmutation is caused by the absorption of neutrons

within the atomic nucleus of the material used, i.e. neutron capture. The effectsof transmutation are typically irreversible. They can be identified by reviewingthe calibration history or by comparison with new RTD's of a similar design in thesame location.
A calibration comparison of 15 stocked RTD's versus 9 used RTD's removedfrom Unit 2 Bruce A after 19 years of service, was made. The results of thiscomparison indicated no significant difference between the Stock RTD's and theUsed RTD's measured resistance over the full operating temperature range (0-320°C). Neither was there a significant drift from the manufacturer's statedtemperature versus resistance curve, as shown by the results of the calibrationcheck.
The calibration errors for each RTD were summed over a span of 0-320°C anda "mean" error calculated. For the 9 Used RTD's the average of the "mean"errors was -0.05Q with a standard deviation of ±0.06 Q. Similarly the averageof the "mean" errors of the Stock RTD's was +0.02H with a standard deviationof ±0.06 Q. This implies a systematic error of -0.07Q, (-0.05 to +0.02 Q), with arandom component of ±0.06 D. for the Used RTD's versus the Stock RTD's. Thistranslates to only -0.027°C ±0.024°C, over 19 years. Note test errors are wellwithin the manufacturer's specified tolerances of ±1.5°C, therefore the errorcomponent due to transmutation is not readily apparent. The above errors aremore likely to be related to their 19 years of service, but have been included forcompleteness.
Aging or Drift or refers to the degradation of the RTD's performance from itscalibrated value with time in a normal operating environment, under normalconditions. The normal environmental stressors that an RTD will be exposed toinclude humidity, heat, vibration, radiation, temperature cycling. One or more ofthese stressors is always acting on the RTD whether it is in stock or is installed.
Results of aging tests performed by the US Nuclear Regulatory Commission(reference 2 section 12, which excludes radiation), showed that after a burn-inperiod of 6 months, nuclear grade RTD drift tended to stabilize in a drift band of±0.2°C. Aging tests on commercial grade RTD's showed twice the drift forsimilar testing, i.e. ±0.4°C. These results are valid for the nuclear grade RTD'sthat survived the aging test, (63%). During the aging test 17% failed with opencircuits, which were easily detected, while 20% showed a drift between 0.6-3.0°C, which were harder to detect in the absence of a reference against whichto measure the drift.
Radiation Induced Currents are likely to result from a flow of electrons betweenthe core wires and the outer sheath of the RTD cable, due to ionization of thecable materials by nuclear interactions (reference 1). These effects were not

observed during In-Core temperature monitoring, but that may be attributed togood design.
If radiation induced currents exist, they can be identified by measuring thevariations in bridge output when the RTD is irradiated and when it is not. If achange is observed, it will be systematic and a function of radiation level whichin turn is a function of reactor power level. No distinguishable radiation inducedcurrents have been observed.
Insulation Dielectric of both the cable and RTD, is affected by moisture andradiation. Reducing the insulation dielectric will allow current leakage to ground,which will have the effect of lowering the current to the bridge, and hence alower temperature reading. The present RTD specification requires that theresistance between the leadwire and the sheath (or ground) should be at least1000MH at room temperature and no less than 50 MiQ at 312°C. As anexample, lowering the insulation resistance to 1MQ will cause an error of0.019°C at 300°C. This would result in a systematic negative error.
Higher levels of radiation reduce the insulation resistance of the RTD ceramicand oxide insulators while the radiation exists, so that a current leakage couldoccur between the signal wires and the RTD sheath. This phenomenon hasbeen observed when measurements were taken in areas of intense radiation,e.g. during In-Core measurements where insulation resistance can drop byabout 1 MQ at full reactor power, (reference 1). As the radiation fields in thelocation of the RIH RTD's are orders of magnitude less than that observedduring the In-Core measurement, we can assume that the radiation short-termeffects on the Insulation Dielectric are negligible. After years of operation, theaccumulated radiation dose is brittling on the wire outer insulation and terminalblock material so that they disintegrate when touched. Presently there is aprogram in place to repair the terminal blocks and cabling as part of regularmaintenance.
3.2.2 Reactor Building Installation Effects
Stem losses are caused by large temperature gradients along the RTD stemwhich will cause the RTD to indicate a temperature lower than the actualprocess. The effect of stem losses was quantified by the US Nuclear RegulatoryCommission, (reference 2) and varies as a function of the relative RTDimmersion length, the temperature gradient and amount of insulation present.But provided that more than 25% of the RTD is immersed, the stem loss errorwill be « 0.01 °C.
40°C40'C
Insulation
Insulation
'Pipe
Outside Feeder Cabinet(Present)
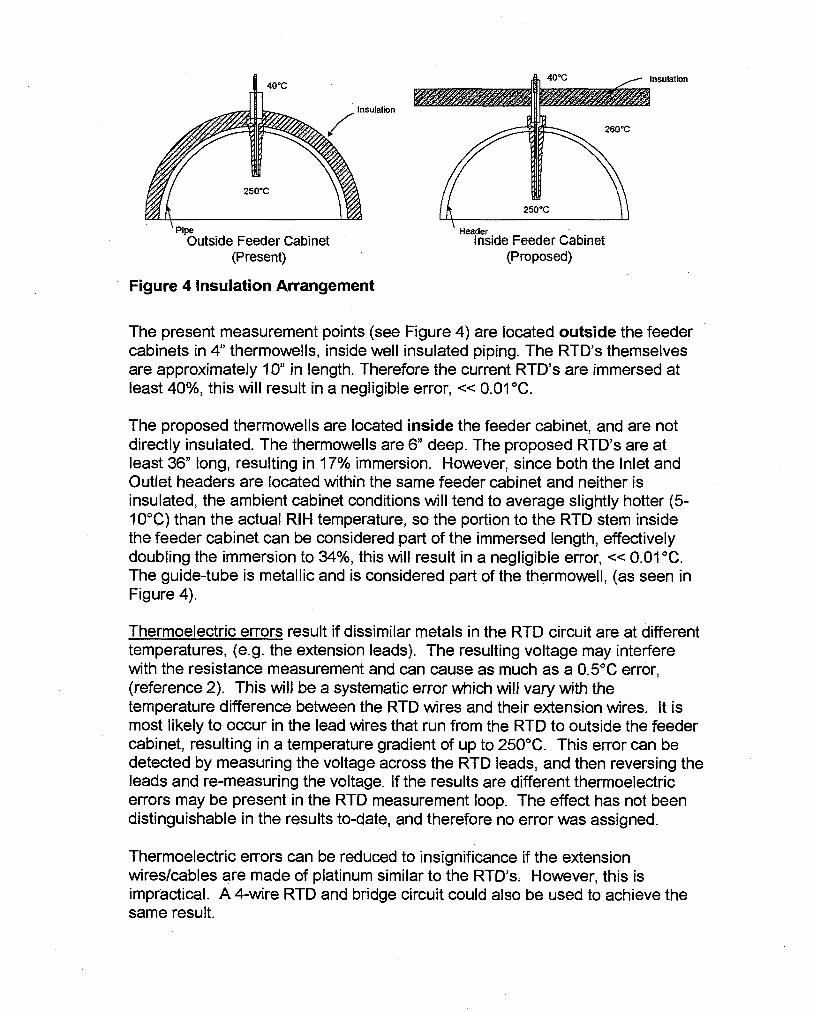
Figure 4 Insulation Arrangement
Header
Inside Feeder Cabinet(Proposed)
The present measurement points (see Figure 4) are located outside the feedercabinets in 4" thermowells, inside well insulated piping. The RTD's themselvesare approximately 10" in length. Therefore the current RTD's are immersed atleast 40%, this will result in a negligible error, « 0.01 °C.
The proposed thermowells are located inside the feeder cabinet, and are notdirectly insulated. The thermowells are 6" deep. The proposed RTD's are atleast 36" long, resulting in 17% immersion. However, since both the Inlet andOutlet headers are located within the same feeder cabinet and neither isinsulated, the ambient cabinet conditions will tend to average slightly hotter (5-10°C) than the actual RIH temperature, so the portion to the RTD stem insidethe feeder cabinet can be considered part of the immersed length, effectivelydoubling the immersion to 34%, this will result in a negligible error, « 0.01 °C.The guide-tube is metallic and is considered part of the thermowell, (as seen inFigure 4).
Thermoelectric errors result if dissimilar metals in the RTD circuit are at differenttemperatures, (e.g. the extension leads). The resulting voltage may interferewith the resistance measurement and can cause as much as a 0.5°C error,(reference 2). This will be a systematic error which will vary with thetemperature difference between the RTD wires and their extension wires. It ismost likely to occur in the lead wires that run from the RTD to outside the feedercabinet, resulting in a temperature gradient of up to 250°C. This error can bedetected by measuring the voltage across the RTD leads, and then reversing theleads and re-measuring the voltage. If the results are different thermoelectricerrors may be present in the RTD measurement loop. The effect has not beendistinguishable in the results to-date, and therefore no error was assigned.
Thermoelectric errors can be reduced to insignificance if the extensionwires/cables are made of platinum similar to the RTD's. However, this isimpractical. A 4-wire RTD and bridge circuit could also be used to achieve thesame result.
RTD - Thermowell Contact effects the RTD response time, (reference 2, section24). Spring Loaded Bayonet type RTD's are used in both the present andproposed locations. Both the present and the proposed RTD's and thermowellsare flat bottom, with straight insertion. The RTD spring is designed to provide asetting force of 8 Ib., in the installed position. This setup ensures that goodthermal contact is maintained for the service life of the RTD. As well the RTDand thermowell are made of corrosion resistant stainless steel. No error isassigned to this factor.
Handling and Hysteresis Errors may result if an RTD has been mishandled,dropped, bent, etc. Thermal hysteresis will cause the resistance to be differentfor a given temperature depending on whether the RTD temperature was risingor falling prior to reaching the given temperature. The source of Hysteresiserrors are difficult to quantify, though hysteresis errors of up to 0.3°C have beenobserved for old RTD's that have been extensively handled, while newlyannealed RTD's have limited this error to 0.02°C, (reference 2).
Hysteresis errors can be minimized by taking calibration points with increasingand decreasing temperatures to beyond the measured temperature range andthen averaging the results. Further, handling and manipulation of the RTD'sshould be minimized, which implies that high accuracy RTD's should not beremoved from their thermowells once installed unless they are being replaced.
Process Stratification at the junction of the preheater outlet flow and the bypassflow, a warm and a cold flow stream mix (see Figure 2). Complete mixing of theflow streams will not occur within less than 2 pipe diameters of junction, and anymeasurement of temperature within the mixing zone will be skewed either high orlow. This has been identified as a problem for the present RTD's used tomeasure the RIZIH temperature. And results of the cross calibration indicatethat the measurement is being systematically biased 1°C to 3°C low by thepreheater outlet.
Process stratification errors are best eliminated by relocating the processmeasuring point away from the mixing point, to ensure good mixing.
3.2.3 RTD Accuracy
During the manufacture of the RTD's material inhomogeneity and manufacturingcold work error are controllable parameters which affect the quality of the RTDaccuracy. The stated tolerance for 3-wire nuclear grade RTD's purchased byOntario Hydro for this application is:
0°Cto150°C ±0.75°CAbove 150°C ±0.5 % of temperature (@ 300°C this is ±1.5°C)
Any improvement in this accuracy will either require individual calibration and/orthe purchase of new RTD's with a tighter specification.
3.2.4 Auxiliary Bay Equipment Errors
Power Supply sensitivity studies were conducted and it was found that variationsin the excitation voltage caused a change of 0.0345 °C/mV. Power supplyvariations of ±10mV result in an error of +0.345 °C. The power supply variedover its stated operating temperature range (21.1°C-37.8°C) by ±0.09% or±9mV3, which translates to an additional ±0.311 °C. No estimates over a normaloperating temperature range of 10°C to 40°C is available, but may be assumedto be similar.
The power supply variations and temperature errors are combined using theRoot of the Sum of the Squares (RSS) method, resulting in a net power supplyaccuracy of ±0.464°C over the full expected operating temperature range.
Wheatstone Bridge circuits are used to convert the RTD signal to a 0-1VDCinput to the DCC Computers. The nominal excitation power is 10VDC. Thenominal accuracy of these bridges for an input range of -45°C to 343°C (389°Cspan), allowing for variations in matching resistors, is ±0.15% of span, or±0.58°C. The bridge card operating temperature sensitivity for the range(21.1°C-37.8°C) is ±0.12% of span error, or ±0.47°C. But the true conditions inthe auxiliary bay will vary between 10-40°C, and noting that the effectiveresistance of the bridge will vary with temperature, the bridge operatingtemperature sensitivity error must be extended an additional ±0.15°C. Thereforethe bridge temperature sensitivity error over the operating temperature range of10-40°Cis±0.62°C.
The nominal card accuracy and temperature variation error are combined usinga RSS method, resulting in a net bridge card accuracy of ±0.849°C over thenormal expected operating temperature range.

Lead Wire Resistance is assumed to be 1.2 Ohms for the non-adjustableWheatstone Bridge card. This resistance is in addition to the RTD resistance.The actual lead wire resistance is a function of the cables used, wire gauge,length, the number of junctions and number of sharp bends made in the wire. Abridge card lead wire resistance sensitivity study was done and concluded thatvariations in the lead wire resistance would cause a change of -1.07 °C for everyincrease in of 1Q in lead wire resistance.
A review of the Bruce A NGS cable data lists show the cables range from 27 to61 m in length in equal amounts. Hence the average length of cable is 44 m±17m. The resistance of 16 AWG wire is 0.0134 Q/m at 25°C, so the averagelead wire resistance is 0.59 H +0.23 Q. There is a disparity of 0.61 a ±0.23Qbetween the assumed 1.2Q lead wire resistance, and lead resistance of 0.59 Cl±0.23 Q. This translates to 0.65°C ± 0.246°C. This is a positive bias componentwhich causes the indicated temperature to be higher than actual.
Self-Heating of RTD is the heat generated by bridge excitation current flowthrough the RTD, and is a function of I2R, where I is the excitation current and Ris the resistance, and is a function of temperature. The amount of self-heatingis dependent on the RTD design. The Bruce A specification allows self-heatingof up to 0.2°C at 8.5mA excitation current when installed in a thermowell in a 1m/s fluid stream. The actual process flow past the RTD thermowell is 6-10 m/s.The present system has an excitation current of 8.1 mA at 0°C and 7.4mA at290°C. The amount of self-heating induced from this level of excitation currenthas not been quantified.
Reducing the excitation current to 1 mA will reduce self-heating by a factor of54( I2) at 290°C.

3.2.5 Computer Room
Analog to Digital Conversion of the 0-1V signal generated by the WheatstoneBridge is performed by the Digital Control Computer (DCC) analog inputsubsystem. The DCC's are tested and recalibrated every major outage. The lowlevel analog input accuracy is ±1.3 mV or ±21 counts (bits). Conversations withthe Bruce A staff indicate that the inputs have 'easily' maintained this. The Inputspan 0 to 1V corresponds to -45°C to 343.3°C, therefore the input accuracy±1.3mV corresponds to ±0.50°C.
Engineering Unit Conversion, is the final step employed by the DCC to convertthe digital input value x (0-1V) to an Engineering Value of temperature. TheRosemount RTD to temperature cubic equation matches the Resistance vs.Temperature4 curves within ±0.04°C:
3.2.6 Common Mode Errors
The cabling and grounding system design was reviewed. It appears thatmultiple shield grounds have been used, which can lead to ground loops.Conversations with station staff indicate that this has not been a problem.
Shielded cabling is used for the signal run from the RTD to the DCC. Both theWheatstone Bridge cards and the DCC Analog input cards are located in largemetal cabinets which are themselves grounded. Both practices should reducethe effect of RFl and EMI. Conversations with station staff indicate that this hasnot been a problem.
3.2.7 Summary of Measurement Loop Errors
The individual measurement loop errors are combined using the Root of Sum ofSquares (RSS) technique to determine the total loop error.
The following is a complete listing of the RTD temperature measurement looperror components, separated as long term and short term:
Table 1 Summary of Loop ErrorsArea ';
Reactor
ErrorBescriptfon
Gamma Ray HeatingTransmutationRadiation Induced CurrentsInsulation DielectricAging / DriftAging / Drift radiation
Total-Error
negligibleNot ApparentNot ApparentNot ApparentiO.2°C•.Q27±0.024°C
Long Term Variable
±0.2°C
Rxed-SbortTermVariable
-.027±0.024°C

Install
RTD
Aux. Bay
DCC
Stem LossesThermoelectric ErrorsRTD-Thermowell contactHandling Errors - HysteresisProcess Stratification, not included intotal.
Interchangeable RTD Accuracy
Power SupplyWheatstone BridgeLead Wire ResistanceSelf Heating
Analog InputEngineering Unit Conversion
Root Sum Square - RSS
Long Term Drift (2cRIH-d)Fix and Short-term Variations
«-O.O1°CNot ApparentNot Apparent+0.02°CQuadrant Specific, -
rcto-3°c
t1.5°C
tfcO.464°C±0.849°C(•0.65±0.24S°Cf-0.2°C
M).04°C
+O.823±1.881°C
iO.02°C
to.3H°+D.62°C
iO.166°C
iO.741°C
«-o.orc
±1.5°C
±0.345°C±0.58°C+0.65ctD.246oCko.2°c
±0.471 °Cao.O4°c
+0.823±1.729°C
The Auxiliary Bay Power Supply and Wheatstone Bridge errors were divided asboth short-term and long-term. The errors caused by operating temperaturevariations is considered long-term, while the remainder of the errors wereconsidered fixed or short-term. The DCC Analog Input error was divided as bothshort-term and long-term. A one-third, long-term drift component is usedconsistent with previous analysis of loop error.
4. LOOP CROSS-CALIBRATION
The preceding section details the errors and their possible magnitude by reviewof available interchangeable component tolerance data. The resultant total errorwould therefore represent a worst case error. Loop Cross-Calibration providesa method of more realistically quantifying the actual loop error, by comparingthe RIH RTD measurement to an accurate reference. The FINCH inlet sidechannel differential temperature RTD's can provide between 5 and 6measurements of the inlet header temperature per quadrant. The average ofthese measurements is then used as an accurate reference.
As a sub-program to the Power Raise program, an evaluation was performed byBruce A Reactor Safety which established a non-intrusive means of crosscalibrating the mixing zone inlet header RTD's on-load, using the FINCHmounted RTD's as a reference. This evaluation provides the basis for the cross-calibration technique. The cross-calibration method was extended to alsoevaluate the uncertainty associated with inner zone temperature measurementfor RTD's installed directly in the header itself.

4.1 Loop Cross-Calibration SetupThe Loop Cross-Calibration uses a data logger to record and time stamp thequadrant specific inlet header temperature via 5 or 6 FINCH RTD's, while theDCC computer and plant status monitoring system computer are used to recordand time stamp the RIH temperature. The FINCH data points are then averagedand time-paired (matched) with the RIH temperature. The instantaneousdifference between the FINCH average and the RIH temperature is averagedand the standard deviation (sO of the difference is calculated. The averagerepresents the systematic bias (dj) while the standard deviation (Si) is used todetermine the random uncertainty in the measurement.
For the period of the Cross-Calibration, one of the RTD's on the inlet side fromeach of the FINCH differential temperature measurements is used to measurethe actual Reactor Inlet temperature. Within each quadrant these FINCH RTD'sare used to create the reference temperature for calibration of the actual RIHRTD.
The Central Limit Theorem from statistical analysis states that the accuracy ofthe reference will be:
*• °"FINCH
Where: 2GFINCH = FINCH RTD accuracy«, = the number of reference FINCH RTD's used within
the ith quadrant.
From this it can be seen that the accuracy improves with the number of FINCHRTD's used.
4.2 RTD's Located in Mixing Zone
The first phase of this program quantified the measurement uncertaintyassociated with the original design location, the R and S paired RTD's, (seeFigure 2). The original design placed dual RTD's less than 2 pipe diametersdown stream from the confluence (junction) of the pre-heater and by-pass flows.An error consisting of a systematic offset (bias) and a random component wasquantified and the ith quadrant measurement uncertainty (D;) for an RTD locatedin the mixing zone is given as:

WhereSi
:thn,
= the observed cross-calibration bias component= the observed cross-calibration random component= FINCH RTD accuracy= RTD measurement loop drift component= the number of reference FINCH RTD's used within
the i quadrant
Note, a positive uncertainty indicates that that the temperature measurement isbelow the actual temperature.
The 0.1 D* represents the non-observed mixing variations attributed to seasonalvariations of the pre-heater.
The above equation may also be expressed as
Errormax+ = (Bias + Random)Caiibration/Mixing + Reference Accuracy + RTD Drift
To date this method has been used for Bruce A unit 3 at 84% reactor power.The bias (d,-), random error standard deviation (Sj) and calculated uncertainty(Dj+) are shown in Table 2.
Table 2 Unit 3 Mixing Zone RTD Cross Calibration Results
bias (di)random (s,)
Uncertainty (D*)
NE2.6820.2823.934
SE1.9630.3393.218
SW2.2580.3453.555
NW1.9280.3233.128
4.3 RTD's Located in Actual Inlet Header
Spare thermowelis exist near the ends and center of each of the four inletheaders. The thermowells at the ends of the header are at least 5 pipediameters away from the confluence of the pre-heater and by-pass flows. Thesethermowells provide suitable and viable alternate locations that can be used tominimize the measurement uncertainty. The centrally located RTD's are tooclose to the flow 'dead zone' between the north south header flows to accuratelybe cross-calibrated.
The uncertainty equation can be simplified for the RTD measurements located inthe header itself. The 0.1 Dj component represented the long term randomness inthe mixing zone caused by Preheater load variations. But, since these RTD's aremore than 2 header diameters from the mixing area the 0.1 Dj is not applicable.
Cross-calibration is used to determine both the systematic bias and short termrandom components of the instrument error observable during the cross-

calibration period. Long-term variations of the instrument error are accounted forby the RTD drift term (2aR|H-d)-
The reference accuracy remains the 2oFiNCH/̂ ni term. Where n, is the number ofFINCH RTD's used within the ith quadrant for the cross-calibration. And, 2CJFINCH
was previously evaluated to be ±1.46°C.
The measurement uncertainty equation for a single element RTD located in theReactor Inlet Header will be:
Note, the 2aRiH-d is not divided by V2, as only one RTD signal is used in eachquadrant, as opposed to the average of the R, S RTD signal.
To date this method has been used for Bruce A unit 3 at 84% reactor power.The bias (di), random error standard deviation (Si) and calculated uncertainty(Dj+) are shown in Table 3.
Table 3 Unit 3 Relocated RTD Cross Calibration Results
bias (d,)random (Si)
Uncertainty (D*)
NE-0.0010.481.56
SE-0.0001
0.41.55
sw0.1170.391.66
NWN/AN/AN/A
As expected the relocated RTD's have little bias indicating that mixing of thepreheater outlet and preheater bypass flow streams is complete.
4.4 Limitation of Cross Calibration
This method of cross calibrating the RIH RTD's provides a method of reducingthe measurement uncertainty. Its application however, is limited by thefollowing factors:
• the calibration is expensive and time consuming to perform and mustbe performed for each RTD,
• the calibration is of the instrumentation loop; and if any componentchanges the calibration will need to be repeated,
• the calibration is limited by accuracy of the reference RTD's,• it requires modification of DCC code to adjust alarm limits based on
quadrant specific measurement uncertainty and• in the case of the mixing zone RTD's, the error is also load dependent.

5. ALTERNATIVE DESIGNS
In the previous sections we have discussed the existing Reactor Inlet Headerdesign, and how and where the RIH temperature is measured. We alsodetermined the RIH temperature loop accuracy in detail. By using a crosscalibration technique we measured the quadrant specific measurementuncertainty. It is apparent that cross calibration can be used to reduce themeasurement uncertainty. It was also useful in quantifying the magnitude ofprocess stratification induced error occurring in the present Inner Zone RIHtemperature measurement location. Unfortunately, the limitations associatedwith cross calibration do not make it the most desirable long-term solution toimproving RIH temperature measurement.
Any long-term efforts to reduce the RIH temperature uncertainty must:• eliminate the effects of the process stratification associated with the
mixing zone,• provide redundancy, as this measurement has become a critical
parameter,• provide component interchangability,• be easily installed and maintainable and• have minimal impact upon the DCC's.
The optimal solution for reducing the measurement uncertainty is to eliminatethe largest errors and make use of different transmitter manufactures on eachleg of the dual element RTD to provide diversity of equipment and lower thesoftware quality assurance requirements. The best overall solution included thefollowing:
• Relocate the Inner Zone RIH temperature measurement away from themixing zone and into spare thermowells in the header itself, toeliminate the process stratification effects.
• Use new, calibrated 4-wire dual element RTD's in place of OHstandard interchangeable RTD's.
• Use high quality commercially available smart temperaturetransmitters to convert the RTD signal rather than the WheatstoneBridge cards. The transmitters must be complete with a zero and spanadjustment and leadwire compensation.
It is expected that the above solution will provide a measurement loop accuracyof±0.72°C.

6. CONCLUSIONS
The Reactor Inner Zone Inlet Header (RIZIH) temperature measurement is acritical parameter for both the safe and economic operation of the Bruce A NGSunits. The RIZIH temperature has been increasing over time and is one ofseveral parameters preventing the units returning to 94% power.
At present, a large RIZIH temperature measurement uncertainty margin isprovided between the true RIZIH limit and the applied limit. A reduction of thisuncertainty would allow the units to operate closer to the true limit, with noreduction in safety.
The RIZIH temperature uncertainty was determined by a detailed analysis andcross-calibration. By detailed analysis the uncertainty was determined to be+0.823+1.88°C, not including a process flow stratification error of 1-3°C which isboth quadrant and zone specific. Cross-calibration measured the quadrantspecific error and determined that the uncertainties ranged from 3.22°C to3.93°C at 84% reactor power, including the process flow stratification error.Limitations of the cross-calibration method will be expensive to maintain in thelong term.
A more acceptable solution to reduce the RIH measurement uncertainty is aproposal based on commercially available smart transmitter technology, and theuse of dual element 4-wire RTD's installed in spare thermowells located jn theRIH and away from any incomplete mixing zones. This solution would reducethe measurement uncertainty to ±0.72°C, and not be constrained by thelimitations of cross-calibration.
Acknowledgment
Assistance in data gathering for compilation of this report is attributed to J.Bateson, R. Grandoni and D. Guernsey of Bruce A ESD.
References:
1 N. SION, 'In-Core Moderator Temperature Measurement within CANDUReactors', Nuclear Instruments & Methods in Physics Research, March 1,1983,Volume 206 No.9, North-Holland Publishing Company- Amsterdam.2 H. M. HASHEMIAN, D.D. BEVERLY, D.W. MITCHELL, KM. PETERSEN, 'Aging of Nuclear Plant Resistance Temperature Detectors', US NuclearRegulatory Commission, Report Number NUREG/CR-5560, June 1990.3 Rosemount Instruction Manual for 'Rosemount Model 401T Resistance Bridgeand Rosemount Model 422AJ Chassis', Drawing MM-BA-60439-1006-2.4 Rosemount Instruction Manual for 'Rosemount Model 401T Resistance Bridgeand Rosemount Model 422AJ Chassis'.

CNS Technical Program
WEDNESDAY, 1997 June 11
Session 5A System and Component Simulation andDesign
Chair: K. ScottAtlantic Nuclear Services Limited
Oak Room
14:00-14:25 An Improved Model to Predict Non Uniform Deformation ofZr-2.5 Nb PressureTubes
. by Q.M. Lei, H.Z. Fan (Atomic Energy of Canada Limited)
14:25-14:50 Tensile Properties of Irradiated Calandria Tubes at Low to High Rates ofStrainby R.W.L. Fong, C.E. Coleman, R. Shewfelt (Atomic Energy of Canada Limited), PJ. Ellis(Ontario Hydro), Y. Tsuchimoto (Electric Power Development Co. Ltd. (Japan)), S. Yoshie(Kawasaki Heavy Industries Ltd. (Japan)), Y. Morishita (Power Reactor & Nuclear FuelDevelopment Corporation (Japan)), and E.V. Pizzinato, C. Albertini (JRC Safety TechnologyInstitute (Italy))
14:50-15:15 Improving the Calandria Tubes for CANDU Reactorsby C.E. Coleman, R.W.L. Fong, G.L. Doubt, D.B. Sanderson (Atomic Energy ofCanada Limited)
15:15-15:40 Qualification of Alternate Suppliers for Zr-2.5Nb Material for CANDU PressureTubesby J.R. Theaker, C.E. Coleman, B.A. Cheadle, E.G. Price, D. Moan (Atomic Energy ofCanada Limited)