power system stability in the new industry environment:...
TRANSCRIPT
1529pk - 1
Power System Stability in the New Industry Power System Stability in the New Industry
Environment: Environment: Challenges and SolutionsChallenges and Solutions
presented by: presented by:
Dr. Prabha S. KundurDr. Prabha S. Kundur
Kundur Power Systems Solutions, Inc.Kundur Power Systems Solutions, Inc.
Toronto, OntarioToronto, Ontario
CanadaCanada
Tutorial
Copyright © P. KundurThis material should not be used without the author's consent
1529pk - 2Copyright © P. Kundur
Power System Stability and ControlPower System Stability and Control
Tutorial Outline
1. Brief Introduction to Power System Stability
� Basic concepts
� Classification
2. Examples of Major System Blackouts Caused by Different Forms
of Instability
3. Challenges to Secure Operation of today's Power Systems
4. Major System Blackouts in 2003 and 2004
5. Comprehensive Approach to Enhancing Power System Stability
1529pk - 3Copyright © P. Kundur
Power System StabilityPower System Stability
� Refers to continuance of intact operation of power system,
following a disturbance
� Recognized as an important problem for secure system operation
since the 1920s
� Major concern since the infamous November 9, 1965 blackout of
Northeast US and Ontario
� criteria and analytical tools used till now largely based on the
developments that followed
� Presents many new challenges for today's power systems

1529pk - 4Copyright © P. Kundur
Power System Stability: Basic ConceptsPower System Stability: Basic Concepts
� Power System Stability denotes the ability of an electric power
system, for a given initial operating condition, to regain a state of
operating equilibrium after being subjected to a physical
disturbance, with all system variables bounded so that the system
integrity is preserved
� integrity of the system is preserved when practically the entire power
system remains intact with no undue tripping of generators or loads
� Stability is a condition of equilibrium between opposing forces:
� instability results when a disturbance leads to a sustained imbalance
between the opposing forces
Ref: IEEE/CIGRE TF Report, "Definition and Classification of Power System Stability",
IEEE Trans. on Power Systems, Vol. 19, pp. 1387-1401, August 2004

1529pk - 5Copyright © P. Kundur
Basic Concepts Basic Concepts (cont'd)(cont'd)
� Following a transient disturbance, if the power system is stable it will reach a
new equilibrium state with practically the entire system intact:
� faulted element and any connected load are disconnected
� actions of automatic controls and possibly operator action will eventually
restore system to normal state
� On the other hand, if the system is unstable, it will result in a run-away or
run-down situation; for example:
� a progressive increase in angular separation of generator rotors, or
� a progressive decrease in bus voltages
� An unstable system condition could lead to cascading outages, and a shut-
down of a major portion of the power system
1529pk - 6Copyright © P. Kundur
Classification of Power System StabilityClassification of Power System Stability
� Classification into various categories greatly facilitates:
� analysis of stability problems
� identification of essential factors which contribute to instability
� devising methods of improving stable operation
� Classification is based on the following considerations:
� physical nature of the resulting instability
� size of the disturbance considered
� devices, processes, and the time span involved
� We should always keep in mind the overall stability !
� solutions to problems of one category should not be at the
expense of another

1529pk - 7Copyright © P. Kundur
Power System Stability
Frequency Stability
Small-Signal Stability
Transient Stability
Short Term Long Term
Large-Disturbance Voltage Stability
Small-Disturbance Voltage Stability
Voltage Stability
Rotor Angle Stability
Consideration for
Classification
Physical Nature/ Main
System
Parameter
Size of Disturbance
Time Span
Short Term
Short Term Long Term
1529pk - 8Copyright © P. Kundur
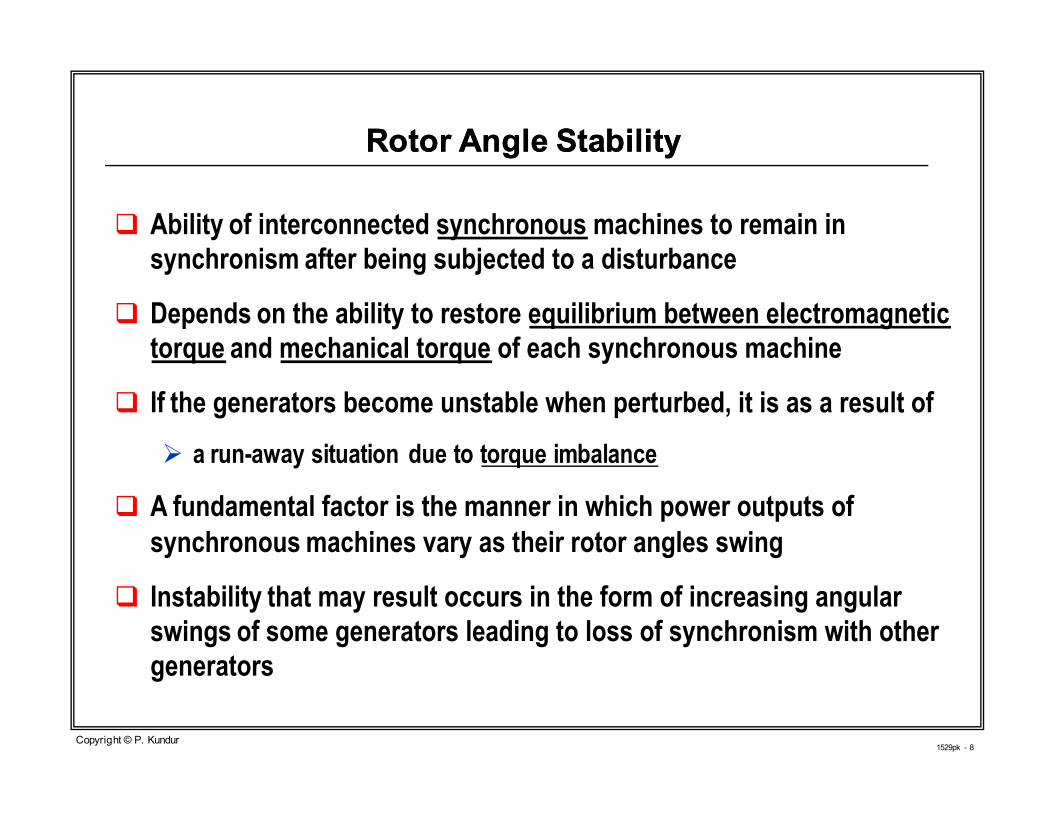
Rotor Angle StabilityRotor Angle Stability
� Ability of interconnected synchronous machines to remain in
synchronism after being subjected to a disturbance
� Depends on the ability to restore equilibrium between electromagnetic
torque and mechanical torque of each synchronous machine
� If the generators become unstable when perturbed, it is as a result of
� a run-away situation due to torque imbalance
� A fundamental factor is the manner in which power outputs of
synchronous machines vary as their rotor angles swing
� Instability that may result occurs in the form of increasing angular
swings of some generators leading to loss of synchronism with other
generators

1529pk - 9Copyright © P. Kundur
Transient StabilityTransient Stability
� Term traditionally used to denote large-disturbance angle stability
� Ability of a power system to maintain synchronism when
subjected to a severe transient disturbance:
� influenced by the nonlinear power-angle relationship
� stability depends on the initial operating condition and severity of
the disturbance
� A wide variety of disturbances can occur on the system:
� The system is, however, designed and operated so as to be stable
for a selected set of contingencies
� usually, transmission faults: L-G, L-L-G, three phase
1529pk - 10Copyright © P. Kundur
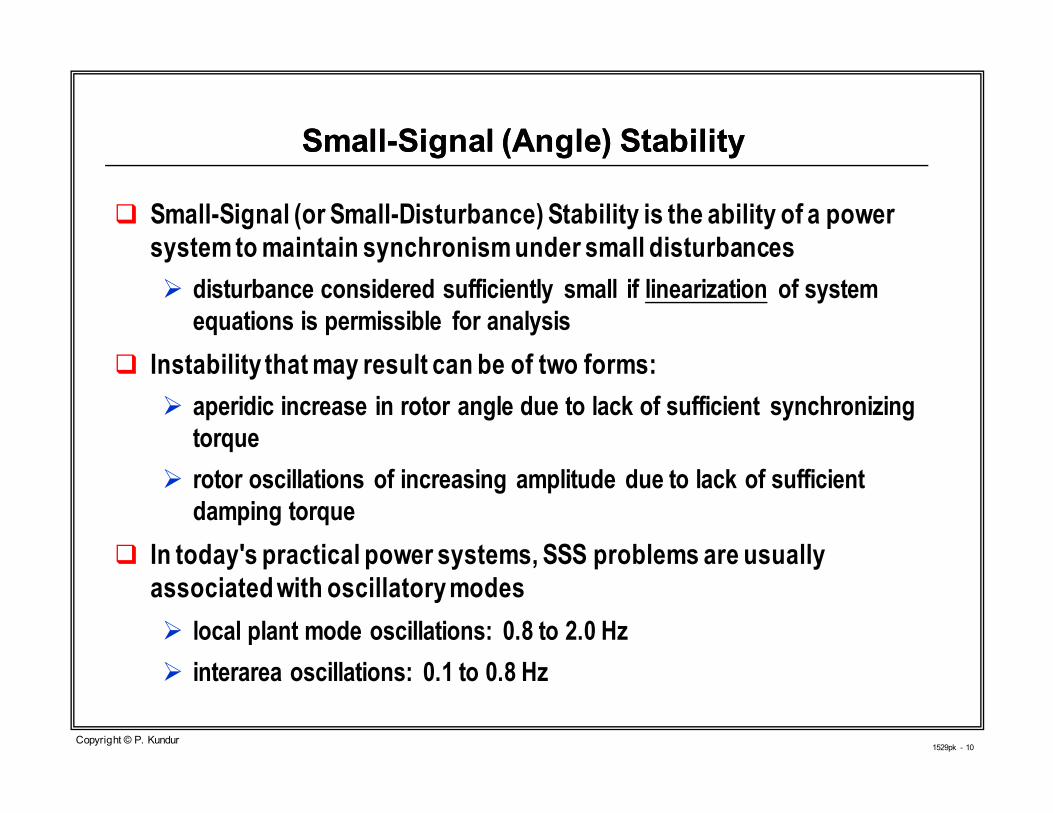
SmallSmall--Signal (Angle) StabilitySignal (Angle) Stability
� Small-Signal (or Small-Disturbance) Stability is the ability of a power
system to maintain synchronism under small disturbances
� disturbance considered sufficiently small if linearization of system
equations is permissible for analysis
� Instability that may result can be of two forms:
� aperidic increase in rotor angle due to lack of sufficient synchronizing
torque
� rotor oscillations of increasing amplitude due to lack of sufficient
damping torque
� In today's practical power systems, SSS problems are usually
associated with oscillatory modes
� local plant mode oscillations: 0.8 to 2.0 Hz
� interarea oscillations: 0.1 to 0.8 Hz

1529pk - 11Copyright © P. Kundur
Voltage StabilityVoltage Stability
� Ability of power system to maintain steady voltages at all buses in the
system after being subjected to a disturbance
� A system experiences voltage instability when a disturbance, increase in
load demand, or change in system condition causes:
� a progressive and uncontrollable fall or rise in voltage of buses
in a small area or a relatively large area
� Main factor causing voltage instability is the inability of power system to
maintain a proper balance of reactive power and voltage control actions
� The driving force for voltage instability is usually the load characteristics
1529pk - 12Copyright © P. Kundur
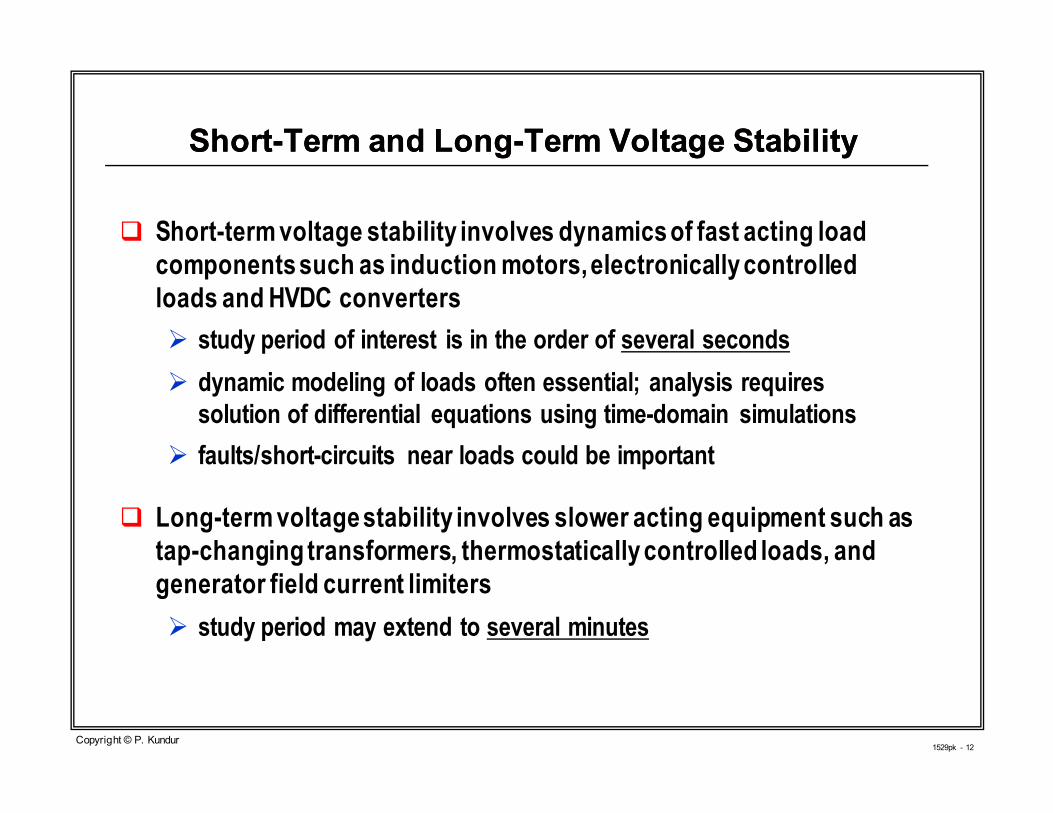
ShortShort--Term and LongTerm and Long--Term Voltage StabilityTerm Voltage Stability
� Short-term voltage stability involves dynamics of fast acting load
components such as induction motors, electronically controlled
loads and HVDC converters
� study period of interest is in the order of several seconds
� dynamic modeling of loads often essential; analysis requires
solution of differential equations using time-domain simulations
� faults/short-circuits near loads could be important
� Long-term voltage stability involves slower acting equipment such as
tap-changing transformers, thermostatically controlled loads, and
generator field current limiters
� study period may extend to several minutes
1529pk - 13Copyright © P. Kundur
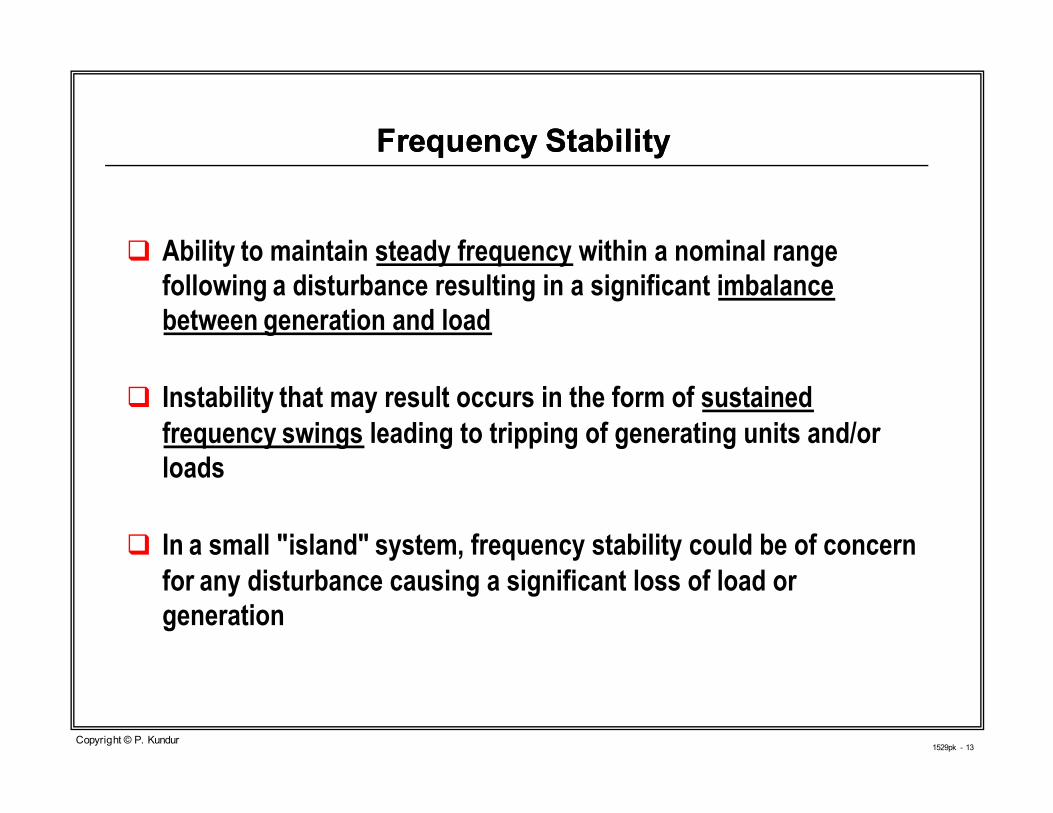
Frequency StabilityFrequency Stability
� Ability to maintain steady frequency within a nominal range
following a disturbance resulting in a significant imbalance
between generation and load
� Instability that may result occurs in the form of sustained
frequency swings leading to tripping of generating units and/or
loads
� In a small "island" system, frequency stability could be of concern
for any disturbance causing a significant loss of load or
generation
1529pk - 14Copyright © P. Kundur
Frequency Stability Frequency Stability (cont'd)(cont'd)
� In a large interconnected system, frequency stability could be of
concern only following a severe system upset resulting in the
system splitting into islands
� Depends on the ability to restore balance between generation and
load of island systems with minimum loss of load and generation
� Generally, frequency stability problems are associated with
inadequacies in equipment responses, poor coordination of
control and protection systems
1529pk - 15Copyright © P. Kundur
Examples of Major System Blackouts Caused by Examples of Major System Blackouts Caused by
Different Forms of InstabilityDifferent Forms of Instability
1. November 9, 1965 blackout of Northeast U.S. and Ontario
2. April 19, 1972, blackout of Eastern Ontario
3. July 2, 1996 disturbance of WSCC (Western North
American Interconnected) System
4. August 10, 1996 disturbance of WSCC system
5. March 11, 1999 Brazil blackout

1529pk - 16
November 9, 1965 Blackout of November 9, 1965 Blackout of
Northeast U.S. and OntarioNortheast U.S. and Ontario
Copyright © P. Kundur
1529pk - 17Copyright © P. Kundur
November 9, 1965 Blackout of NE U.S. and OntarioNovember 9, 1965 Blackout of NE U.S. and Ontario
� Clear day with mild weather; load levels in the region normal
� Problem began at 5:16 p.m.
� Within a few minutes, there was a complete shut down of electric
service to:
� virtually all of the states of New York, Connecticut, Rhode Island,
Massachusetts, Vermont
� parts of New Hampshire, New Jersey and Pennsylvania
� most of Ontario
� Nearly 30 million people were without power for about 13 hours

1529pk - 18Copyright © P. Kundur
North American Eastern Interconnected SystemNorth American Eastern Interconnected System
1529pk - 19Copyright © P. Kundur
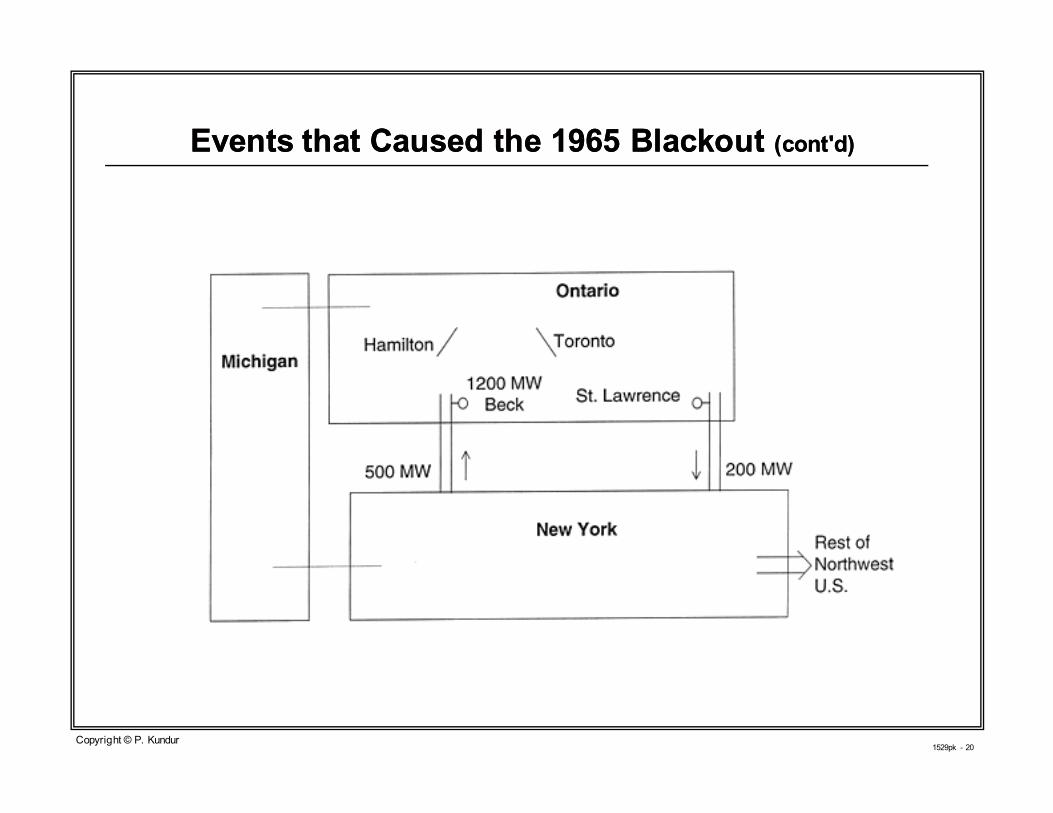
Events that Caused the 1965 BlackoutEvents that Caused the 1965 Blackout
� The initial event was the operation of a backup relay (zone 3)
at Beck GS in Ontario near Niagara Falls
� opened circuit Q29BD, one of five 230 kV circuits connecting
Beck GS to load centers in Toronto and Hamilton
� Prior to opening of Q29BD, the five circuits were carrying
� 1200 MW of Beck generation, and
� 500 MW import from Western NY State on Niagara ties
� Loading on Q29BD was 361 MW at 248 kV;
The relay setting corresponded to 375 MW
1529pk - 20Copyright © P. Kundur
Events that Caused the 1965 Blackout Events that Caused the 1965 Blackout (cont'd)(cont'd)
1529pk - 21Copyright © P. Kundur
Events that Caused the 1965 Blackout Events that Caused the 1965 Blackout (cont’d)(cont’d)
� Opening of circuit Q29BD resulted in sequential tripping of the
remaining four parallel circuits
� Power flow reversed to New York: total change of 1700 MW
� Generators in Western New York and Beck GS lost synchronism,
followed by cascading outages: Transient (Angle) Instability !
� After about 7 seconds from the initial disturbance
� system split into several separate islands
� Eventually most generation and load lost due to the inability of
islanded systems to stabilize: Frequency Instability !

1529pk - 22Copyright © P. Kundur
Formation of Reliability CouncilsFormation of Reliability Councils
� Northeast Power Coordinating Council (NPCC) formed in January 1966
� to improve coordination in planning and operation among utilities
� first Regional Reliability Council (RRC) in North America
� Other eight RRCs formed in the following months
� National/North American Electric Reliability Council (NERC)
established in 1968
� Detailed reliability criteria were developed;
Procedures for exchange of data and conducting stability studies were
established
� Many of these developments have had an influence on utility practices
worldwide; still largely used !

1529pk - 23Copyright © P. Kundur
Special Protections Implemented after the 1965 BlackoutSpecial Protections Implemented after the 1965 Blackout
� ∆∆∆∆P Relays on Niagara Ties
� trip Niagara ties to NY when ∆∆∆∆P exceeds set value;cross-trip St. Lawrence ties to NY
� in place until mid 1980s
� Underfrequency load shedding (UFLS) throughout the
interconnected system
� beginning of the use of UFLS by the industry

1529pk - 24
April 19, 1972 Blackout of April 19, 1972 Blackout of
Eastern OntarioEastern Ontario
Copyright © P. Kundur
1529pk - 25Copyright © P. Kundur
April 19, 1972 Disturbance: Eastern OntarioApril 19, 1972 Disturbance: Eastern Ontario
� Incident:
� 230 kV lines east of Toronto tripped due to communication malfunction;
ties to New York at St. Lawrence tripped
� generation rich island formed in eastern Ontario (G=3900 MW, L=3000 MW)
� frequency rose to 62.5 Hz and then dropped to 59.0 Hz due to speed
governor
� underfrequency load shedding !
� frequency rose to 62.6 Hz and dropped to 58.7 Hz
� stabilized at 60.8 Hz with 1875 MW generation
� Frequency Instability !
� Source of problem: overspeed controls associated with prime-mover
governors of Pickering “A:” NGS
1529pk - 26Copyright © P. Kundur
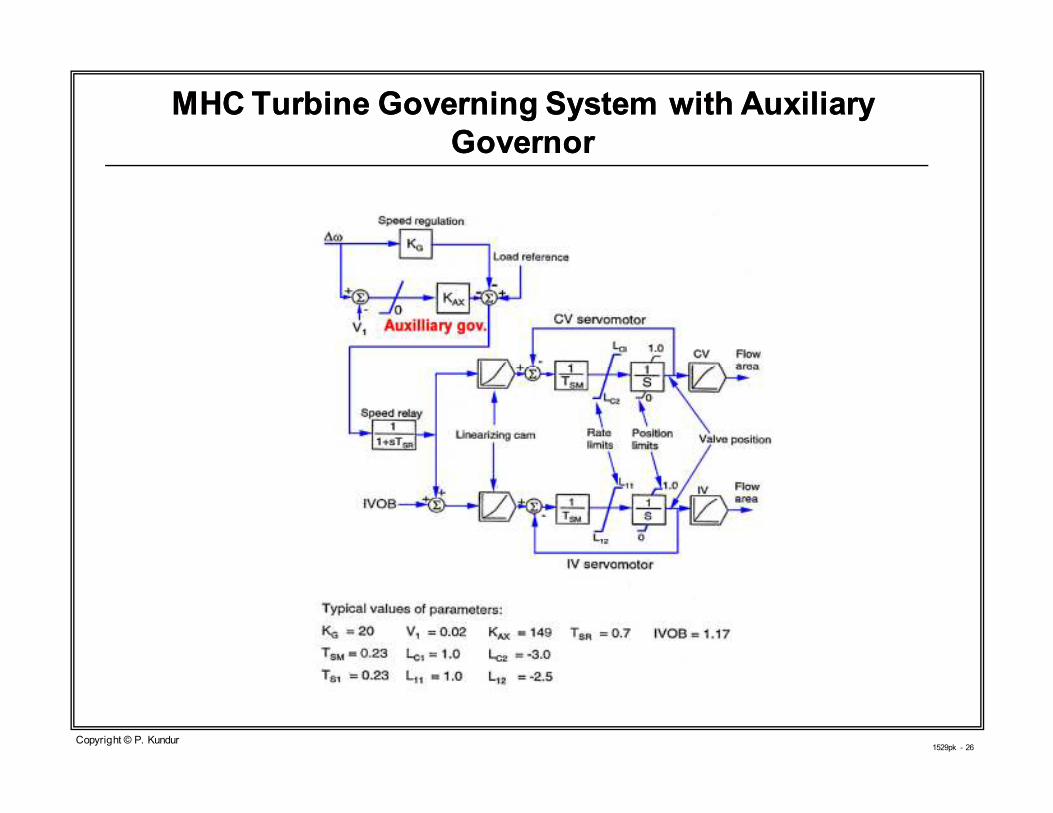
MHC Turbine Governing System with Auxiliary MHC Turbine Governing System with Auxiliary
GovernorGovernor

1529pk - 27Copyright © P. Kundur
Transient Response of Nuclear Units with Auxiliary Transient Response of Nuclear Units with Auxiliary
GovernorGovernor

1529pk - 28Copyright © P. Kundur
Transient Response of Nuclear Units with Auxiliary Transient Response of Nuclear Units with Auxiliary
Governor OutGovernor Out--ofof--ServiceService

1529pk - 29
July 2, 1996 WSCC / WECC July 2, 1996 WSCC / WECC
(Western North American (Western North American
Interconnected System) Interconnected System)
DisturbanceDisturbance
Copyright © P. Kundur

1529pk - 30Copyright © P. Kundur
WSCC July 2, 1996 DisturbanceWSCC July 2, 1996 Disturbance
� Started in Wyoming and Idaho area at 14:24:37
� Loads were high in Southern Idaho and Utah;
High temperature around 38°C
� Heavy power transfers from Pacific NW to California
� Pacific AC interties - 4300 MW (4800 rating)
� Pacific HVDC intertie - 2800 MW (3100 capacity)

1529pk - 31Copyright © P. Kundur
WSCC July 2, 1996 Disturbance WSCC July 2, 1996 Disturbance (cont'd)(cont'd)
1529pk - 32Copyright © P. Kundur
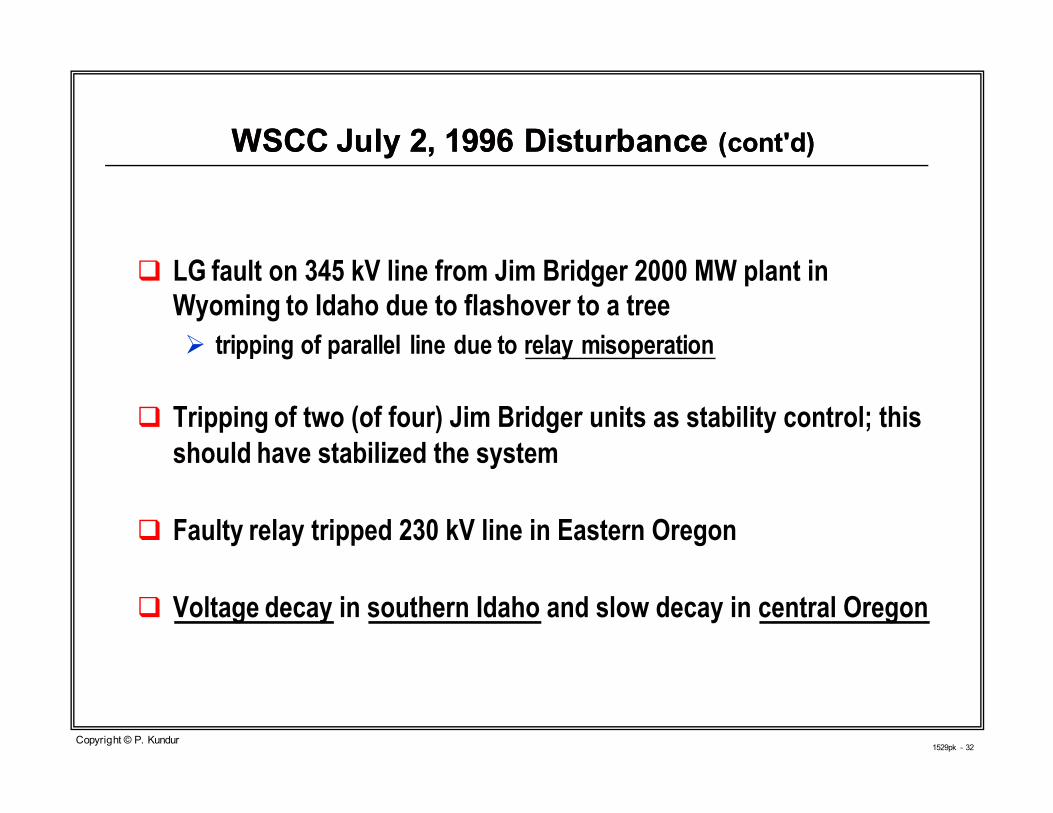
WSCC July 2, 1996 Disturbance WSCC July 2, 1996 Disturbance (cont'd)(cont'd)
� LG fault on 345 kV line from Jim Bridger 2000 MW plant in
Wyoming to Idaho due to flashover to a tree
� tripping of parallel line due to relay misoperation
� Tripping of two (of four) Jim Bridger units as stability control; this
should have stabilized the system
� Faulty relay tripped 230 kV line in Eastern Oregon
� Voltage decay in southern Idaho and slow decay in central Oregon

1529pk - 33Copyright © P. Kundur
WSCC July 2, 1996 Disturbance WSCC July 2, 1996 Disturbance (cont’d)(cont’d)
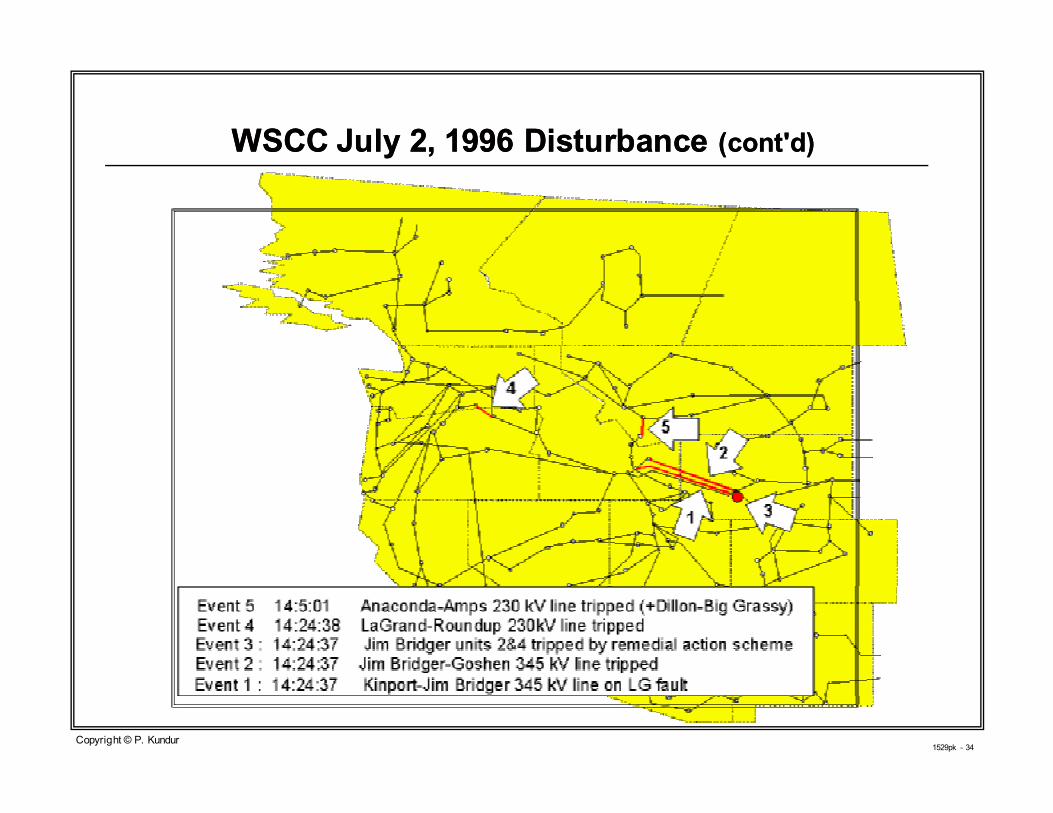
� About 24 seconds later, a long 230 kV line (Amps line) from western
Montana to Southern Idaho tripped, due to zone 3 relay operation
� parallel 161 kV line subsequently tripped
� Rapid voltage decay in Idaho and Oregon
� Three seconds later, four 230 kV lines from Hells Canyon generation to
Boise tripped
� Two seconds later, Pacific intertie lines separated
� Cascading to five islands 35 seconds after initial fault
� 2.2 million customers experienced outages; total load lost 11,900 MW
� Voltage Instability!!!
1529pk - 34Copyright © P. Kundur
WSCC July 2, 1996 Disturbance WSCC July 2, 1996 Disturbance (cont'd)(cont'd)

1529pk - 35Copyright © P. Kundur
WSCC July 2, 1996 Disturbance WSCC July 2, 1996 Disturbance (cont'd)(cont'd)
Loss of voltage control following
the tripping of the Amps line
Time in Seconds
1529pk - 36Copyright © P. Kundur
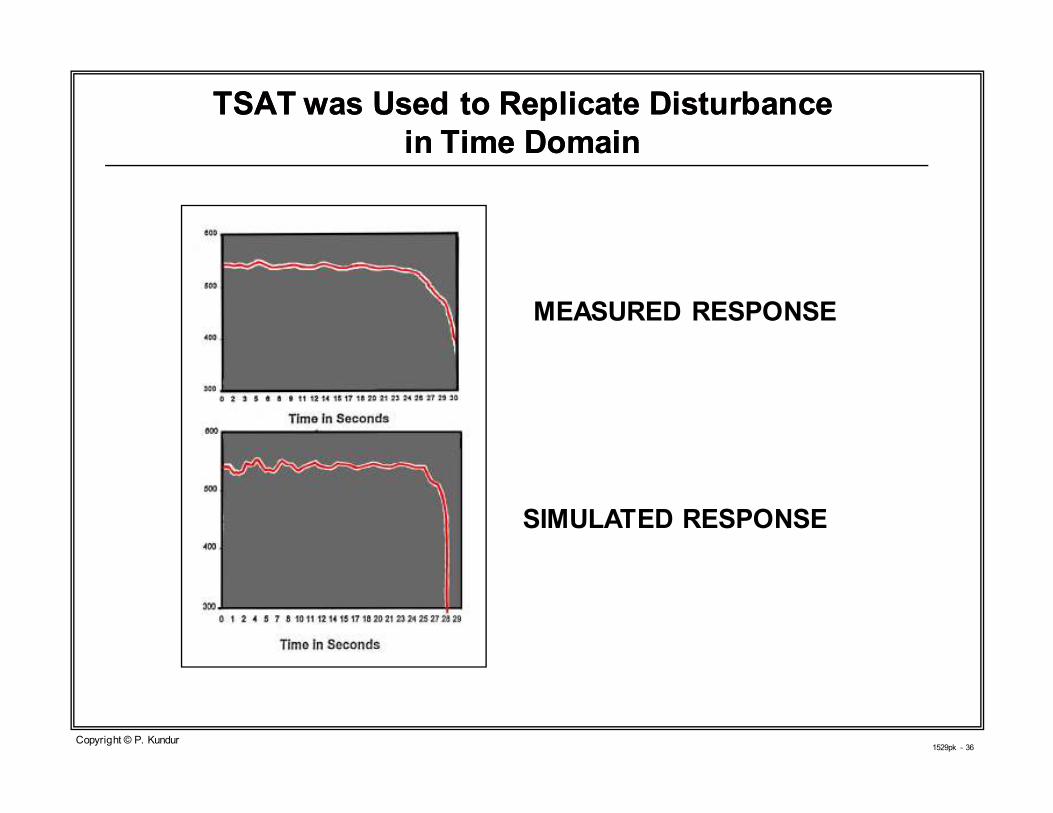
TSAT was Used to Replicate Disturbance TSAT was Used to Replicate Disturbance
in Time Domainin Time Domain
MEASURED RESPONSE
SIMULATED RESPONSE
1529pk - 37
August 10, 1996 WSCC August 10, 1996 WSCC
(WECC) Disturbance(WECC) Disturbance
Copyright © P. Kundur
1529pk - 38Copyright © P. Kundur
WSCC August 10, 1996 DisturbanceWSCC August 10, 1996 Disturbance
� High ambient temperatures in Northwest;
high power transfer from Canada to California
� Prior to main outage, three 500 kV line sections from lower Columbia
River to load centres in Oregon were out of service due to tree faults
� California-Oregon Interties loaded to 4330 MW north to south
� Pacific DC Intertie loaded at 2680 MW north to south
� 2300 MW flow from British Columbia
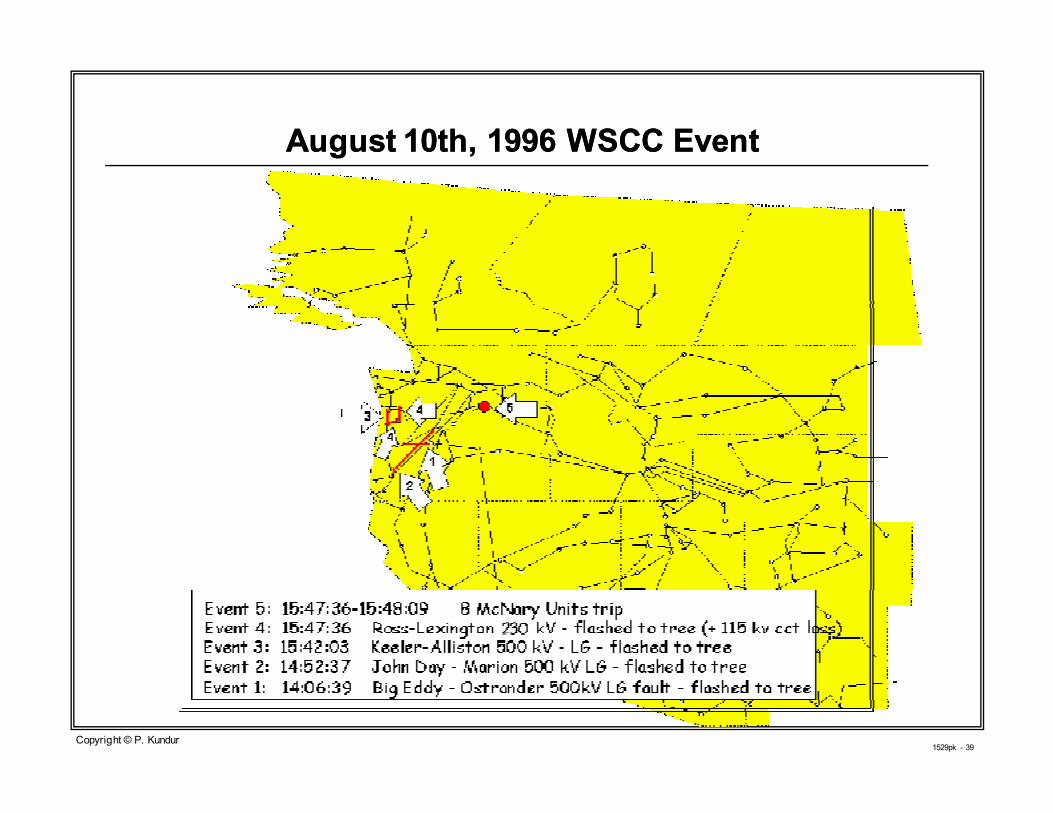
� Main outage: Ross-Lexington 230 kV line at 15:47:36
� Growing 0.23 Hz interarea oscillations caused tripping of lines
resulting in formation of four islands
� Small-Signal Oscillatory Instability !
1529pk - 39Copyright © P. Kundur
August 10th, 1996 WSCC EventAugust 10th, 1996 WSCC Event

1529pk - 40Copyright © P. Kundur
Malin - Round Mountain MW Flow
2300
2400
2500
2600
2700
2800
2900
3000
0 3 6 9 12 16 19 22 25 28 31 34 37 40 43 47 50 53 56 59 62 65 68 71 74
Time in Seconds
WSCC August 10, 1996 Disturbance WSCC August 10, 1996 Disturbance (cont'd)(cont'd)
1529pk - 41Copyright © P. Kundur
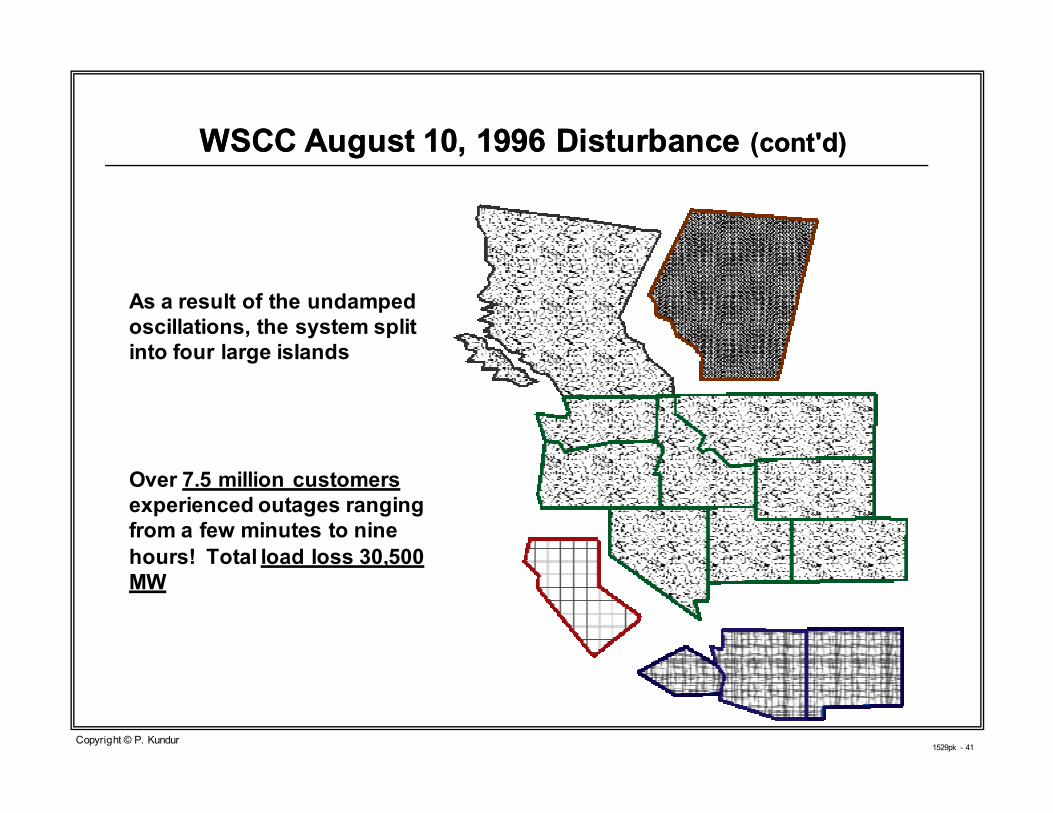
As a result of the undamped
oscillations, the system split
into four large islands
Over 7.5 million customers
experienced outages ranging
from a few minutes to nine
hours! Total load loss 30,500
MW
WSCC August 10, 1996 Disturbance WSCC August 10, 1996 Disturbance (cont'd)(cont'd)
1529pk - 42Copyright © P. Kundur
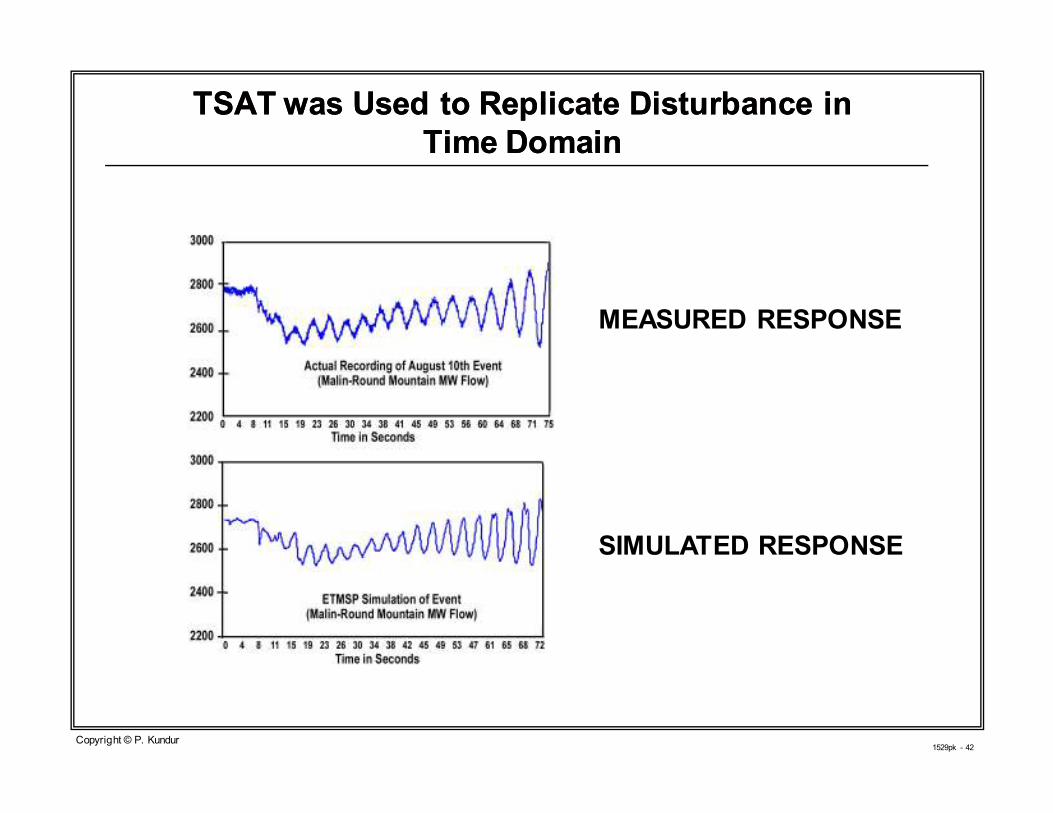
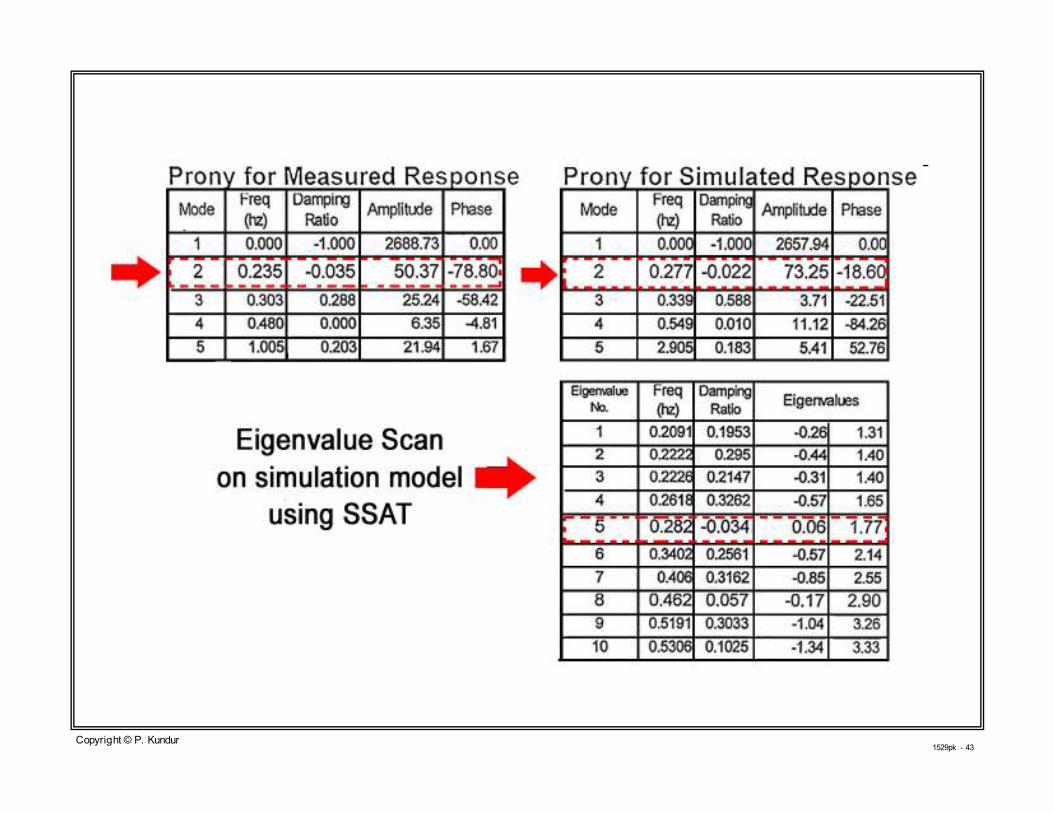
TSAT was Used to Replicate Disturbance in TSAT was Used to Replicate Disturbance in
Time DomainTime Domain
MEASURED RESPONSE
SIMULATED RESPONSE
1529pk - 43Copyright © P. Kundur

1529pk - 44Copyright © P. Kundur
Sites Selected for PSS ModificationsSites Selected for PSS Modifications
San Onofre
(Addition) Palo Verde
(Tune existing)
1529pk - 45Copyright © P. Kundur
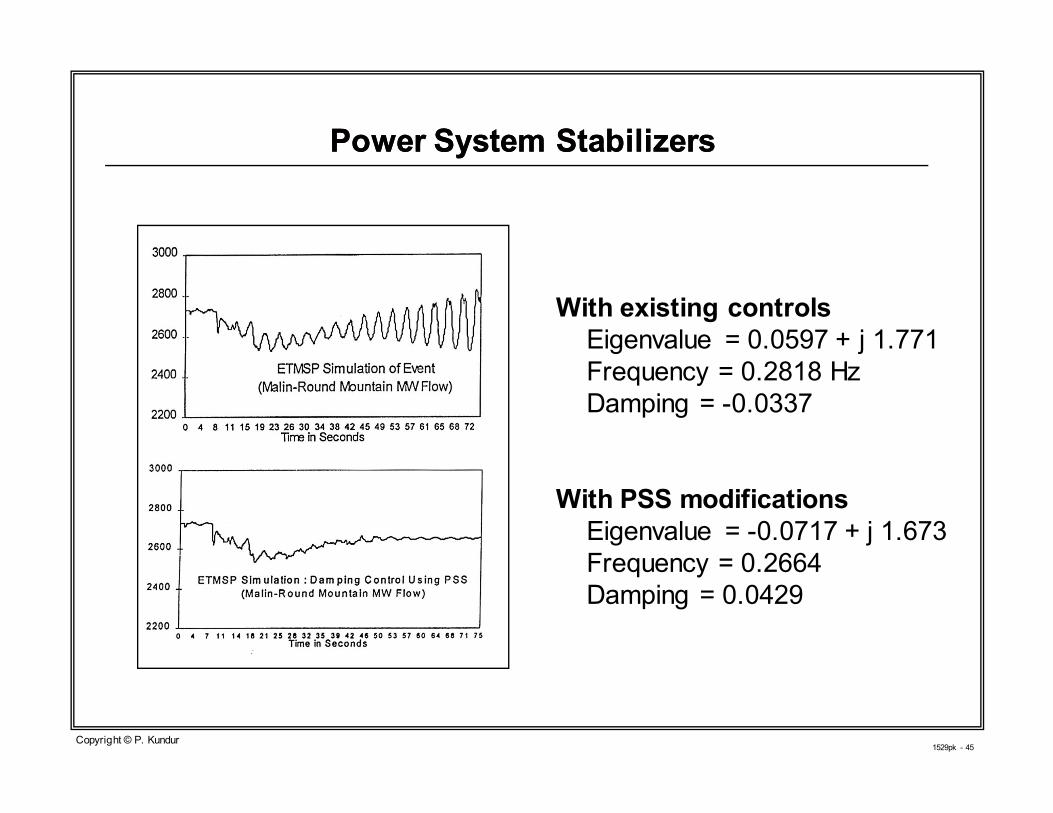
Power System StabilizersPower System Stabilizers
With existing controls
Eigenvalue = 0.0597 + j 1.771
Frequency = 0.2818 Hz
Damping = -0.0337
With PSS modifications
Eigenvalue = -0.0717 + j 1.673
Frequency = 0.2664
Damping = 0.0429
1529pk - 46Copyright © P. Kundur
Design of HVDC ModulationDesign of HVDC Modulation
� HVDC intertie shown (as expected) to have low participation in the
mode of interest (0.23 Hz interarea oscillations)
� Often however, HVDC can be modulated to improve damping, provided
adequate input signal is found and proper compensator is designed
� SSAT used to examine frequency response for several potential input
signals
� Frequency response magnitude identified local bus frequencyas
having good operability/controllability of the mode of interest
� Frequency response phase used to design compensator which
provides proper modulation signal to HVDC controls
� TSAT and SSAT used to verify modulation performance
1529pk - 47Copyright © P. Kundur
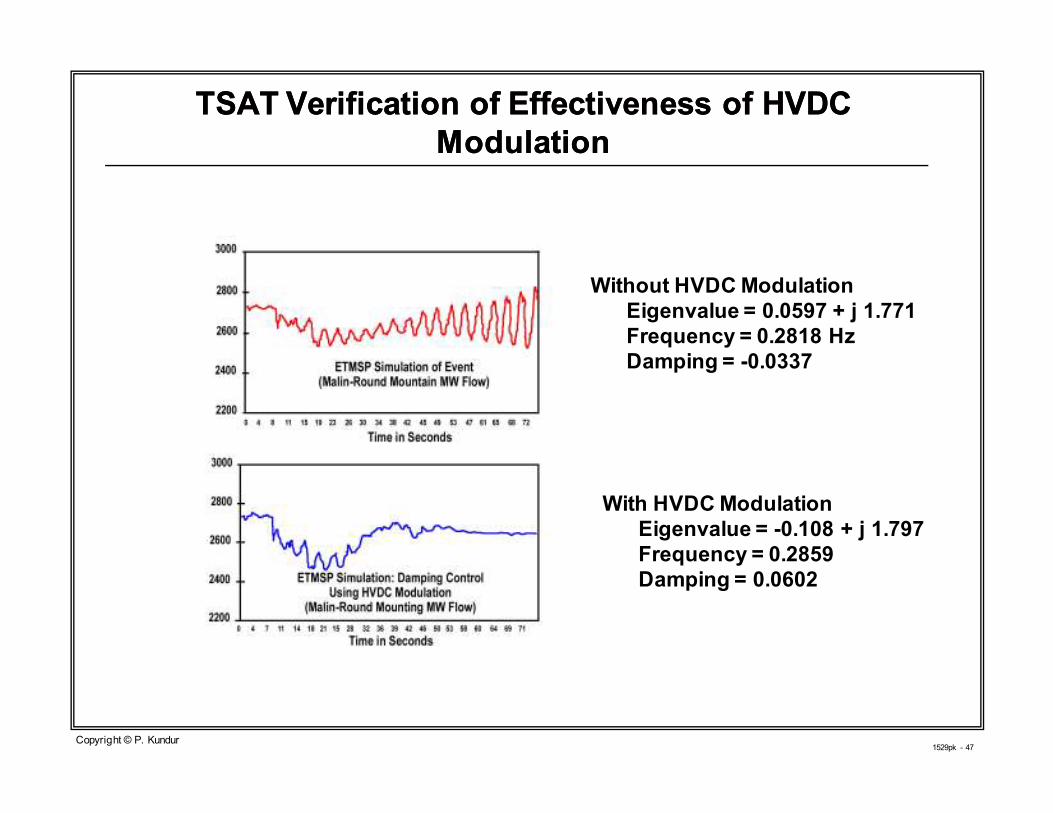
TSAT Verification of Effectiveness of HVDC TSAT Verification of Effectiveness of HVDC
ModulationModulation
Without HVDC Modulation
Eigenvalue = 0.0597 + j 1.771
Frequency = 0.2818 Hz
Damping = -0.0337
With HVDC Modulation
Eigenvalue = -0.108 + j 1.797
Frequency = 0.2859
Damping = 0.0602

1529pk - 48
March 11, 1999 Brazil March 11, 1999 Brazil
BlackoutBlackout
Copyright © P. Kundur

1529pk - 49Copyright © P. Kundur
March 11, 1999 Brazil BlackoutMarch 11, 1999 Brazil Blackout
� Time: 22:16:00h, System Load: 34,200 MW
� Description of the event:
� L-G fault at Bauru Substation as a result of lightning causing a bus
insulator flashover
� the bus arrangement at Bauru such that the fault is cleared by opening
five 440 kV lines
� the power system survived the initial event, but resulted in instability
when a short heavily loaded 440 kV line was tripped by zone 3 relay
� cascading outages of several power plants in Sao Paulo area, followed
by loss of HVDC and 750 kV AC links from Itaipu
� complete system break up: 24,700 MW load loss; several islands
remained in operation with a total load of about 10,000 MW
� Transient instability followed by voltage problems
1529pk - 50Copyright © P. Kundur
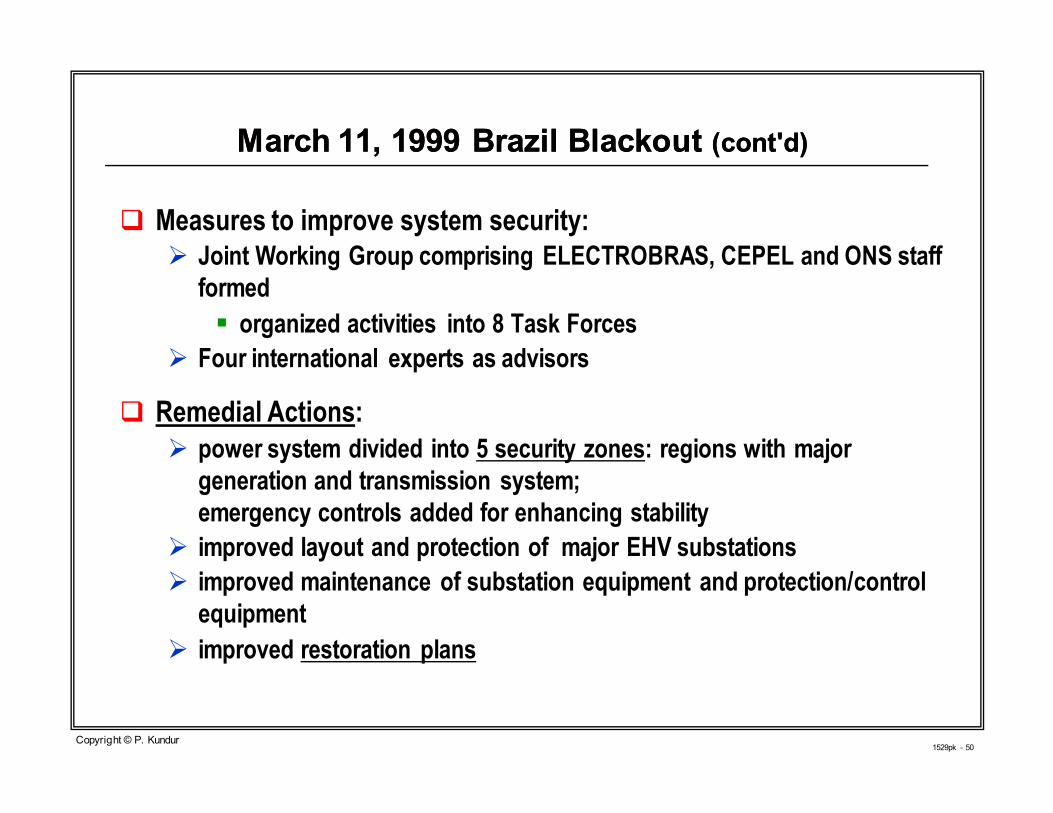
March 11, 1999 Brazil Blackout March 11, 1999 Brazil Blackout (cont'd)(cont'd)
� Measures to improve system security:
� Joint Working Group comprising ELECTROBRAS, CEPEL and ONS staff
formed
� organized activities into 8 Task Forces
� Four international experts as advisors
� Remedial Actions:
� power system divided into 5 security zones: regions with major
generation and transmission system;
emergency controls added for enhancing stability
� improved layout and protection of major EHV substations
� improved maintenance of substation equipment and protection/control
equipment
� improved restoration plans
1529pk - 51
Challenges to Secure Operation of Challenges to Secure Operation of
Today's Power SystemsToday's Power Systems
Copyright © P. Kundur
1529pk - 52Copyright © P. Kundur
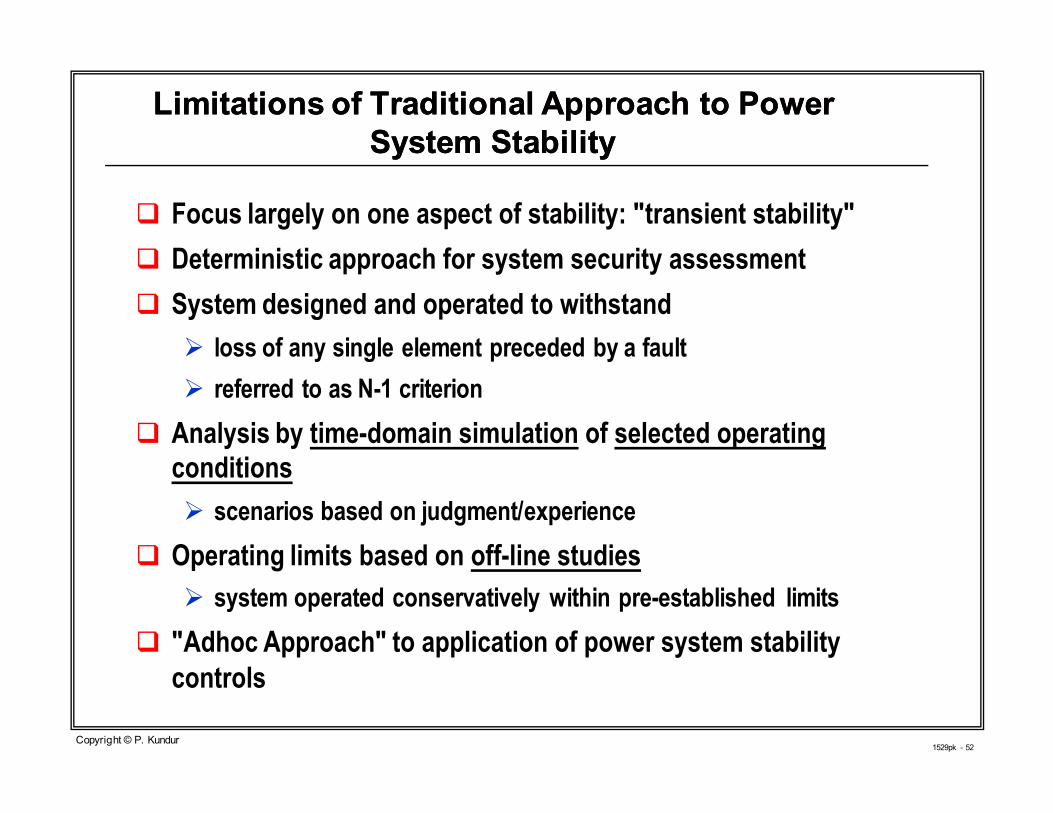
Limitations of Traditional Approach to Power Limitations of Traditional Approach to Power
System StabilitySystem Stability
� Focus largely on one aspect of stability: "transient stability"
� Deterministic approach for system security assessment
� System designed and operated to withstand
� loss of any single element preceded by a fault
� referred to as N-1 criterion
� Analysis by time-domain simulation of selected operating
conditions
� scenarios based on judgment/experience
� Operating limits based on off-line studies
� system operated conservatively within pre-established limits
� "Adhoc Approach" to application of power system stability
controls
1529pk - 53Copyright © P. Kundur
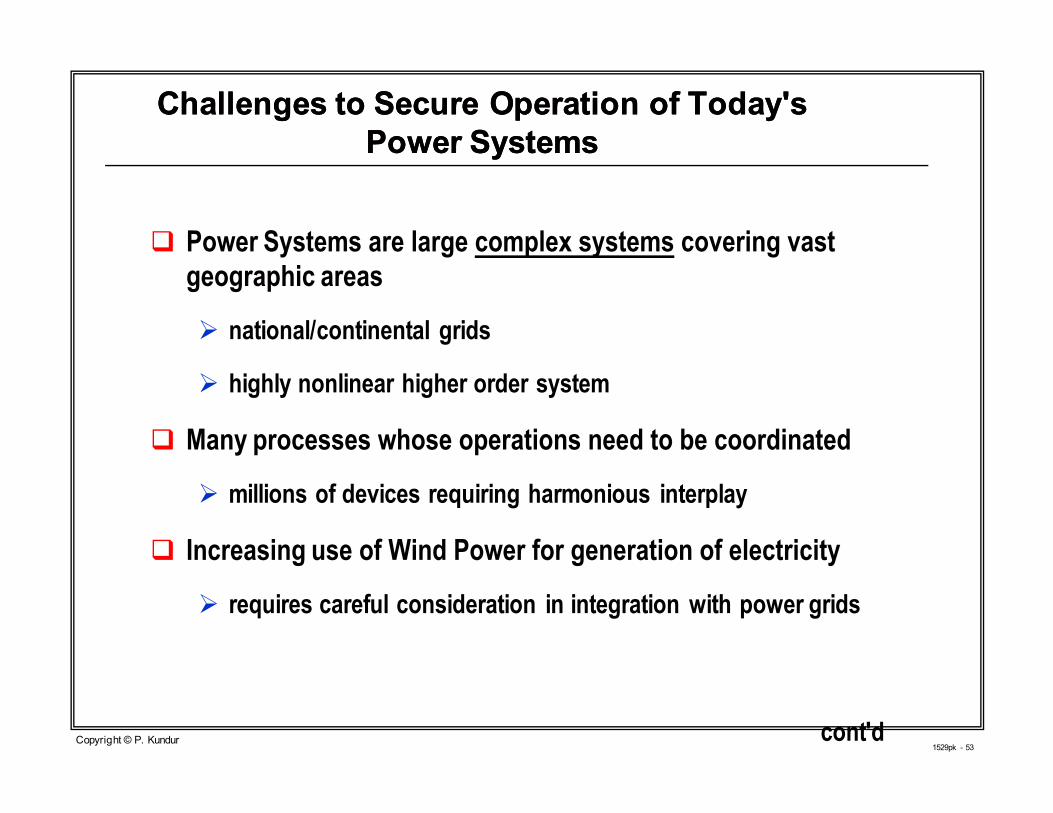
Challenges to Secure Operation of Today's Challenges to Secure Operation of Today's
Power SystemsPower Systems
� Power Systems are large complex systems covering vast
geographic areas
� national/continental grids
� highly nonlinear higher order system
� Many processes whose operations need to be coordinated
� millions of devices requiring harmonious interplay
� Increasing use of Wind Power for generation of electricity
� requires careful consideration in integration with power grids
cont'd
1529pk - 54Copyright © P. Kundur
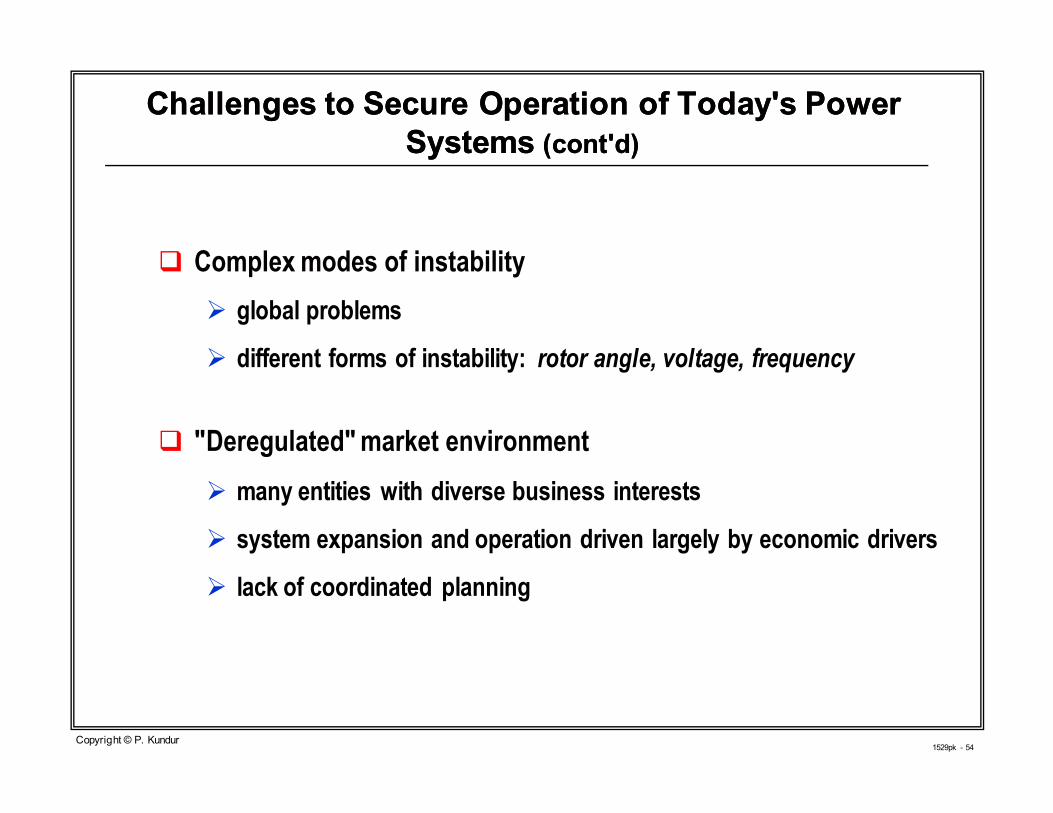
Challenges to Secure Operation of Today's Power Challenges to Secure Operation of Today's Power
SystemsSystems (cont'd)(cont'd)
� Complex modes of instability
� global problems
� different forms of instability: rotor angle, voltage, frequency
� "Deregulated" market environment
� many entities with diverse business interests
� system expansion and operation driven largely by economic drivers
� lack of coordinated planning

1529pk - 55Copyright © P. Kundur
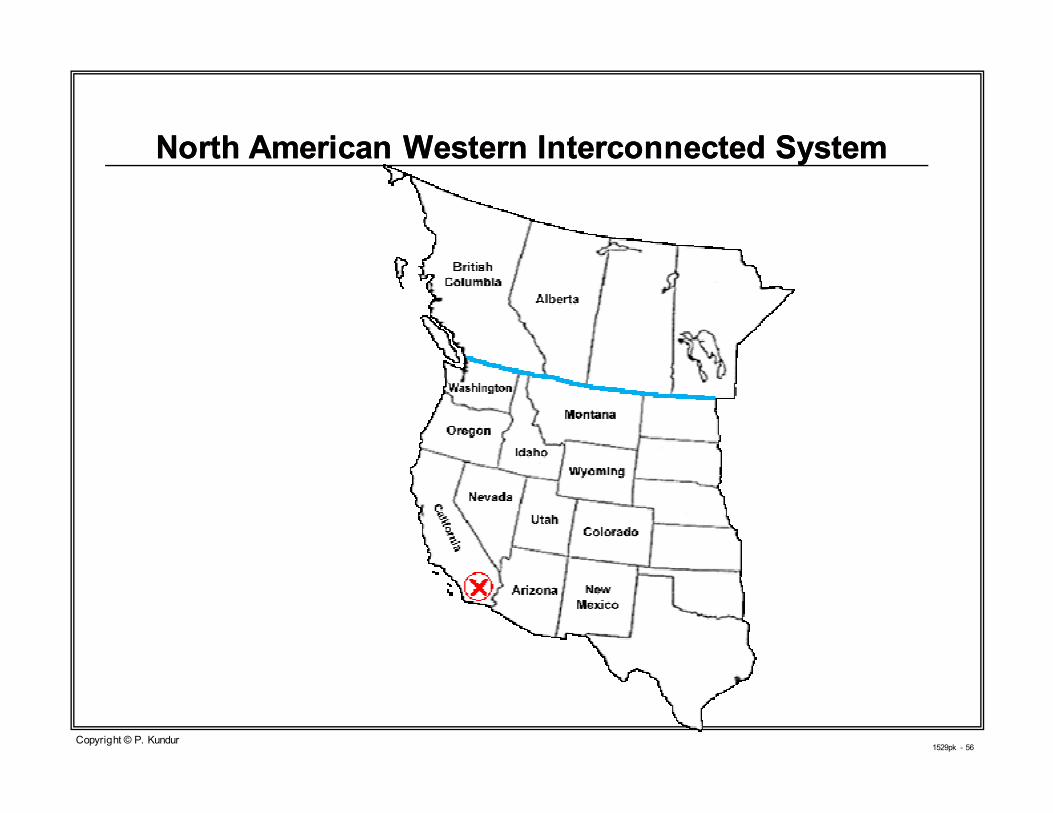
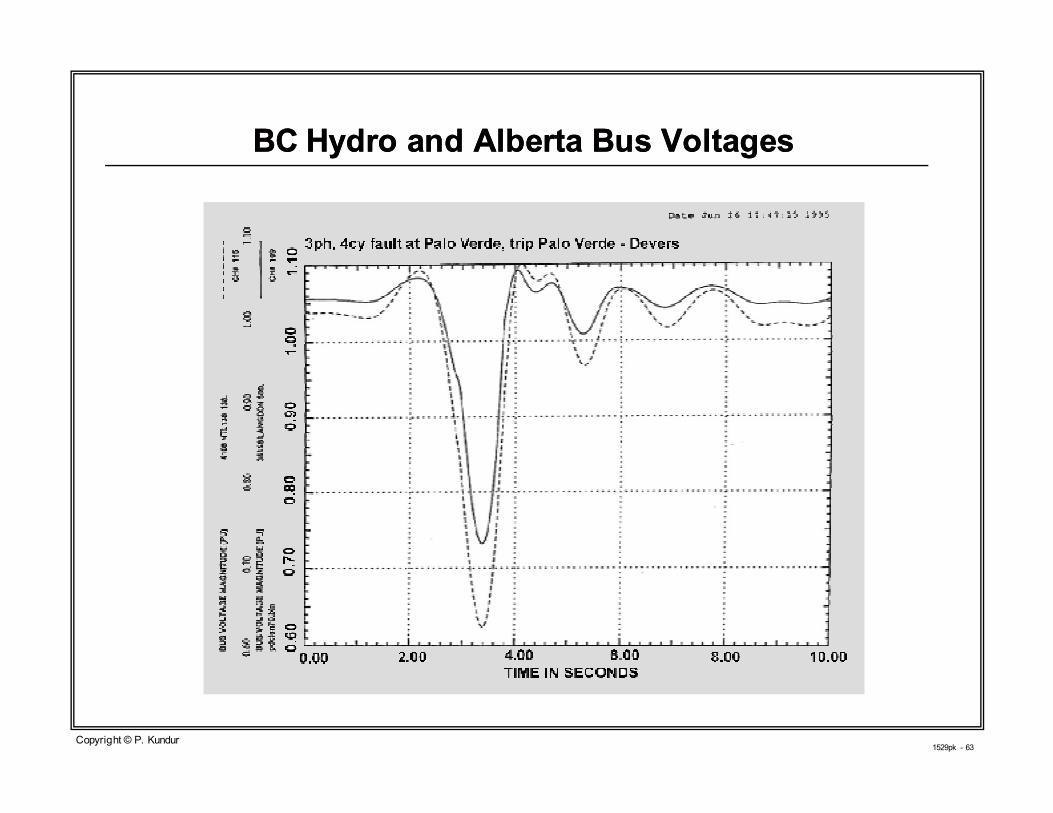
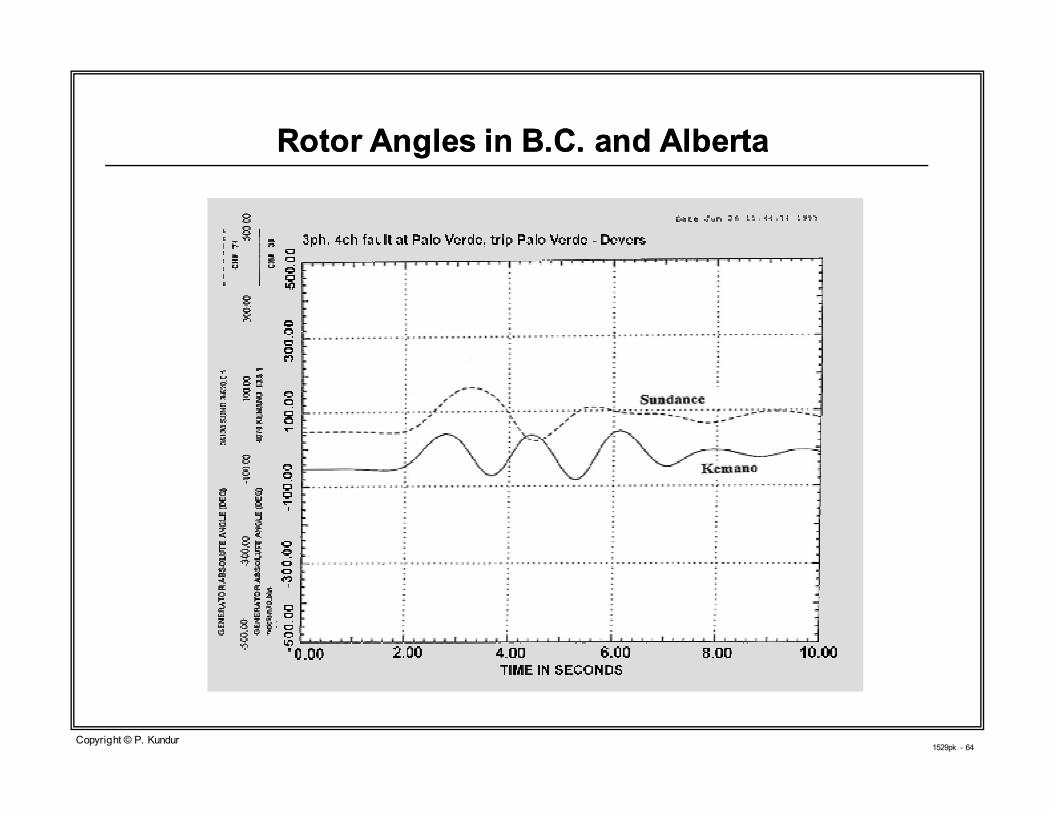
Example of a Complex Mode of InstabilityExample of a Complex Mode of Instability
A transmission line fault causes transient instability of a
remote area:
� Sensitive to conditions in the faulted area
� Nature of the stability problem is not readily apparent
1529pk - 56Copyright © P. Kundur
North American Western Interconnected SystemNorth American Western Interconnected System

1529pk - 57Copyright © P. Kundur
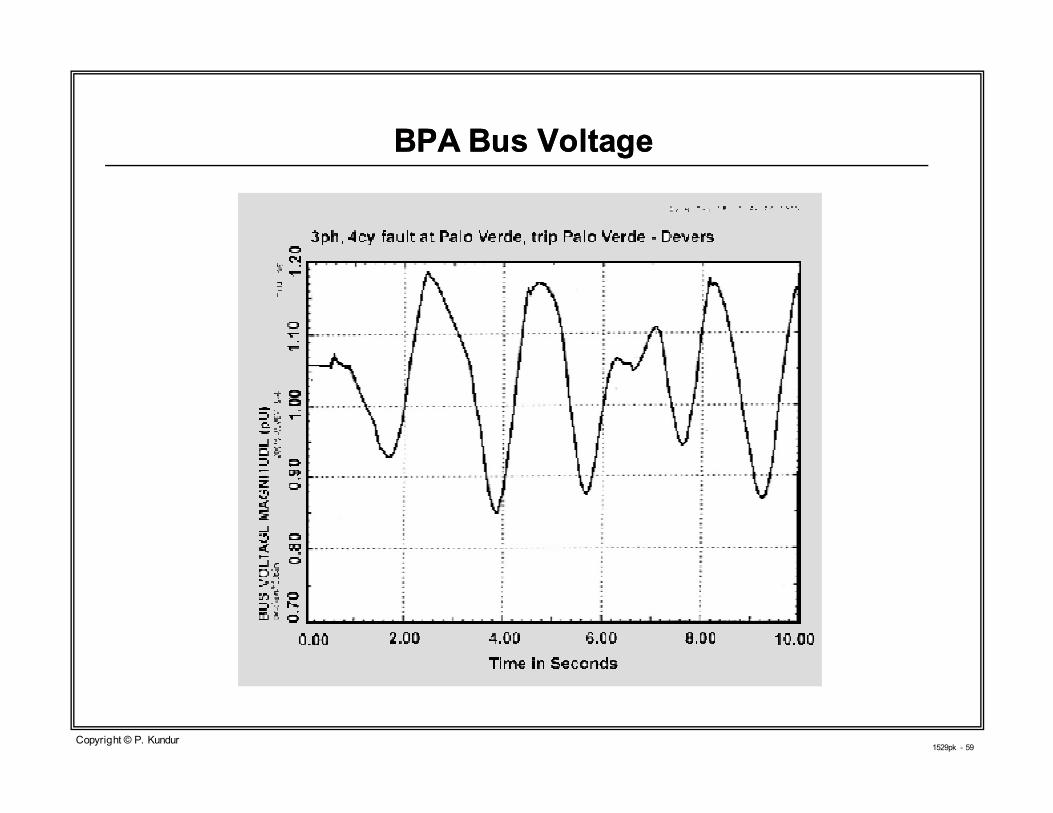
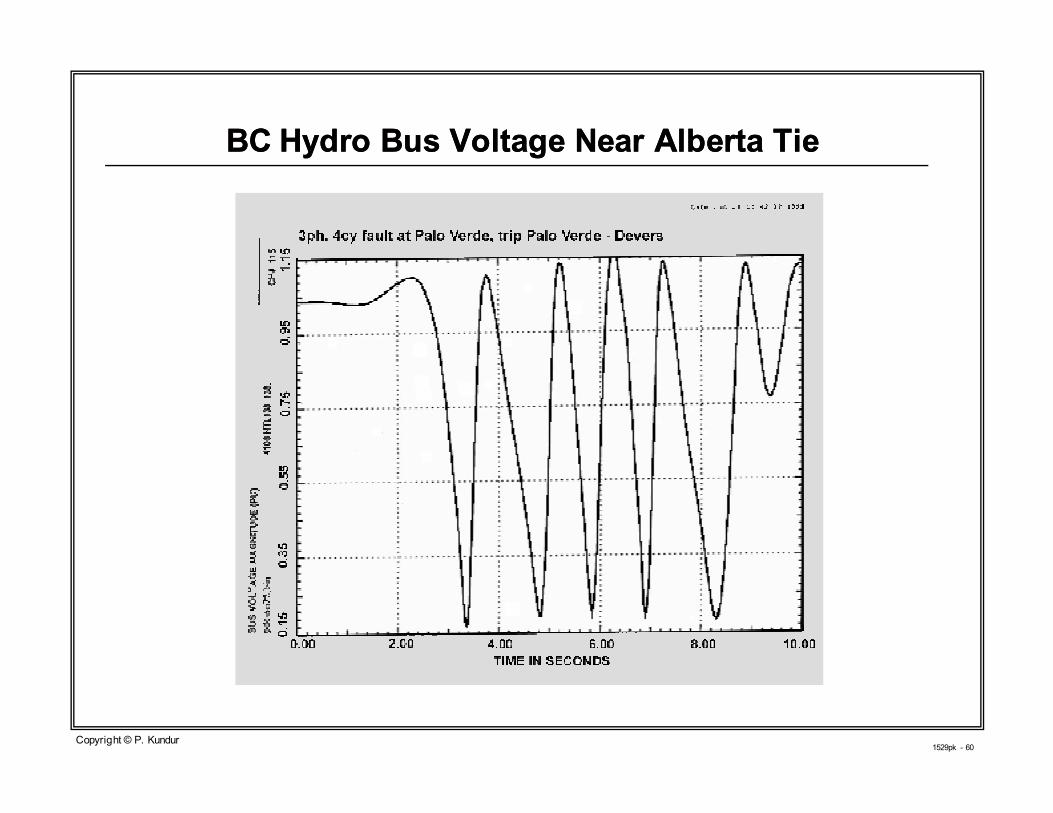
Case ACase A
� 4-cycle fault on Palo Verde - Devers line (Arizona-California)
� Alberta to B.C. transfer 500 MW
� East of River interface flow 7300 MW
Note: power flow conditions considered for this study as unusual,
and do not represent present operating conditions

1529pk - 58Copyright © P. Kundur
1529pk - 59Copyright © P. Kundur
BPA Bus VoltageBPA Bus Voltage
1529pk - 60Copyright © P. Kundur
BC Hydro Bus Voltage Near Alberta TieBC Hydro Bus Voltage Near Alberta Tie

1529pk - 61Copyright © P. Kundur
Rotor Angles in B.C. and AlbertaRotor Angles in B.C. and Alberta

1529pk - 62Copyright © P. Kundur
Case BCase B
� East of River interface flow reduced to 7000 MW
(from 7300 MW for Case A)
1529pk - 63Copyright © P. Kundur
BC Hydro and Alberta Bus VoltagesBC Hydro and Alberta Bus Voltages
1529pk - 64Copyright © P. Kundur
Rotor Angles in B.C. and AlbertaRotor Angles in B.C. and Alberta

1529pk - 65Copyright © P. Kundur
North American Western Interconnected SystemNorth American Western Interconnected System
1529pk - 66Copyright © P. Kundur
Major Power System Blackouts in 2003 Major Power System Blackouts in 2003
and 2004and 2004
1529pk - 67Copyright © P. Kundur
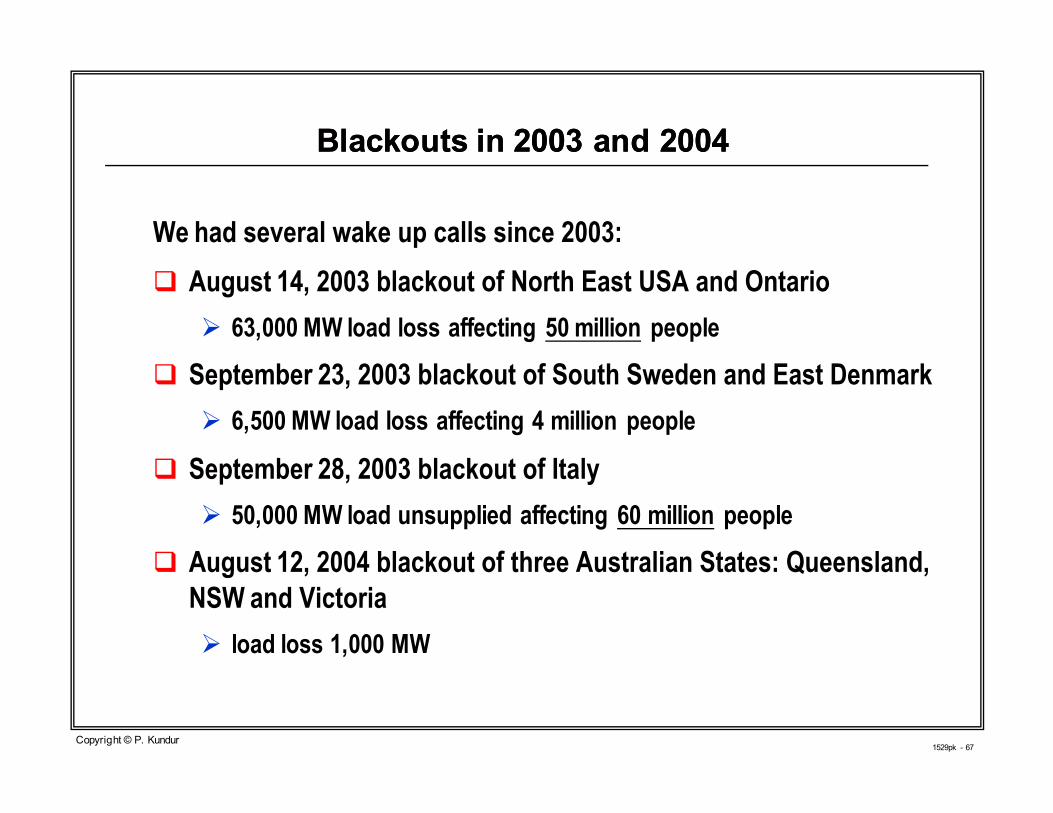
Blackouts in 2003 and 2004Blackouts in 2003 and 2004
We had several wake up calls since 2003:
� August 14, 2003 blackout of North East USA and Ontario
� 63,000 MW load loss affecting 50 million people
� September 23, 2003 blackout of South Sweden and East Denmark
� 6,500 MW load loss affecting 4 million people
� September 28, 2003 blackout of Italy
� 50,000 MW load unsupplied affecting 60 million people
� August 12, 2004 blackout of three Australian States: Queensland,
NSW and Victoria
� load loss 1,000 MW

1529pk - 68Copyright © P. Kundur
August 14, 2003 Blackout of Northeast US August 14, 2003 Blackout of Northeast US
and Canadaand Canada
1529pk - 69Copyright © P. Kundur
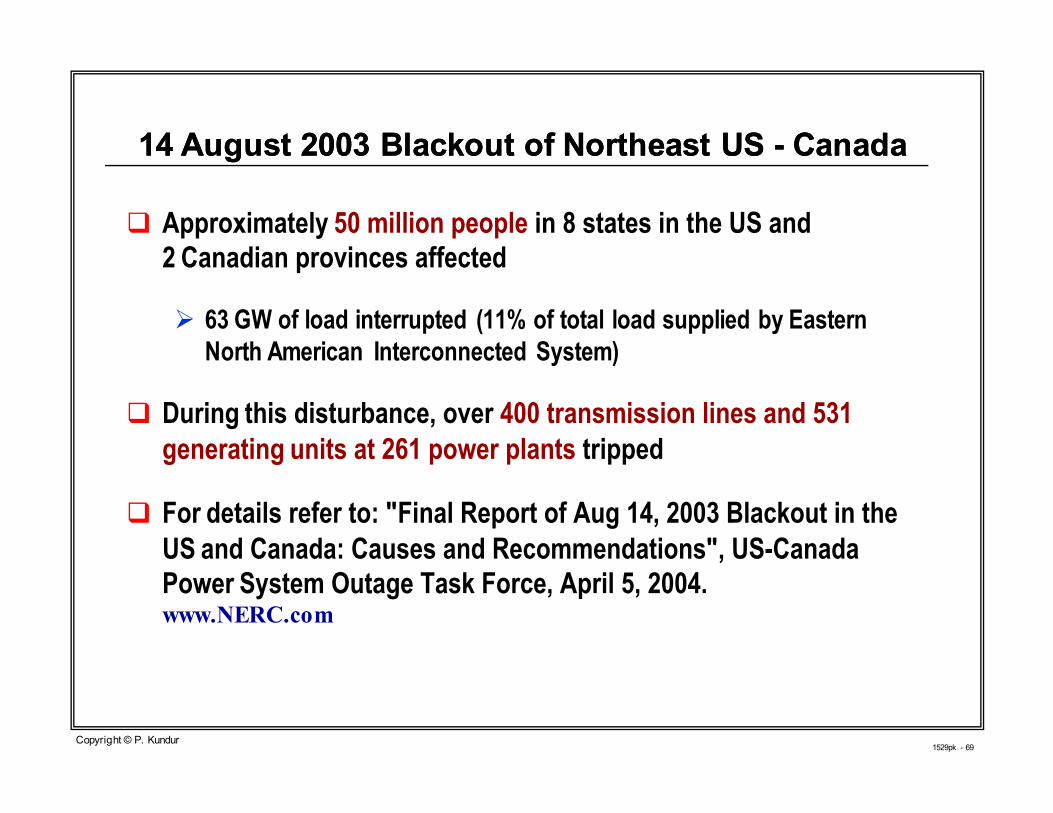
14 August 2003 Blackout of Northeast US 14 August 2003 Blackout of Northeast US -- CanadaCanada
� Approximately 50 million people in 8 states in the US and
2 Canadian provinces affected
� 63 GW of load interrupted (11% of total load supplied by Eastern
North American Interconnected System)
� During this disturbance, over 400 transmission lines and 531
generating units at 261 power plants tripped
� For details refer to: "Final Report of Aug 14, 2003 Blackout in the
US and Canada: Causes and Recommendations", US-Canada
Power System Outage Task Force, April 5, 2004. www.NERC.com
1529pk - 70Copyright © P. Kundur
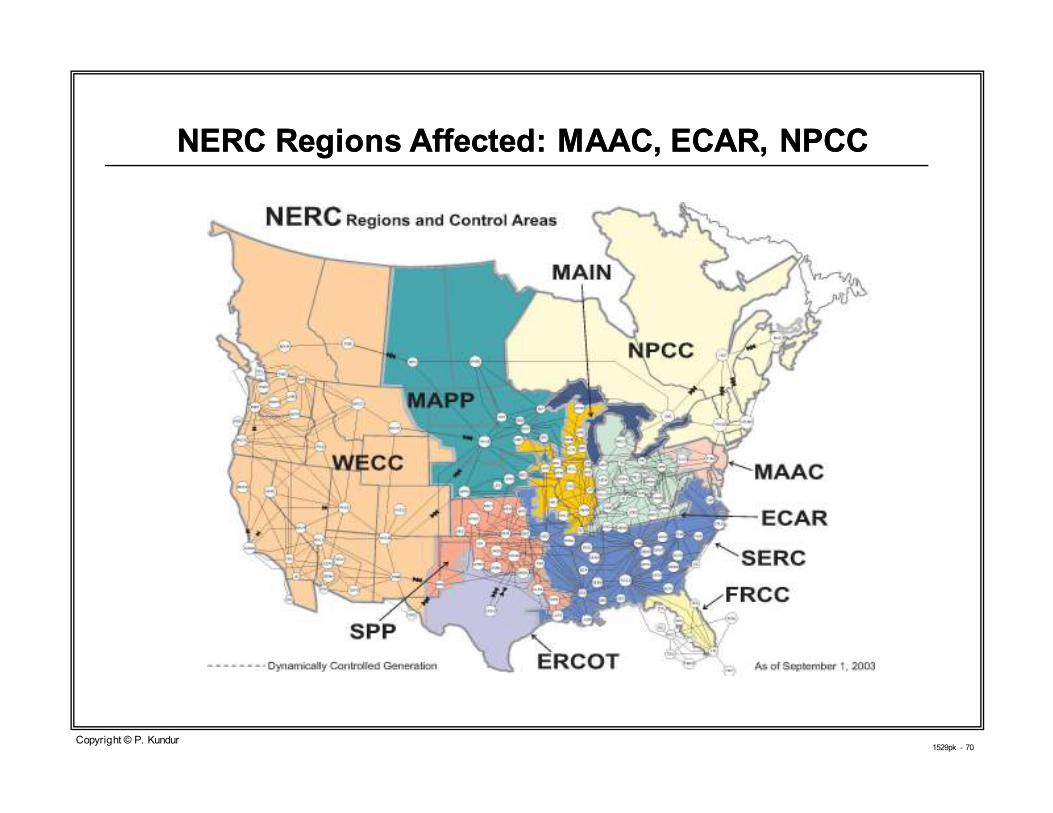
NERC Regions Affected: MAAC, ECAR, NPCCNERC Regions Affected: MAAC, ECAR, NPCC
1529pk - 71Copyright © P. Kundur
Conditions Prior to BlackoutConditions Prior to Blackout
� Electricity demand high but not unusually high
� Power transfer levels high, but within established limits and
previous operating conditions
� Planned outages of generating units in the affected area: Cook
2, Davis Bess plant, East Lake 4, Sammis 3 and Monroe 1
� Reactive power supply problems in the regions of Indiana and
Ohio prior to noon
� Operators took actions to boost voltages
� voltages within limits
� System operating in compliance with NERC operating policies
prior to 15:05 Eastern Daylight Time

1529pk - 72Copyright © P. Kundur
Blackout Started in MidwestBlackout Started in Midwest

1529pk - 73Copyright © P. Kundur
Sequence of EventsSequence of Events
� The Midwest ISO (MISO) state estimator and real-time contingency
analysis (RTCA) software not functioning properly from 12:15 to 16:04
� prevented MISO from performing proper "early warning" assessments
as the events were unfolding
� At the First Energy (FE) Control Center, a number of computer
software problems occurred on the Energy Management System
(EMS) starting at 14:14
� contributed to inadequate situation awareness at FE until 15:45
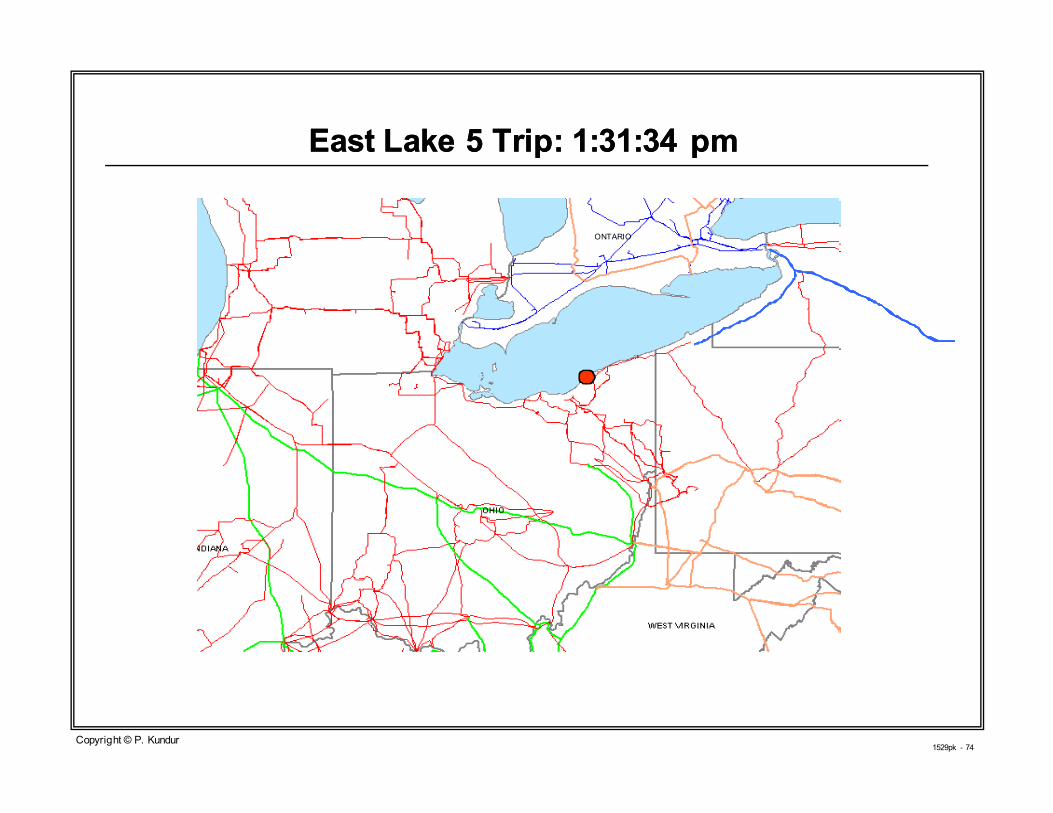
� The first significant event was the outage of East Lake generating unit
#5 in the FE system at 13:31:34
� producing high reactive power output
� voltage regulator tripped to manual on overexcitation
� unit tripped when operator tried to restore AVR
1529pk - 74Copyright © P. Kundur
East Lake 5 Trip: 1:31:34 pmEast Lake 5 Trip: 1:31:34 pm
ONTARIO
2
1
ONTARIO
1529pk - 75Copyright © P. Kundur
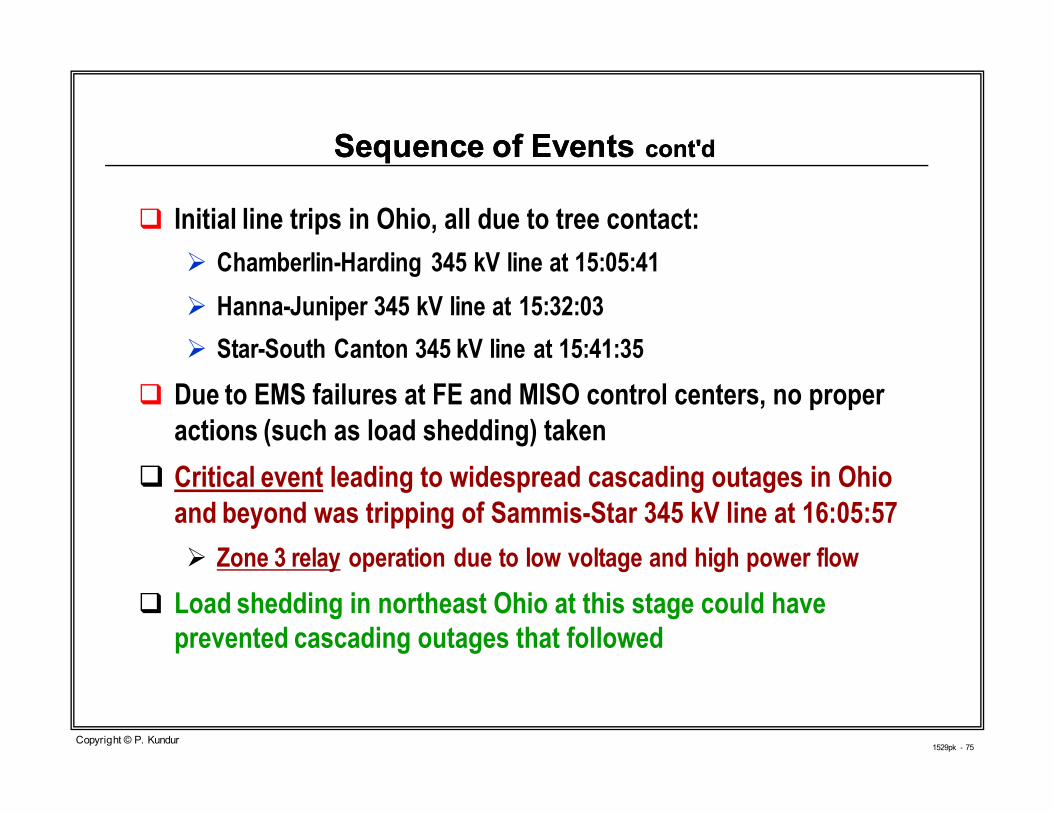
� Initial line trips in Ohio, all due to tree contact:
� Chamberlin-Harding 345 kV line at 15:05:41
� Hanna-Juniper 345 kV line at 15:32:03
� Star-South Canton 345 kV line at 15:41:35
� Due to EMS failures at FE and MISO control centers, no proper
actions (such as load shedding) taken
� Critical event leading to widespread cascading outages in Ohio
and beyond was tripping of Sammis-Star 345 kV line at 16:05:57
� Zone 3 relay operation due to low voltage and high power flow
� Load shedding in northeast Ohio at this stage could have
prevented cascading outages that followed
Sequence of Events Sequence of Events cont'dcont'd

1529pk - 76Copyright © P. Kundur
1529pk - 77Copyright © P. Kundur
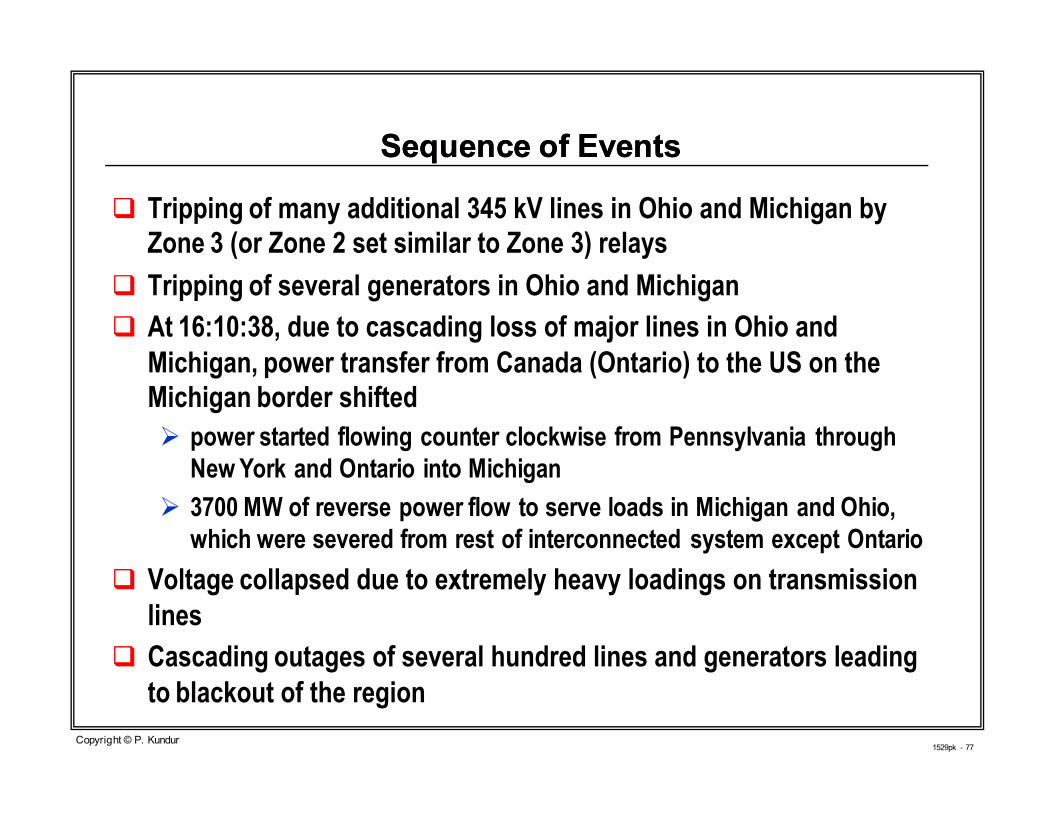
� Tripping of many additional 345 kV lines in Ohio and Michigan by
Zone 3 (or Zone 2 set similar to Zone 3) relays
� Tripping of several generators in Ohio and Michigan
� At 16:10:38, due to cascading loss of major lines in Ohio and
Michigan, power transfer from Canada (Ontario) to the US on the
Michigan border shifted
� power started flowing counter clockwise from Pennsylvania through
New York and Ontario into Michigan
� 3700 MW of reverse power flow to serve loads in Michigan and Ohio,
which were severed from rest of interconnected system except Ontario
� Voltage collapsed due to extremely heavy loadings on transmission
lines
� Cascading outages of several hundred lines and generators leading
to blackout of the region
Sequence of EventsSequence of Events

1529pk - 78Copyright © P. Kundur

1529pk - 79Copyright © P. Kundur
End of CascadeEnd of Cascade
Areas Affected by the Blackout
Serv ice maintained
in some area
Some Local Load
Interrupted

1529pk - 80Copyright © P. Kundur
Primary Causes of BlackoutPrimary Causes of Blackout(as identified by the US(as identified by the US--Canada Outage Task Force)Canada Outage Task Force)
1. Inadequate understanding of the power system requirements:
� First Energy (FE) failed to conduct rigorous long-term planning
studies and sufficient voltage stability analyses of Ohio control area
� FE used operational criteria that did not reflect actual system
behaviour and needs
� ECAR (East Central Area Reliability Council) did not conduct an
independent review or analysis of FE's voltage criteria and operating
needs
� Some NERC planning standards were sufficiently ambiguous that FE
could interpret them in a way that resulted in inadequate reliability for
system operation
cont'd
1529pk - 81Copyright © P. Kundur
Causes of Blackout Causes of Blackout cont'dcont'd
2. Inadequate level of situation awareness:
� FE failed to ensure security of its system after significant
unforeseen contingencies
� FE lacked procedures to ensure that its operators were
continually aware of the functional state of their critical
monitoring tools
� FE did not have adequate backup tools for system monitoring
3. Inadequate level of vegetation management (tree trimming)
� FE failed to adequately manage tree growth into transmission
rights-of-way
� resulted in the outage of three 345 kV lines and one 138 kV
line
cont'd
1529pk - 82Copyright © P. Kundur
Causes of Blackout Causes of Blackout cont'dcont'd
4. Inadequate level of support from the Reliability Coordinator
� due to failure of state estimator, MISO did not become aware of
FE's system problems early enough
� did not provide assistance to FE
� MISO and PJM (Regional Transmission operator) did not have in
place an adequate level of procedures and guidelines for dealing
with security limit violations due to a contingency near their
common boundary
1529pk - 83
September 23, 2003 Blackout of Southern September 23, 2003 Blackout of Southern
Sweden and Eastern DenmarkSweden and Eastern Denmark
Copyright © P. Kundur
1529pk - 84Copyright © P. Kundur
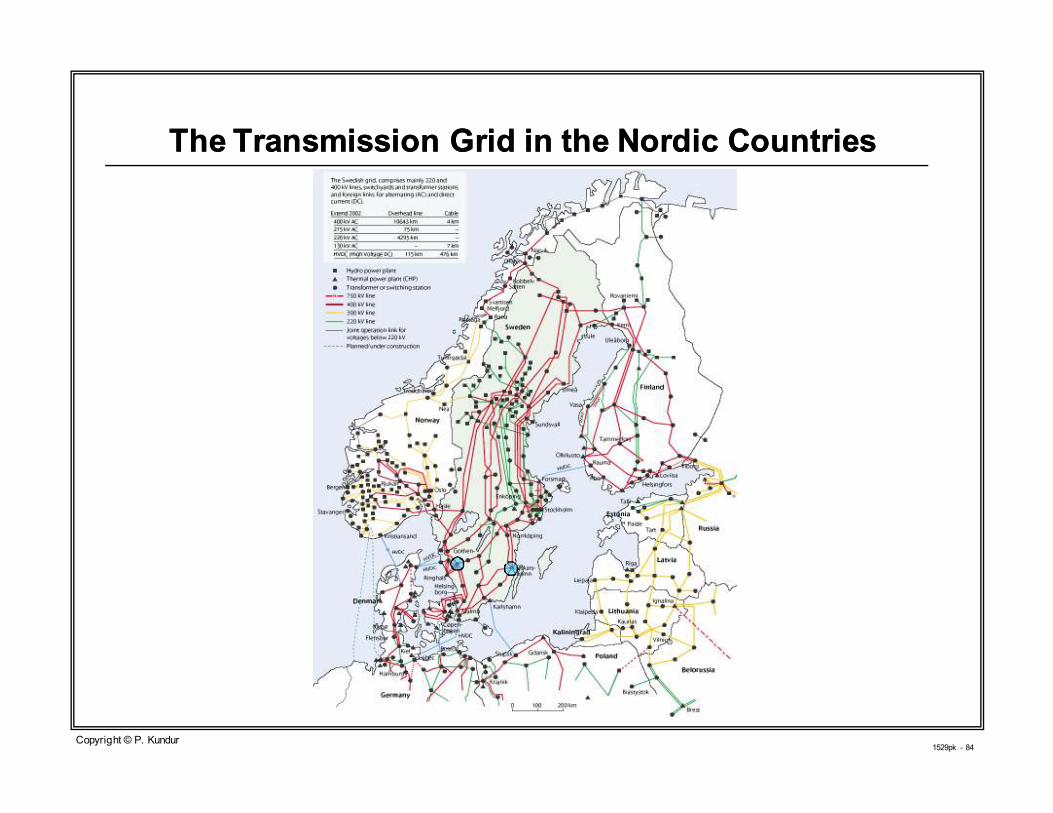
The Transmission Grid in the Nordic CountriesThe Transmission Grid in the Nordic Countries

1529pk - 85Copyright © P. Kundur
Blackout of 23 September 2003 in Southern Sweden Blackout of 23 September 2003 in Southern Sweden
and Eastern Denmarkand Eastern Denmark
� Pre-disturbance conditions:
� system moderately loaded
� facilities out of services for maintenance:
� 400 kV lines in South Sweden
� 4 nuclear units in South Sweden
� 3 HVDC links to Germany and Poland
� The first contingency was loss of a 1200 MW nuclear unit in
South Sweden at 12:30 due to problems with steam valves
� increase of power transfer from the north
� system security still acceptable
cont'd

1529pk - 86Copyright © P. Kundur
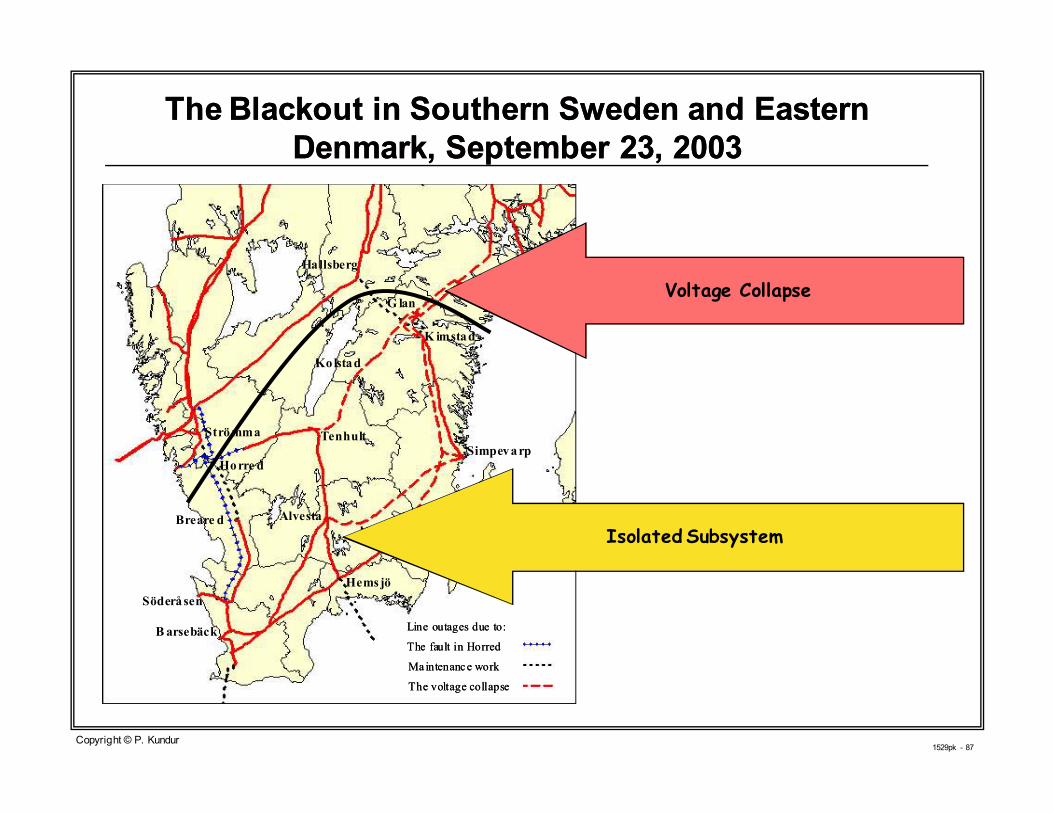
Blackout of 23 September 2003 in Southern Sweden Blackout of 23 September 2003 in Southern Sweden
and Eastern Denmark and Eastern Denmark (cont'd)(cont'd)
� Five minutes later (at 12:35) a disconnector damage caused a
double busbar fault at a location 300 km away from the first
contingency
� resulted in loss of a number of lines in the southwestern grid and
two 900 MW nuclear units
� At 12:37, voltage collapse in the eastern grid section south of
Stockholm area
� isolated southern Sweden and eastern Denmark system from
northern and central grid
1529pk - 87Copyright © P. Kundur
The Blackout in Southern Sweden and Eastern The Blackout in Southern Sweden and Eastern
Denmark, September 23, 2003Denmark, September 23, 2003
TenhultStrömma
Horre d
Söderåsen
Barsebäck
Hemsjö
Simpevarp
Nybro
K imstad
G lan
Kolstad
Hallsberg
Breare d Alvesta
The voltage collapse
Ma intenance work
The fault in Horred
Line outages due to:
TenhultStrömma
Horre d
Söderåsen
Barsebäck
Hemsjö
Simpevarp
Nybro
K imstad
G lan
Kolstad
Hallsberg
Breare d Alvesta
The voltage collapse
Ma intenance work
The fault in Horred
Line outages due to:
The voltage collapse
Ma intenance work
The fault in Horred
Line outages due to:
Voltage Collapse
Isolated Subsystem
1529pk - 88Copyright © P. Kundur
The Blackout in Southern Sweden and Eastern The Blackout in Southern Sweden and Eastern
Denmark, September 23, 2003Denmark, September 23, 2003
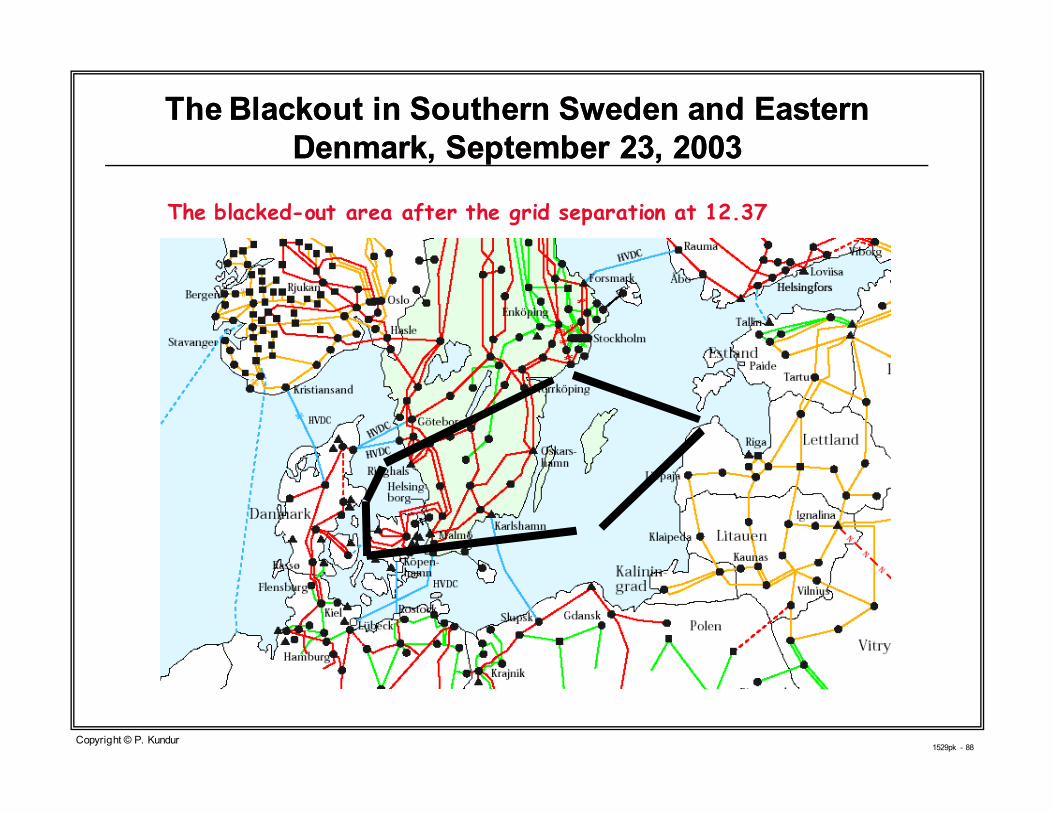
The blacked-out area after the grid separation at 12.37
1529pk - 89Copyright © P. Kundur
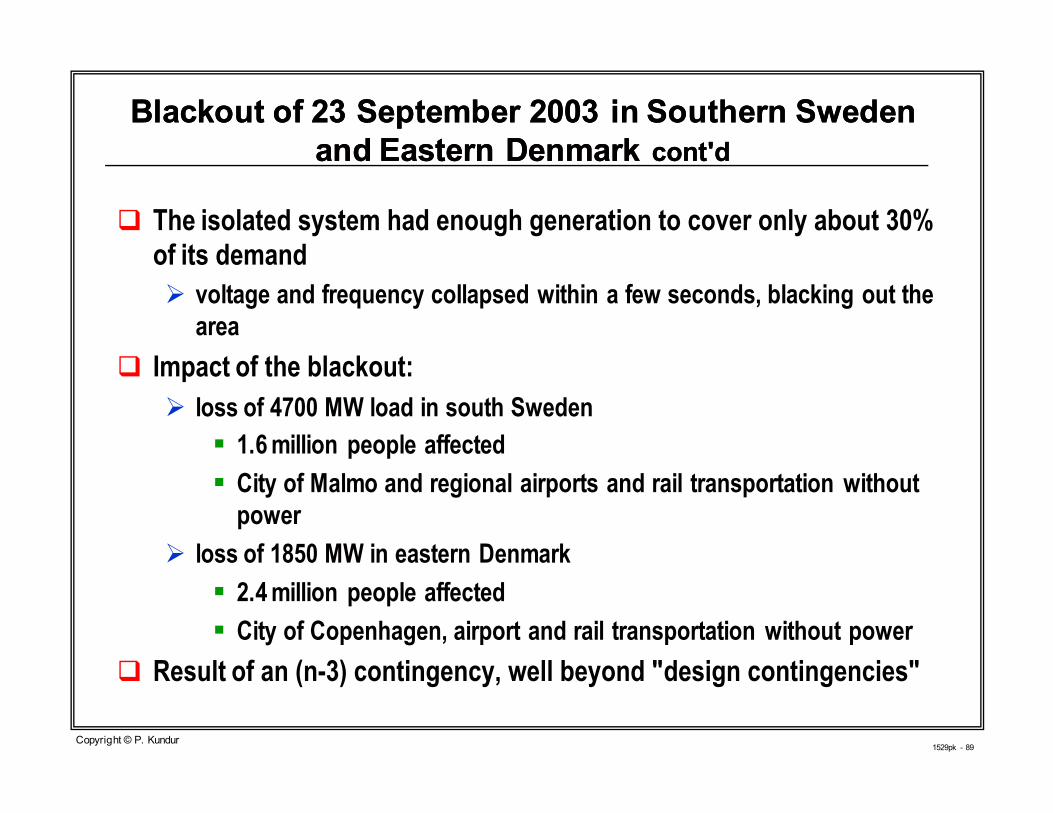
� The isolated system had enough generation to cover only about 30%
of its demand
� voltage and frequency collapsed within a few seconds, blacking out the
area
� Impact of the blackout:
� loss of 4700 MW load in south Sweden
� 1.6 million people affected
� City of Malmo and regional airports and rail transportation without
power
� loss of 1850 MW in eastern Denmark
� 2.4 million people affected
� City of Copenhagen, airport and rail transportation without power
� Result of an (n-3) contingency, well beyond "design contingencies"
Blackout of 23 September 2003 in Southern Sweden Blackout of 23 September 2003 in Southern Sweden
and Eastern Denmark and Eastern Denmark cont'dcont'd

1529pk - 90
September 28, 2003 Blackout of ItalySeptember 28, 2003 Blackout of Italy
Copyright © P. Kundur

1529pk - 91Copyright © P. Kundur
Italian System Blackout of 28 September 2003Italian System Blackout of 28 September 2003
� Predisturbance conditions (Sunday, 3:00 am):
� total load in Italy was 27,700 MW, with 3638 MW pump load
� total import from rest of Europe was 6651 MW
� Sequence of events:
� a tree flashover caused tripping of a major tie-line between Italy and
Switzerland (Mettlen-Lavorgo 380 kV line) at 03:01:22
� Sychro-check relay prevented automatic and manual reclosure of line due
to the large angle (42°) across the breaker
� resulted in an overload on a parallel path
� attempts to reduce the overload by Swiss transmission operators by
network change was not successful
� at 03:21 import by Italy was reduced by 300 MW but was not sufficient to
mitigate the overload of a second 380 kV line (Sils-Soazza), which tripped
at 03:25:22 due to sag and tree contact

1529pk - 92Copyright © P. Kundur
� the cascading trend continued and the power deficit in Italy was such
that the ties to France, Austria and Slovania were tripped
� the outages left the Italian system with a power shortage of 6400 MW
� the frequency decay could not be controlled adequately by under-
frequency load shedding
� over the course of several minutes, the entire Italian System collapsed at
3:28:00
� The blackout affected about 60 million people
� total energy not delivered 180 GWh
� worst blackout in the history of Italy
� power was restored after 3 hours in the northern area and during the
same day for most of Italy
Italian System Blackout of 28 September 2003 Italian System Blackout of 28 September 2003 cont'dcont'd

1529pk - 93
What Can We Do To Prevent What Can We Do To Prevent
Blackouts?Blackouts?
Copyright © P. Kundur
1529pk - 94Copyright © P. Kundur
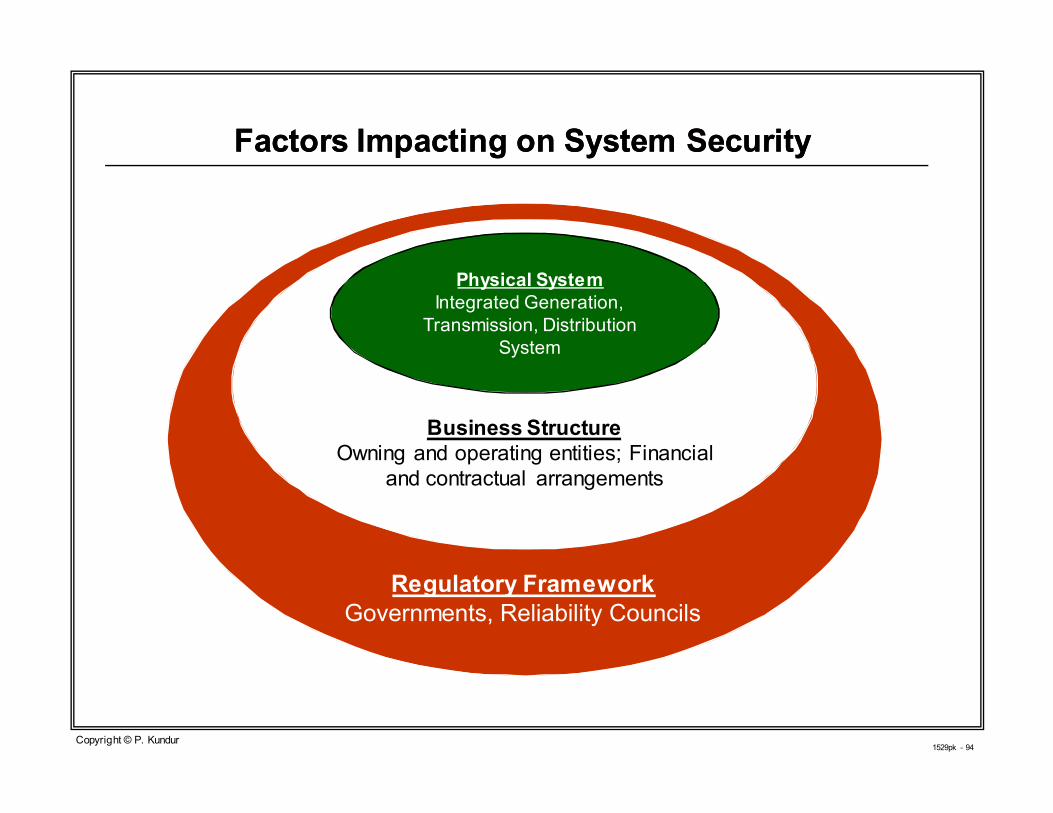
Factors Impacting on System SecurityFactors Impacting on System Security
Regulatory Framework
Governments, Reliability Councils
Business Structure
Owning and operating entities; Financial
and contractual arrangements
Physical System
Integrated Generation,
Transmission, Distribution
System

1529pk - 95Copyright © P. Kundur
Comprehensive Approach to Enhancing System Comprehensive Approach to Enhancing System
StabilityStability
� Impractical to achieve 100% reliability of power systems
� Good design and operating practices could significantly minimize
the occurrence and impact of widespread outages
� Reliability criteria: risk-based security criteria
� Improved protective relaying
� Robust stability controls
� Coordinated emergency controls
� Comprehensive stability assessment: analytical tools and models
� Real-time system system monitoring and control
� Wide-spread use of distributed generation
� Reliability Management System
� Good vegetation management

1529pk - 96Copyright © P. Kundur
Reliability CriteriaReliability Criteria
� At present, systems designed and operated to withstand loss of any
single element preceded by single-, double-, or three-phase fault
� referred to as "N-1 criterion"
� formulated nearly 40 years ago after the 1965 blackout
� Need for using risk-based security assessment criteria
� consider multiple outages
� account for probability and consequences of instability
� Built-in overall strength or robustness best defense against
catastrophic failures !
1529pk - 97Copyright © P. Kundur
Improved Protective RelayingImproved Protective Relaying
� State-of-the-art protective relaying for generating units and
transmission lines
� adaptive relaying
� Replacement of zone 3 and other backup relaying on important
lines with improved relaying
� Improved protection and control at power plants to minimize unit
tripping for voltage and frequency excursions
� Protective relay improvements to prevent tripping of critical
elements on overload
� control actions to relieve overload

1529pk - 98Copyright © P. Kundur
Robust Stability ControlsRobust Stability Controls
� Greater use of stability controls
� excitation control (PSS), FACTS, HVDC, secondary voltage control
� multi-purpose controls
� multiple controllers
� Coordination, integration and robustness present challenges
� good control design procedures and tools have evolved
� Hardware design should provide
� high degree of functional reliability
� flexibility for maintenance and testing
� Industry should make better use of controls !

1529pk - 99Copyright © P. Kundur
Emergency Controls for Extreme ContingenciesEmergency Controls for Extreme Contingencies
� Contingencies more severe than normal design contingencies
� multiple contingencies
� can occur anywhere on the system in any form
� Currently, emergency controls used to protect against some
� generator tripping, load shedding, dynamic breaking, controlled
system separation, transfer tap-changer blocking
� Need for a systematic approach to cover against all likely extreme
contingencies
1529pk - 100Copyright © P. Kundur
"Defense Plan" Against Extreme Contingencies: "Defense Plan" Against Extreme Contingencies:
Coordinated Emergency ControlsCoordinated Emergency Controls
� Judicious choice of emergency controls
� protection against different scenarios
� identification of scenarios based on past experience, knowledge of
unique characteristics of system, probabilistic approach
� Coordination of different emergency control schemes
� complement each other
� act properly in complex situations
� Response-based emergency controls should generally be preferred
� "self-healing" power systems
� Need for advancing this technology !
1529pk - 101Copyright © P. Kundur
Examples of Examples of ResponseResponse--BasedBased Emergency Control Emergency Control
SchemesSchemes
1. Scheme for prevention of voltage collapse in Eastern Ontario
� fully automated and coordinated emergency controls for voltage
stability
2. Transient Excitation Boosting
� for enhancing transient (angle) stability of systems with dominant
interarea swing
1529pk - 102Copyright © P. Kundur
Example 1: Prevention of Voltage Collapse in Example 1: Prevention of Voltage Collapse in
Eastern OntarioEastern Ontario
� Implemented in early 1980s to cope with delays in building 500 kV
line
� Under high load conditions, loss of a major 230 kV line leads to
voltage collapse of Ottawa area
� A coordinated scheme consisting of fast line reclosure, load
rejection, shunt capacitor switching, and transformer ULTC
blocking
1529pk - 103Copyright © P. Kundur
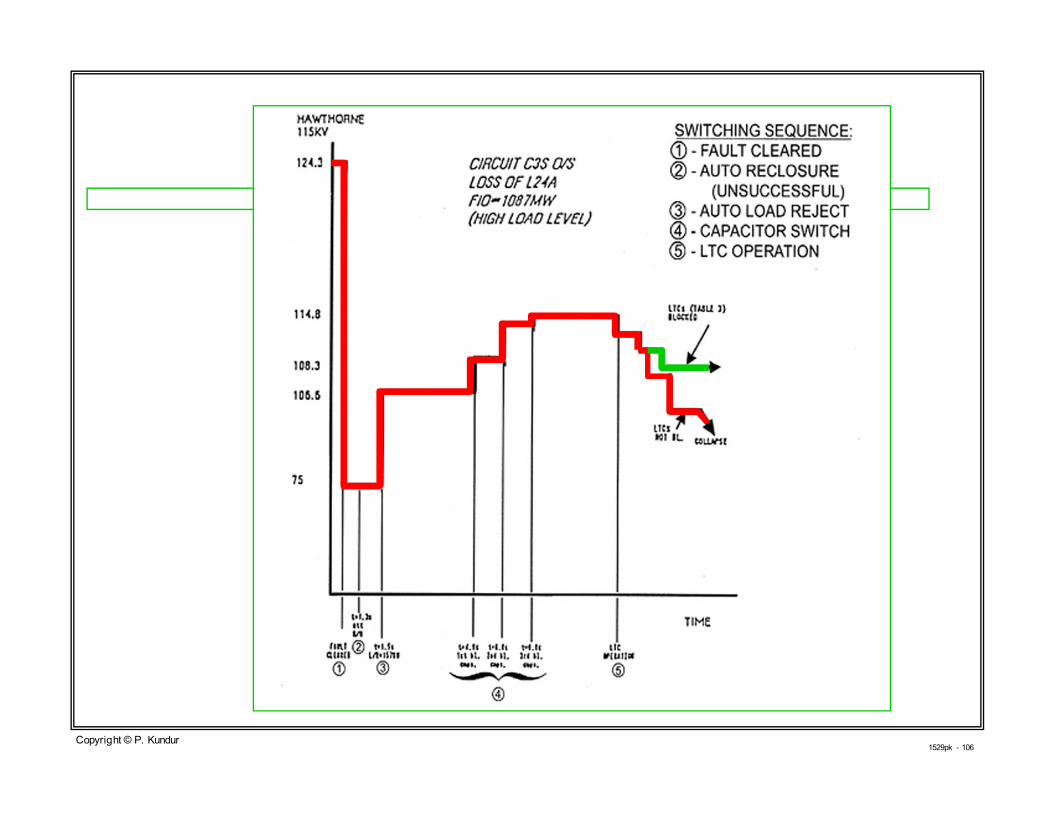
Example 1: Example 1: (cont'd)(cont'd)
The coordinated scheme:a) Fast reclosure of major lines (1.3s)
� first line of defense
b) Load rejection (1.5s)
� 9 blocks, 750 MW; armed by operator
� voltage/time dependent
c) Shunt capacitors switching (1.8 to 8.0s)
� 36 banks in 17 TSs
� voltage/time dependent
d) Transformer ULTC blocking at 14 TSs
� voltage/time dependent
� unblocked when voltage recovers
1529pk - 104Copyright © P. Kundur
Example 1: Example 1: (cont'd)(cont'd)
� Coordination provided by appropriate selection of voltage and
time settings
� triggered by voltage drop magnitude and duration
� Following a contingency, depending on the severity (power flow,
line outage), only the required level of control action provided

1529pk - 105Copyright © P. Kundur
1300 MW
1374 MW
1529pk - 106Copyright © P. Kundur
1529pk - 107Copyright © P. Kundur
ResponseResponse--Based Emergency ControlsBased Emergency Controls
Example 2: Transient Excitation BoostingExample 2: Transient Excitation Boosting
� In situations with dominant interarea swing, PSS reduces
excitation after the first local mode swing
� Improvements in TS achieved by keeping excitation at ceiling
until highest composite swing
� increase in internal voltage
� increase in voltage also increases power consumed by area load
1529pk - 108Copyright © P. Kundur
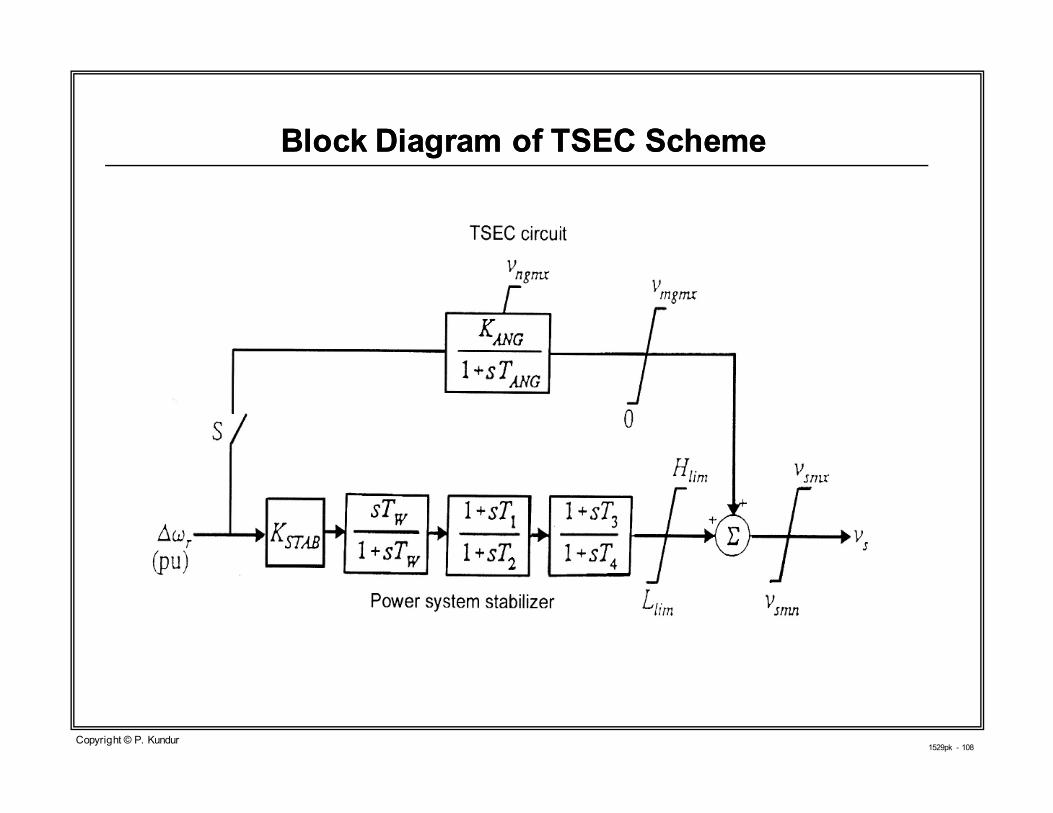
Block Diagram of TSEC SchemeBlock Diagram of TSEC Scheme
1529pk - 109Copyright © P. Kundur
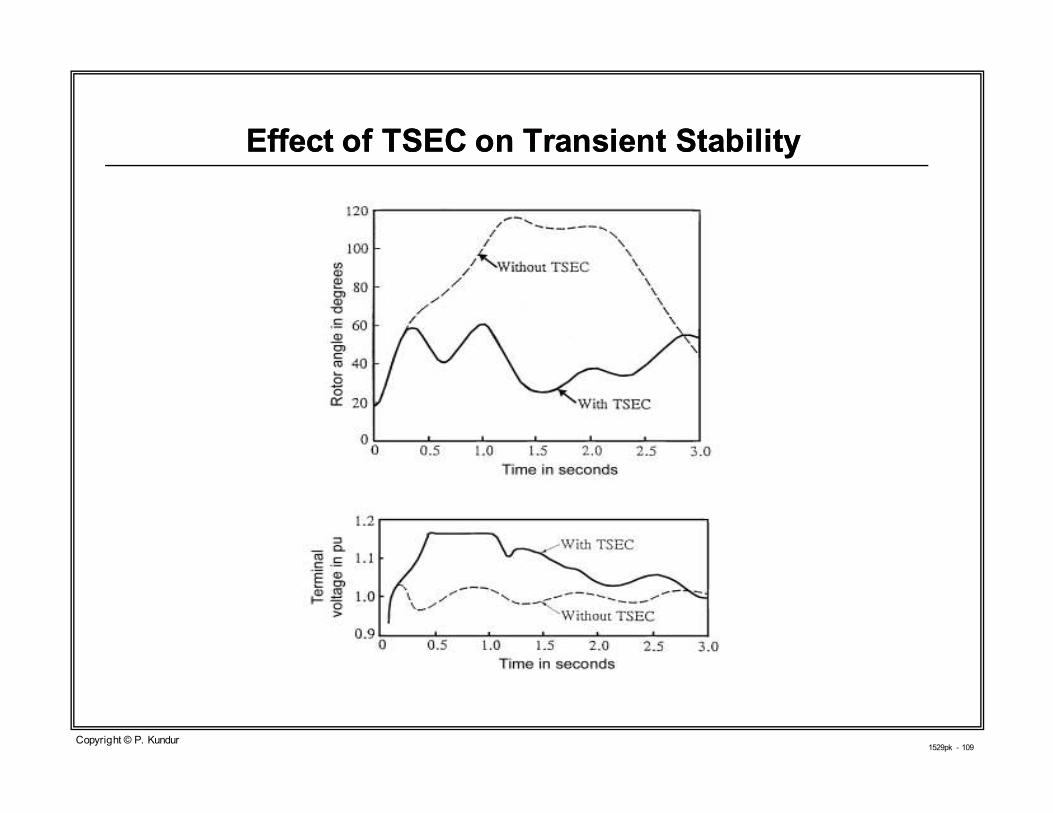
Effect of TSEC on Transient StabilityEffect of TSEC on Transient Stability

1529pk - 110Copyright © P. Kundur
Example 2: Example 2: (cont'd)(cont'd)
� Transient Excitation Boosting, TSEC, applied to four major plants
in Ontario:
� Nanticoke (4000 MW), Bruce A and B (6000 MW), Lennox (2000 MW)
� signal proportional to angle swing
� integrated with PSS and coordinated with terminal voltage limiter
� In effect, a nonlinear adaptive closed loop control
� may use local or remote signals
� imposes little duty on equipment
1529pk - 111Copyright © P. Kundur
Comprehensive Stability Analysis ToolsComprehensive Stability Analysis Tools
� Powerful analytical tools have been developed capable of
comprehensive analysis for system design and operation:
� all forms of stability
� large systems with detailed models
� complementary use of time-domain and modal analysis
� automated procedures for considering large number of scenarios
� Industry gradually shifting to the use of new tools
� Lack of widespread understanding and appreciation for the use of
eigenvalue based modal analyses techniques
1529pk - 112Copyright © P. Kundur
StateState--ofof--thethe--Art Art OnOn--LineLine Dynamic Security Dynamic Security
Assessment (DSA)Assessment (DSA)
� Practical tools have been developed with the required accuracy, speed
and robustness
� a variety of analytical techniques integrated
� distributed hardware architecture using low cost PCs
� integrated with energy management system
� Capable of assessing rotor angle stability and voltage stability
� determine critical contingencies automatically
� security limits/margins for all desired energy transactions
� identify remedial measures
� The industry has yet to take full advantage of these developments !

1529pk - 113Copyright © P. Kundur
Dynamic Security Assessment Tools Developed and Dynamic Security Assessment Tools Developed and
Used by Powertech for System Design and OperationUsed by Powertech for System Design and Operation
� Powerful set of complementary programs:
� flexible and detailed models
� alternative and efficient solution techniques
� Transient (Angle) Stability Assessment: TSAT
� Small-Signal (Angle) Stability Assessment: SSAT
� Voltage Stability Assessment: VSAT
� Frequency Stability Analysis: LTSP *cont'd
LTSP currently not maintained/supported*
1529pk - 114Copyright © P. Kundur
Powertech DSA Tools Powertech DSA Tools (cont'd)(cont'd)
� Automated procedures for:
� contingency screening and ranking
� consideration of a large number of scenarios
� stability limit search
� power flow dispatch
� determination of stability margins
� identifying remedial measures for maintaining stability and
increasing stability margins
� Significant savings in computation and engineering times
1529pk - 115
OnOn--Line Voltage Stability Assessment ToolLine Voltage Stability Assessment Tool
(VSAT)(VSAT)
Copyright © P. Kundur
1529pk - 116Copyright © P. Kundur
Key Elements of VSATKey Elements of VSAT
� Interface with EMS; Model Initialization
� Contingency screening and selection
� Determination of secure operating region
� using static analysis
� Determination of remedial actions
� Fast time-domain simulation
� validation and checking
1529pk - 117Copyright © P. Kundur
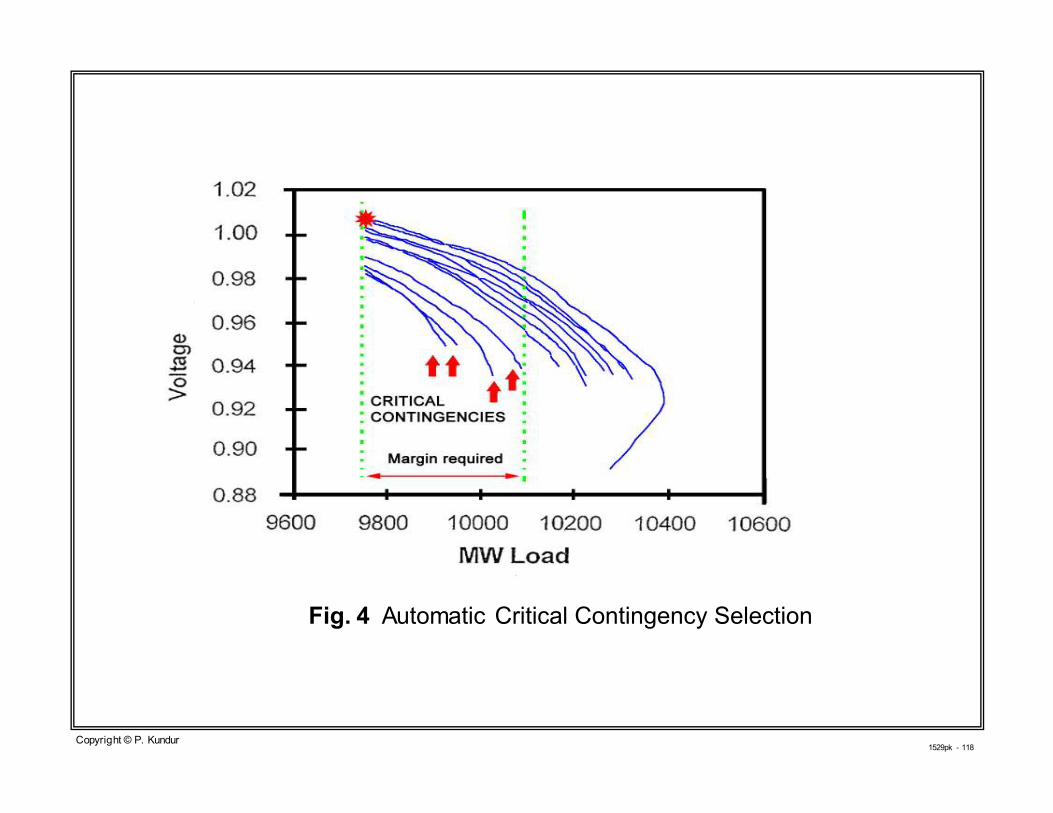
Contingency Selection ModuleContingency Selection Module
� Impractical to consider every conceivable contingency
� A limited number (typically 20) critical contingencies determined
for detailed studies
� Performance Indices based on a few power flow solutions and
reactive reserve not reliable
� A fast screening method used:
� based on exact margin to voltage collapse and full power flow
solutions
� number of power flow solutions 1.2 to 2.0 times number of
contingencies
� Supplemented with user-specified contingencies
1529pk - 118Copyright © P. Kundur
Fig. 4 Automatic Critical Contingency Selection
1529pk - 119Copyright © P. Kundur
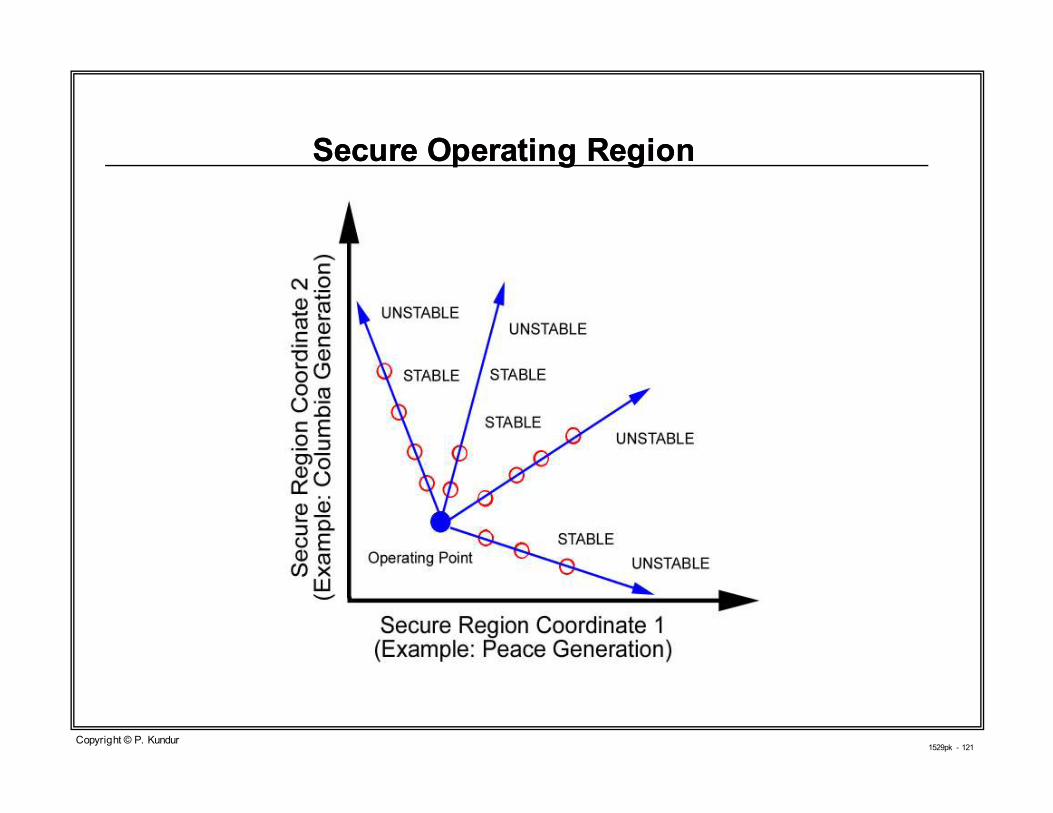
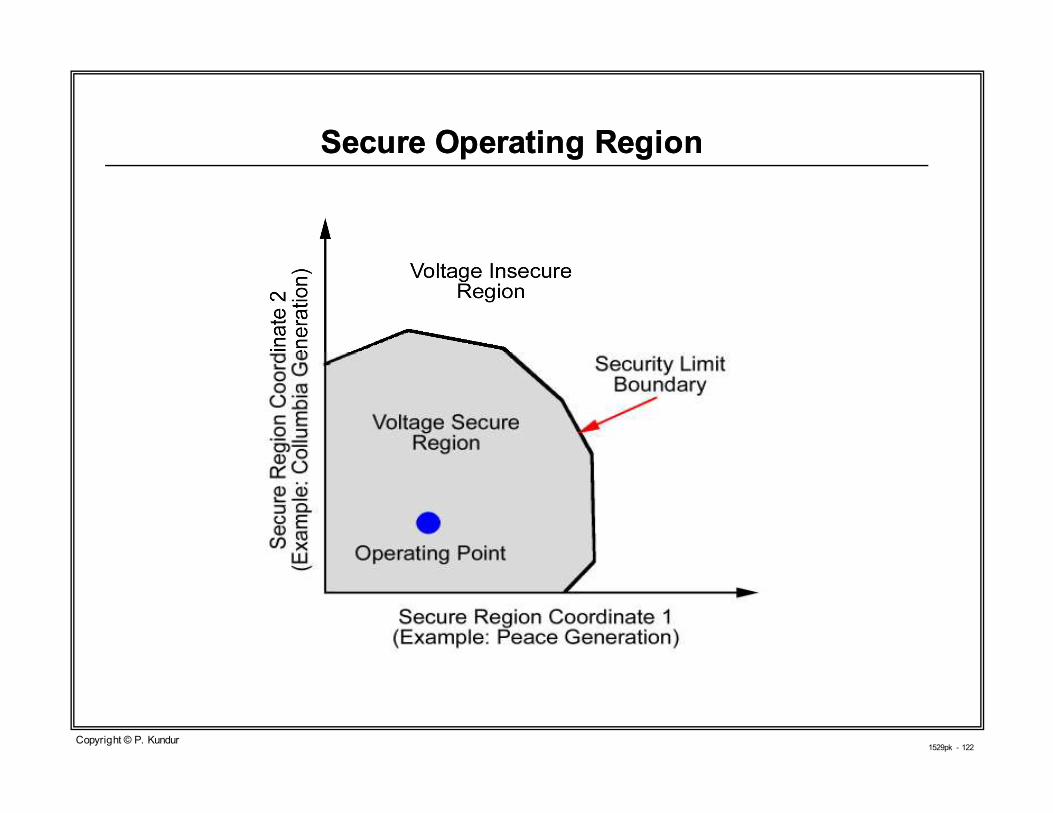
Security Computation ModuleSecurity Computation Module
� Engine for voltage stability analysis
� static analysis with detailed models
� Secure region is defined by a number of Coordinates (SRCs)
� key system parameters: MW generation, area load, interface
transfers, etc.
� Voltage security determined by
� voltage stability margin
� MVAr reserves of key reactive sources
� post-contingency voltage decline
� Modal analysis of powerflow Jacobian matrix identifies areas prone
to instability
� Specialized powerflow dispatcher and solver to quickly search for
stability limit
1529pk - 120Copyright © P. Kundur
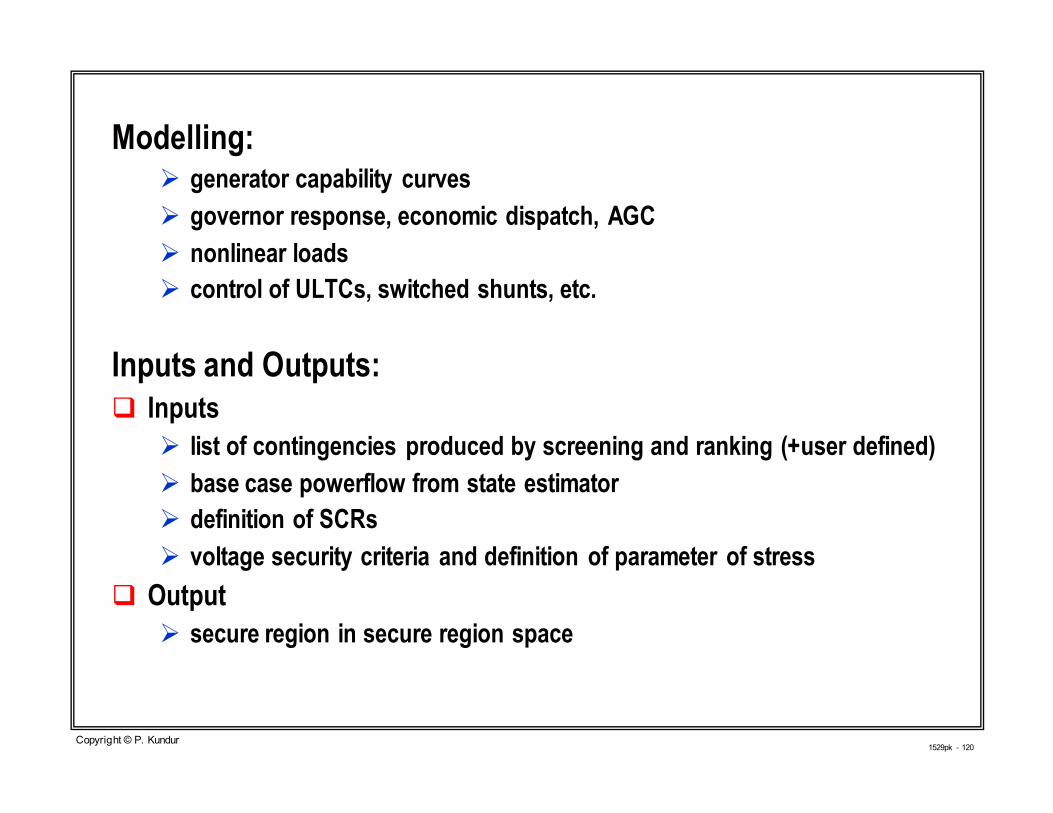
Modelling:� generator capability curves
� governor response, economic dispatch, AGC
� nonlinear loads
� control of ULTCs, switched shunts, etc.
Inputs and Outputs:
� Inputs
� list of contingencies produced by screening and ranking (+user defined)
� base case powerflow from state estimator
� definition of SCRs
� voltage security criteria and definition of parameter of stress
� Output
� secure region in secure region space
1529pk - 121Copyright © P. Kundur
Secure Operating RegionSecure Operating Region
1529pk - 122Copyright © P. Kundur
Secure Operating RegionSecure Operating Region

1529pk - 123Copyright © P. Kundur
Remedial Measures ModuleRemedial Measures Module
� Determines necessary remedial measures to
� ensure sufficient stability margins
� expand the secure region
� Preventative control actions:
� taken prior to a contingency
� caps/reactor switching, generation redispatch, voltage rescheduling
� Corrective (emergency) control actions:
� applied following a contingency
� load shedding, generator runback, transformer tap changer blocking
� Ranking of each remedial measure using:
� sensitivity analysis
� user-defined priorities
1529pk - 124Copyright © P. Kundur
Ranking and Applying Remedial MeasuresRanking and Applying Remedial Measures
� Objective is to identify the most effective remedial measures to give
the desired stability margin
� Obtain solved power flow case for the most severe contingency
� gradually introduce the effect of the contingency
� bus injection compensation technique
� Compute the sensitivities of reactive power (or bus voltage) to
different control measures
� rank the remedial measures
� Apply controls one at a time in order of ranking until power flow
solves for the most severe contingency

1529pk - 125Copyright © P. Kundur
Expanding the Secure Region: Remedial MeasuresExpanding the Secure Region: Remedial Measures

1529pk - 126Copyright © P. Kundur
Fast TimeFast Time--Domain Simulation ModuleDomain Simulation Module
� Determines the essential dynamic phenomena without step-by-step
numerical integration
� when chronology of events significant
� for validating the effect of remedial measures
� Focuses on the evolution of system dynamic response driven by
slow dynamics
� transformer tap changers, field current limiters, switched caps
� Captures the effects of fast dynamics by solving associated steady
state equations
1529pk - 127Copyright © P. Kundur
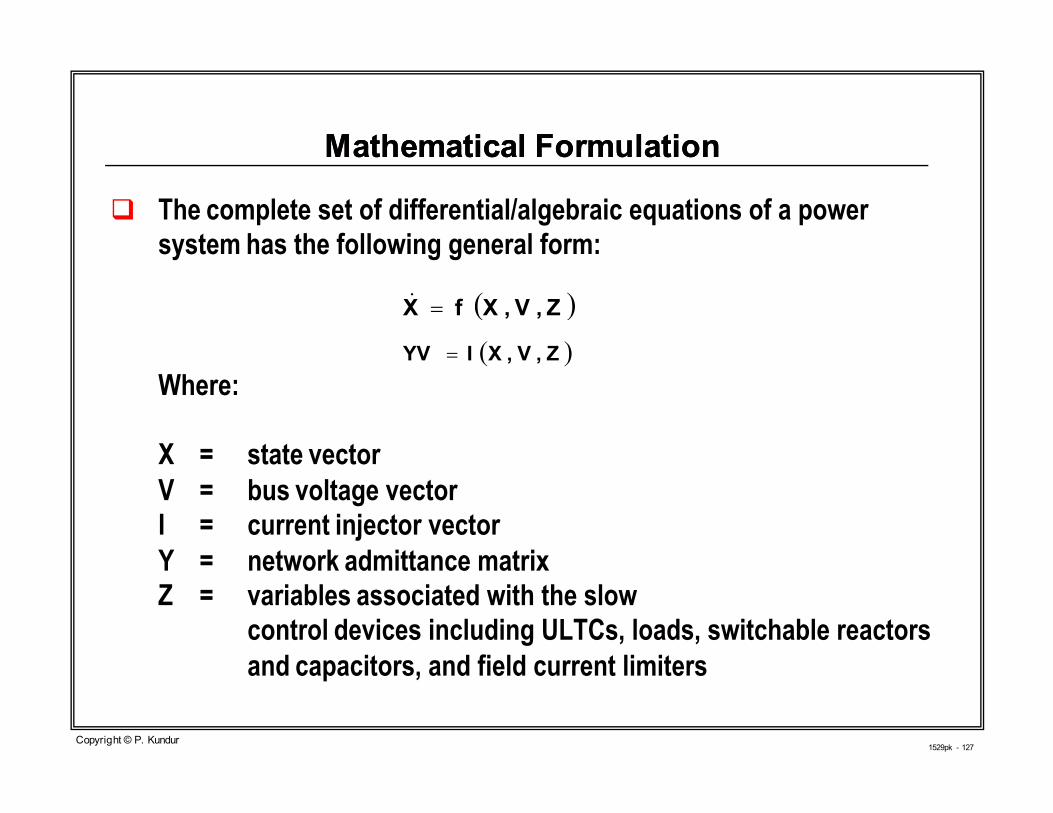
� The complete set of differential/algebraic equations of a power
system has the following general form:
Where:
X = state vector
V = bus voltage vector
I = current injector vector
Y = network admittance matrix
Z = variables associated with the slow
control devices including ULTCs, loads, switchable reactors
and capacitors, and field current limiters
Mathematical FormulationMathematical Formulation
( )Z,V,XfX =&
( )Z,V,XIYV =
1529pk - 128Copyright © P. Kundur
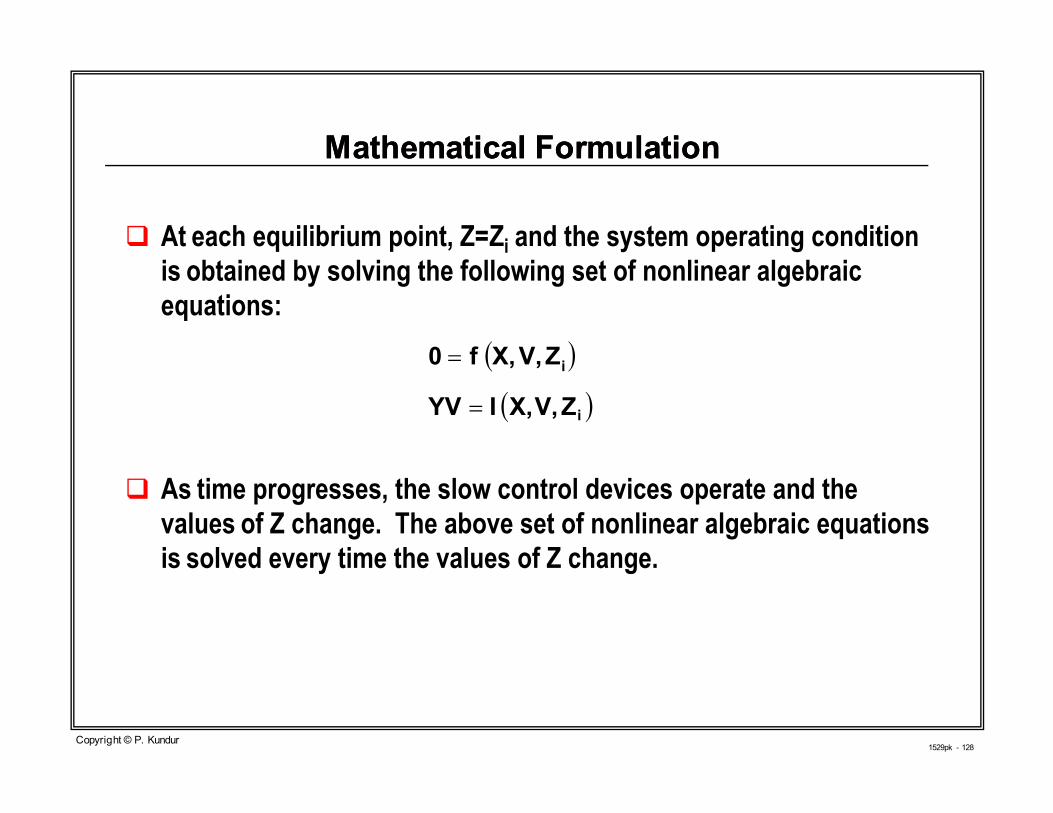
Mathematical FormulationMathematical Formulation
� At each equilibrium point, Z=Zi and the system operating condition
is obtained by solving the following set of nonlinear algebraic
equations:
� As time progresses, the slow control devices operate and the
values of Z change. The above set of nonlinear algebraic equations
is solved every time the values of Z change.
( )
( )i
i
ZV,X,IYV
ZV,X,f0
=
=

1529pk - 129Copyright © P. Kundur

1529pk - 130Copyright © P. Kundur
Powerflow
Solver
VSAT StructureVSAT Structure
1529pk - 131
Transient Stability Assessment Tool (TSAT)Transient Stability Assessment Tool (TSAT)
Copyright © P. Kundur

1529pk - 132Copyright © P. Kundur
Transient Stability Assessment (TSA)Transient Stability Assessment (TSA)
� Time-domain simulations essential
� modeling detail and accuracy
� Sole dependence on time-domain simulations has severe limitations
� high computational burden
� no stability margin/sensitivity information
� requires considerable human interaction
� Supplementary techniques for speeding up and automating overall
process
� Methods available for deriving useful indices
� Transient Energy Function (TEF)
� Signal Energy Analysis
� Extended Equal Area Criterion (EEAC)

1529pk - 133Copyright © P. Kundur
A Practical Tool for TSAA Practical Tool for TSA
� Overall architecture similar to that of VSA
� Time-domain program, with detailed models and efficient solution
techniques, forms simulation engine
� EEAC used for screening contingencies, computing stability margin,
stability limit search, and early termination of simulation
� “Prony analysis” for calculation of damping of critical modes of
oscillation
� A powerflow dispatcher and solver for finding the stability limit
� a fully automated process
� No modeling compromises;
can handle multi-swing instability

1529pk - 134Copyright © P. Kundur
EEACEEAC
� Integrates the dynamic response in the multimachine space, and
maps the resultant trajectory into a set of one-machine-infinite-bus
planes
� By applying complementary cluster center of inertia (CCCI)
transformations
� Keeps all dynamic information in the multimachine space
� Stability analysis can be quantitatively performed for the image OMIB
systems
� Has the same accuracy and modeling flexibility
� Fast, quantitative
1529pk - 135Copyright © P. Kundur
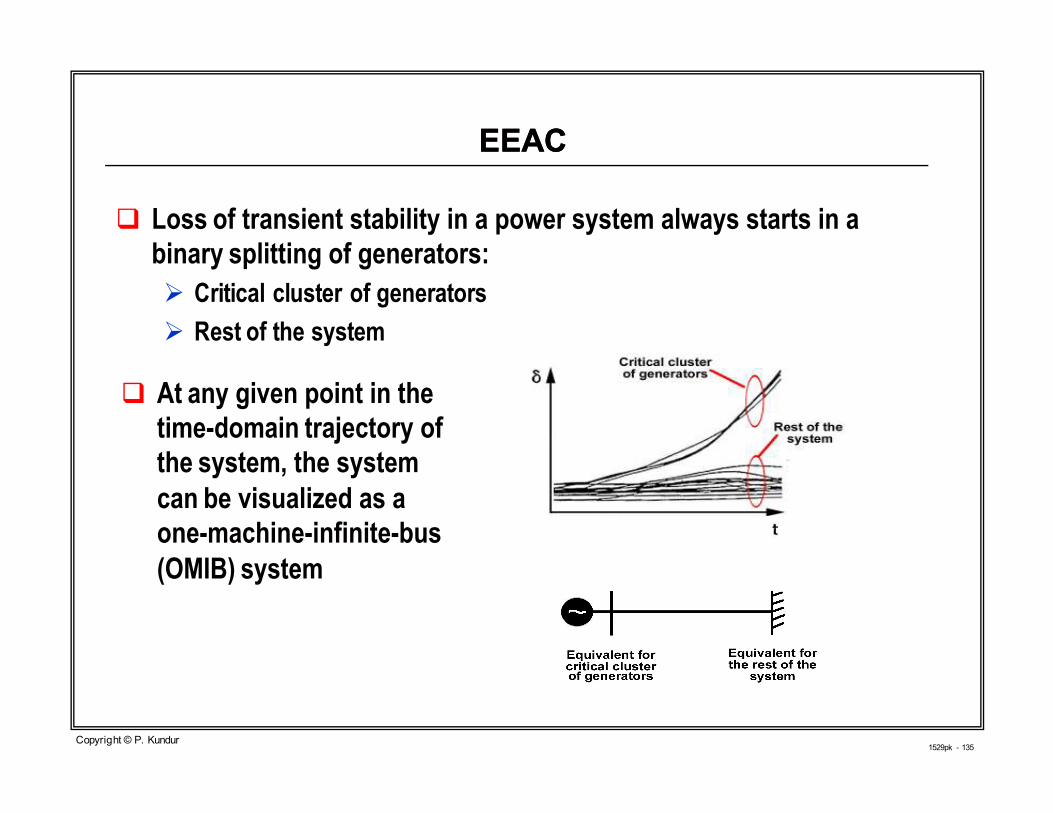
EEACEEAC
� Loss of transient stability in a power system always starts in a
binary splitting of generators:
� Critical cluster of generators
� Rest of the system
� At any given point in the
time-domain trajectory of
the system, the system
can be visualized as a
one-machine-infinite-bus
(OMIB) system
1529pk - 136Copyright © P. Kundur
EEACEEAC
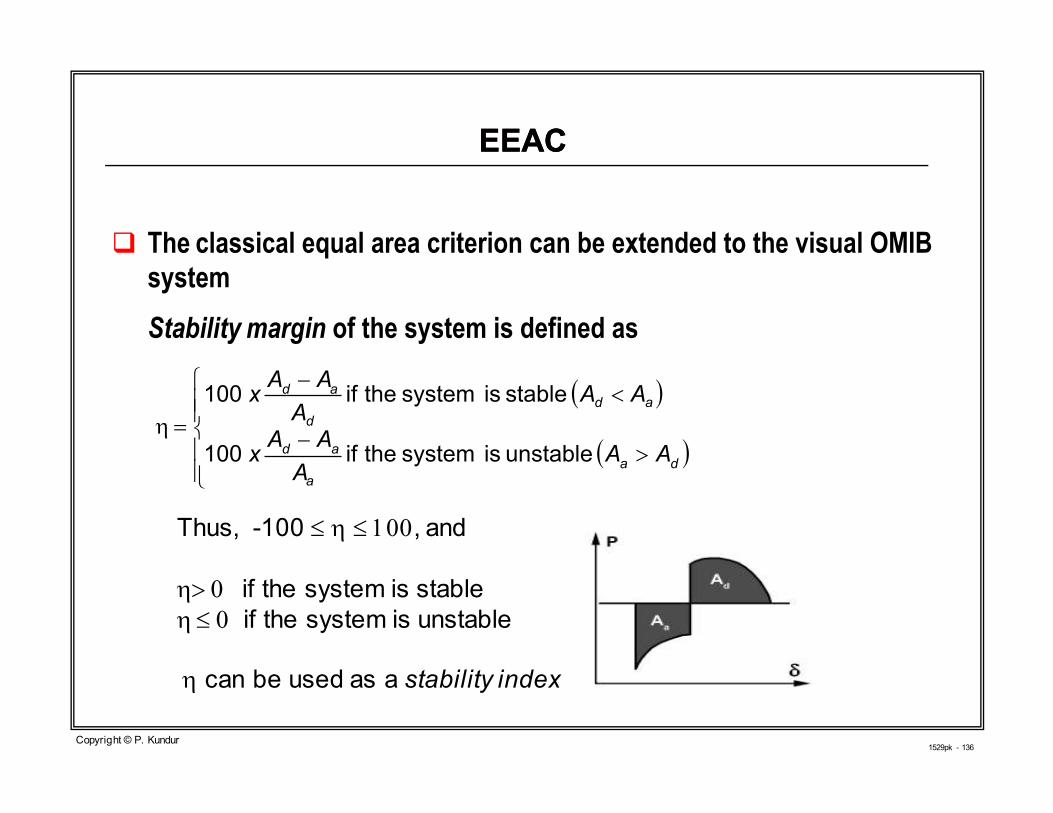
� The classical equal area criterion can be extended to the visual OMIB
system
Stability margin of the system is defined as
( )
( )
>−
<−
=η
da
a
ad
ad
d
ad
AAA
AAx
AAA
AAx
unstable is system the if100
stable is system the if100
Thus, -100 ≤ η ≤ 100, and
η> 0 if the system is stable
η ≤ 0 if the system is unstable
η can be used as a stability index

1529pk - 137Copyright © P. Kundur
Use of EEAC TheoryUse of EEAC Theory
� Contingency screening
� stability margin gives an indication of the relative severity
� Corrective measures for maintaining secure system operation
� critical cluster of generators (CCG) provides valuable information
� Power transfer limit search
� stability limit can be determined in four iterations using stability margin
� each iteration involves a detailed simulation and computation of stability
index

1529pk - 138Copyright © P. Kundur
Results Results -- Test SystemTest System
System description
� BC Hydro system� 1430 buses
� 186 generators� 4 HVDC links
Interface
� GMS and PCN output
� Base case transfer = 3158 MW
Contingency
� Three phase fault at GMS 500 kV bus
� Tripping of one of two 500 kV lines from GMS to WSN

1529pk - 139Copyright © P. Kundur
Limit Search ResultsLimit Search Results

1529pk - 140Copyright © P. Kundur
Speed Enhancement: Parallel ProcessingSpeed Enhancement: Parallel Processing
� Code parallelization
� differential equations easily parallelized, but not network equations
� speed-ups limited by serial slowdown effect
� up to 7 times speed-up can be achieved with 20-30 processors
� not an effective way
� Conventional serial computers offer much faster computational
per-CPU
� For multiple contingencies
� perform initialization only once
� run contingencies on multiple processors - one processor per
contingency
1529pk - 141Copyright © P. Kundur
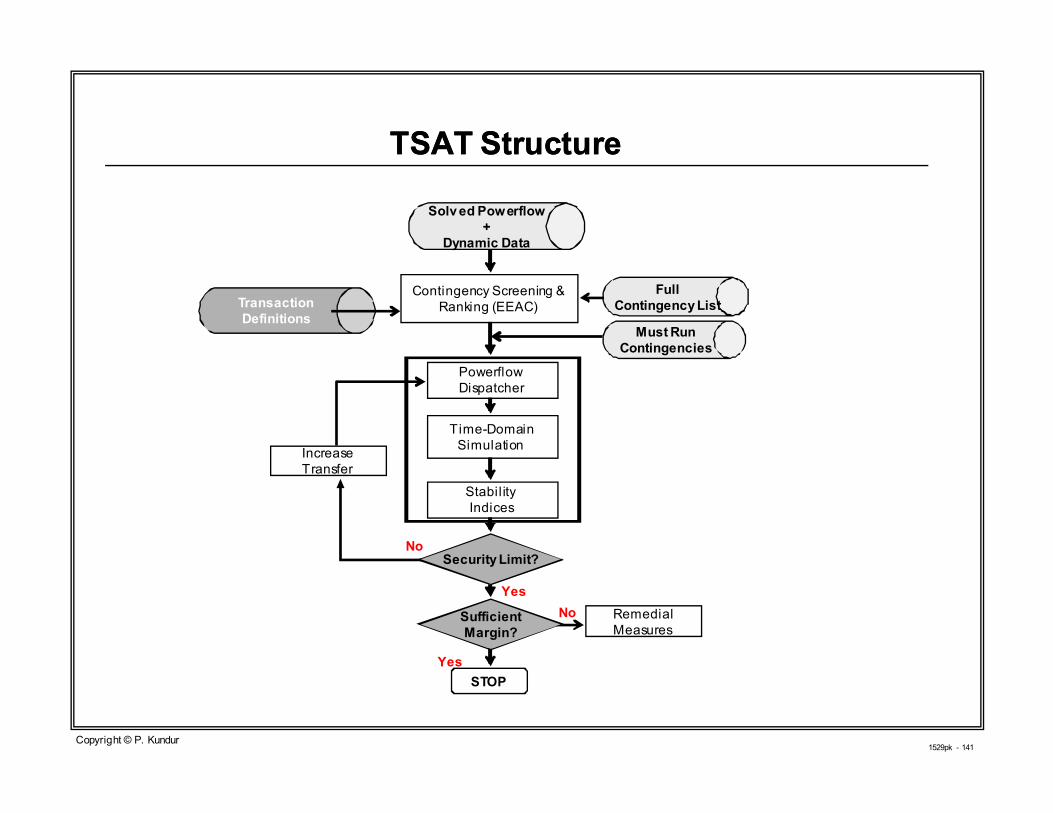
TSAT StructureTSAT Structure
Powerflow
Dispatcher
Time-Domain
Simulation
Stability
Indices
Increase
Transfer
Remedial
Measures
Must Run
Contingencies
Transaction
Definitions
Security Limit?
Sufficient
Margin?
STOP
Yes
Yes
No
Full
Contingency List
Solved Powerflow
+
Dynamic Data
Contingency Screening &
Ranking (EEAC)
No
1529pk - 142Copyright © P. Kundur
Computational Performance of DSAComputational Performance of DSA
� Target cycle time from capture of state estimation to completion
of security assessment for all specified transactions:
� 20 minutes
� TSA and VSA functions performed in parallel
� distributed processing on separate CPUs
� This can be readily achieved with low cost PCs

1529pk - 143Copyright © P. Kundur
Computational Speed of DSA Computational Speed of DSA (cont'd)(cont'd)
Voltage Stability Assessment:- screening 300 contingencies 20.0 secs
- detailed security analysis 1.2 secswith 20 critical contingencies
- one transfer limit search 12.0 secs
Transient Stability Assessment:
- screening 100 contingencies 75.0 secs- 10 second simulations with 75.0 secs
10 critical contingencies
- one transfer limit search 120.0 secs- total time for complete assessment < 5 mins
Power System model with 4655 buses, 156 generators, using 1.7 GHz,
Pentium 4 PC with 256 MB memory

1529pk - 144Copyright © P. Kundur
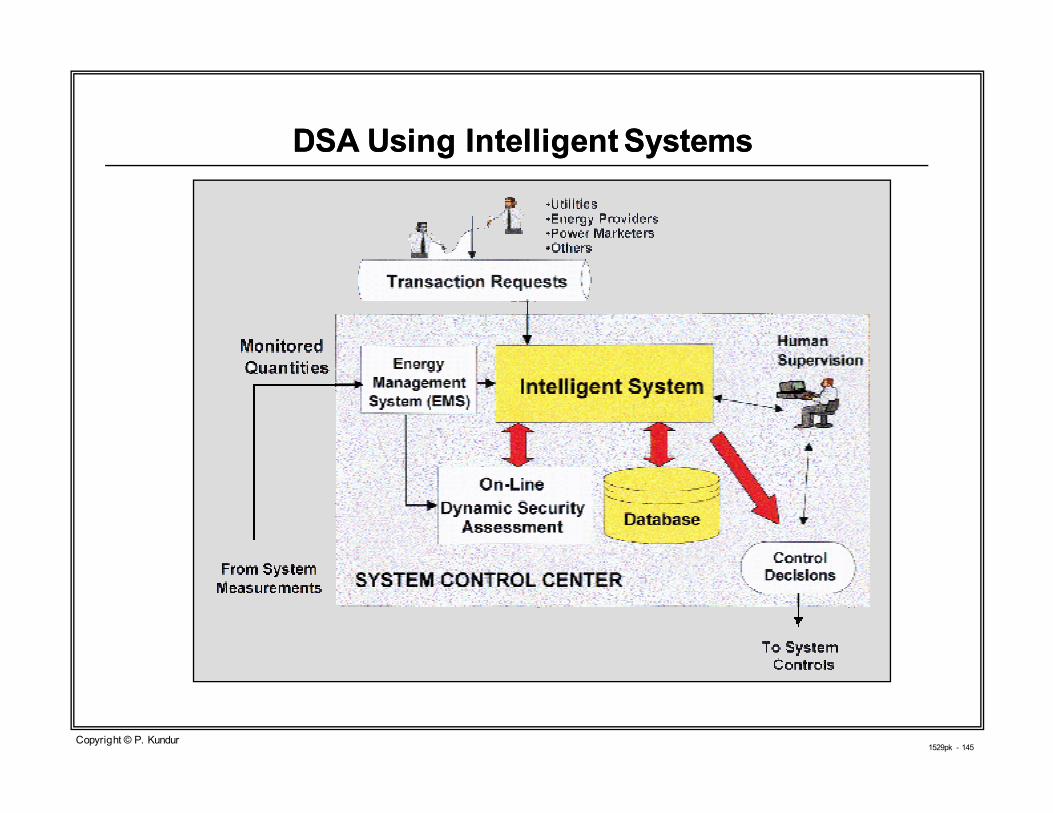
Future Trends in DSA: Intelligent SystemsFuture Trends in DSA: Intelligent Systems
� Knowledge base created using simulation of a large number cases and
system measurements
� Automatic learning, data mining, and decision trees to build intelligent
systems
� Fast analysis using a broad knowledge base and automatic decision making
� Provides new insight into factors and system parameters affecting stability
� More effective in dealing with uncertainties and large dimensioned problems
� We just completed a PRECARN project: "POSSIT"
1529pk - 145Copyright © P. Kundur
DSA Using Intelligent SystemsDSA Using Intelligent Systems
1529pk - 146Copyright © P. Kundur
RealReal--Time Monitoring and Control: Time Monitoring and Control:
An Emerging TechnologyAn Emerging Technology
� Advances in communications technology have made it possible to
� monitor power systems over a wide area
� remotely control many functions
� Research on use of multisensor data fusion technology
� process data from different monitors, integrate and process information
� identify phenomenon associated with impending emergency
� make intelligent control decisions
� A fast and effective way to predict onset of emergency conditions and
take remedial actions
The ultimate "self-healing" power system !
1529pk - 147Copyright © P. Kundur
Distributed Generation (DG)Distributed Generation (DG)
� Offer significant economic, environmental and security benefits
� Microturbines
� small, high speed power plants
� operate on natural gas or gas from landfills
� Fuel Cells
� combines hydrogen with oxygen from air to generate electricity
� hydrogen may be supplied from an external source or generated inside
fuel cell by reforming a hydrocarbon fuel
� Not vulnerable to power grid failure due to system instability or
natural calamities
� protection and controls should be designed so that units continue to
operate when isolated from the grid

1529pk - 148Copyright © P. Kundur
Reliability Management SystemReliability Management System
� Roles and responsibilities of individual entities
� well chosen, clearly defined and properly enforced
� Coordination of reliability management
� Need for a single entity with overall responsibility for security of
entire interconnected system
� real-time decisions
� System operators with high level of expertise in system stability
� phenomena, tools
1529pk - 149Copyright © P. Kundur
SummarySummary
1. The new electricity supply industry presents increasing challenges for
stable and secure operation of power systems
2. State-of-the-art methods have advanced our capabilities significantly
� comprehensive stability analysis tools
� automated tools for system planning/design
� on-line Dynamic Security Assessment (DSA)
� coordinated design of robust stability controls
3. Industry is yet to take full advantage of these developments
cont'd
1529pk - 150Copyright © P. Kundur
SummarySummary (cont'd)(cont'd)
4. Future directions will be to explore new techniques which can
better deal with growing uncertainties and increasing
complexities of the problem
� risk-based security assessment
� intelligent systems for DSA
� "self-healing" power systems
� real-time monitoring and control
5. Wide-spread use of distributed generation could be a cost
effective means of minimizing the impact of power grid failures