power transactions and trends q2 2018 - ernst & young...4 power transactions and trends q2 2018...
TRANSCRIPT

Power transactions and trendsQ2 2018

ContentsOverview
Americas
Europe
Asia-Pacific
Africa and the Middle East
Page 3
Page 11
Page 23
Page 35
Page 47
Appendix Page 54

3 Power transactions and trends Q2 2018
0
20
40
60
80
100
120
140
160
0
20
40
60
80
100
120
Q2 2016 Q3 2016 Q4 2016 Q1 2017 Q2 2017 Q3 2017 Q4 2017 Q1 2018 Q2 2018
Num
ber o
f dea
ls
US$
b
Generation Integrated OthersRenewables T&D Gas distributionWater and wastewater Retail Volume
Power transactions and trends Q2 2018Overview
US$83b global deal value
US$27.4b largest deal of the quarter
46% of deal volume in renewables
Chart 2: Global P&U deal value by segment(announced asset and corporate-level deals, Q2 2016–Q2 2018)
0
20
40
60
80
100
120
140
160
0
20
40
60
80
100
120
Q2 2016 Q3 2016 Q4 2016 Q1 2017 Q2 2017 Q3 2017 Q4 2017 Q1 2018 Q2 2018
Num
ber o
f dea
ls
US$
b
Americas Asia-Pacific Europe Africa and Middle East Volume
Chart 1: Global P&U deal value and volume by region (announced asset and corporate-level deals, Q2 2016–Q2 2018)

4 Power transactions and trends Q2 2018
China’s Belt and Road Initiative saw it lead global outbound investment in Q2 with US$31.2b of announced cross-border energy deals. Much of this value (US$27.4b) was attributable to the takeover bid by China Three Gorges of Portugal’s EDP, which owns transmission and distribution (T&D) assets across Europe.
China is making inroads to Europe Renewable energy investment continuesAs in previous quarters, we saw a large number (63) of renewables deals, which contributed US$12.9b.
During Q2 2018, the global power and utilities (P&U) sector witnessed an interesting deal environment, marked by high historical deal value (though a 14% decline from Q1) and a 2.5x increase in outbound investment. A number of key themes are shaping M&A trends:
Around the world, we see utilities exploring new technologies, including battery storage, electric vehicle (EV) infrastructure and digital grid technologies. Sweden’s Vattenfall plans to become Europe’s largest operator of EV charging infrastructure by 2023, targeting an investment of US$119m. This quarter saw Japan’s TEPCO launch a subsidiary, TEPCO Ventures, which will develop and form joint ventures around the development of disruptive technologies, including distributed generation, storage, drones, Internet of Things technologies and power infrastructure.
More utilities are investing in new energy technologyThis quarter saw the emergence of some different countries in significant deal activity. Thailand hosted US$5.3b of deals, India saw US$3.2b of deals and, in Estonia, deals by both domestic and foreign investors totaled US$600m.
Developing markets accelerate M&A
Overview
Outbound investment soars

5 Power transactions and trends Q2 2018
Quarterly investment profileAmericas Europe Asia-Pacific Africa and the Middle East
Deal value decreased slightly to US$26.9b.
The quarter saw US$18.4b investment in integrated and renewable assets.Most integrated deals were conducted with an aim to expand geographical footprint and increase customer base.
US federal tax reforms are making an impact in the sector with investor-owned gas and electric utilities preparing to return billions to ratepayers nationwide.Several utility holding companies and diversified utilities with competitive generation segments have announced plans to raise capital through equity and debt issuances or plans to reduce capital expenditures to maintain credit metrics.
M&A rebounded with US$45.7b of deal value, which made up 55% of total global deal value for the quarter.
The European Union’s updated Renewable Energy Directive sets a target of 32% renewables by 2030, which is expected to drive small-scale solar installations.
Deal value almost doubled to US$10.3b from Q1 (US$5.8b).
China’s solar subsidy reduction halted development of new solar farms and resulted in an oversupply of panels. Analysts estimate that global solar panel market prices will drop 24%, which is expected to stimulate demand and drive more installations around the world.
Europe continues to be the region’s main investor, as both financial sponsors and corporates look for opportunities outside their home markets.
In March, the European Investment Bank (EIB) signed a US$25m financing plan for the installation of off-grid solar systems that will improve access to energy, particularly in Ethiopia, Kenya, Tanzania, Nigeria and Uganda.
Across the Middle East, governments are driving investment in renewables as many increase their countries’ clean energy targets.
Analysts expect that a total of 22 GW of solar capacity will be installed in Bahrain, Jordan, Oman, Saudi Arabia and the United Arab Emirates (UAE) by 2023.
Q2 at a glanceOverview

6 Power transactions and trends Q2 2018
Capital outlookAmericas Europe Asia-Pacific Africa and the Middle East
As federal interest rates climb, US utilities’ dividend yield premium relative to interest rates has fallen, making income investment in utilities less attractive.
Investment in renewable energy will continue due to state-based policies. New York has launched a US$1.5b tender for renewables under the state’s Clean Energy Standard (CES) that mandates a state-based renewable target of 50% by 2030.
Renewable investments will increase in the region. As part of its latest energy plan, the Danish Government announced in April that it would develop an 800 MW offshore wind farm by 2027. The French Government has announced plans to launch a 300 MW solar power tender.
Germany and Spain will emerge as hotspots. The German federal network agency for electricity, gas, telecommunications, post and railway has commenced a tender for 670 MW of onshore wind capacity in the country. Spain’s Solaria Energía y Medio Ambiente plans to develop 1.3 GW of solar photovoltaic (PV) capacity by 2020.
Chinese utilities continue to drive cross-border M&A as demonstrated by the US$27b bid for EDP assets in Europe.
We expect Chinese outbound investment activity to continue in line with the country’s ambitious Belt and Road Initiative.
Rural off-grid electrification is growing in Africa. The Ghanaian Government will invest US$230m to promote renewable energy, particularly in off-grid communities.
Egypt will emerge as an investment hotspot. In May, Chinese integrated energy service provider Golden Concord Group signed an memorandum of understanding (MoU) with the Egyptian Government to build a solar panel production facility at a cost of up to US$2b.
Investment in new technology is expected to scale up in the region, as evident from the formation of China’s Cathay Smart Energy Fund to invest in emerging technologies, including the Internet of Things, energy storage, distributed energy, smart energy and low carbon activities.
Overview
Q2 at a glance (continued)

7 Power transactions and trends Q2 2018
SwitzerlandInvestment valueUS$5.4b (12%)
Investment activity globally by country, Q2 2018*
Top investment destinations Top outbound investing countries
USInvestment valueUS$20.2b (24%)
CanadaInvestment valueUS$3.5b (4%)Investment valueUS$2.3b (5%)
IndiaInvestment valueUS$3.2b (4%)
BermudaInvestment valueUS$1.2b (5%)
Rest of the worldInvestment valueUS$9.5b (11%)
Rest of the worldInvestment valueUS$2.6b (5.7%)
TotalInvestment value US$83.0bInvestment value US$45.1b
ChinaInvestment valueUS$31.2b (69%)
ItalyInvestment valueUS$2.5b (5%)
PortugalInvestment valueUS$27.4b (33%)
GermanyInvestment valueUS$5.4b (6%)
ThailandInvestment valueUS$5.3b (6%)
SpainInvestment valueUS$4.9b (6%)
FranceInvestment valueUS$3.6b (4%)
*Note: Percentages may not add to 100% due to rounding.
Overview
Global capital flows

8 Power transactions and trends Q2 2018
Overview
Valuation dashboard
1: nm: no meaningful dataNote: Only subsegments where data is available for three or more utilities are included. Please see the appendix for the detailed definition of each trading multiple, the company subsegment definitions and the company tagging for the valuations analysis.
EV/NTM EBITDA multiple compared with historic averages
Current EV/EBITDA multiple trading a premium (>20%)
Current EV/EBITDA multiple trading a slight premium (0% to 20%)
Current EV/EBITDA multiple trading a slight discount (0% to 20%)
Current EV/EBITDA multiple trading a discount (>-20%)
EBITDA CAGR
Negative EBITDA CAGR (<0)
Low EBITDA CAGR (0% to 5%)
Moderate EBITDA CAGR (5% to 10%)
High EBITDA CAGR (≥10%)
Current EV/EBITDA multiple Historic EV/EBITDA multiple Forward EBITDA CAGR Historic EBITDA CAGRThe market capitalization weighted average of the current enterprise value (EV) (at June 2018)/next 12 months (NTM) (at June 2018) adjusted earnings before interest, tax, depreciation and amortization (EBITDA)
The market capitalization weighted five-year average of the actual quarterly EV/actual quarterly adjusted EBITDA (from June 2013 to June 2018)
Two-year forward (from Q2 2018) forecast compound annual growth rate (CAGR) of the market capitalization weighted adjusted EBITDA
Five-year historic (from Q2 2018) actual CAGR of the market capitalization weighted adjusted EBITDA
Generation 8.2x 12.1x 0.7% -1.3%
Large market capitalization integrated 10.4x 9.9x 4.2% 4.2%
Medium and small market capitalization integrated 8.3x 10.6x -4.6% 1.3%
Renewables 3.3x 9.4x 27.8% -3.5%
Retail 5.4x 9.3x -5.8% -2.8%
Gas utility 11.4x 14.9x 8.7% -4.5%
Water and wastewater 13.3x 12.1x 4.1% 6.4%
Americas sector 10.2x 10.5x 4.0% 3.1%
Integrated 8.2x 7.5x 7.2% -3.0%
Renewables 7.7x 5.2x 19.2% 32.7%
Gas utility 11.0x 13.8x 4.7% -10.4%
Water and wastewater 8.2x nm1 nm nm
Europe sector 8.8x 6.6x 10.4% 6.4%
Generation 8.5x nm nm nm
Integrated 9.1x 13.0x 10.0% 0.1%
Renewables 10.4x nm nm nm
Retail 8.1x nm nm nm
T&D 8.5x nm nm nm
Gas utility 8.3x 9.3x 4.5% -2.9%
Water and wastewater 7.3x 7.7x -18.2% 5.5%
Asia-Pacific sector 8.6x 10.0x -1.3% 0.9%
Americas Europe Asia-Pacific► The Asia-Pacific
sector traded at the lowest average current EV/EBITDA multiple of all regions.
► The Americas P&U sector traded at an average current EV/EBITDA multiple of 10.2x during Q2, a 3% discount to the average historic EV/EBITDA multiple of 10.5x.
► The region’s average sector multiple remains above both Asia-Pacific and Europe.
► The Europe P&U sector traded at an average current EV/EBITDA multiple of 8.8x during Q2, a 33% premium to the average historic EV/EBITDA multiple of 6.6x.
► Europe was the only region where the current EV/EBITDA multiple traded at a premium to average historic multiples.
Valuations

9 Power transactions and trends Q2 2018
Overview
Total shareholder return (TSR) dashboard
TSR values Negative TSR
Low TSR Moderate TSR High TSR
Quarter-to-date TSR
<0% 0%–3% 3%–6% >6%
Year-to-date TSR <0% 0%–4% 4%–7% >7%
Five-year-to-date TSR
<0% 0%–44% 44%–89%
>89%
Note: Please see the appendix for the detailed definition of each trading multiple, the company subsegment definitions and the company tagging for the valuations analysis.
Americas Europe Asia-Pacific► Gas utilities provided
investors with the best returns both year-to-date and quarter-to-date.
► Water and wastewater companies and gas utilities stood out for their TSR performance, a trend that was not replicated in other regions.
► Renewables was the stand-out subsegment, achieving high EBITDA growth and TSR compared with other regions.
Valuations
Quarter-to-date TSR Year-to-date TSR Five-year-to-date TSRTSR in % (from 1 April 2018 to 1 July 2018) TSR in % (from 1 January 2018 to 1 July
2018)TSR in % (from 1 July 2013 to 1 July 2018)
Generation 4.4% 8.4% 3.3%
Large market capitalization integrated 3.5% 2.0% 71.2%
Medium and small market capitalization integrated 4.3% 2.1% 67.5%
Renewables -0.7% -9.1% -49.2%
Retail -15.6% -21.3% -5.5%
Gas utility 11.2% 8.4% 122.3%
Water and wastewater 7.0% 3.3% 126.8%
Americas sector 2.0% -0.9% 48.1%
Integrated 1.2% 11.2% 77.0%
Renewables 2.4% 4.8% 91.0%
Gas utility 1.2% 1.4% 63.4%
Water and wastewater -0.8% -14.2% 49.4%
Europe sector 1.0% 0.8% 70.2%
Generation -13.7% -9.4% 7.3%
Integrated -2.2% -3.4% 4.6%
Renewables -9.3% -16.4% nm
Retail -2.2% -7.1% 14.3%T&D -4.1% -11.1% 54.6%Gas utility 4.7% 11.7% -3.1%
Water and wastewater -13.3% -23.2% 6.2%
Asia-Pacific sector -5.1% -7.1% 14.0%

10 Power transactions and trends Q2 2018
Miles HuqEY Global P&U TAS LeaderBaltimore, Maryland, US
Miles Huq became EY Global Power & Utilities Transactions Leader in April 2018. Based in the Northeast US Region, Miles has more than 20 years’ experience in corporate finance, with a particular focus on P&U. Miles holds an MBA from Duke University, and he is also a certified public accountant (CPA) in Maryland and is a member of the American Institute of Certified Public Accountants. Miles has assisted and advised on more than 200 M&A engagements involving major integrated electric, gas and water utilities, as well as renewable energy and cleantechtransactions.
+1 410 783 [email protected]@MilesHuq
Sara Richardson EY Global P&U TAS Associate Director and Resident
+61 7 3243 3758 [email protected]@sararichardson2
Shikhar Gupta EY Global P&U Analyst
+91 124 470 1233 [email protected]@ShikharGupta_EY
Anjushi Joshi EY Global P&U Analyst
+91 124 619 2734 [email protected]@anjushi_joshi
Overview
EY Global Transaction Advisory Services P&U contacts

AmericasConsolidation drives deal activity

12 Power transactions and trends Q2 2018
Power transactions and trends Q2 2018Americas
“Revenue pressures from tax reform and subdued demand are prompting further consolidation of integrated utilities – a trend that will drive M&A through 2018.”
Miles Huq,EY Global P&U TAS Leader
Transaction highlights► Largest deal in integrated segment:
CenterPoint Energy announced plans to acquire Vectren Corp., a US-based utility engaged in retail and energy services, for US$8b.
► Corporate investors take lead in dealmaking: Corporate investors completed 26 deals, which contributed 80%, or US$21.5b, of the region’s deals.
► Utilities divest generation assets: AltaGas sold a 35% stake in three hydroelectric facilities for US$709m to assist with funding the acquisition of WGL Holdings. As part of a US$6.5b deal, Southern Company sold its stake in a number of gas generation plants to NextEra in a bid to reduce debt, preserve credit ratings and improve the overall contribution of state-regulated utilities.
deal value, 8% decline from Q1US$26.9b
US$13.8bdeal value in integrated assets, driven by two megadeals
0
5
10
15
20
25
30
35
40
45
0
10
20
30
40
50
60
Q2 2016 Q3 2016 Q4 2016 Q1 2017 Q2 2017 Q3 2017 Q4 2017 Q1 2018 Q2 2018
Num
ber o
f dea
ls
US$
b
Generation Integrated Others
Renewables T&D Gas distribution
Water and wastewater Retail Volume
Chart 3: Americas deal value and volume, by segment(asset and corporate-level deals, Q2 2016–Q2 2018)

13 Power transactions and trends Q2 2018
In the US, federal tax reforms on regulated utilities are starting to make an impact. These reforms require regulated utilities to pass on tax cuts to customers via lower rates, putting pressure on revenues. To maintain credit ratings, some companies have responded to the reforms by raising additional equity:► In May, PPL Corporation launched Q2’s biggest capital offering of the
sector to raise US$1.7b.► In June, Entergy Corp. raised US$1.2b.► Southern Company and Duke Energy have announced plans to raise
additional equity this year. These capital raises will provide short-term relief while regulators decide how to best compensate utilities.Revenue pressures are also prompting further consolidation of these utilities. More than half of the quarter’s deal value (US$13.8b) was contributed by two corporate acquisitions of integrated utilities looking to expand their customer bases.
Utilities are raising capital as tax reforms hit World’s biggest energy storage project
In June, Pacific Gas and Electric Company (PG&E) requested regulatory approval for the development of four energy storage projects totaling approximately 567 MW to replace three gas plants operating on a Reliability Must Run (RMR) contract. One of the four projects will be owned by PG&E, while the other three will be owned by a number of third parties. The decision to install what will likely be the world’s largest utility-owned storage project demonstrates the increasing economics of large-scale storage. If approved by the California Public Utilities Commission (CPUC), the first of PG&E’s proposed projects is scheduled to come online by the end of 2019, with the other projects scheduled for completion by the end of 2020.
Americas
Companies using M&A to adapt to change
“Decreases in battery prices are enabling energy storage to become a competitive alternative to traditional solutions … We believe that battery energy storage will be even more significant in enhancing overall grid reliability, integrating renewables and helping customers save energy and money.”2
Roy Kuga,Vice President of Grid Integration and Innovation, PG&E
2: https://www.pge.com/en/about/newsroom/newsdetails/index.page?title=20180629_pge_proposes_four_new_cost-effective_energy_storage_projects_to_cpuc.

14 Power transactions and trends Q2 2018
Miles Huq,EY Global P&U TAS Leader
“Brazil is set to attract huge investment over the next few years, including a planned US$38b from State Grid Corporation of China.”
75% of deal value was contributed by the US.
The majority of transactions — 78% (US$21.1b) —were domestic deals.
Expect activity in Brazil to pick up during 2018.
Americas
US dominates Q2 activity
Americas regional capital flows, Q2 2018*
Top investment destinations Top outbound investing countries
USInvestment valueUS$20.2b (75%)
CanadaInvestment valueUS$3.5b (13%)Investment valueUS$2.3b (62%)
BrazilInvestment valueUS$2.3b (9%)
BermudaInvestment valueUS$1.2b (31%)
Rest of the regionInvestment valueUS$0.8b (3%)
Rest of the regionInvestment valueUS$0.3b (7%)
TotalInvestment value US$26.9bInvestment value US$3.8b
*Note: Percentages may not add to 100% due to rounding.

15 Power transactions and trends Q2 2018
Announcement date
Target Target country/bidder country
Bidder Deal value (US$)
Bidder rationale Segment
23 April Vectren Corporation US/US CenterPoint Energy Inc.
8.1b Leverages growing financial resources to expand competitive energy services across a larger US footprint with a view to also improve customer service levels
Integrated
21 May Gulf Power Company US/US NextEra Energy Inc.
5.8b Improves NextEra’s financial position and expands its customer base by 450,000 customers
Integrated
17 April AES Eletropaulo Brazil/Italy Enel S.p.A. 2.3b Furthers Enel’s strategy to strengthen its presence in the Brazilian distribution sector
T&D: electricity
7 June SJW Group US/US California Water Service Group
1.9b Transaction will improve operational efficiencies
Water and wastewater
9 May Enbridge Inc. (49% in select wind assets)
Canada/Canada Canada Pension Plan Investment Board (CPPIB)
1.3b Aligns with CPPIB’s strategy to expand into the North American wind market
Renewables: wind
All deal values indicated are announced deals with disclosed enterprise values comprised of equity and debt components.
The integrated CenterPoint/Vectren company will have:
2.5 million
electricity customers
4.5 million
gas customers
US$29basset base
Americas
Top five Americas deals – Q2 2018
16 Power transactions and trends Q2 2018
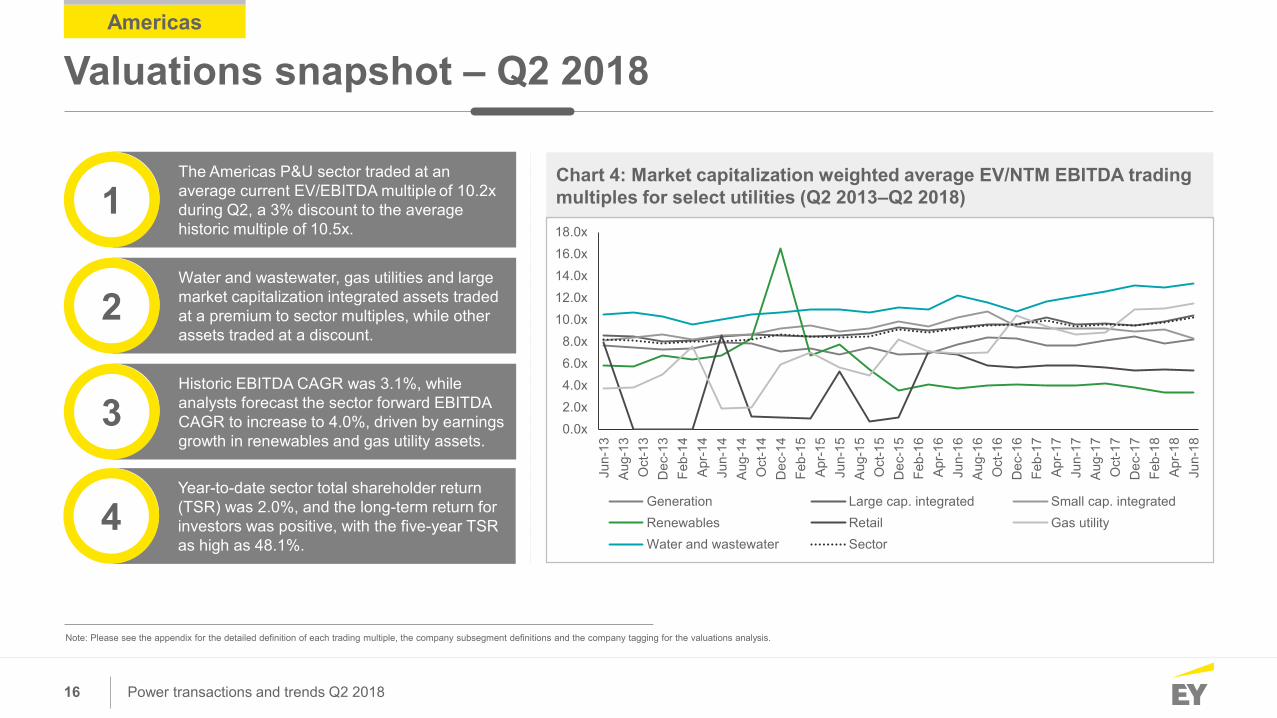
Chart 4: Market capitalization weighted average EV/NTM EBITDA trading multiples for select utilities (Q2 2013–Q2 2018)
The Americas P&U sector traded at an average current EV/EBITDA multiple of 10.2x during Q2, a 3% discount to the average historic multiple of 10.5x.
1
Water and wastewater, gas utilities and large market capitalization integrated assets traded at a premium to sector multiples, while other assets traded at a discount.
2
Historic EBITDA CAGR was 3.1%, while analysts forecast the sector forward EBITDA CAGR to increase to 4.0%, driven by earnings growth in renewables and gas utility assets.
3
Year-to-date sector total shareholder return (TSR) was 2.0%, and the long-term return for investors was positive, with the five-year TSR as high as 48.1%.
4
Americas
Valuations snapshot – Q2 2018
Note: Please see the appendix for the detailed definition of each trading multiple, the company subsegment definitions and the company tagging for the valuations analysis.
0.0x2.0x4.0x6.0x8.0x
10.0x12.0x14.0x16.0x18.0x
Jun-
13Au
g-13
Oct
-13
Dec
-13
Feb-
14Ap
r-14
Jun-
14Au
g-14
Oct
-14
Dec
-14
Feb-
15Ap
r-15
Jun-
15Au
g-15
Oct
-15
Dec
-15
Feb-
16Ap
r-16
Jun-
16Au
g-16
Oct
-16
Dec
-16
Feb-
17Ap
r-17
Jun-
17Au
g-17
Oct
-17
Dec
-17
Feb-
18Ap
r-18
Jun-
18
Generation Large cap. integrated Small cap. integratedRenewables Retail Gas utilityWater and wastewater Sector

17 Power transactions and trends Q2 2018
Chart 5: Market capitalization weighted adjusted EBITDA CAGR for select utilities
Chart 6: Total shareholder return for select utilities
Sources: Bloomberg, EY analysis
Americas
Valuations snapshot – Q2 2018 (continued)
0.7%
4.2%
-4.6%
27.8%
-5.8%
8.7%
4.1% 4.0%
-1.3%
4.2%
1.3%
-3.5% -2.8%-4.5%
6.4%
3.1%
Generation Large cap.integrated
Small cap.integrated
Renewables Retail Gas utility Water andwastewater
Sector
Two-year forward Five-year-to-date
4.4% 3.5% 4.3%
-0.7%
-15.6%
11.2%7.0%
2.0%8.4%
2.0% 2.1%
-9.1%
-21.3%
8.4%3.3%
-0.9%
3.3%
71.2%67.5%
-49.2%
-5.5%
122.3%126.8%
48.1%
Generation Large cap.integrated
Small cap.integrated
Renewables Retail Gas utility Water andwastewater
Sector
Quarter-to-date Year-to-date Five-year-to-date

18 Power transactions and trends Q2 2018
Americas
Valuations snapshot – Q2 2018 (continued)
► Companies traded at an average current EV/EBITDA multiple of 8.2x, a 33.0% discount to the historic average multiple of 12.1x.
► The current EV/EBITDA multiple traded at a discount of 20% to the current average sector multiple, indicating potential undervaluation of this asset class compared with others.
► Over the past five years, the historic EBITDA CAGR was -1.3%, which is expected to rise to 0.7% over the next two years.
► Quarterly TSR performance was 4.4%, compared with a year-to-date TSR of 8.4% and a five-year TSR of 3.3%.
Generation► Companies traded at an average current EV/EBITDA
multiple of 10.4x, a 5% premium to the historic average multiple of 9.9x.
► The current EV/EBITDA multiple traded at a premium of 2% to the current average sector multiple, indicating slight overvaluation of this asset class compared with others.
► Over the past five years, the historic EBITDA CAGR was 4.2%, and analysts predict this to grow at the same rate (4.2%) over the next two years.
► Quarterly TSR performance was 3.5%, compared with a year-to-date TSR of 2.0% and a five-year TSR of 71.2%.
► The five-year TSR was driven by high shareholderreturns delivered by NextEra Energy (146%) andAmeren Corporation (117%).
Large integrated► Companies traded at an average current EV/EBITDA
multiple of 8.3x, a 22% discount to the historic average multiple of 10.6x.
► The current EV/EBITDA multiple traded at a discount of 18% to the current average sector multiple, indicating potential undervaluation of this asset class compared with others.
► Over the past five years, the historic EBITDA CAGR was 1.3%; however, analysts predict this to decline to -4.6% over the next two years.
► Quarterly TSR performance was 4.3%, compared with a year-to-date TSR of 2.1% and a five-year TSR of 67.5%.
► The five-year TSR was driven by high shareholderreturns delivered by Vectren Corp. (153%) andAvista Corporation (129%).
Medium and small integrated

19 Power transactions and trends Q2 2018
Americas
Valuations snapshot – Q2 2018 (continued)
► Companies traded at an average current EV/EBITDA multiple of 3.3x, a 65% discount to the historic average multiple of 9.4x.
► The current EV/EBITDA multiple traded at a discount of 67% to the current average sector multiple, indicating potential undervaluation of this asset class compared to others.
► Over the past five years, the historic EBITDA CAGR was -3.5%; however, analysts predict this to increase to 27.8% over the next two years.
► Quarterly TSR performance was -0.7%, compared with a year-to-date TSR of -9.1% and a five-year TSR of -49.2%.
► Pattern Energy Group shares declined 14.8%, while shares of AES Tietê Energiadropped 23% in year-to-date prices.
► Several factors have contributed to declined returns:► Drought in Brazil has impacted the business of hydropower-generating utilities.► US policy uncertainty around renewables has shaken investor confidence.► Canada’s Ontario Government introduced legislation allowing it to cancel 758
renewable energy contracts, almost all involving solar, that have not met key milestones.
Renewables► Companies traded at an average current EV/EBITDA multiple of 5.4x, a 42.0%
discount to the historic average multiple of 9.3x. ► The current EV/EBITDA multiple traded at a discount of 47% to the current average
sector multiple, indicating potential undervaluation of this asset class compared with others.
► Over the past five years, the historic EBITDA CAGR was -2.8%, which is expected to further decline to -5.8% in the next two years.
► Quarterly TSR performance was -15.6%, compared with a year-to-date TSR of -21.3% and a five-year TSR of -5.5%.
Retail z

20 Power transactions and trends Q2 2018
Americas
Valuations snapshot – Q2 2018 (continued)
► Companies traded at an average current EV/EBITDA multiple of 11.4x, a 23% discount to the historic average multiple of 14.9x.
► The current EV/EBITDA multiple traded at a premium of 10% to the current average sector multiple, indicating potential overvaluation of this asset class compared with others.
► Over the past five years, the historic EBITDA CAGR was -4.5%; however, analysts predict this to increase to 8.7% over the next two years.
► Quarterly TSR performance was 11.2%, compared with a year-to-date TSR of 8.4% and a five-year TSR of 122.3%.
► The high five-year TSR values are driven by Atmos Energy Corp. (154%) and New Jersey Resources Corp. (158%). These utilities have delivered high returns and increased investor confidence through their ownership of rate-regulated assets and a growing customer base.
Gas► Companies traded at an average current EV/EBITDA multiple of 13.3x, a 10%
premium to the historic average multiple of 12.1x. ► The current EV/EBITDA multiple traded at a premium of 31% to the current
average sector multiple, indicating potential overvaluation of this asset class compared with others.
► High premiums were reflected in the US$1.9b acquisition of SJW Group by California Water Service Group, which represented a premium of 9% over SJW’s last trading day closing share price, which caused a 2% increase in enterprise value that day.
► Over the past five years, the historic EBITDA CAGR was 6.4%; however, analysts predict this to decrease to 4.1% over the next two years.
► Quarterly TSR performance was 7%, compared with a year-to-date TSR of 3.3% and a five-year TSR of 126.8%.
► The rebound in quarterly TSR value was driven by the high quarterly TSR of SJW Group (26%).
Water and wastewater z

21 Power transactions and trends Q2 2018
US$1tAmerican Council on Renewable Energy target for private sector investment in clean energy by 2030
Renewable energy investment to continue: New York has launched a US$1.5b tender for renewables under the state’s Clean Energy Standard (CES) that mandates a state-based renewable target of 50% by 2030. The aim is to develop 20 utility-scale projects. MidAmerican Energy Company is planning to invest US$922m to build a 591 MW wind project in Iowa. The American Council on Renewable Energy launched a campaign to attract US$1t in new US private sector investment by 2030 for both clean energy and enabling grid technologies. Sempra Energy is planning to sell its US wind and solar assets with a combined capacity of about 2,600 MW to optimize its portfolio.
Latin America continues to be an investment hotspot: Bow Power, a Spanish utility, is planning to build a 157 MW solar PV plant in southern Peru with an investment totaling US$215m. Columbian utility EPM is planning to sell US$1b of assets to fund its ongoing constructing of the 2.4 GW Ituango hydroelectric dam project.
Brazil to attract more investment: State Grid Corporation of China (SGCC) has announced plans to invest US$38b in Brazil over the next five years, with more than 60% of this to be directed to the transmission sector. Work should start soon on 33 renewable energy projects (totaling 1,024.5 MW of capacity at an average price of US$32.65/MWh) in contracts awarded under the A-4 energy auction run by Brazil’s energy regulator Agência Nacional de Energia Elétrica (ANEEL). The projects will be completed by 2022. ANEEL has also launched a tender for the construction, operation and maintenance of 2,600km of transmission lines and 23 substations across 16 states totaling US$1.6b.
Americas
M&A outlook and investment hotspots
“Investment in renewables and enabling technologies is set to soar in the US, creating diverse opportunities across the segment.”
Miles Huq,EY Global P&U TAS Leader
22 Power transactions and trends Q2 2018
Miles HuqEY Global P&U TAS LeaderUS Northeast P&U TAS LeaderBaltimore, Maryland, US
+1 410 783 [email protected]
Stephanie ChesnickUS P&U TAS LeaderHouston, Texas, US
+1 713 750 [email protected]
Rafael Aguirre SosaLatin America North P&U TAS Leader México, D.F., Mexico
+52 55 5283 [email protected]
Robert LeonardUS Southeast P&U TAS Leader Charlotte, North Carolina, US
+1 704 335 [email protected]
Lucio TeixeiraLatin America South P&U TAS LeaderSao Paulo, Brazil
+55 11 2573 [email protected]
Mitch FaneUS Southwest P&U TAS Leader Houston, Texas, US
+1 713 750 [email protected]
Robert A JozwiakUS Central P&U TAS LeaderChicago, Illinois, US
+1 312 879 [email protected]
Americas
EY Americas P&U Transaction Advisory Services contacts

EuropeChinese investors drive deal value

24 Power transactions and trends Q2 2018
Power transactions and trends Q2 2018Europe
“The EU mandate on clean energy is a landmark agreement that will shape the investment agenda of the region’s utilities.”
Miles Huq,EY Global P&U TAS Leader
Transaction highlights► Corporate investors drive deal value
and volume: These buyers conducted 42 deals worth US$36.2b in Q2.
► Increased M&A in energy services and new technology: Q2 saw US$5.5b attributed to energy services and new technology deals.
► Utilities divest assets to improve financials: Spanish energy services utility Abengoa sold off its 16.7% stake in Atlantica Yield for US$345m. Similarly, Orsted, a Danish utility, sold off its 50% stake in Enecogen, the Netherlands-based 870 MW gas-fired power plant, for an undisclosed value.
► More investment in generation: Four deals in gas and large hydro generation assets totaled US$1.3b.
total deal value, 26% decline from Q1 2018US$45.7b
EU-mandated renewable energy target by 2030 32%
0
10
20
30
40
50
60
70
0
10
20
30
40
50
60
70
Q2 2016 Q3 2016 Q4 2016 Q1 2017 Q2 2017 Q3 2017 Q4 2017 Q1 2018 Q2 2018
Nu
mb
er
of
de
als
US
$b
Generation Integrated Others
Renewables T&D Gas distribution
Water and wastewater Retail Volume
Chart 7: Europe deal value and volume, by segment(asset and corporate-level deals, Q2 2016–Q2 2018)

25 Power transactions and trends Q2 2018
The agreement by the European Union (EU) to achieve 32% renewable energy consumption by 2030 reflects the central role that clean energy, and the technologies that support it, are playing in Europe’s P&U sector. This new Renewable Energy Directive will also give consumers the right to produce, consume, store and sell excess generated power, which will see an increased uptake of small-scale solar installations and more investment in energy storage. The Directive also proposed the phaseout of palm oil from transport use by 2030, which will further drive the adoption of electric vehicles (EVs) across Europe.
Growing investment in clean energy
New EU mandate set to boost renewables China makes inroads into Europe
The largest announced deal (US$27.4b) of the European sector during Q2 was the unsolicited bid by China Three Gorges Corporation (CTG) to buy the remaining 76.7% stake in EDP (CTG is already EDP’s largest shareholder). CTG also bid to acquire EDP Renovaveis, the renewable energy arm of EDP, for US$1.3b. Both deals face big hurdles, but, if they complete, CTG will own 100% of both companies, representing the continuing deep inroads China is making into utility assets across the globe.
Europe
European utilities explore new technologies
We see boosted investment from European utilities in the technologies transforming their sector:► EDF will invest US$9.9b to develop 10 GW of energy storage by 2035. ► Austrian utility Wiener Netze awarded a contract to a consortium led by Siemens to deploy 1.6m smart meters.► In June, Engie acquired Flashnet, a Romanian Internet of Things company that develops intelligent energy management systems for cities. ► Enel X has partnered with IONITY to install 20 high-power EV charging stations in Italy by the end of 2019.

26 Power transactions and trends Q2 2018
► Total S.A. to acquire a 74.33% stake in Direct Energie for US$3.2b to allow expansion across the entire gas-electricity value chain
► Repsol S.A. to acquire low-emission electricity generation assets and the gas and electricity retail business of Spanish retailer Viesgo Espana for US$870m
The Repsol deal aligns with the company’s strategic plan to grow its gas and electricity customer base to 2.5 million and expand its market share beyond 5% by 2025.
Convergence driving dealsEurope

27 Power transactions and trends Q2 2018
Portugal dominated inbound investment due to the announced deal by China Three Gorges to buy the remaining stake in EDP.
Miles Huq,EY Global P&U TAS Leader
“We expect Germany and Spain to attract greenfield investment in the coming quarters as both countries have announced ambitious renewables developments.”
Portugal boosted by EDP deal Europe
Top investment destinations Top outbound investment regions
TotalInvestment value US$45.7bInvestment value US$8.9b
Europe regional capital flows, Q2 2018*UKInvestment value US$2.6b (6%)
GermanyInvestment value US$5.4b (12%)
PortugalInvestment value US$27.4b (60%)
SpainInvestment value US$4.9b (11%)
SwitzerlandInvestment value US$5.4b (60%)
ItalyInvestment value US$2.5b (28%)
FranceInvestment value US$0.6b (7%)US$3.6b (8%)
Rest of the regionInvestment value US$1.8b (4%)
Rest of the regionInvestment value US$0.5b (5%)
*Note: Percentages may not add to 100% due to rounding.

28 Power transactions and trends Q2 2018
Top five Europe deals – Q2 2018
Announcement date
Target Target country/bidder country
Bidder Deal value (US$)
Bidder rationale Segment
11 May Energias de Portugal S.A. (76.73% stake)
Portugal/China China Three Gorges Corporation
27.4b Aligns with CTG’s plan to make strategic investments in the European energy market
Integrated
25 May Techem GmbH Germany/ Switzerland
Caisse de depot et placement du Quebec; Ontario Teachers' Pension Plan; Partners Group Holding AG
5.4b Consortium plans to assist Techem to introduce new technologies and geographically expand its energy invoicing and energy management offerings
Others: energy services
18 April Direct EnergieS.A.
France/France Total S.A. 3.2b Furthers Total’s strategy to expand along the gas-electricity value chain
Retail
4 April Redexis Gas S.A. (50.1% stake)
Spain/China Universities Superannuation Scheme Limited; ATP Group; CNIC Corporation Limited; Guoxin Guotong Fund LLP
2.5b Supports buyers’ plans to seek growth opportunities
Gas distribution
11 May EDP Renovaveis, S.A.
Spain/China China Three Gorges Corporation
1.3b Supports CTG’s target of expanding into the European market
Renewables
All deals are announced deals, and the values indicated are disclosed enterprise values comprised of equity and debt components.
China’s growing presence in the European utilities market is reflected in three major deals this quarter.
Europe

29 Power transactions and trends Q2 2018
Chart 8: Market capitalization weighted average EV/NTM EBITDA trading multiples for select utilities (Q2 2013–Q2 2018)
Europe
Valuations snapshot – Q2 2018
The Europe P&U sector traded at an average current EV/EBITDA multiple of 8.8x during Q2, a 33% premium to the average historic multiple of 6.6x.
1
Gas utilities traded at a premium to sector multiples, while other assets traded at a discount.
2Historic EBITDA CAGR was 6.4%, while analyst forecast sector forward EBITDA CAGR to increase to 10.4% driven by earnings growth in renewable assets.
3Year-to-date sector total shareholder return (TSR) was 0.8%. However, over the long term, companies returned a high five-year TSR of 70.2%.
4
Note: Please see the appendix for the detailed definition of each trading multiple, the company subsegment definitions and the company tagging for the valuations analysis.
0.0x
2.0x
4.0x
6.0x
8.0x
10.0x
12.0x
14.0x
Jun-
13Au
g-13
Oct
-13
Dec
-13
Feb-
14Ap
r-14
Jun-
14Au
g-14
Oct
-14
Dec
-14
Feb-
15Ap
r-15
Jun-
15Au
g-15
Oct
-15
Dec
-15
Feb-
16Ap
r-16
Jun-
16Au
g-16
Oct
-16
Dec
-16
Feb-
17Ap
r-17
Jun-
17Au
g-17
Oct
-17
Dec
-17
Feb-
18Ap
r-18
Jun-
18
Integrated Renewables Gas utility Water and wastewater Sector

30 Power transactions and trends Q2 2018
Chart 9: Market capitalization weighted adjusted EBITDA CAGR for select utilities
Chart 10: Total shareholder return for select utilities
Europe
Valuations snapshot – Q2 2018 (continued)
Note: Adjusted EBITDA numbers for water and wastewater utilities were not available.
-29.4%
32.7%
-10.4%-2.4%
102.4%
19.2%
4.7%
42.1%
Integrated Renewables Gas utility Sector
Five-year-to-date Two-year forward
1.2% 2.4% 1.2%
-0.8%
1.0%
11.2%4.8% 1.4%
-14.2%
0.8%
77.0%
91.0%
63.4%
49.4%
70.2%
Integrated Renewables Gas utility Water and wastewater Sector
Quarter-to-date Year-to-date Five-year-to-date

31 Power transactions and trends Q2 2018
Europe
Valuations snapshot – Q2 2018 (continued)
► Companies traded at an average current EV/EBITDA multiple of 8.2x, a 10% premium to the historic average multiple of 7.5x.
► The current EV/EBITDA multiple traded at a discount of 6.2% to the current average sector multiple, indicating potential undervaluation of this asset class compared with others.
► Over the past five years, the historic EBITDA CAGR was -3.0%; however, analysts predict this to increase to 7.2% over the next two years.
► Quarterly TSR performance was 1.2%, compared with a year-to-date TSR of 11.2% and a five-year TSR of 77.0%.
► The decreasing TSR is attributable to negative returns from:
► Enel (quarterly TSR -9%, year-to-date TSR -6%)
► Polska Grupa Energetyczna S.A. (quarterly TSR -14%, year-to-date TSR -27%)
► ENEA (quarterly TSR -14%, year-to-date TSR -25%)
Integrated► Companies traded at an average current EV/EBITDA multiple of
7.7x, a 48% premium to the historic average multiple of 5.2x, indicating strong investor confidence.
► The current EV/EBITDA multiple traded at a discount of 13% to the current average sector multiple, indicating potential undervaluation of this asset class compared with others and indicating some further upside potential. The EU agreement on the Renewable Energy Directive should drive continued investor confidence in this asset class.
► Over the past five years, the historic EBITDA CAGR was 32.7%; however, analysts predict this to decrease to 19.2% over the next two years.
► Quarterly TSR performance was 2.4%, compared with a year-to-date TSR of 4.8% and a five-year TSR of 91.0%.
Renewables

32 Power transactions and trends Q2 2018
Europe
Valuations snapshot – Q2 2018 (continued)
► Companies traded at an average current EV/EBITDA multiple of 11.0x, a 20% discount to the historic average multiple of 13.8x.
► The current EV/EBITDA multiple traded at a premium of 25% to the current average sector multiple, indicating continued overvaluation of this asset class compared with others.
► Over the past five years, the historic EBITDA CAGR was -10.4%; however, analysts predict this to increase to 4.7% over the next two years.
► Quarterly TSR performance was 1.2%, compared with a year-to-date TSR of 1.4% and a five-year TSR of 63.4%.
Gas► Companies traded at an average current EV/EBITDA multiple of
8.2x.
► The current EV/EBITDA multiple traded at a discount of 6.6% to the current average sector multiple, indicating potential undervaluation of this asset class compared with others.
► Quarterly TSR performance was -0.8%, compared with a year-to-date TSR of -14.2% and a five-year TSR of 49.4%. The year-to-date TSR was negative for all utilities in the sample, driven by limited growth prospects for municipal water utilities in Europe and rising costs as compliance with the EU’s Water Framework Directive makes extraction more expensive.
Water and wastewater

33 Power transactions and trends Q2 2018
Greenfield development of renewables to continue: The French Government has announced plans to launch a 300 MW solar power tender. As part of its latest energy plan, the Danish Government announced in April that it would develop an 800 MW offshore wind farm by 2027. Spain’s Endesa is planning to spend US$68.8m to build an 84.9 MW solar PV plant in Totana, Spain. Scatec Solar, a renewable energy integrator based in Norway, has entered agreements with investment firm Rengy Development to develop three solar PV projects in Ukraine, with a combined capacity of 47 MW.
Investment in new technology to top the capital agenda: Orsted, a Danish utility, plans to build and operate a 20 MW battery storage project in the UK to support a grid stability project at National Grid. Sweden’s Vattenfall plans to become Europe’s largest operator of EV charging infrastructure by 2023, targeting a turnover of US$119m. Engie, Hitachi and Mitsubishi Motors are collaborating on a demonstration project to investigate the potential for EVs to act as energy storage within an office building. UK utility Centrica is working with LO3 – the US technology firm behind the pioneering Brooklyn Microgrid – to test a peer-to-peer electricity trading market in Cornwall, UK.
Germany and Spain to emerge as hotspots: Bundesnetzagentur, the German federal network agency for electricity, gas, telecommunications, post and railway, has commenced a tender for 670 MW of onshore wind capacity in the country. The tender, which marks the country’s third onshore wind auction in 2018, has set a bid price capped at US$0.074 per kWh. Solaria Energía y Medio Ambiente, a Spanish renewable utility, plans to develop 1.3 GW of solar PV capacity in Spain by 2020.
Europe
M&A outlook and investment hotspots
US$68.8mEndesa’s investment in an 84.9 MW Spanish solar PV plant
“Renewables and new energy technologies will top the investment agenda of Europe’s utilities through 2018.”
Miles Huq,EY Global P&U TAS Leader
34 Power transactions and trends Q2 2018
Umberto Nobile Mediterranean P&U TAS Leader Milan, Italy
+39 02 8066 93744 [email protected]
Michael Bruhn Nordics P&U TAS Leader Copenhagen, Denmark
+45 2529 3135 [email protected]
Stéphane Kraft Western Europe and Maghreb P&U TAS Leader Paris, France
+33 1 55 61 09 28 [email protected]
Andreas Siebel Germany, Switzerland and Austria P&U TAS Leader Düsseldorf, Germany
+49 211 9352 18523 [email protected]
Grigory Arutunyan Commonwealth of Independent States P&U TAS Leader Moscow, Russia
+7 495 641 2941 [email protected]
Europe
EY Europe P&U Transaction Advisory Services contacts
Miles HuqEY Global P&U TAS LeaderBaltimore, Maryland, US
+1 410 783 [email protected]
Arnaud De Giovanni EMEIA P&U TAS Leader Paris, France
+33 1 55 61 04 18 [email protected]
Remigiusz Chlewicki Central & Southern Europe P&U TAS Leader Warsaw, Poland
+48 22 557 7457 [email protected]
John CurtinUK & Ireland P&U TAS Leader London, UK
+44 20 7951 [email protected]

Asia-PacificRenewables push deal volume

36 Power transactions and trends Q2 2018
Power transactions and trends Q2 2018Asia-Pacific
“While the biggest energy deal of the quarter was in generation, renewables are driving most investment opportunities in the Asia-Pacific.”
Miles Huq,EY Global P&U TAS Leader
US$10.3b deal value, a 78% increase quarter-on-quarter
50%
05101520253035404550
0
5
10
15
20
25
Q2 2016 Q3 2016 Q4 2016 Q1 2017 Q2 2017 Q3 2017 Q4 2017 Q1 2018 Q2 2018
Nu
mb
er
of
de
als
US
$b
Generation Integrated Others
Renewables T&D Gas distribution
Water and wastewater Retail Volume
Chart 11: Asia-Pacific deal value and volume, by segment (asset and corporate-level deals, Q2 2016–Q2 2018)
of total deal value contributed by region’s largest deal
Transaction highlights► Largest deal in generation: The region’s
largest announced deal was the US$5.2b acquisition of a 69.1% stake in Thailand’s Glow Energy Public Company by another Thai utility, Global Power Synergy Public Company, which is owned by Engie.
► Push for renewables continues to drive investment: Solar and wind deal value more than doubled to US$3.8b in Q2.
► Corporate investors take the lead: Both the value (US$9.1b) and volume (28) of deals contributed by corporate investors increased in Q2.
► Investments in transmission and distribution (T&D) declined: This segment recorded no deals.
► Utilities are exploring new technology: In June, Australian utility AGL launched Energy Insights, a new energy service that will provide greater insights to consumers into energy usage. Japan’s TEPCO launched a subsidiary, TEPCO Ventures, which will develop and form joint ventures around the development of disruptive technologies.

37 Power transactions and trends Q2 2018
While the quarter’s top deal was in generation, it was the renewables segment that continued to drive much of the Asia-Pacific region’s deal volume, with 25 clean energy deals totaling US$3.8b. In a notable development, in July, the Bangladesh Power Development Board launched a tender to develop 200 MW of grid-connected solar capacity across four locations in that country. Also in July, Trung Nam Solar Power announced plans to invest US$216.5m to build a 204 MW solar PV project in Vietnam.
Clean energy developments increase Chinese solar decision will impact global market
An announcement in May by the Chinese Government that it would reduce solar plant subsidies halted the development of a number of solar farms. This decision caused a temporary oversupply of panels and saw their price drop to a record low of 27.8 cents/watt in June. With China the world’s biggest supplier of solar panels, this price drop will increase the price competitiveness of Chinese panels — even after the introduction of US trade tariffs — and improve the economics of solar generation, at least in the short term.
Australian utilities explore new technologies
We see continuing investment in new energy technologies across Australia, including an announcement in March by the Australian Renewable Energy Agency that it would award US$7.7m to Simply Energy to build a centrally managed 8 MW virtual power plant across Adelaide. The plant will involve the in-home installation of 1,200 Tesla Powerwall 2 batteries and is expected to be in operation by the end of 2019.
Asia-Pacific
Opportunities in energy technologies

38 Power transactions and trends Q2 2018
Alex Zhu,EY Greater China P&U TAS Leader
“We expect Chinese outbound investment activity to continue, in line with the country’s ambitious Belt and Road Initiative.”
83% of deal value contributed by domestic deals in Thailand and India
97% increased outbound investment, mostly driven by China
Asia-Pacific
Domestic deals lead
Top investment destinations Top outbound investing countries
TotalInvestment value US$10.3bInvestment value US$32.3b
Rest of the regionInvestment valueUS$0.6b (6%)
Rest of the regionInvestment valueUS$0.1b (0.90%)
IndiaInvestment valueUS$3.2b (31%)
ChinaInvestment valueUS$1.2b (11%)
ThailandInvestment valueUS$5.3b (51%)
Investment valueUS$31.2b (97%)
SingaporeInvestment valueUS$0.3b (1%)
JapanInvestment valueUS$0.74b (2%)
Asia-Pacific regional capital flows, Q2 2018*
*Note: Percentages may not add to 100% due to rounding.

39 Power transactions and trends Q2 2018
Announcement date
Target Target country/bidder country
Bidder Deal value (US$)
Bidder rationale Segment
20 June Glow Energy Public Co. Ltd.
Thailand/Thailand Global Power Synergy Public Company Limited
5.2b Allows Global Power Synergy to benefit from Glow’s high-quality generation assets, leverage potential business opportunities and increase market presence in Thailand
Generation
2 April Ostro Energy Private Limited
India/India ReNew Power Ventures
1.7b Enables ReNew Power to increase its installed capacity and consolidate its position in India’s renewable energy market
Renewables: wind
4 June Orange Renewable Power Pvt. Ltd*.
India/India Greenko Energy 0.9b Helps Greenko increase its installed capacity with 907 MW of solar and wind projects and 500 MW of assets under development
Renewables: solar and wind
30 May Chengdu Jinqiang Water Co., Ltd. (60% stake)
China/China Beijing Capital 0.4b Supports Beijing Capital’s strategy to improve its business structure and profitability
Water and wastewater
19 May Jiangyin Tianli Gas Co., Ltd. (37.23% stake)
China/China Shanghai Dazhong Public Utilities
0.3b Helps Shanghai Dazhong increase its gas asset holdings and boost profitability
Renewables: wind
All deals are announced deals, and the values indicated are disclosed enterprise values comprised of equity and debt components.
Asia-Pacific
Top five Asia-Pacific deals – Q2 2018
The Glow Energy sale price represents a premium of 4.3% to Glow’s closing price a day prior to the deal’s announcement on 20 June.
*Note: Recent reports indicate that this deal is facing some barriers to completion, so ongoing monitoring is advised.

40 Power transactions and trends Q2 2018
Asia-Pacific
Valuations snapshot – Q2 2018
Chart 12: Market capitalization weighted average EV/NTM EBITDA trading multiples for select utilities (Q2 2013–Q2 2018)
The Asia-Pacific P&U sector traded at an average current EV/EBITDA multiple of 8.6x during Q2, a 14% discount to the average historic multiple of 10.0x.
1
Integrated and renewable assets traded at a premium to sector multiples, while other assets traded at a discount.
2Historic EBITDA CAGR was 0.9%, while analysts forecast sector forward EBITDA CAGR to decrease to -1.3%, driven by decreased earnings from water and wastewater assets.
3
Year-to-date sector total shareholder return (TSR) was -7.1%, compared with a five-year TSR of 14.0%.
4
Note: Please see the appendix for the detailed definition of each trading multiple, the company subsegment definitions and the company tagging for the valuations analysis.
0.0x
5.0x
10.0x
15.0x
20.0x
25.0x
Jun-
13Au
g-13
Oct
-13
Dec
-13
Feb-
14Ap
r-14
Jun-
14Au
g-14
Oct
-14
Dec
-14
Feb-
15Ap
r-15
Jun-
15Au
g-15
Oct
-15
Dec
-15
Feb-
16Ap
r-16
Jun-
16Au
g-16
Oct
-16
Dec
-16
Feb-
17Ap
r-17
Jun-
17Au
g-17
Oct
-17
Dec
-17
Feb-
18Ap
r-18
Jun-
18
Generation Integrated RenewablesRetail T&D Gas utilityWater and wastewater Sector

41 Power transactions and trends Q2 2018
Chart 13: Market capitalization weighted adjusted EBITDA CAGR for select utilities
Chart 14: Total shareholder return for select utilities
Asia-Pacific
Valuations snapshot – Q2 2018 (continued)
10.0%
4.5%
-18.2%
-1.3%
0.1%
-2.9%
5.5%
0.9%
Integrated Gas utility Water and wastewater Sector
Two-year forward Five-year-to-date
-13.7%
-2.2% -2.2%-4.1%
4.7%
-13.3%
-5.1%
-9.4%
-3.4%-7.1%
-11.1%
11.7%
-23.2%
-7.1%
7.3%4.6%
14.3%
54.6%
-3.1%
6.2%
14.0%
Generation Integrated Retail T&D Gas utility Water andwastewater
Sector
Quarter-to-date Year-to-date Five-year-to-date
Note: Adjusted EBITDA numbers for generation, retail, T&D were not available.

42 Power transactions and trends Q2 2018
► Companies traded at an average current EV/EBITDA multiple of 8.5x.
► The current EV/EBITDA multiple traded at a slight discount of 0.8% to the current average sector multiple.
► Quarterly TSR performance was -13.7%, compared with a year-to-date TSR of -9.4% and a five-year TSR of 7.3%.
► The negative quarterly TSR was driven by low shareholder returns from OPG Power Ventures (-80%) and Datang International (-41%).
Generation► Companies traded at an average current EV/EBITDA
multiple of 9.1x, a 30% discount to the historic average multiple of 13x.
► The current EV/EBITDA multiple traded at a premium of 6.1% to the current average sector multiple, indicating potential overvaluation of this asset class compared with others.
► Over the past five years, the historic EBITDA CAGR was 0.1%; however, analysts predict this to increase to 10.0% over the next two years. Earnings growth is being driven by a positive outlook for these utilities. Chubu Electric and Tokyo Electric Power plan to transfer their thermal power assets to JERA (thermal power company owned 50% each by Chubu Electric and TEPCO Holdings) in April 2019.
► Quarterly TSR performance was -2.2%, compared with a year-to-date TSR of -3.4% and a five-year TSR of 4.6%.
► The negative quarterly TSR was driven by two Indian utilities: JSW Energy (-14%) and Tata Power Company (-12%).
Integrated► The average current EV/EBITDA multiple of these
companies declined over the quarter to trade at 10.4x, with the fall due to a decrease in enterprise values at Ningxia, YinXing Energy and Kong Sun.
► The current EV/EBITDA multiple traded at a premium of 20.5% to the current average sector multiple, indicating potential overvaluation of this asset class compared with others.
► Quarterly TSR performance was -9.3%, compared with a year-to-date TSR of -16.4%.
► The negative TSR (both quarterly and year-to-date) was attributed to negative returns by Chinese renewable companies Ningxia and Kong Sun.
Renewables
Asia-Pacific
Valuations snapshot – Q2 2018 (continued)

43 Power transactions and trends Q2 2018
Asia-Pacific
Valuations snapshot – Q2 2018 (continued)
► Companies traded at an average current EV/EBITDA multiple of 8.1x.
► The current EV/EBITDA multiple traded at a discount of 5.9% to the current average sector multiple, indicating potential undervaluation of this asset class compared with others.
► Quarterly TSR performance was -2.2%, compared with a year-to-date TSR of -7.1% and a five-year TSR of 14.3%.
Retail► Companies traded at an average current EV/EBITDA
multiple of 8.5x.
► The current EV/EBITDA multiple traded at a discount of 1.1% to the current average sector multiple, indicating fair value of this asset class compared with others.
► Quarterly TSR performance was -4.1%, compared with a year-to-date TSR of -11.1% and a five-year TSR of 54.6%.
► The negative quarterly and year-to-date TSRs were attributed to negative returns from utilities in India, New Zealand and Australia (one utility in each region).
T&D

44 Power transactions and trends Q2 2018
Asia-Pacific
Valuations snapshot – Q2 2018 (continued)
► Companies traded at an average current EV/EBITDA multiple of 8.3x, a 10% discount to the historic average multiple of 9.3x.
► The current EV/EBITDA multiple traded at a discount of 3.6% to the current average sector multiple, indicating potential undervaluation of this asset class compared with others.
► Over the past five years, the historic EBITDA CAGR was -2.9%; however, analysts predict this to increase to 4.5% over the next two years.
► TSR performance was 4.7%, compared with a year-to-date TSR of 11.7% and a five-year TSR of -3.1%.
► Although a number of gas utilities have delivered positive returns over the past five years, the average TSR has been impacted by a negative five-year TSR at Perusahaan Gas Negara Persero and Shenzhen Gas Corporation.
Gas ► Companies traded at an average current EV/EBITDA
multiple of 7.3x, a 5.0% discount to the historic average multiple of 7.7x.
► The current EV/EBITDA multiple traded at a discount of 15.2% to the current average sector multiple, indicating potential undervaluation of this asset class compared with others.
► Over the past five years, the historic EBITDA CAGR was 5.5%; however, analysts predict this to decrease to -18.2% over the next two years. The decrease is being driven by a decline in the two-year forward adjusted EBITDA of Manila Water and SIIC Environment Holdings.
► TSR performance was -13.3%, compared with a year-to-date TSR of -23.2% and a five-year TSR of 6.2%.
Water and wastewater

45 Power transactions and trends Q2 2018
Asia-Pacific
M&A outlook and investment hotspots
22%of Japan’s electricity mix to be contributed by nuclear by 2030
Focus on renewables: Apple has set up a clean energy fund to invest US$300m in the development of 1 GW of renewable energy in China through 2022. Vietnam has announced it will triple the amount of electricity generated from renewables to reduce its increasing reliance on coal. US integrated power producer Pattern Energy plans to install 33 MW of wind capacity on the island of Shikoku in western Japan. The Asian Development Bank plans to invest US$40m in Indonesia’s first 21 MW utility-scale solar PV plant.
More nuclear development: In May, Japan released its latest energy policy which stated that nuclear will make up 22% of the country’s power supply by 2030 (from a current base of 2%). Indonesia, Malaysia, the Philippines, Thailand and Vietnam are all in various stages of nuclear power development. It is expected that, by 2040, these countries will add 5 GW of nuclear capacity.
Cross-border acquisitions from China to continue: Chinese utilities continue to drive cross-border M&A as demonstrated by the US$27b bid for EDP assets in Europe.
“This region’s energy sector offers diverse and exciting investment opportunities, particularly in renewables and the scaling up of new technologies.”
Miles Huq,EY Global P&U TAS Leader
Investment in new technologies to scale up: Total Energy Ventures (Total S.A.’s energy venture capital arm), Chinese venture capital firm Hubei High Tech and Cathay Capital, a French-Chinese private equity firm, have announced the formation of the Cathay Smart Energy Fund. The fund’s mandate is to invest in emerging technologies in China, including the Internet of Things, energy storage, distributed energy, smart energy and low-carbon activities.

46 Power transactions and trends Q2 2018
Asia-Pacific
EY Asia-Pacific Transaction Advisory Services P&U contacts
Miles HuqEY Global P&U TAS Leader Baltimore, Maryland, US
+1 410 783 [email protected]
Nick Cardno Oceania P&U TAS Leader Sydney, Australia
+61 2 9248 4817 [email protected]
Somesh Kumar India P&U TAS Leader New Delhi, India
+91 11 6671 8270 [email protected]
Bum Choong Kim Korea P&U TAS Leader Seoul, Korea
+82 2 3787 4107 [email protected]
Yo Takehana Japan P&U TAS Leader Tokyo, Japan
+81 3 4582 6623 [email protected]
Gilles Pascual ASEAN P&U TAS Leader Singapore
+65 6309 6208 [email protected]
Alex Zhu Greater China P&U TAS Leader Beijing, China
+86 10 5815 3891 [email protected]

Africa and the Middle EastRenewables drive investment amid transformation
48 Power transactions and trends Q2 2018
Power transactions and trends Q2 2018Africa and the Middle East
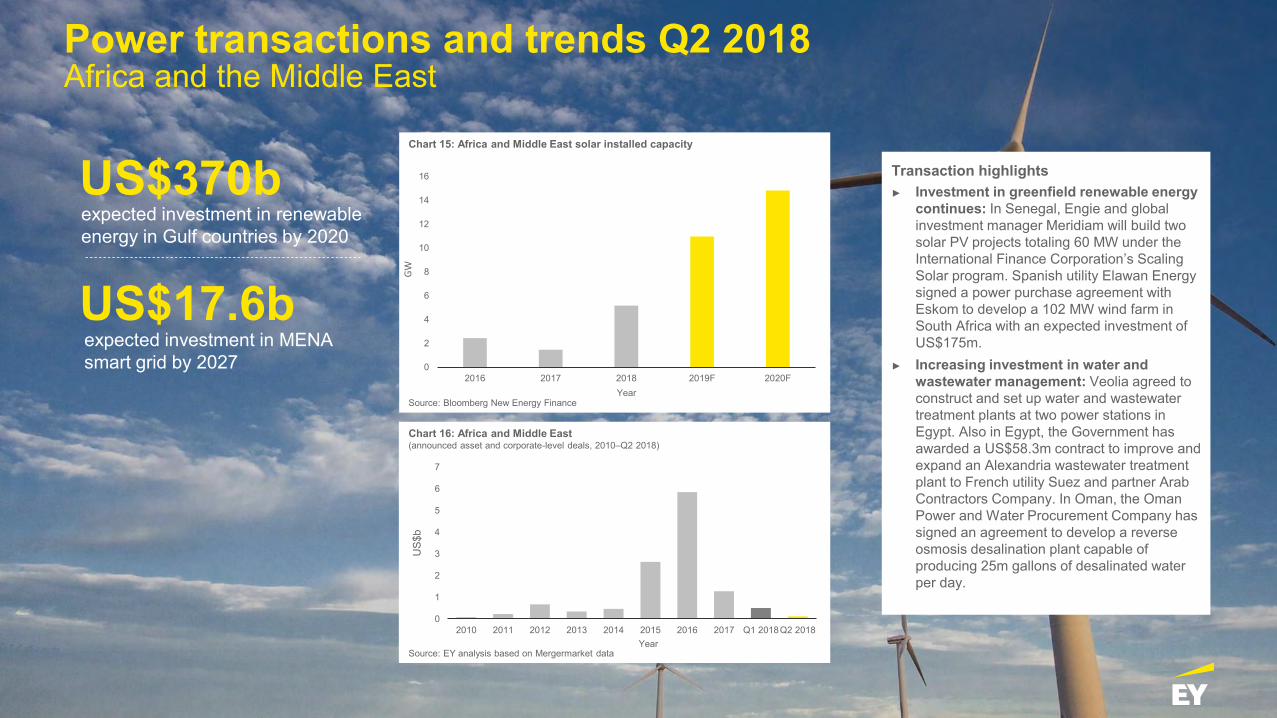
expected investment in renewable energy in Gulf countries by 2020
expected investment in MENA smart grid by 2027
US$370b
US$17.6b
Transaction highlights► Investment in greenfield renewable energy
continues: In Senegal, Engie and global investment manager Meridiam will build two solar PV projects totaling 60 MW under the International Finance Corporation’s Scaling Solar program. Spanish utility Elawan Energy signed a power purchase agreement with Eskom to develop a 102 MW wind farm in South Africa with an expected investment of US$175m.
► Increasing investment in water and wastewater management: Veolia agreed to construct and set up water and wastewater treatment plants at two power stations in Egypt. Also in Egypt, the Government has awarded a US$58.3m contract to improve and expand an Alexandria wastewater treatment plant to French utility Suez and partner Arab Contractors Company. In Oman, the Oman Power and Water Procurement Company has signed an agreement to develop a reverse osmosis desalination plant capable of producing 25m gallons of desalinated water per day.
0
2
4
6
8
10
12
14
16
2016 2017 2018 2019F 2020F
GW
Year
0
1
2
3
4
5
6
7
2010 2011 2012 2013 2014 2015 2016 2017 Q1 2018Q2 2018
US$
b
Year
Chart 16: Africa and Middle East (announced asset and corporate-level deals, 2010–Q2 2018)
Source: EY analysis based on Mergermarket data
Chart 15: Africa and Middle East solar installed capacity
Source: Bloomberg New Energy Finance

49 Power transactions and trends Q2 2018
Electrification remains the priority of Africa’s P&U sector, and efforts are ramping up to attract foreign investment, particularly in new renewable energy projects. Europe continues to be the region’s main investor, as both financial sponsors and corporates look for opportunities outside their home markets:► In March, the European Investment Bank (EIB) signed a US$25m financing
plan for the installation of off-grid solar systems that will improve access to energy, particularly in Ethiopia, Kenya, Tanzania, Nigeria and Uganda.
► In April, Swedish wave energy developer Seabased forged a partnership with Ghanaian renewable company TC Energy to construct a 100 MW wave energy project in Ada, Ghana.
Foreign investors help boost African electrification
Middle East countries increase clean energy targets
Across the Middle East, governments are driving investment in renewables as many increase their countries’ clean energy targets. Analysts expect that a total of 22 GW of solar capacity will be installed in Bahrain, Jordan, Oman, Saudi Arabia and the United Arab Emirates (UAE) by 2023. As renewable capacity increases, there is a growing focus on strengthening networks and investing in smart grid technologies. Saudi Arabia, Egypt and the UAE are expected to lead the region in smart grid adoption and investments in the coming years.
Africa and the Middle East
Investment in solar accelerates
“While the transformations reshaping the P&U sectors of Africa and the Middle East are vastly different, both are powered by renewables.”
Miles Huq,EY Global P&U TAS Leader

50 Power transactions and trends Q2 2018
“South Africa aims to attract US$100b of investment over five years and will auction 1.8 GW of renewable energy capacity worth US$4b by the end of November 2018.”
Miles Huq,EY Global P&U TAS Leader
US$10b to be invested in South Africa’s energy sector by the Kingdom of Saudi Arabia
100 MW solar energy plant to be built in South Africa by Saudi utility ACWA Power
Brownfield opportunities increaseWe’re seeing an uptick in brownfield investments across the region:► In South Africa, German independent energy company ENERTRAG acquired a 50% interest in 1.8 GW of wind power projects owned by local company
Genesis Eco-Energy Developments. ► South African-based African Energy Partners Limited acquired Kenyan diesel power station operator Iberafrica Power for US$62 million. ► In Israel, water desalination company IDE Technologies Ltd. acquired the remaining 49% stake in Sorek Desalination Ltd.
Africa and the Middle East
Africa offers both greenfield and brownfield opportunities

51 Power transactions and trends Q2 2018
Bidder company/country Target country Project description SegmentClean Technology Fund (CTF)/African Development Bank (AfDB)
Kenya Provided US$49.5m loan to help build a 35 MW geothermal power plant
Renewables: geothermal
Multilateral Investment Guarantee Agency (MIGA)
Namibia Provided US$18m guarantee to support theconstruction, operation and maintenance of two 5 MW solar power plants
Renewables: solar
AfDB Nigeria Provided a US$1.5m grant to support the construction of two new 100 MW renewables projects
Renewables
AfDB Cote d’Ivoire Will act as partial credit guarantor for Zola EDF Cote d'Ivoire (ZECI) to access a US$27.8m loan from Societe Generale de Banque en Cote d’Ivoire to enable ZECI to install 100,000 solar pay-as-you-go solar systems at rural households in Cote d'Ivoire
Renewables: solar
US Trade and Development Agency
Mozambique Awarded grant to eleQtra (Mozambique) Limitada for a feasibility study to assess the viability of developing two 60 MW wind plants
Renewables: wind
All major deals in Q2 took place in Africa and in the renewables segment.
Africa and the Middle East
Top five Africa and Middle East deals – Q2 2018

52 Power transactions and trends Q2 2018
Africa and the Middle East
M&A outlook and investment hotspots
42% of Egypt’s electricity to come from renewables by 2025
Solar investment to continue: Iran’s renewable energy agency says investors from Germany, Italy, France and Greece are financing solar power plants in the province of Yazd, with production capacity expected to increase from 10 MW to 70 MW by the end of 2018. Iran is boosting investment in renewables to meet its 2020 renewable energy target of 5,000 MW. The Oman Power and Water Procurement Company has issued a request for proposals for a US$500m 500 MW utility-scale solar power project. UAE-based renewable energy company Phanes Group has signed a memorandum of understanding (MoU) to develop three Mozambique solar plants with a cumulative capacity of 200 MW.
Growing momentum for rural and off-grid electrification in Africa: Ghana will spend US$230m to promote the use of renewable energy, particularly in off-grid communities. Kenya’s Powerhive and South Africa’s Sun Exchange will invest US$23m in microgrids in Kenya and sub-Saharan Africa through 2023.
“Opportunities to invest in the region’s energy sector will expand, with a focus on renewables in both Africa and the Middle East.”
Miles Huq,EY Global P&U TAS Leader
Egypt emerges as an investment hotspot: Chinese integrated energy service provider Golden Concord Group signed an MoU with the Egyptian Government to build a solar panel production facility at a cost of up to US$2b. Solar energy firm Enerray will build three ground-mounted PV projects totaling 1.8 GW at Egypt’s Benban Solar Park. Egypt also plans to reduce electricity subsidies by more than $800m by the end of the financial year, paving the way for increased private investment.
New investments in energy storage: Jordan is investing in its first 30 MW electricity storage project to support expanding solar and wind generation. Sterling and Wilson, a global solar equipment procurement company, plans to construct 30 MWh of energy storage facilities in West Africa across three sites.

53 Power transactions and trends Q2 2018
Bruce Harvey Africa P&U TAS Leader Johannesburg, South Africa
+27 11 772 5352 [email protected]
David Lloyd Middle East P&U TAS Leader Riyadh, Saudi Arabia
+966 11 215 9852 [email protected]
Miles HuqEY Global P&U TAS Leader Baltimore, Maryland, US
+1 410 783 [email protected]
Africa and the Middle East
EY Africa and the Middle East Transaction Advisory Services P&U contacts
AppendixValuations analysis details

55 Power transactions and trends Q2 2018
Appendix: Overview
Valuation metric definitions
Multiple Definition
Current EV/EBITDA multiple The market capitalization weighted average of the current enterprise value (EV) (at June 2018)/next twelve months (NTM) (at June 2018) adjusted earnings before interest, tax, depreciation and amortization (EBITDA)
Historic EV/EBITDA multiple The market capitalization weighted five-year average of the actual quarterly EV/actual quarterly adjusted EBITDA (from June 2013 to June 2018)
Forward EBITDA CAGR Two-year forward (from Q2 2018) forecast compound annual growth rate (CAGR) of the market capitalization weighted adjusted EBITDA
Historic EBITDA CAGR Five-year historic (from Q2 2018) actual CAGR of the market capitalization weighted adjusted EBITDA
Quarter-to-date TSR Total shareholder return (TSR) in percent (from 1 April 2018 to 1 July 2018)
Year-to-date TSR TSR in percent (from 1 January 2018 to 1 July 2018)
Five-year-to-date TSR TSR in percent (from 1 July 2013 to 1 July 2018)
Note: All EBITDA values are adjusted EBITDA values, and all subsegment EV/EBITDA multiples are weighted by market capitalization.

56 Power transactions and trends Q2 2018
Appendix: Overview
Company subsegment definitions
Subsegment EY definition
Electricity T&D Utilities that generate the majority of their revenues from transmitting and distributing electricity, as opposed to the sale of energy
Generation Utilities that generate the majority of their revenues from power production through large centralized (nonrenewable) sources, including coal, gas, oil, large hydro and nuclear
Gas utilities Utilities that generate the majority of their revenues from downstream gas, including transmission, distribution and the sale of gas as an energy source
Renewables Utilities that are engaged in generating power from centralized or distributed renewable energy sources, including solar, wind and small hydro
RetailUtilities that generate the majority of their revenues from delivering power to consumers, which includes utilities that generate and sell power to consumers (“gentailers”) but excludes companies that are fully vertically integrated
Integrated utilities Utilities engaged in multiple segments of the power value chain – generation, T&D and retail or T&D and retail – and utilities that have T&D business and substantial presence in other segments, as well as from the perspective of revenues
Large market capitalization Requires a utility to have a market capitalization above US$10b
Medium and small market capitalization Requires a utility to have a market capitalization of less than US$10b
Water and wastewater Utilities that manage water and wastewater networks and engage in the distribution, supply or treatment of water and wastewater

57 Power transactions and trends Q2 2018
Appendix: Americas
Americas company subsegment tagging for valuations analysis
Subsegment Company Data availability
Generation Dynegy Inc./Vistra
NRG Energy, Inc.
The AES Corporation
TransAlta Corporation
Large market capitalization integrated
Ameren Corporation
American Electric Power Co., Inc.
Avangrid, Inc.
Berkshire Hathaway Energy Company
CenterPoint Energy, Inc.
CMS Energy Corporation
Comisión Federal De Electricidad
Consolidated Edison Inc.
Dominion Energy, Inc.
DTE Energy Company
Duke Energy Corporation
Edison International
Entergy Corporation
Evergy, Inc.
Eversource Energy
Subsegment Company Data availability
Large market capitalization integrated
Exelon Corporation
FirstEnergy Corp.
National Grid USA
NextEra Energy, Inc.
PG&E Corporation
PPL Corporation
Public Service Enterprise Group Incorporated
Sempra Energy
Southern Company
WEC Energy Group, Inc.
Xcel Energy Inc.
Medium and small market capitalization integrated
ALLETE, Inc.
Alliant Energy Corporation
Avista Corporation
Black Hills Corporation
Companhia Energética de Brasília - CEB
EDP - Energias do Brasil S.A.
El Paso Electric Company

58 Power transactions and trends Q2 2018
Appendix: Americas
Americas company subsegment tagging for valuations analysis (continued)
Subsegment Company Data availability
Medium and small market capitalization integrated
Hawaiian Electric Industries, Inc.
Light S.A.
MDU Resources Group, Inc.
MGE Energy, Inc.
NorthWestern Corporation
OGE Energy Corp.
Otter Tail Corporation
Pinnacle West Capital Corporation
PNM Resources, Inc.
Portland General Electric Company
SCANA Corporation
Unitil Corporation
Vectren Corporation
Renewables AES Tietê Energia
CPFL Energias Renovaveis
NextEra Energy Partners, LP
NRG Yield, Inc.
Pattern Energy Group Inc.
Sky Solar Holdings
Subsegment Company Data availability
Renewables SunPower Corporation
Sunrun Inc.
TerraForm Power, Inc.
TransAlta Renewables Inc.
Vivint Solar Inc.
Retail AEP Energy
Ambit Energy
Amigo Energy
Cirro Energy
Crius Energy Trust
Genie Energy
Just Energy
Spark Energy
Gas utility Atmos Energy Corporation
Chesapeake Utilities Corporation
National Fuel Gas Company
New Jersey Resources Corporation
NiSource Inc.

59 Power transactions and trends Q2 2018
Appendix: Americas
Americas company subsegment tagging for valuations analysis (continued)
Subsegment Company Data availability
Gas utility NW Natural
ONE Gas, Inc.
Piedmont Natural Gas Co. Inc.
Questar Corporation
RGC Resources, Inc.
South Jersey Industries, Inc.
Southwest Gas Corporation
Spire Inc.
UGI Corporation
WGL Holdings Inc.
Subsegment Company Data availability
Water and wastewater American States Water Company
American Water Works Company, Inc.
Aqua America, Inc.
Artesian Resources Corporation
California Water Service Group
Connecticut Water Service, Inc.
Consolidated Water Co. Ltd.
Middlesex Water Company
SJW Group
The York Water Company

60 Power transactions and trends Q2 2018
Appendix: Europe
Europe company subsegment tagging for valuations analysis
Subsegment Company Data availability
Generation Public Joint Stock Company Donbasenergo
Integrated Acciona S.A.
Centrica plc
CEZ, a. s.
E.ON UK
EDF Energy
Electricite de France S.A.
Endesa S.A.
ENEA S.A.
Enel SpA
Engie S.A.
Fortum Oyj
Iberdrola S.A.
Innogy
Irkutskenergo PJSC
Npower
Polska Grupa Energetyczna S.A.
RWE
ScottishPower
Subsegment Company Data availability
Integrated SSE plc
Verbund AG
Renewables EDP Renováveis
Energiekontor AG
Falck Renewables SpA
Futuren S.A.
Terna Energy SA (Terna Energy SocieteAnonyme Commercial Technical Company S.A.)
Retail British Gas
Electricity T&D Elia System Operator
National Grid plc
Red Electrica Corporacion S.A.
Terna SPA
Gas utility Enagas S.A.
Geoplin
Latvijas Gaze
Snam SPA
Swissgas

61 Power transactions and trends Q2 2018
Appendix: Europe
Europe company subsegment tagging for valuations analysis (continued)
Subsegment Company Data availability
Gas utility VNG – Verbundnetz Gas Aktiengesellsch
Water and wastewater Ad Visegrad
Biwater Holdings Limited
Severn Trent Plc
Suez Environnement
United Utilities
Veolia Environnement S.A.

62 Power transactions and trends Q2 2018
Appendix: Asia-Pacific
Asia-Pacific company subsegment tagging for valuations analysis
Subsegment Company Data availability
Generation Huadian Power International Corporation Limited
Datang International Power Generation Company
Huaneng Power International
NHPC Ltd.
NTPC Ltd.
OPG Power Ventures PLC
Reliance Power Ltd.
Zhejiang Zheneng Electric Power
Integrated Chubu Electric Power Company
Chugoku Electric Power
CLP Group
Contact Energy Limited
Electric Power Development
JSW Energy Limited
KEPCO
The Tata Power Company Limited
Subsegment Company Data availability
Renewables China Datang Corp Renewable Power
Guizhou Qianyuan Power
Kong Sun Holdings
Meridian Energy
NingXia YinXing Energy
Retail AGL Energy
Contact Energy Limited
ERM Power
Genesis Energy Ltd.
Origin Energy
Trustpower Ltd.
Electricity T&D AusNet Services
Power Grid Corp of India Ltd.
Vector Limited
Gas utility APA Group (recent takeover offer)
China Gas Holdings Ltd.
Duet Group

63 Power transactions and trends Q2 2018
Appendix: Asia-Pacific
Asia-Pacific company subsegment tagging for valuations analysis (continued)
Subsegment Company Data availability
Water and wastewater Guangdong Investment Limited
Luenmei Quantum Co., Ltd
Manila Water Company, Inc.
Ranhill Holdings Berhad
SIIC Environment Holdings Ltd.
Tus-Sound Environmental Resources Co., Ltd.
WHA Utilities and Power Public Company Limited
Subsegment Company Data availability
Gas utility Korea Gas Corporation
Osaka Gas Co.
Perusaahan Gas Negara PERSERO
Seibu Gas
Shenzhen Gas Corp. Ltd.
Toho Gas
Tokyo Gas Co. Ltd.
Water and wastewater TTW Public Company Limited
VA Tech Wabag Limited
Beijing Enterprises Water Group Limited
Beijing Water Business Doctor Co., Ltd.
Binh Duong Water Supply Sewerage Environment Limited Company
China Water Affairs Group Limited
Chongqing Water Group Co., Ltd.
Eastern Water Resources Development and Management Public Company Limited

EY | Assurance | Tax | Transactions | Advisory
About EYEY is a global leader in assurance, tax, transaction and advisory services. The insights and quality services we deliver help build trust and confidence in the capital markets and in economies the world over. We develop outstanding leaders who team to deliver on our promises to all of our stakeholders. In so doing, we play a critical role in building a better working world for our people, for our clients and for our communities.
EY refers to the global organization, and may refer to one or more, of the member firms of Ernst & Young Global Limited, each of which is a separate legal entity. Ernst & Young Global Limited, a UK company limited by guarantee, does not provide services to clients. For more information about our organization, please visit ey.com.
© 2018 EYGM Limited.All Rights Reserved.
EYG no. 011008-18Gbl
BMC AgencyGA 1008282
ED None
This material has been prepared for general informational purposes only and is not intended to be relied upon as accounting, tax or other professional advice. Please refer to your advisors for specific advice.
The views of third parties set out in this publication are not necessarily the views of the global EY organization or its member firms. Moreover, they should be seen in the context of the time they were made.
ey.com