powerful partnerships rodin president ... e. glossary e-1 . xi tables 1. ... powerful partnerships...
TRANSCRIPT

POWERFUL PARTNERSHIPS:
THE FEDERAL ROLE IN INTERNATIONAL COOPERATION
ON ENERGY INNOVATION
A REPORT FROM THE
PRESIDENT’S COMMITTEE OF ADVISORS ON SCIENCE AND TECHNOLOGY
PANEL ON INTERNATIONAL COOPERATION IN ENERGY RESEARCH, DEVELOPMENT, DEMONSTRATION, AND DEPLOYMENT
JUNE 1999

About the President’s Committee of Advisors on Science and Technology President Clinton established the President’s Committee of Advisors on Science and Technology (PCAST) by Executive Order 12882 at the same time that he established the National Science and Technology Council (NSTC). The PCAST serves as the highest level private sector science and technology advisory group for the President and the NSTC. The Committee members are distinguished individuals appointed by the President, and are drawn from industry, education and research institutions, and other non-governmental organizations. The Assistant to the President for Science and Technology co-chairs the Committee with a private sector member selected by the President. The formal link between the PCAST and the NSTC ensures that national needs remain an overarching guide for the NSTC. The PCAST provides feedback about Federal programs and actively advises the NSTC about science and technology issues of national importance.
The cover shows a nighttime view of the Earth from space. The Visualization Analysis Lab at the NASA Goddard Space Flight Center combined six months of data to create this global image of electric lights. The data are from the Defense Meteorological Satellite Program Operational Linescan System, processed using algorithms developed by NOAA’s National Geophysical Data Center.

THE PRESIDENT’S COMMITTEE OF ADVISORS ON SCIENCE AND TECHNOLOGY CHAIRS Neal F. Lane Assistant to the President for Science and Technology Office of Science and Technology Policy MEMBERS Norman R. Augustine Former Chairman and CEO Lockheed Martin Corporation Francisco J. Ayala Donald Bren Professor of Biological Sciences Professor of Philosophy University of California, Irvine John Deutch Institute Professor Department of Chemistry Massachusetts Institute of Technology Murray Gell-Mann Professor, Santa Fe Institute, Co-Chair Science Board; R.A. Millikan Professor Emeritus of Theoretical Physics California Institute of Technology David A. Hamburg President Emeritus Carnegie Corporation of New York John P. Holdren Teresa and John Heinz Professor of Environmental Policy John F. Kennedy School of Government Harvard University Diana MacArthur Chair and CEO, Co-Founder Dynamac Corporation Shirley M. Malcom Head, Directorate for Education and Human Resources Programs American Association for the Advancement of Science
John A. Young Former President and CEO Hewlett-Packard Co. Mario J. Molina Institute Professor Lee and Geraldine Martin Professor of Environmental Science Massachusetts Institute of Technology Peter H. Raven Director, Missouri Botanical Garden Engelmann Professor of Botany, Washington University in Saint Louis Sally K. Ride Professor of Physics University of California, San Diego Judith Rodin President University of Pennsylvania Charles A. Sanders Former Chairman Glaxo-Wellcome, Inc. David E. Shaw CEO D.E. Shaw & Co. and Juno Online Services Charles M. Vest President Massachusetts Institute of Technology Virginia V. Weldon Director, Center for the Study of American Business Washington University in St. Louis Lilian Shiao-Yen Wu Consultant, Corporate Technical Strategy Development IBM
Executive Secretary
Joan P. Porter

The President’s Committee of Advisors on Science and Technology Panel on International Cooperation in
Energy Research, Development, and Deployment
John P. Holdren (Chair) Teresa and John Heinz Professor
of Environmental Policy Harvard University PCAST Member
Richard Balzhiser President Emeritus Electric Power Research Institute John P. Boright Executive Director Office of International Affairs National Research Council William Chandler Director, Advanced International Studies Battelle Pacific Northwest National Laboratory John M. Deutch Institute Professor Massachusetts Institute of Technology PCAST Member Howard Geller Executive Director, American Council for an Energy Efficient Economy John H. Gibbons Asst. to the President for Science and Technology, ret. Larry T. Papay Senior Vice President and General Manager Bechtel Technology and Consulting Bechtel Group, Inc. Nathan Rosenberg Fairleigh S. Dickinson, Jr. Professor of Public Policy Department of Economics Stanford University
Maxine Savitz General Manager Allied Signal Ceramic Components Bruce N. Stram Vice President, Business Development Enron Energy Services Robert Williams Senior Research Scientist Princeton University Lilian Shiao-yen Wu Consultant, Corporate Technical Strategy Development IBM PCAST Member John Young PCAST Co-Chair President and CEO, Retired Hewlett-Packard Co. Study Executive Director Samuel F. Baldwin National Science and Technology Council, Agency Representative Assistant to the Chair Paul de Sa Harvard University
Staff Rosina Bierbaum Office of Science and Technology Policy Ann Kinzig AAAS Roger Revelle Fellow Office of Science and Technology Policy Martin Offutt National Science and Technology Council Peter Backlund Office of Science and Technology Policy Gerald Hane Office of Science and Technology Policy Robert Marianelli Office of Science and Technology Policy Mike Rodemeyer Office of Science and Technology Policy Bill Valdez National Science and Technology Council Agency Representative Mark Bernstein RAND Noreen Clancy RAND Ron Diver RAND Caroline Wagner RAND Meredydd Evans Battelle, Pacific Northwest National Laboratory
Jeffrey Logan Battelle, Pacific Northwest National Laboratory Susan Legro Battelle, Pacific Northwest National Laboratory Thomas Secrest Battelle, Pacific Northwest National Laboratory Terry Fry Bechtel Jacqueline C. Cragg Library and Research Services Division Office of Administration Miranda Hall-Carrier Graphics and Printing Office of Administration Administrative Staff Lorraine Cox Department of Energy Nikki Kelly National Renewable Energy Laboratory Greg Guibert Office of Science and Technology Policy Cluster Myers National Renewable Energy Laboratory Puri Soriben Bechtel Sandy Toomey Office of Science and Technology Policy Paulette Wright Battelle, Pacific Northwest National Laboratory
This was a Panel of fourteen persons of diverse backgrounds and viewpoints, tackling an immensely complex subject. Inevitably, not every member of the Panel is entirely happy with every formulation in the report. But we are unanimous that the main messages and overall balance in this joint product are correct and appropriate.

ix
CONTENTS
Executive Summary ES- 1 1. U.S. Interests and Government Roles in International Cooperation on Energy Innovation
1- 1
Origins, Focus, and Organization of the Study 1- 2 The U.S. Stake in International Cooperation on ERD3 1- 4 Rationales and Roles for Government Involvement 1-24 Interactions Between ERD3 Cooperation and Other National Policies 1-27 Leverage of International ERD3 Cooperation 1-30 References 1-33
2. The International Landscape of ERD3 2- 1
Describing ERD3 Activities 2- 1 An Evolving Landscape 2- 2 The Private Sector 2- 6 The Public Sector 2- 9 Other Major Players 2-21 Conclusions 2-25 References 2-29
3. Foundations of International Cooperation on Energy Innovation 3- 1
Trends Affecting the ERD3 Pipeline 3- 2 Strengthening the Elements of the ERD3 Pipeline 3- 4 Upgrading Public-Sector Performance 3- 8 Capacity Building 3-11 Shaping Energy Sector Reform 3-16 Finance 3-33 Filling the Gaps 3-39 Close 3-41 References 3-43
4. Efficient End-Use Technologies 4- 1
What is at Stake? 4- 2 Opportunities for Improvement 4- 6 Buildings Sector 4- 7 Transportation Sector 4-16 Industry 4-23 Close 4-31 References 4-34
x
5. Energy Supply Technologies 5- 1 Renewable Energy 5- 3 Fossil Fuels 5-16 Nuclear Energy 5-24 Close 5-29 References 5-31
6. Portfolio Assessment, Partnering, and Program Management 6- 1
Portfolio Assessment 6- 1 Identifying and Developing Effective Partnerships 6- 6 Program Management 6- 7 Management Initiatives 6-13 The Window of Opportunity 6-17 References 6-19
Appendices
A. Acknowledgements A-1 B. Units and Conversion Factors B-1 C. Budget Tables from PCAST, “Federal Energy Research and Development for the Challenges of the Twenty-First Century
C-1
D. Acronyms D-1 E. Glossary E-1

xi
TABLES
1. U.S. Interests and Government Roles in International Cooperation on Energy Innovation
1.1: World and Selected Country Energy and Economic Data for 1997 1-6
1.2: Average Annual Global Rates of Change for Two Scenarios 1-11
1.3: Population, GDP, and Energy and Carbon Intensities in Two Scenarios 1-12
1.4: Cumulative Investments in Energy Supply By Regions, 1990-2020 and 2021-2050
1-20
1.5: Net Carbon Emissions Under IIASA-WEC Scenarios A2 and C1 1-21
2. The International Landscape of ERD3
2.1: Representative Federal Agencies’ Roles in International ERD3 2-26
3. Foundations of International Cooperation on Energy Innovation
3.1: Representative Mechanisms for Incorporating Public Benefits 3-22
3.2: Indicators of Debt and Possible Debt for PBF Swaps 3-25
4. Efficient End-use Technologies
4.1: Barriers to Advanced Energy Efficient Technology RD3 4-3
4.2: Chinese Industry Remains Energy Inefficient 4-4
4.3: Energy Demand by Economic Sector, 1985 and 1995 4-6
4.4: Emissions and Fuel Economy for Selected Bus Technologies 4-21
4.5: Energy Efficiency Investments Provide High Returns 4-26
4.6: Electricity Generation Rates for Alternative CHP Systems 4-27
4.7: Global Energy End-use and PCAST Initiatives 4-32
4.8: Global Distribution of Exposure to Suspended Particulate Matter 4-33
5. Energy Supply Technologies
5.1: Project Levelized Cost of Alternative Central Station Renewable-Electric Technologies
5-6
5.2: Capital Costs for Electricity Storage 5-7
5.3: Projection of Coal Use and CO2 Emissions from Coal 5-19
5.4: Global Energy Supply and PCAST Initiatives 5-30
6. Portfolio Assessment, Partnering, and Program Management
6.1: Financial Support Strategies for IERD3 Partnerships for Clean Energy Technologies
6-3
6.2: Congressional Concerns and Panel Findings 6-11
6.3: Breakdowns of Strategic Energy Cooperation Fund by Initiative Cluster 6-16

xiii
FIGURES
1. U.S. Interests and Government Roles in International Cooperation on Energy- Technology Innovation
1.1: World Primary Energy Supply by Source, 1850 to 1997 1-8
1.2: Primary Energy contributions for IIASA-WEC scenarios A2 and C1 1-12
1.3: Distribution of Energy Growth in IIASA-WEC Scenario A2 1-22
2. The International Landscape of ERD3
2.1: Base price and tax on regular unleaded gasoline, 1997 2-3
2.2: Power-sector finance for developing countries, 1985-1994 2-5
2.3: U.S. national expenditures on energy R&D, 1974-1996 2-6
2.4: U.S. collaborative ERD3 projects by agency expenditures, FY1997 2-10
2.5: U.S. collaborative ERD3 projects by partner, FY1997 2-11
2.6: U.S. collaborative ERD3 projects by area, FY 1997 2-11
3. Foundations of International Cooperation on Energy Innovation
3.1: Learning Curve and Buy-down for an Advanced Energy Technology 3-7
3.2:The RD3 Value Chain and Pipeline 3-10
3.3: Status of Power Sector Reform in Latin America 3-21
3.4: Reduction in the Price of Power Offers Under the United Kingdom Non-Fossil Fuel Obligation
3-31
3.5: Depiction of Use of Competitive Auctions to Buy Down the Cost of a Technology
3-32
3.6: Learning Curve Relationships for Photovoltaics, Wind Generators, and Gas Turbines
3-33
3.7: Filling in the “Gaps” in the Innovation Pipeline 3-39
4. Efficient End-Use Technologies
4.1: Chinese Energy Intensity and Consumption, 1965-97 4-6
4.2: U.S. Refrigerator Energy Demand Over Time 4-10
4.3: A Few Sectors Dominate Global Industrial Energy Use 4-24
4.4: Cogeneration Provides a Significant Share of European Electric Power 4-27
5. Energy Supply Technologies
5.1: The Carbon Intensity of Primary Energy Consumption for Selected Countries
5-25
6. Portfolio Assessment, Partnering, and Program Management
6.1: A Strategic Framework for International Cooperation on Energy RD3 6-17

xv
BOXES
1. U.S. Interests and Government Roles in International Cooperation on Energy Innovation
1.1: The IIASA-WEC Energy Scenarios for the 21st Century 1-11
1.2: Small Particle Pollution and Chronic Health Problems 1-14
1.3: The Assessments of the Intergovernmental Panel on Climate Change 1-17
1.4: Climate Science Since the Second IPCC Assessment 1-19
2. The International Landscape of ERD3
2.1: Fostering the International Dialogue on Energy 2-14
2.2: USAID Programs in India 2-21
3. Foundations of International Cooperation on Energy Innovation
3.1: Brazil’s National Electricity Conservation Program 3-12
3.2: Energy Efficiency Centers in Eastern Europe, the Former Soviet Union and China
3-13
3.3: Argentinian Concessions for Rural Electrification 3-23
3.4: Market Transformation Initiatives and the Restructuring of the Electric Industries
3-30
3.5: World Bank Policy Mechanisms Encouraging Clean Energy Technologies 3-35
3.6: The Clean Development Mechanism 3-37
3.7: Tied Aid 3-40
3.8: International Standards and Conformity Assessment Procedures 3-41
4. Efficient End-Use Technologies
4.1: China Has Made Dramatic Progress in Energy Efficiency 4-6
4.2: Urban Transport Success Story: Curitiba, Brazil 4-19
4.3: Motorized Bikes for Developing Countries 4-22
5. Energy Supply Technologies
5.1: “Baseload” Inner Mongolian Wind Power for Distant Chinese Markets 5-7
5.2: The Wind Energy Resource Development Concession 5-8
5.3: Co-production of Synthetic LPG and Electricity from Grain Crop Residues in China
5-9
5.4: The Global Wind-Energy Market 5-11
5.5: The Global PV Market 5-11
ES-1
EXECUTIVE SUMMARY
his Panel has reviewed the U.S. stake in international cooperation on energy inno-vation, the complementary roles of the
public and private sectors in pursuing such co-operation, and the existing array of activities being carried out by the Federal government to this end. Based on that review, we conclude that existing Federal programs for energy coopera-tion—which were funded in FY 1997 at less than $250 million per year—are not commensu-rate with either the needs or the opportunities. We therefore recommend substantially strength-ening these programs—expanding their cover-age, increasing their funding, improving the processes for their evaluation, and providing for them an over-arching strategic vision and a mechanism for coordinating its implementation.
We propose specific initiatives for strengthening the foundations of energy-technology innovation and international coop-eration relating to it (including capacity build-ing, energy-sector reform, and mechanisms for demonstration, cost-buy-down, and financing of advanced technologies); for increased coopera-tion on research, development, demonstration, and deployment (RD3) of technologies govern-ing the efficiency of energy use in buildings, energy-intensive industries, and small vehicles and buses, as well as of cogeneration of heat and power; and for increased cooperation on RD3 of fossil-fuels-decarbonization and carbon-seques-tration technologies, biomass-energy and other renewable-energy technologies, and nuclear fis-sion and fusion.
Most importantly—for without this none
of the other initiatives we propose are likely to achieve their potential—we recommend creation of a new Interagency Working Group on Strate-
gic Energy Cooperation, under the auspices of the National Science and Technology Council, to provide a strategic vision of and coordination for the government’s efforts in international co-operation on energy-technology innovation. The government’s contribution to this expansion of international energy cooperation activities would be provided by a new Strategic Energy Coopera-tion Fund, amounting to $250 million for FY2001 and increasing to $500 million in FY2005, the proposed allocation of which to the relevant agencies in the President’s budget re-quest would be determined with the help of the Interagency Working Group.
U.S. interests and values at stake in energy
can only be effectively addressed in a global context
nergy is tightly linked to U.S. economic, environmental, and national-security inter-
ests.
♦ U.S. economic interests in energy-tech-nology innovation include controlling costs of energy to U.S. consumers and industries; avoiding inflation and recession (in this country and worldwide) from oil-price shocks; limiting the impact of energy im-ports on the U.S. balance of trade; expand-
T
E
The U.S. Stake in International Cooperation on Energy Innovation
Powerful Partnerships
ES-2
ing the market share of U.S. companies in the multi-hundred-billion dollar per year global energy-technology market; and en-hancing long-term markets for other U.S. exports by building the energy basis for sus-tainable prosperity in developing and transi-tion economies.
U.S. economic interests in energy-
technology innovation include expanding the market share of U.S. companies in the
multi-hundred-billion dollar per year global energy-technology market
♦ Environmentally, accelerated energy-tech-nology innovation can increase the pace and decrease the cost at which high-environ-mental-impact technologies and practices are replaced with low-impact ones in the United States and abroad. This will reduce the health impacts of air pollution and the ecological effects of acid deposition in this country and elsewhere, improve the safety of nuclear reactors everywhere, reduce oil spills in the world’s oceans, slow the pace of greenhouse-gas-induced climate change, and help create a framework for long-term coop-eration on the energy/climate challenge in which developing, transition, and industrial-ized countries alike will participate.
♦ U.S. security interests in energy-technology innovation include reducing the potential for conflict over access to oil and gas resources; minimizing links between the use of nu-clear-energy technologies and the acquisi-tion of nuclear-weapons capabilities by na-tions of proliferation concern or by subna-tional groups; and avoiding, for all coun-tries, energy problems with economic, envi-ronmental, or political consequences severe enough to aggravate or generate possibilities for armed conflict.
♦ Not only U.S. interests but also basic U.S. values—respect for human dignity and hu-man rights, belief in equity and opportunity, commitment to assistance for the least fortu-nate and to stewardship for future genera-tions and for the environment—dictate U.S. leadership in international cooperation on energy innovation for sustainable develop-ment.
.S. interests and values at stake in energy can only be effectively addressed in a
global context.
♦ The problems and opportunities related to oil, energy-technology markets, nuclear pro-liferation, climate change, and develop-ment/security interactions are all inherently global.
♦ Effective responses to these issues must take into account the globalization of capital markets, manufacturing, innovation capaci-ties and activities, and information flow.
“business as usual” energy future—without rapid technological innovation and in-
creased cooperation to diffuse the results worldwide—would be problem-plagued and po-tentially disastrous.
♦ World energy demand under business-as-usual would double from its 1997 value by 2025 or 2030, triple by 2050 or 2060, and more than quadruple by 2100; by far the largest part of this growth would take place in the countries currently classified as de-veloping.
♦ Oil imports, oil prices, and the potential for oil-induced economic disruption and conflict would all rise.
♦ U.S. understanding of, access to, and crea-tion of products for global energy-technology markets all would become in-creasingly inadequate.
U
A
Executive Summary
ES-3
♦ U.S. withdrawal from nuclear energy-technology innovation and cooperation would reduce U.S. leverage to minimize nu-clear energy’s global safety and proliferation risks.
♦ Attempts to fuel the bulk of developing-country economic growth with conventional coal and oil technologies would create a col-lision between economic aspirations and the environmental underpinnings of well-being, with the potential to wreck both.
♦ The atmospheric concentration of carbon dioxide under business-as-usual would be likely to reach 3 times its pre-industrial level by 2100, an increase regarded by most cli-matologists as well beyond the bounds of prudence.
U.S. security interests in energy-technology
innovation include avoiding, for all countries, energy problems with economic, environmental, or political consequences severe enough to aggravate or generate
possibilities for armed conflict
lthough aspects of the energy future are in-evitably uncertain, within a wide range of
possibilities the acceptable outcomes all require major innovations in energy technology in order to:
♦ lower the energy intensity of economic ac-tivity, thus reducing chances that constraints on expanding energy supply will constrain economic growth, reducing the pressure of high energy growth to use higher-environmental-impact sources along with lower-impact ones, and reducing environ-mental impacts of the energy-supply system overall in proportion to its size;
♦ lower the emissions intensity of energy sup-ply with respect to greenhouse gases, par-ticulate matter, and gaseous precursors of regional smogs, hazes, and acid deposition (SOx, NOx, hydrocarbons);
♦ reduce, below what they would otherwise be, the monetary costs of delivering energy services in environmentally sustainable ways;
♦ broaden the range of energy options avail-able to the United States and other countries, thus increasing the capacity of the national and global energy system to cope with the inevitable surprises.
.S. participation in international coopera-tion in pursuit of these innovations is
clearly needed to:
♦ increase the pace and lower the cost of U.S. acquisition of the innovations it needs for it-self;
♦ gain access for U.S. firms to the large over-seas markets for innovative energy tech-nologies;
♦ address the global dimensions of energy challenges by accelerated development and deployment of innovations worldwide.
he private sector already plays a large role in energy-technology innovation and in in-
ternational cooperation relating to it, and this role is growing over time.
♦ The large role is evident in the size of the private shares in U.S. total R&D (about 65 percent private in 1997), U.S. energy-technology R&D (about 60 percent private in 1997), and global North-South capital flows (about 85 percent private in 1997).
A
U
T
Private-Sector & Public-Sector Roles in International Energy Cooperation

Powerful Partnerships
ES-4
♦ Growth in these private roles over time re-flects trends in privatization and globaliza-tion of the world economy and in the priva-tization, deregulation, and restructuring of the energy industries.
here remains a need for government in-volvement because the public interest in en-
ergy outcomes goes beyond the sum of perceived private interests.
♦ Privatization, deregulation, and restructuring of energy industries help bring private capi-tal into the energy sector, but these same forces can lead to neglect of the ways the composition and operation of energy sys-tems affect the wider public interest (includ-ing meeting the basic needs of the poor, as well as addressing the other macroeconomic, environmental, international-secur-ity, and values issues listed above).
♦ Many of these public interests will only be adequately addressed if investments in en-ergy-technology innovation are made with longer time horizons (lower discount rates) and less risk aversion than the discount rates and degrees of risk aversion prevailing in the commercial marketplace.
♦ The gap between what the private sector does and what society’s interests require is further enlarged by a variety of barriers to efficient market performance, which may include inadequate information, excessive concentration or fragmentation in markets, high transactions costs, and more.
♦ Additional rationales for government en-gagement include complementarity of gov-ernment and private capabilities and the de-sirability of reducing the deleterious effects on international energy-technology coopera-tion of existing government policies (includ-ing not only those focused on energy and environmental issues per se but also trade policy, foreign policy, intellectual property rights policy, and so on).
overnment interventions should nonetheless always be cognizant of the large and grow-
ing role of the private sector, whose resources for energy-technology R&D somewhat exceed, and whose resources for energy-tech-nology deployment far exceed, those of governments. This means that government initiatives in ERD3 should be:
♦ structured to encourage, catalyze, and com-plement the corresponding activities of the private sector, not replace them;
♦ focused on lowering specific barriers or ad-dressing specific shortfalls relating to the private sector’s incentives and capacity to fully address society’s interests in energy innovation;
♦ designed to be limited in the rate and dura-tion of the government’s investment, with specific criteria for terminating projects that fall short and for handing off successful ones to the private sector.
here is a wide array of mechanisms through which the government can support interna-
tional ERD3 cooperation, including participation in, funding for, or other encouragement of coop-erative efforts in:
♦ the conduct of fundamental energy-related research and applied energy-technology R&D;
♦ demonstration and niche and pre-commercial deployment of innovative en-ergy technologies;
♦ shaping the environment for commercial deployment of innovative energy technolo-gies—increasing incentives, lowering barri-ers (especially in relation to finance), and setting appropriate standards—to reflect their public benefits;
♦ capacity building, integrated assessment, and institutional innovation in support of these approaches.
T
G
T
Executive Summary
ES-5
xisting U.S. government activities in inter-national ERD3 cooperation are significant
and often effective, but they are insufficient in relation to the challenges and the opportunities. The deficiencies are in scale, comprehensiveness and appropriateness of matching mechanisms to needs, coordination, and evaluation. ♦ A study conducted by RAND for this Panel
indicates that Federal government spending on international ERD3 activities by DOE, USAID, EPA, and the Nuclear Regulatory Commission in FY1997 was about $230 million, more than half of it on fusion and fission.
♦ The international ERD3 activities of these agencies, while generally well focused and effective, are inadequate in relation to the opportunities and insufficiently coordinated with each other and with the efforts of the other Federal agencies engaged in the fi-nancing of energy-technology deployment, which include the Ex-Im Bank, the Trade and Development Agency, and the Overseas Private Investment Corporation.
♦ There is neither an over-arching strategic vision integrating and ensuring the compre-hensiveness of the array of Federal activities on international energy RD3 cooperation nor a mechanism for implementing such a vision in a coherent and efficient way.
e believe that initiatives in four catego-ries—foundations of energy innovation and
cooperation, energy end-use efficiency, energy-supply technologies, and management of the government’s activities in support of ERD3 co-operation—are required to narrow the gap be-tween the Federal programs that exist and the needs they seek to address.
♦ Each category contains three to four initia-tive clusters. The elements that the Panel
agreed deserve highest priority in each clus-ter are described in this Executive Summary. The body of the report expands on these high-priority elements and presents other elements that the panel regarded as impor-tant.
Existing Federal Programs for energy
cooperation are not commensurate with either the needs or the opportunities
♦ All of our recommendations proceed from the presumption that the recommendations of the 1997 PCAST study of U.S. domestic energy R&D programs are being imple-mented. Effective international outreach must have sturdy domestic roots.
♦ Estimated budgets are provided here at the level of the initiative clusters—covering both the “high priority” and “other impor-tant” elements in each—in the form of an initial funding level for FY2001 and a level for FY2005 (in as-spent dollars). These fig-ures are intended to be supplemental to ex-isting budgets for international ERD3 activi-ties and to the budgets proposed in the 1997 PCAST study for domestic energy R&D programs; and they are intended to cover both the “high priority” and “other impor-tant” initiative elements described.
♦ The great diversity of technical options and even greater diversity of geographic, eco-nomic, and institutional environments in which these options might be applied made it impractical, within the limited time and resources available for a study of this kind, to develop a fully comprehensive and priori-tized set of recommendations for all of the cooperative activities that could and should be done in the decades ahead. But we be-lieve what we are proposing here constitutes the core of a sensible program for the next five years.
E
W
Initiatives

Powerful Partnerships
ES-6
♦ The list of high-priority opportunities we present here is based on a preliminary at-tempt to take into account the potential lev-erage of different options against U.S. inter-ests and values affected by the energy chal-lenges in different regions and worldwide, the likelihood of success based on the strengths and experience the partners would bring to the prospective cooperative efforts, the timeliness of the efforts in terms of win-dows of opportunity and maturity of needed technical and institutional ingredients, com-plementarity with private-sector efforts, and likely cost-effectiveness.
♦ Success in international cooperation depends strongly on engagement of all of the partners and technology users, from the beginning, in defining goals, outlining tasks, and setting priorities. While our recommendations have been developed in consultation with experts from many other countries, the details of what specific projects should go forward at what levels, under the auspices of what U.S. agencies, with what partner countries and institutions will need to be worked out with the help of an interactive process in which the agencies, the Interagency Working Group described further below, the foreign partners, and the users are all involved.
he first category of initiatives comprises measures to build stronger foundations for
energy-technology innovation and interna-tional cooperation relating to it. It consists of initiative clusters focused on capacity building, energy-sector reform, demonstration and cost buy-down, and financing.
♦ The capacity-building cluster, designed to prepare the ground for rapid and sustainable energy-technology innovation, is recom-mended for funding at $20 million per year in FY2001, increasing to $40 million per year in FY2005. It contains as high-priority elements:
(1) increased support for existing regional
centers for RD3 of sustainable energy options (such as the PROCEL national
electricity-conservation program in Bra-zil, energy-efficiency centers in Eastern Europe and Russia, and other centers in Africa, Asia, and Latin America) and es-tablishment of new sustainable-energy centers in regions with significant need that cannot be met by other means; and
(2) expansion of existing—and develop-
ment of new—training programs for en-ergy analysts and managers, to include traveling workshops and internet-based courses and expert assistance, as well as a requirement that in-country technical and managerial training be a component of NGO technology demonstration and deployment projects supported by the U.S. government.
Government initiatives should be structured to encourage, catalyze,
and complement the corresponding activities of the private sector,
not replace them
♦ The energy-sector reform cluster is designed to support and shape energy-sector reform and restructuring—moving towards open competitive markets with improved financial performance—while retaining incentives for energy-technology innovation that address public goods and externalities. Recom-mended for funding at $20 million per year in FY2001, increasing to $40 million per year in FY2005, it has as high-priority ele-ments:
(1) technical and policy advice—including
through direct provision of personnel to the relevant partner-country organiza-tions or through multilateral institu-tions—to countries considering or un-dergoing energy-sector reform, with emphasis on (a) “getting prices right” through elimination of price controls
T
Executive Summary
ES-7
and subsidies for conventional energy sources and through internalizing envi-ronmental costs, and (b) creating Public Benefits Funds (PBFs) to provide re-sources for advancing public benefits in the restructured energy sector—with funds raised through non-bypassable wires/pipes charges or by other means, including initial support from debt swaps in appropriate cases; and
(2) assistance in establishing evolutionary
regulatory frameworks for natural gas grids, beginning with simple pipeline systems linking large gas producers with large users and growing into grids serv-ing a much wider range of producers and consumers.
♦ The cluster on demonstration and cost buy-down mechanisms is designed to facilitate the demonstration, in foreign contexts, of advanced energy technologies with signifi-cant public benefits and to provide the means to “buy down” to competitive levels the costs of technologies in this category that have learning-curve characteristics mak-ing this practical. Recommended for fund-ing at $40 million per year in FY2001, in-creasing to $80 million per year in FY2005, it has as high-priority elements:
(1) provision of assistance in establishing a
Demonstration Support Facility (DSF), preferably at the Global Environment Facility (GEF), to provide a framework for clean-energy demonstration projects that would attract support from the pri-vate sector as well as from various pub-lic-sector sources (including the GEF and PBFs and government grants in host countries);
(2) awarding of energy-production tax cred-
its to U.S. firms participating in demon-stration projects that are carried out un-der the DSF and that meet approved cri-teria (including being formulated so as not to conflict with U.S. opposition to tied aid); and
(3) provision of assistance in establishing a Clean Energy Technology Obligation (CETO), preferably at the GEF, that would use competitive instruments to “buy down” the costs of targeted inno-vative technologies with incremental cost support provided by the GEF and by the host country through PBFs or government grants.
♦ The financing cluster, aimed at overcoming financial barriers to deployment of clean and efficient energy technologies in developing and transition economies, is recommended for funding at $40 million per year in FY2001, increasing to $80 million per year in FY2005. Its high-priority elements are:
(1) measures to encourage increased financ-
ing for clean and efficient energy tech-nologies from the Multilateral Devel-opment Banks (MDBs), including (a) establishing or expanding “trust funds” through the relevant U.S. agencies (such as DOE, USAID, EPA, and the U.S. Trade and Development Agency), which the MDBs can draw upon to support agency-approved technical assistance for project planning work, and (b) de-veloping contingency plans and mecha-nisms for reinforcing, if necessary, the transition in World Bank and other MDB energy-project funding away from conventional energy technologies in fa-vor of clean energy technologies (which is being driven by the ability of re-formed energy markets to attract private capital for conventional technologies and the desirability of not distorting these markets with publicly supported MDB funds); and
(2) additional measures implemented by
U.S. agencies to facilitate market-based finance of clean and efficient energy technologies, including creating a fund administered by the Overseas Private Investment Corporation (OPIC) to pro-vide financing for these types of projects (to be phased out as the MDBs complete

Powerful Partnerships
ES-8
the transition to supporting clean energy technologies and advancing other public benefits).
he second category of initiatives addresses specific opportunities for international co-
operation for innovation on energy-end-use technologies. It consists of initiative clusters focused on energy-efficient buildings, improved small vehicles and buses, factories of the 21st century, and cogeneration of heat and power.
♦ The buildings cluster has the goal of reduc-ing energy use in new appliances, homes, and commercial buildings in developing and transition countries by 50 percent over the next two decades compared to current per-formance. Recommended for funding at $20 million per year in FY2001, increasing to $40 million per year in FY2005, its high-priority elements are:
(1) technical and policy assistance—with
participation from DOE, EPA, and USAID—for the development and im-plementation of efficiency standards for, and ratings and labeling of, building equipment and appliances, including co-operation in setting up appliance and equipment testing laboratories and pro-grams, in developing and analyzing standards, in harmonizing test proce-dures and standards where there is U.S. interest in doing so, and in implement-ing voluntary energy-efficiency labeling and promotion programs similar to the DOE/EPA “Energy Star” program;
(2) similarly organized technical and policy
assistance for development, distribution, and training in the use of building-design software that minimizes energy use in residential and commercial build-ings while enhancing building livability and amenity value; for development and monitoring of building design competi-tions to push the envelope of building energy performance; and for develop-ment, analysis, and implementation of building energy codes and standards, in-
cluding assistance with training, moni-toring, compliance, and enforcement programs and with software tools;
(3) U.S. encouragement for the GEF, World
Bank, and other multilateral financing institutions to support development and adoption of the measures described here as part of an aggressive pursuit of build-ing-energy efficiency improvements throughout their grant and lending pro-grams.
♦ The vehicles cluster is aimed at research, development, and demonstration of cleaner, more energy-efficient buses and two- and three-wheeled vehicles and at accelerating the deployment of such vehicles in develop-ing and transition countries. Recommended for funding at $20 million per year in FY2001, increasing to $40 million per year in FY2005, its high-priority elements are:
(1) integration and expansion of activities of
DOE, EPA, and USAID, and encour-agement of the same in the GEF, on co-operative RD3 of low-cost, clean, effi-cient power sources for transportation—particularly fuel-cell systems for two- and three-wheeled vehicles and hybrid and fuel-cell systems for buses, as well as electric and alternative-fuel propul-sion systems where appropriate, and en-couragement of joint ventures involving U.S. and foreign companies to manufac-ture these vehicles and fuel-production systems;
(2) U.S. encouragement for the GEF, Inter-
national Finance Corporation, World Bank, and other multilateral develop-ment banks to help finance the vehicle-manufacturing capacity, infrastructure, and consumer-credit systems necessary for large-scale deployment of these ad-vanced vehicles;
(3) EPA assistance to developing and transi-
tion countries for the analysis and im-plementation of emissions standards, in-
T

Executive Summary
ES-9
cluding establishment of vehicle testing and inspection programs for all types of motor vehicles.
A “Business-as-Usual” energy future
would be problem-plagued and potentially disastrous
♦ The factories of the 21st century cluster aims at engaging U.S. industry in partner-ships to reduce the energy intensity of major energy-using industrial processes in key de-veloping and transition countries over the next two decades by 40 percent compared to their current performance, while improving labor and capital productivity. This effort will be guided by the on-going U.S. “Indus-tries of the Future” program, focusing on ar-eas of high foreign market growth in energy-intensive materials. Recommended for fund-ing at $10 million per year in FY2001, in-creasing to $20 million per year in FY2005, its high-priority elements are:
(1) cooperation between the U.S. public and
private sectors and foreign counterparts to develop “technology roadmaps” for more productive and energy-efficient industrial processes geared to local cir-cumstances, with emphasis on energy-intensive basic-materials industries such as iron and steel, chemicals, pulp and paper, and cement;
(2) cooperative development and implemen-
tation, starting from these roadmaps, of RD3 workplans including human and in-stitutional capacity building, precom-petitive research and development, tech-nical exchanges, and pilot demonstration programs;
(3) support by U.S. and partner govern-
ments for project development and im-plementation, joint-venture creation, and
licensing to facilitate technology trans-fer between U.S. firms and their part-ners.
♦ The cogeneration cluster is aimed at promot-ing the use of combined-heat-and-power (CHP) technologies for new power supply, with a goal of providing 20 percent of new generating capacity in developing countries over the next few decades using CHP. Rec-ommended for funding at $10 million per year in FY2001, increasing to $20 million per year in FY2005, it contains as its high-priority elements:
(1) cooperation between the U.S. public and
private sectors and foreign counterparts on CHP information and education pro-grams, including regional workshops, for public- and private-sector partici-pants;
(2) collaborative assessments of power and
heat loads and output ratios at potential CHP sites in order to identify favorable conditions for CHP, address potential regulatory and market barriers, help at-tract funding for demonstrations, and help secure financing for deployment; and
(3) support of reforms in domestic regula-
tory structures, through assistance by U.S. experts from DOE, AID, and EPA, to “level the playing field” for CHP and for U.S. CHP equipment, including provision for power sales to the grid at market rates, nondiscriminatory power buy-back rates, interconnection and emissions standards, and nondiscrimina-tory international standards for CHP equipment.
he third category of initiatives addresses specific opportunities for international co-
operation for innovation on energy-supply technologies. It consists of initiative clusters focused on widespread use of renewable energy technologies, fossil-fuel decarbonization and
T

Powerful Partnerships
ES-10
CO2 sequestration, and nuclear fission and fu-sion.
♦ The widespread renewables cluster is aimed at accelerating the development and de-ployment of biomass, wind, photovoltaic, solar thermal, and other renewable energy technologies, including tailoring and deploy-ing these to support rural development in developing countries, such that in the second quarter of the 21st century renewables could make contributions to world energy supply comparable to the contributions from fossil fuels today. Recommended for funding at $40 million per year in FY2001, increasing to $80 million in FY2005, its high-priority elements are:
(1) promotion of collaborative RD3 on in-
dustrial-scale biomass energy conver-sion technologies, emphasizing those that provide both electricity and one or more co-products (heat, fluid fuels, chemicals, food, fiber), as well as col-laborative research on the restoration of degraded lands and their use for grow-ing crops optimized to yield multiple products;
(2) expansion of existing programs with
selected developing- and transition-country partners to develop integrated systems involving renewable energy technologies and their hybrids with fos-sil energy to provide complete energy services for agricultural, residential, and village-scale commercial and industrial applications in rural areas;
(3) collaboration in measures to accelerate
the deployment of grid-connected in-termittent renewable electric technolo-gies and their hybrids with fossil energy using competitive instruments (such as CETO competitions), including facilita-tion of participation of U.S. firms in this process; and
(4) development, in collaboration with ap-
propriate partners, of assessments of re-
newable energy resources on a region-by-region basis.
Basic U.S. values—respect for human dig-nity and human rights, belief in equity and opportunity, commitment to assistance for the least fortunate and to stewardship for future generations and for the environ-
ment—dictate U.S. leadership in interna-tional cooperation in energy innovation
♦ The fossil-fuel decarbonization and CO2 sequestration cluster is designed to develop, via a broad multinational collaborative ef-fort, fuels decarbonization and carbon-sequestration technologies that would even-tually make possible the economic use of fossil fuels with near-zero lifecycle CO2
emissions and near-zero pollutant emissions, as well as to advance, in developing and transition countries in the near term, syngas-based technologies that would facilitate the transition toward near-zero lifecycle CO2
emissions. This initiative would build on ac-tivities under DOE’s “Vision 21”. Recom-mended for funding at $20 million per year in FY2001, increasing to $40 million per year in FY2005, its high-priority elements are:
(1) cooperation to promote energy-sector
and environmental reforms in develop-ing and transition countries, making it more advantageous to produce multiple clean products from syngas derived from natural gas, coal, and other carbo-naceous feedstocks;
(2) collaborative R&D and demonstrations
of technologies designed to reduce the cost of making hydrogen from carbona-ceous feedstocks while facilitating the recovery of byproduct CO2 for ultimate disposal; and.

Executive Summary
ES-11
(3) collaborative efforts on CO2 sequestra-tion to develop standards for security of CO2 storage, conduct environmental impact studies, carry out both region-by-region assessments of sequestration po-tential and detailed reservoir-by-reser-voir analyses of storage capacity and other characteristics, and carry out dem-onstrations with monitoring of storage security;
♦ The nuclear cluster, aimed at preserving and enhancing the possibility that nuclear energy could play an expanding role in addressing climate change and other energy-related challenges in the next century, is recom-mended for funding at $10 million per year in FY2001, increasing to $20 million per year in FY2005. It contains as high-priority elements:
(1) addition of an explicit international
component to the DOE’s new Nuclear Energy Research Initiative (NERI), promoting bilateral and multilateral re-search focused on advanced technolo-gies for improving the cost, safety, waste management, and proliferation re-sistance of nuclear fission energy sys-tems;
(2) expansion and strengthening of interna-
tional cooperative efforts in studies and information exchange on geologic dis-posal of spent fuel and high-level wastes, to include expanded participa-tion, studies of international interim-storage facilities, and development of a consistent and rigorous international regulatory framework for both interim storage and geologic disposal of these materials;
(3) pursuit of a new international agreement on fusion R&D that commits the parties to a broad range of collaborations on all aspects of fusion energy development, while selectively enhancing U.S. par-ticipation in existing fusion experiments abroad and inviting increased foreign
participation in new and continuing smaller fusion experiments in the United States.
ur last category of initiatives addresses mechanisms and institutions through
which the U.S. government, in cooperation with the private sector, can more effectively develop, manage, and coordinate a portfolio of governmental activities in support of interna-tional ERD3 cooperation consistent with an overarching vision of what this portfolio is to accomplish. Our high-priority recommenda-tions in this category are as follows:
♦ The President should establish a new Inter-agency Working Group on Strategic Energy Cooperation in the National Science and Technology Council (NSTC) to further de-velop and promote a strategic vision of the role of the government’s contributions to in-ternational ERD3 cooperation in support of this country’s interests and values. This NSTC working group would:
(1) have an interagency secretariat and an
Advisory Board drawn from the private, academic, and NGO sectors;
(2) be responsible for continuing assess-
ment of the government’s full portfolio of activities in international ERD3 coop-eration—building on this study and in consideration of the overarching strat-egy of the effort, the needed components of the innovation “pipeline” and links between these, and appropriate diversity and public-private-interface criteria—and for using the results of such portfo-lio assessment to help guide and coordi-nate the evolution of the relevant agency programs;
(3) assist the agencies to strengthen their in-
ternal and external mechanisms for monitoring and reviewing projects, for terminating unsuccessful ones, and for handing off successful ones to the pri-vate sector at the appropriate time.
O

Powerful Partnerships
ES-12
♦ In addition to these strengthened review procedures and the interagency portfolio as-sessment effort, needed improvements in the mechanisms for development and manage-ment of international ERD3 cooperation programs within the agencies include
(1) use of competitive solicitations by the
agencies, in cooperation with foreign counterparts, to identify the most prom-ising approaches to achieving portfolio and program goals, with a well devel-oped business plan for moving a tech-nology through the RD3 pipeline a pre-requisite for winning a competition;
(2) identification, by the Cabinet Secretaries
or administrators of the key agencies implementing the ERD3 cooperation portfolio, of appropriate accountable management chains with authority and budgets for implementing international ERD3 programs;
(3) strengthening these agencies’ interna-
tional capabilities through training, tar-geted hiring, and rotating national labo-ratory staff and outside academic and industrial technical experts through the agencies on a systematic basis, giving these persons senior professional status with significant responsibility for guid-ing program planning and policy.
♦ The costs of the U.S. government contribu-tions to the initiatives described in this re-port would be covered by a new Strategic Energy Cooperation Fund, supplementing existing budgets for international ERD3 ac-tivities and the budgets proposed in the 1997 PCAST study for U.S. domestic energy R&D programs. The amounts estimated for the four “foundation”, four “end-use-efficiency”, and three “energy-supply” ini-tiative clusters we have recommended sum to $250 million per year in FY2001 and $500 million per year in FY2005. (The in-crement for FY2001 adds an amount of new money for these types of activities approxi-mately equal to the total that was spent on
them in FY1997.) The money from the Strategic Energy Cooperation Fund would be
(1) allocated to the relevant agencies in the
President’s budget request as the out-come of a process engaging the agen-cies, the Office of Management and Budget, and the Interagency Task Force on Strategic Energy Cooperation and its Advisory Board;
(2) multi-year in duration in most instances,
to diminish the influence of annual funding cycles on project selection and continuation and to promote the continu-ity of commitment that has often been lacking in U.S. international-cooperation efforts.
Money made available, within the program’s indicated FY2001-2005 trajectory, by phasing out support for projects that either fail or that succeed and get taken over by the private sector could be used for further high-leverage projects identified through the continuing interactions of agencies, the Interagency Task Force and its Advisory Board, foreign partners, and other en-ergy-technology users.
he United States and the world face an his-toric window of opportunity.
♦ Processes of energy-sector restructuring and regulatory reform that will be completed largely over the next decade will “lock in” the mechanisms that will determine success or failure in the dual aims of attracting the private capital needed to meet energy needs for economic development while addressing the huge public-goods and externality issues that the energy sector presents.
♦ Continuing processes of rapid urbanization in the developing countries mean that deci-
T
Conclusion

Executive Summary
ES-13
sions made in those countries in the next few decades about the interaction of urban en-ergy supply, transportation networks, infor-mation infrastructure, land-use planning, and building characteristics will likewise sub-stantially “lock in”, for the next century and even beyond, important aspects of the en-ergy requirements and quality of life of the large majority of the world’s inhabitants liv-ing in these urban agglomerations.
♦ The time requirements for moving new technologies through the innovation pipeline mean that much of the research intended to affect deployments in the 2020s, 2030s, and 2040s needs to be underway in the next dec-ade. And the long service lifetimes of most energy-supply technologies and much of the equipment and infrastructure governing en-ergy end-use efficiency means that much of what is deployed in the 2020s, 2030s, and 2040s will still be in place toward the end of the next century.
♦ Thus the energy technologies and related infrastructures that are developed and de-ployed over the next few decades—supporting rapid energy growth in develop-ing and transition economies and replacing existing capital stock in industrialized ones—will strongly influence the trajecto-ries of energy costs and end-use efficiencies, greenhouse-gas emissions, public-health im-pacts of air pollution, oil-import depend-ence, nuclear-energy-system safety and pro-liferation resistance…and much else of im-portance about the world energy system for most of the next century.
♦ The globalization of innovation capacities, together with tightening constraints on do-mestic R&D spending, have sharply in-creased the attractiveness of cooperation to the United States for purposes of developing the energy technologies this country will re-quire for domestic use. Simultaneously, the globalization of energy markets has in-creased the necessity of cooperation to gain access for United States energy companies to many of the largest markets for new tech-
nologies; and the globalization of environ-mental and security risks from inadequacies in the global portfolio of deployed energy options is sharply increasing the benefits to the United States of cooperation to improve that portfolio.
♦ Strengthening North-South cooperation on advanced energy technologies that can lower greenhouse-gas emissions while fueling sus-tainable economic development is by far the most promising available approach to secur-ing developing-country participation in a larger collaborative framework for address-ing the global energy-climate-develop-ment challenge.
The energy technologies and related
infrastructures that are developed and de-ployed over the next few decades will strongly influence the world energy system for most of the next century
The needs and opportunities for enhanced inter-national cooperation on energy-technology in-novation supportive of U.S. interests and values are thus both large and urgent. The costs and risks are modest in relation to the potential gains. Now is the time for the United States to take the sensible and affordable steps outlined here to address the international dimensions of the energy challenges to U.S. interests and val-ues that the 21st century will present.
ES-14
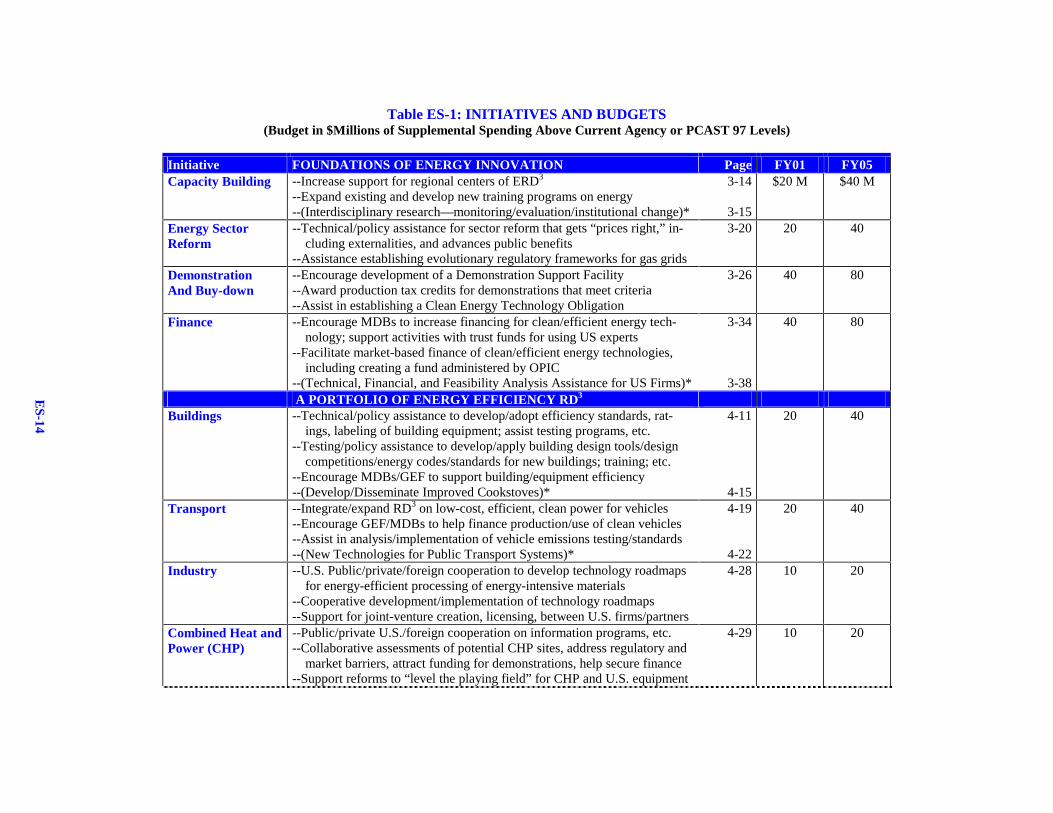
Table ES-1: INITIATIVES AND BUDGETS (Budget in $Millions of Supplemental Spending Above Current Agency or PCAST 97 Levels)
Initiative FOUNDATIONS OF ENERGY INNOVATION Page FY01 FY05 Capacity Building --Increase support for regional centers of ERD3
--Expand existing and develop new training programs on energy --(Interdisciplinary research—monitoring/evaluation/institutional change)*
3-14
3-15
$20 M $40 M
Energy Sector Reform
--Technical/policy assistance for sector reform that gets “prices right,” in-cluding externalities, and advances public benefits
--Assistance establishing evolutionary regulatory frameworks for gas grids
3-20
20 40
Demonstration And Buy-down
--Encourage development of a Demonstration Support Facility --Award production tax credits for demonstrations that meet criteria --Assist in establishing a Clean Energy Technology Obligation
3-26
40 80
Finance --Encourage MDBs to increase financing for clean/efficient energy tech-nology; support activities with trust funds for using US experts
--Facilitate market-based finance of clean/efficient energy technologies, including creating a fund administered by OPIC
--(Technical, Financial, and Feasibility Analysis Assistance for US Firms)*
3-34
3-38
40 80
A PORTFOLIO OF ENERGY EFFICIENCY RD3 Buildings
--Technical/policy assistance to develop/adopt efficiency standards, rat-ings, labeling of building equipment; assist testing programs, etc.
--Testing/policy assistance to develop/apply building design tools/design competitions/energy codes/standards for new buildings; training; etc.
--Encourage MDBs/GEF to support building/equipment efficiency --(Develop/Disseminate Improved Cookstoves)*
4-11
4-15
20 40
Transport
--Integrate/expand RD3 on low-cost, efficient, clean power for vehicles --Encourage GEF/MDBs to help finance production/use of clean vehicles --Assist in analysis/implementation of vehicle emissions testing/standards --(New Technologies for Public Transport Systems)*
4-19
4-22
20 40
Industry --U.S. Public/private/foreign cooperation to develop technology roadmaps for energy-efficient processing of energy-intensive materials
--Cooperative development/implementation of technology roadmaps --Support for joint-venture creation, licensing, between U.S. firms/partners
4-28
10 20
Combined Heat and Power (CHP)
--Public/private U.S./foreign cooperation on information programs, etc. --Collaborative assessments of potential CHP sites, address regulatory and
market barriers, attract funding for demonstrations, help secure finance --Support reforms to “level the playing field” for CHP and U.S. equipment
4-29
10 20
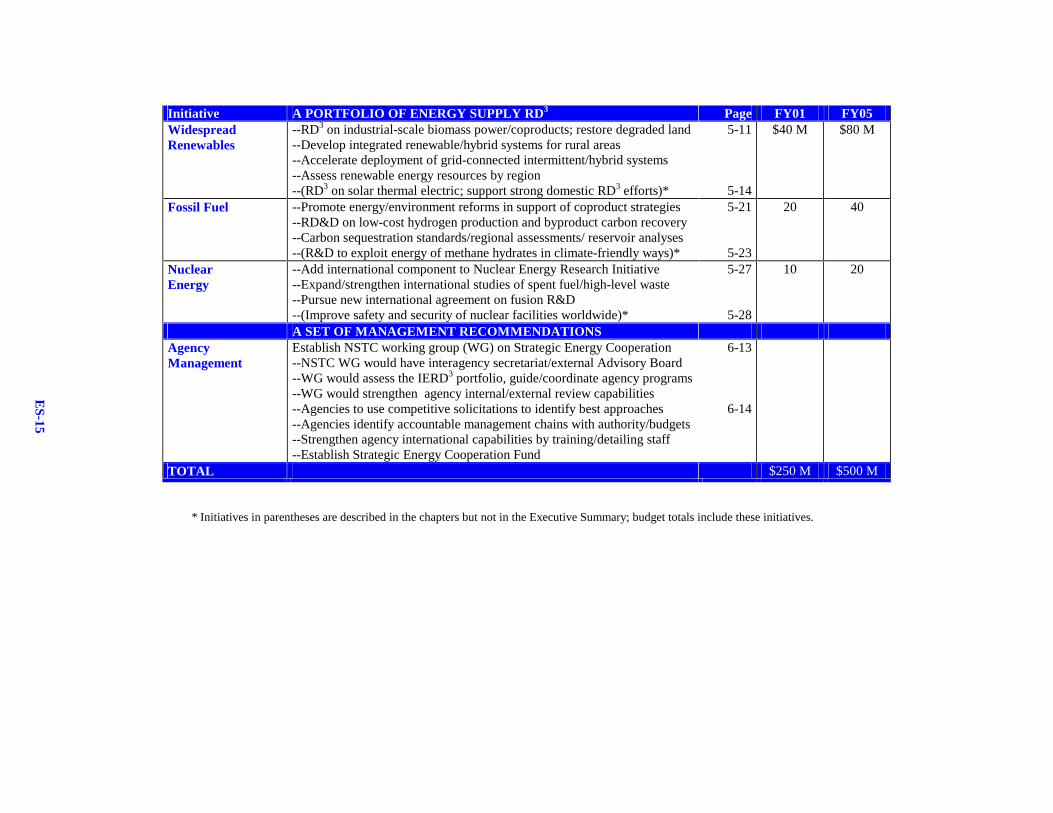
ES-15
Initiative A PORTFOLIO OF ENERGY SUPPLY RD3 Page FY01 FY05 Widespread Renewables
--RD3 on industrial-scale biomass power/coproducts; restore degraded land --Develop integrated renewable/hybrid systems for rural areas --Accelerate deployment of grid-connected intermittent/hybrid systems --Assess renewable energy resources by region --(RD3 on solar thermal electric; support strong domestic RD3 efforts)*
5-11
5-14
$40 M $80 M
Fossil Fuel --Promote energy/environment reforms in support of coproduct strategies --RD&D on low-cost hydrogen production and byproduct carbon recovery --Carbon sequestration standards/regional assessments/ reservoir analyses --(R&D to exploit energy of methane hydrates in climate-friendly ways)*
5-21
5-23
20 40
Nuclear Energy
--Add international component to Nuclear Energy Research Initiative --Expand/strengthen international studies of spent fuel/high-level waste --Pursue new international agreement on fusion R&D --(Improve safety and security of nuclear facilities worldwide)*
5-27
5-28
10 20
A SET OF MANAGEMENT RECOMMENDATIONS Agency Management
Establish NSTC working group (WG) on Strategic Energy Cooperation --NSTC WG would have interagency secretariat/external Advisory Board --WG would assess the IERD3 portfolio, guide/coordinate agency programs --WG would strengthen agency internal/external review capabilities --Agencies to use competitive solicitations to identify best approaches --Agencies identify accountable management chains with authority/budgets --Strengthen agency international capabilities by training/detailing staff --Establish Strategic Energy Cooperation Fund
6-13
6-14
TOTAL $250 M $500 M
* Initiatives in parentheses are described in the chapters but not in the Executive Summary; budget totals include these initiatives.

ES-16

1-1
CHAPTER 1
U.S. INTERESTS AND GOVERNMENT ROLES IN INTERNATIONAL COOPERATION ON ENERGY INNOVATION
Destiny is not a matter of chance, it is a matter of choice; it is not a thing to be waited for, it is a thing to be achieved.
William Jennings Bryan1
mericans have a clear and compelling interest in the availability, in this country, of energy supplies that are abundant enough to meet the energy needs of every citizen, now and in the future; inexpensive enough to avoid undue burdens on the poor or erosion of the competitiveness
of energy-intensive U.S. industries in the global marketplace; reliable enough to preclude significant economic and social impacts arising from energy-supply disruptions; and environment-sparing enough to allow continuing improvement in the environmental dimensions of American well-being even as energy use to fuel the economic dimensions grows. This is a great deal to demand of the country’s energy-supply system. Achieving it will require continuing innovation to improve the characteristics of energy-supply technologies and to increase the efficiency with which energy is used to generate the goods and services that society requires. U.S. interests in innovation in energy technologies encompass not only domestic but also international dimensions, the latter arising both from the increasing globalization of many aspects of energy problems and from the increasing globalization of the processes of technological innovation needed to solve domestic and global energy problems alike. Specifically, the United States must concern itself with the choices other countries make about energy strategies and technologies because of the consequences of those choices for:
• the size of potential foreign markets for U.S. energy technologies and know-how; • the prices of internationally traded energy forms, above all oil; • the extent of world dependence on oil and gas imported from politically volatile regions, with its
implications for supply disruptions with global economic consequences and the potential for military conflict over access to these resources;
• the probabilities of accidents at, or thefts of nuclear materials from, nuclear-energy facilities in
other countries; • the emissions of energy-related pollutants with impacts on global environmental conditions,
above all on climate; and • the pace and extent of sustainable development available in the less developed countries, with
implications for U.S. political as well as economic interests.
1 Bryan (1899)
Powerful Partnerships
1-2
The United States has a stake in international cooperation on energy-technology innovation because such cooperation promotes outcomes favorable to U.S. interests in all of these respects; because it brings the United States better access to and understanding of foreign energy-technology markets; because it enables sharing the costs and risks of developing new energy technologies—as well as gaining access to relevant specialized expertises and facilities—across national boundaries in a world where innovation capacity is increasingly widely dispersed; and because it reflects and promotes fundamental American values including equity, opportunity, charity, and environmental stewardship. Although the international cooperative activities in energy innovation undertaken by the private sector contribute substantially to these goals, there are several reasons the government should and does undertake activities that reinforce and complement private-sector efforts. These rationales for government involvement include public interests in such cooperation that exceed the private interests in participating in it; diminution of private-sector performance by barriers arising from market structure, scale of needed investment, degree of risk, time horizon for expected return, or combinations of these; complementarity of public and private capabilities; and need for coordination and reconciliation of energy-cooperation goals and mechanisms with other government goals and policies, including foreign policy, defense policy, trade policy, tax policy, environmental policy, antitrust policy, and intellectual property rights policy. The analysis and recommendations we present in this report focus on increasing the effectiveness and coherence of the activities of the U.S. government that implement, support, or otherwise affect international cooperation on energy innovation—that is, on energy research, development, demonstration, and deployment (ERD3). In what follows in the remainder of this introductory chapter, we first explain the origin of this study in a previous PCAST2 examination of the Federal government’s overall effort in energy research and development, describe the specific charge to our panel, and outline the organization of the report. We then elaborate on U.S. interests in international cooperation on ERD3 in the context of a range of scenarios for how the global energy future might unfold and the challenges that realization of these scenarios would pose. There follow descriptions of the forms that such cooperation can take, the ways in which the Federal government participates in, supports, or otherwise influences these activities, and the rationales that can be adduced for the character and size of this Federal involvement. Finally, in the last part of the chapter, we address the interaction of government policies on international ERD3 cooperation with other government energy and non-energy policies, and we offer some observations on the leverage that increased ERD3 cooperation can and must provide against the challenges ahead. ORIGINS, FOCUS, AND ORGANIZATION OF THE STUDY The PCAST study on “Federal Energy Research and Development for the Challenges of the Twenty-First Century”, which was requested by President Clinton in January 1997 and delivered in final form in November of that year, found that increased investment in energy-technology innovation offers high leverage in the pursuit of American economic, environmental, and national security interests.3 Specifically, the study concluded that attainable energy-technology improvements could, among other benefits, lower the future costs of supplying energy below what they would otherwise be; lower energy’s effective costs still further by increasing the efficiency of its end uses; increase the productivity of U.S. industry; increase U.S. exports of high-technology energy-supply and energy-end-use products and know-how; reduce the emissions of air pollutants hazardous to human health and to ecosystems; slow the build-up of heat-trapping gases in the global atmosphere; improve the safety and proliferation resistance of
2 President’s Committee of Advisors on Science and Technology. 3 PCAST (1997).

CHAPTER 1: U.S. Interests and Government Roles
1-3
nuclear energy operations around the world; reduce over-dependence on oil imports here and in other countries; and enhance the prospects for politically stabilizing economic development in the many of the world’s potential trouble spots. The primary rationale for the engagement of the public sector in the pursuit of these benefits, the study noted, is the existence of innovation needs and opportunities where the potential benefits to society warrant a greater investment than the prospective returns to the private sector can elicit. Taking into account the likely size and character of private-sector investments in energy innovation currently and in the decades immediately ahead, the PCAST study found that the energy research and development programs of the Federal government “are not commensurate in scope and scale with the energy challenges and opportunities the twenty-first century will present”. Accordingly, the study recommended “strengthening the DOE applied energy-technology R&D portfolio by increasing funding for four of its major elements (energy end-use efficiency, nuclear fission, nuclear fusion, and renewable energy technologies) and restructuring part of the fifth (fossil-fuel technologies).” It also recommended “targeted efforts to improve the prospects of commercialization of the fruits of publicly funded energy R&D in specific areas; increased attention to certain international aspects of energy R&D; and changes in the prominence given to energy R&D in relation to the Department’s other missions, coupled with changes in how this R&D is managed.” The current study elaborates on the earlier study’s recommendation for increased attention to the international dimensions of energy-technology innovation. The President’s charge to his Science Advisor, Neal Lane, in July 1998 was “to report to me…on ways to improve the U.S. program of international cooperation on energy R&D to best support our nation’s priorities and address the key global energy and environmental challenges of the next century.” In his charge to the PCAST panel formed to assist him in preparing this advice, Dr. Lane indicated that the panel should address the following specific issues:
• the character of the energy-linked challenges facing the United States and the world in the first part of the next century;
• experience to date in the principal U.S. agencies involved in international cooperation in energy
R&D, including lessons learned that should shape future activities; • experience to date in—and lessons learned from—multilateral international energy R&D
activities (including efforts of the United Nations and the multilateral development banks) and the bilateral cooperative energy R&D activities of other countries;
• approaches to bridging the gap between R&D and deployment; and • development of a strategic framework and action agenda for improving the capacity of
international cooperation on energy to meet national and global challenges. Our report in response to this charge is organized into six parts. As noted above, the remainder of this first chapter elaborates on U.S. interests and government roles in international cooperation in energy innovation. The second chapter provides a picture of the current status of and recent trends in public and private ERD3 activities worldwide, including international cooperation on ERD3, and identifies the principal economic and political forces that have been influencing this picture. Chapter 3 presents guidelines for shaping the Federal response to the challenges the preceding chapters have identified and proposes some energy-cooperation initiatives that cut across energy-supply and energy-end-use opportunities. The fourth chapter proposes further cooperative initiatives focused specifically on opportunities for improving energy end-use efficiency, and the fifth chapter does the same in relation to

Powerful Partnerships
1-4
opportunities for improving energy-supply technologies. Chapter 6 summarizes lessons learned from past experiences with international ERD3 cooperation, offers recommendations on improving the management and coordination of the U.S. government’s programs, and characterizes the leverage that enhanced international cooperation on ERD3 could provide against the energy-linked global challenges to U.S. interests and values that the next fifty years are likely to present. A number of topics related to those treated (and to our charge) have been excluded from our detailed consideration, despite their relevance, because including them would have posed insuperable difficulties within the time and resource constraints applicable to this study. The most important of these exclusions are international cooperation in: (a) science and technology education; (b) the areas known, in DOE parlance, as “basic energy sciences” (fields—such as applied mathematics, computer sciences, materials sciences, and chemical engineering—wherein advances benefit innovation across a wide range of energy technologies); and (c) environmental and biomedical research aimed at improving understanding of the environmental and health impacts of energy technologies—for example, global-change research and epidemiological studies of the health consequences of air pollution.4 We have also bounded the scope of our study in the time dimension, focusing most of our attention on the period between now and the midpoint of the 21st century. Even 2050 is far into a future certain to be influenced by surprises. But it is also closer in energy-technology terms than one might think: electric power plants that go into operation in 2010, embodying innovations that are in the late stages of development today, may still be operating in 2050; and some ideas that are only in the most preliminary stages of investigation today (such as solar cells that produce hydrogen directly from sunlight)—or others already long pursued but still posing very demanding development challenges (such as fusion)—may just be entering the commercial marketplace fifty years hence.5 Finally, we have given more emphasis to cooperation with developing and transition countries than to cooperation with industrialized countries, both because more needs to be done in the former cases than in the latter to build the conditions in which the private sector will do most of what is required and because most of the growth in energy use over the next 50 years will be in the developing world. THE U.S. STAKE IN INTERNATIONAL COOPERATION ON ERD3 The way in which the world energy future evolves and the role the United States plays in that evolution will have profound effects on the economic, environmental, and national-security interests of this country, as well as on its capacity to realize, around the world, its most fundamental values. International cooperation on energy research, development, demonstration, and deployment represents one of the main mechanisms through which the United States can influence the global energy outcomes that are so important in these respects.6 At the same time, U.S. participation in such cooperation enhances this country’s capacity to benefit domestically from increasingly globalized sources of energy-technology innovation. In developing these arguments, it is helpful to begin with a brief synopsis of trends, scenarios, and challenges in the global energy system.
4 Such “impacts” research is to be distinguished from R&D aimed at improving energy technologies to reduce these
impacts, which is within our scope here. 5 Historically, in fact, the time required for a new energy source to go from conception to large-scale commercial
application has typically been in the half-century range. See, e.g.,�1DNLüHQRYLü�et al. (1998). 6 The other two main mechanisms for this are (a) leading by example and (b) participating as both a supplier and a
consumer in world energy-resource and energy-technology markets. All three mechanisms are important, and they are interrelated.

CHAPTER 1: U.S. Interests and Government Roles
1-5
The Evolving Global Energy System: Trends, Scenarios, Challenges Understanding the global energy system and its economic, environmental, and political ramifications requires knowing how much energy is supplied, for what purposes, from what resources, using what technologies, under what institutional arrangements, and at what monetary and social costs. All this must be known not just in aggregates and averages for the world as a whole, but also disaggregated by continents, countries, or subnational regions, depending on the details of the questions being asked. We describe here only a few key features, at the level of the globe and representative countries, to suggest both the overall picture and some of the variations within it.7 It is useful to consider the amount of energy supplied to be the product of three factors: population size, level of economic activity per person (generally expressed as Gross National Product per person), and energy intensity of economic activity (expressed as energy divided by GNP). Thus, in 1997, a world population of 5.8 billion persons, with average per capita GNP equivalent to 6300 U.S. dollars per person (adjusted for purchasing power parity—ppp)8 and average energy intensity of economic activity equal to 12 megajoules per ppp-adjusted dollar, had an annual primary energy requirement of 5.8x10⁹ persons x $6300/person x 12x106 joules/dollar = 440x1018 joules or 440 exajoules (EJ).9 Table 1.1 shows corresponding figures for the United States, Japan, China, India, Brazil, and South Africa compared to those for the world as a whole, as well as the contributions of the various primary energy forms to the totals. Also shown there are per capita energy use figures and per capita and total figures for electricity generation, which worldwide accounts for nearly 30 percent of primary energy use.10 Three striking characteristics of the partial world-energy picture provided by Table 1.1 hint at some of the main challenges that the decades ahead are likely to present.
• Perhaps most obvious at first glance is the tremendous variation among countries in terms of energy and electricity per capita, mirroring similar discrepancies in per capita GNP. These
7 For more detail the reader should consult, e.g., the recent energy study of the International Institute for Applied 6\VWHPV� $QDO\VLV� DQG� WKH�:RUOG� (QHUJ\� &RXQFLO� �1DNLüHQRYLü� et al. 1998) and the energy “country profiles” available on the U.S. Energy Information Administration’s Web site (EIA 1999).
8 The population and economic product figures in 1997 U.S. dollars are from World Bank (1998), which also explains the purchasing power parity concept and its superiority to market exchange rates in making international comparisons. World economic product in 1997, which according to World Bank calculations was $37 trillion with adjustments for purchasing power parity, was about $30 trillion at market exchange rates.
9 “Primary” energy refers to the energy forms found in nature—mainly fossil and nuclear fuels, sunlight and the other “renewable” energy forms derived from it (most importantly the energy in falling water, wind, and plant materials or “biomass”), and geothermal heat—before conversion of these to “secondary” forms such as electricity and gasoline. One exajoule = 1018 joules = 109 gigajoules = 0.95 x 10¹⁵ Btus = 0.95 quads. The indicated primary energy use of 440 exajoules (417 quads) in 1997 includes not only the so-called “commercial” energy forms (principally the fossil fuels, hydropower, and nuclear energy), on which most countries keep quite accurate statistics, but also a much less accurate estimate for the use of the so-called “traditional” or biomass fuels (consisting of fuelwood, charcoal, crop wastes, and dung). Most of the use of the traditional energy forms occurs in the rural sectors of less developed countries, and because the quantities can only be roughly estimated this category is often omitted altogether from official tabulations. By convention, the part of biomass energy used as food for people and feed for domestic animals is not usually included in tabulations of civilization’s primary energy use at all; if it were included, it would add 10-30 percent (depending on how it was counted) to the 1997 total. The data presented here and in Table 1.1 for the commercial energy forms are derived from British Petroleum (1998). The estimates for traditional fuels are extrapolated from figures in Johannson et al. (1993).
10 About 62 percent of the electricity was generated from fossil fuels, 19 percent from hydropower, 18 percent from nuclear energy, and 1 percent from wind, biomass, solar energy, and geothermal energy. See EIA (1998a).
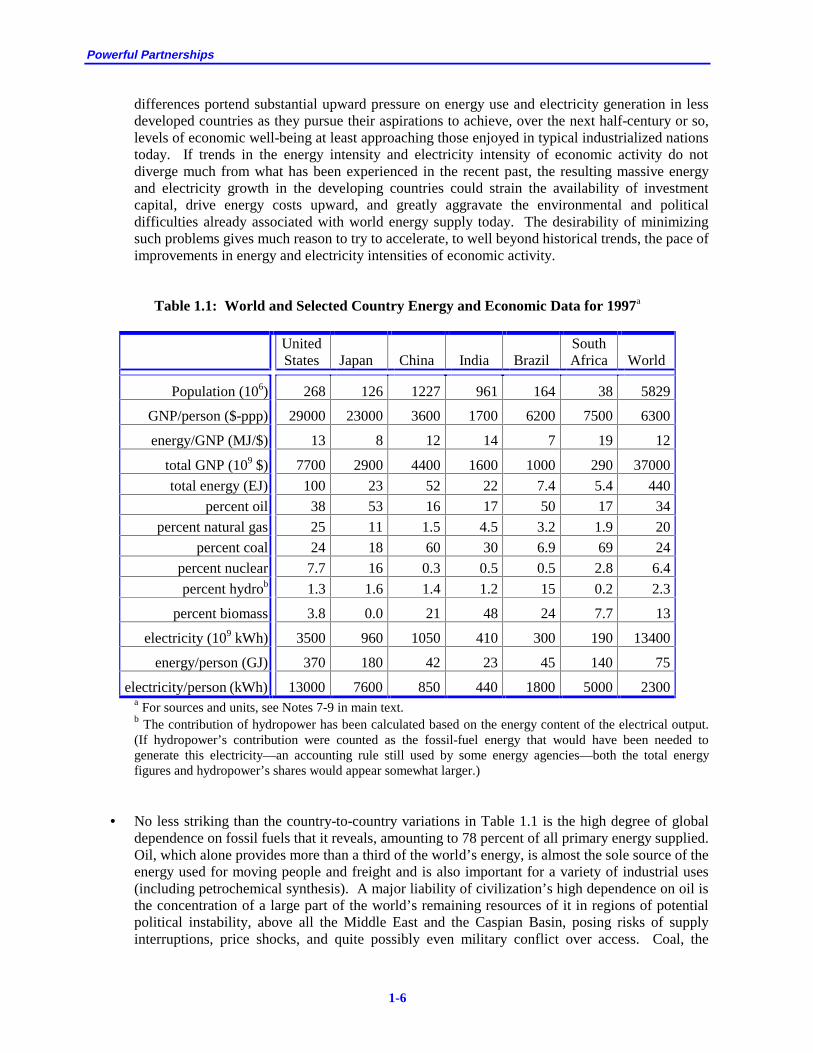
Powerful Partnerships
1-6
differences portend substantial upward pressure on energy use and electricity generation in less developed countries as they pursue their aspirations to achieve, over the next half-century or so, levels of economic well-being at least approaching those enjoyed in typical industrialized nations today. If trends in the energy intensity and electricity intensity of economic activity do not diverge much from what has been experienced in the recent past, the resulting massive energy and electricity growth in the developing countries could strain the availability of investment capital, drive energy costs upward, and greatly aggravate the environmental and political difficulties already associated with world energy supply today. The desirability of minimizing such problems gives much reason to try to accelerate, to well beyond historical trends, the pace of improvements in energy and electricity intensities of economic activity.
Table 1.1: World and Selected Country Energy and Economic Data for 1997a
United States Japan China India Brazil
South Africa World
Population (106) 268 126 1227 961 164 38 5829
GNP/person ($-ppp) 29000 23000 3600 1700 6200 7500 6300
energy/GNP (MJ/$) 13 8 12 14 7 19 12
total GNP (109 $) 7700 2900 4400 1600 1000 290 37000
total energy (EJ) 100 23 52 22 7.4 5.4 440
percent oil 38 53 16 17 50 17 34
percent natural gas 25 11 1.5 4.5 3.2 1.9 20
percent coal 24 18 60 30 6.9 69 24
percent nuclear 7.7 16 0.3 0.5 0.5 2.8 6.4
percent hydrob 1.3 1.6 1.4 1.2 15 0.2 2.3
percent biomass 3.8 0.0 21 48 24 7.7 13
electricity (109 kWh) 3500 960 1050 410 300 190 13400
energy/person (GJ) 370 180 42 23 45 140 75
electricity/person (kWh) 13000 7600 850 440 1800 5000 2300 a For sources and units, see Notes 7-9 in main text. b The contribution of hydropower has been calculated based on the energy content of the electrical output. (If hydropower’s contribution were counted as the fossil-fuel energy that would have been needed to generate this electricity—an accounting rule still used by some energy agencies—both the total energy figures and hydropower’s shares would appear somewhat larger.)
• No less striking than the country-to-country variations in Table 1.1 is the high degree of global
dependence on fossil fuels that it reveals, amounting to 78 percent of all primary energy supplied. Oil, which alone provides more than a third of the world’s energy, is almost the sole source of the energy used for moving people and freight and is also important for a variety of industrial uses (including petrochemical synthesis). A major liability of civilization’s high dependence on oil is the concentration of a large part of the world’s remaining resources of it in regions of potential political instability, above all the Middle East and the Caspian Basin, posing risks of supply interruptions, price shocks, and quite possibly even military conflict over access. Coal, the

CHAPTER 1: U.S. Interests and Government Roles
1-7
second largest source of energy overall with nearly a quarter of total supply, is the largest source of electricity worldwide and the expected basis of much of the massive growth in energy use foreseen in the world’s two most populous countries, China and India. But coal is the hardest to handle of the conventional fossil fuels, and it is the most polluting when burned unless very advanced technologies are used. Natural gas, by far the cleanest burning of the fossil fuels, the easiest to use at high efficiency, and the fastest growing, unfortunately still contributes a smaller share to world energy supply than either oil or coal. And all of the fossil fuels (although least of all natural gas) emit significant quantities of the greenhouse gas carbon dioxide when burned, which ultimately may require very advanced technologies for carbon capture and sequestration if continued heavy use of these fuels is not to excessively alter climate.
• A third striking characteristic of the world energy system as sketched in Table 1.1 is the very
substantial role that the traditional biomass fuels—trees, shrubs, grasses, crop wastes, dung—continue to play in the less developed countries. These fuels are processed and burned very inefficiently; they generate high concentrations of toxic air pollutants (especially in the poorly ventilated dwellings where cooking, water heating, and space heating with these fuels are often done); and their collection consumes a large fraction of the time of the women and children who have this task, as well as contributing in some circumstances to deforestation, desertification, and diminished soil quality. The combination of these existing problems in the rural developing regions and the large population growth expected there means that the use of traditional biomass fuels in these ways cannot grow apace with population. There are only two choices: upgrade the technologies for using these fuels to increase efficiency and reduce impacts, or replace the fuels with different energy sources. Both of these paths pose great difficulties in design, financing, and implementation.
All of these challenges will be treated further below, but their character will be clearer if we first look beyond the snapshot of the energy system, as just presented, to consider the evolution of that system up to the present and some scenarios of how it may evolve in the future.
Figure 1.1 chronicles the evolution of world energy supply over the century and a half from 1850 to the present. This is a picture of tremendous overall growth—a 20-fold increase in total world energy use since 1850, 10-fold since 1900—with most of the increase between 1850 and 1930 provided by coal, most of that between 1930 and 1980 provided by oil, and most of that since 1980 provided by natural gas and nuclear energy. This increase was an indispensable ingredient of the process of technological transformation and economic growth that propelled the now industrialized countries to unprecedented levels of prosperity. But it was also the dominant factor in the emergence of human civilization as a truly global biogeochemical force, capable of modifying the composition of atmosphere, water, soil, and vegetation at continental to planetary scale in ways no longer negligible compared to the effects of natural processes.11 Given the substantial degree of intervention in large-scale environmental processes that the late-20th-century energy system is generating, and given the limits to the ability of current environmental science to predict the consequences of current and future levels of disruption in detail, planning to fuel development in the South and continued prosperity in the North in the next century with energy technologies much like today’s poses tremendous risks. Yet the 150-year world energy history depicted in Figure 1.1 also illustrates how difficult it will be to change rapidly the mix of energy sources on which civilization depends. Specifically, it is apparent
11 See. e.g., Turner et al. (1990), Holdren (1990).

Powerful Partnerships
1-8
from this chart that, during periods of rapid growth of the system as a whole, the time required for a new source of energy to grow from a few percent to a few tens of percent of world energy supply is typically in the range of 50 to 75 years. Slower growth reduces the absolute scale of contribution needed to attain a specified share of the total, but it may also reduce the incentives and opportunities to innovate.
Figure 1.1: World Primary Energy Supply by Source, 1850 to 1997. 6RXUFH��XSGDWHG�IURP�:(&���������1DNLüHQRYLü�et al. (1998).
From 1980 to 1997, world energy supply grew at about half the average rate for the past half century—1.7 versus 3.4 percent per year—while real economic growth averaged 2.8 percent per year. This reflected a decline of 1.1 percent per year in the energy intensity of economic activity.12 In this same period, the carbon intensity of energy supply (carbon emissions per unit of energy) was declining at an average rate of 0.7 percent per year, reflecting the growing importance of natural gas and nuclear energy in the global energy-supply mix. If these rates persisted, world economic product would double in 25 years, energy use in about 40 years, carbon emissions in about 70 years.
12 The average rates of change quoted in this paragraph are for the period 1980-1997. The energy figures are based
on commercial energy forms only—that is, the traditional energy forms are excluded—and the economic growth rates are based on market exchange rates. These figures vary widely across regions. In the low- and middle-income countries of Asia and the Pacific, GNP growth has averaged 7.8 percent per year since 1980 and energy intensity of economic activity has declined in this period at 2.2 percent per year. But in the rest of the developing world, GNP growth rates have been much lower (averaging 2.4 percent per year in Latin America and 1.5 percent per year in Africa and the Middle East); and energy intensities in the rest of the developing world have been declining considerably more slowly than in the Asia-Pacific region. See British Petroleum (1998) and World Bank (1998).
CHAPTER 1: U.S. Interests and Government Roles
1-9
Future world energy demand will depend on future rates of change of population, per capita economic product, and energy intensity of economic activity; and future carbon emissions will depend, in addition, on future rates of change in the carbon intensity of the energy-supply mix. “Business as usual” (BAU) assumptions about how these variables will change over the next century—meaning no major departures from the trends that are already evident—typically produce energy scenarios in which world energy use doubles from its 1990 value by 2025, triples by 2050, and quadruples or quintuples by 2100.13 By far the largest proportion of this growth is expected to take place in the countries currently classified as developing, which in typical BAU scenarios pass the industrialized nations in total energy use around 2025 and by 2100 account for two thirds or more of the world’s energy use (compared to about one third today). Another characteristic of BAU scenarios is that the share of world energy use supplied by fossil fuels declines only slowly over the next 50 years—still amounting to about 70 percent in 2050—which implies very large increases in emissions of carbon dioxide: typically 2 to 2.5 times as large as the 1995 figure by 2050 and 3.5 to 4 times as large by 2100.
Trend is not destiny, however: energy futures differing from BAU are entirely possible. Faster growth of population or GNP per person, or a slower decline in energy intensity, could produce considerably higher energy totals; and slower growth of population or GNP per person, or a faster decline in energy intensity, could produce considerably lower ones. If it proves possible to expand the use of renewable and/or nuclear energy very rapidly in the next century, the fossil-fuel share of world energy supply could fall more sharply than indicated for BAU, and carbon dioxide emissions then would grow more slowly and ultimately could even decline. Carbon emissions could also be reduced to lower than BAU levels by widespread use of carbon capture and sequestration technologies in conjunction with fossil-fuel consumption.
Box 1.1 sketches a range of possibilities for the evolution of the world’s energy system in the next century as described in a recent study of the global energy future conducted by the International Institute for Applied Systems Analysis (IIASA) and the World Energy Council (WEC). Of course, none of these scenarios describes the way the energy future will actually evolve, which no one can accurately predict. But by investigating the features of a range of possible outcomes, the IIASA-WEC study and other recent studies in this vein have helped illuminate the consequences of different societal choices about energy, and they have underlined certain commonalities as well as contrasts among the different energy futures that could materialize. Among the conclusions reached by the IIASA-WEC study along these lines were the following:
• World energy needs will increase. The expected growth of the world’s population over the next century, nearly all of it in the developing countries, combined with the level of energy services needed to meet even modest aspirations about the pace at which these developing-country populations approach levels of affluence already enjoyed in the OECD countries today, mean that world energy demand is likely to grow despite progress in reducing the energy intensity of economic activity in the future. An economic growth rate averaging much less than 2 percent per year over the next century would not allow the developing countries to approach even by 2100
13 Typical “business as usual” assumptions entail world population of 8-9 billion in 2025, 10-11 billion in 2050, and
10-12 billion in 2100. The world rate of real economic growth under BAU is typically assumed to be in the range of 3 percent per year out to 2025, declining gradually thereafter to 2 percent per year or less in the year 2100. Energy intensity of economic activity is assumed to fall continuously at about 1 percent per year. Sophisticated scenario-building exercises disaggregate rates of growth of population and per-capita economic product—and rates of decline of energy intensity—across groupings of countries according to geography and level of development; but the aggregate results can always be described in terms of world-average rates and totals, as here. See Box 1-1 and Alcamo et al. (1995), NaNLüHQRYLü�et al. (1998), and Edmonds et al. (1999) for further discussion and comparison of a range of BAU and alternative scenarios.
Powerful Partnerships
1-10
the levels of income per capita enjoyed in the OECD countries in 1990. Energy use will grow unless energy intensities decline faster than economic activity grows. The IIASA-WEC conclusion that world energy needs will increase rests on the view that (a) the world economy will grow at an average of more than 2 percent per year for the next century and (b) no politically sustainable combination of energy prices and policies could cause energy intensities worldwide to decline at greater than 2 percent per year for this entire period.
• Energy intensities will improve significantly. Although energy intensities are not likely to decline rapidly enough to completely offset the upward pressure of economic growth on energy, the rate of decline even under BAU would be sufficient to offset a considerable part of the energy growth that otherwise would occur; and faster rates of decline could bring very substantial benefits in the form of still slower energy growth. The lowest average rate of decline in energy intensity for the period 1990-2050 in any of the IIASA-WEC scenarios was 0.75 percent per year (in Scenario B), somewhat below the historical rate in recent decades, which leads to energy use in 2050 about 64 percent of what it would be if energy intensity stayed constant. The highest rate of decline for this period in the IIASA-WEC study was 1.3 percent per year (Scenario C1), which leads to energy use in 2050 only 46 percent of what it would be if energy intensity did not change.
• Resource availability will not be a major global constraint. Even under the highest-growth scenarios, according to the IIASA-WEC study, the world as a whole would not be in danger of “running out” of energy resources any time in the next century. Conventional oil and gas are likely to be in decline by the middle of the century or earlier—and there is the possibility of conflict over access to the least expensive remaining deposits of these—but resources of unconventional oil and gas and of coal are much larger and could ultimately fill the gap if environmental constraints did not intervene. Nuclear energy resources are also very large compared to plausible demands in the next century, as is the potential for tapping renewable energy flows.
• The most important environmental constraints on short-to-mid-term energy choices in most of the
world are local and regional air-pollution and acid-deposition problems. Although the world is not running out of energy, it is running out of environmental capacity to absorb without unacceptable consequences the effluents of today’s fossil-fuel and traditional biomass-energy technologies. This is manifest locally in health-damaging concentrations of particulate matter (see Box 1.2) and other air pollutants in both indoor and outdoor air, higher by factors of 10 to 20 in developing countries than in industrialized ones where combustion efficiencies are higher and pollution controls more widespread. It is manifest regionally in acid deposition resulting from emissions of oxides of sulfur and nitrogen. In a version of the IIASA-WEC high-coal scenario (A2) without sulfur abatement, sulfur deposition over much of East and South Asia in 2020 reaches twice the worst levels ever observed in the most polluted areas of Central and Eastern Europe, resulting in severe losses in crop production.14 These problems are expected by the IIASA-WEC authors to command more attention from developing country decision makers than are the more uncertain and longer-term threats associated with global climate change; but most measures to abate the local and regional pollution impacts of energy supply would also reduce greenhouse-gas emissions.
14 1DNLüHQRYLü�et al. (1998), pp. 127-128. The IIASA-WEC authors assume that this outcome will not be tolerated
and that only coal technologies with advanced pollution control will be deployed in the region after 2005. Sulfur control costs could then amount to 0.4 percent of regional GDP by 2020, and even so the regional emissions would continue to increase (albeit more slowly than in the uncontrolled case).

CHAPTER 1: U.S. Interests and Government Roles
1-11
Box 1.1: The IIASA-WEC Energy Scenarios for the 21st Century
A great many scenarios depicting the trajectories along which the global energy future might unfold in the next century have been published in the past several years in studies conducted for the United Nations,a the Intergovernmental Panel on Climate Change,b the World Energy Council,c the World Resources Institute,d and others.e We take our examples here from one of the most recent such studies, which was conducted for IIASA and WKH�:(&�E\�1DNLüHQRYLü�et al. (1998). Its scenarios run from 1990 to 2100, disaggregate the world’s countries into 11 geographic/economic groupings, and divide primary energy sources into 9 categories (coal, oil, natural gas, nuclear, hydropower, commercial biomass, noncommercial biomass, solar energy, and an “other” category containing wind, geothermal energy, and energy from wastes). The study develops six illustrative scenarios in detail. The three “A” scenarios all entail high economic growth and rapid technological change, but differ in respect to which energy sources support the bulk of the growth through the first two thirds of the 21st century: oil and gas in A1; coal in A2; and gas, renewables, and nuclear in A3. A single “B” scenario has somewhat lower rates of economic growth and technological change, and derives its energy from a middle-of-the-road mix of supply options—about 65 percent fossil in 2050. Two “C” scenarios assume establishment of a global regime to drastically reduce greenhouse gas emissions below BAU levels, with corresponding high emphasis on efficiency improvements, renewable energy options, and capture and sequestration of some of the carbon dioxide from the fossil fuels that are used. Case C1 does all this while phasing out nuclear energy after 2050; case C2 does it with the help of a new generation of nuclear reactors enabling a steadily growing nuclear contribution through the 21st century. The population growth rates are the same in all scenarios, but rates of change of Gross Domestic Product (GDP) per person, energy intensity of economic activity (energy/GDP), and carbon intensity of energy supply differ. These rates are shown in Table 1.2 for the highest- and lowest-carbon scenarios among the six explored in the IIASA-WEC study.a Table 1.3 shows the resulting values of population, GDP/person, energy intensity, and carbon intensity corresponding to a division of the world into three country groupings—the OECD countries, the “reforming” economies of the former Soviet Union and Eastern Europe (REFs), and the developing countries (DCs). Total energy use in 2100 is 1940 EJ in Scenario A2 and 900 EJ in Scenario C1, 5 times and 2.3 times the actual 1990 figure, respectively. Total carbon emissions in 2100 are 19.8 gigatonnes of carbon (GtC) in Scenario A2 and 1.4 GtC in Scenario C1. The first figure is 3.4 times larger than the 1990 value, the second one 4.2 times smaller.
Table 1.2: Average Annual Global Rates of Change for Two Scenarios, percent/yeara
Scenario A2 (high Scenario C1 (low growth, high coal) carbon, low nuclear) ---------------------------- ------------------------------ 1990- 2020- 2050- 1990- 2020- 2050- 2020 2050 2100 2020 2050 2100 ---- ---- ---- ---- ---- ----
Population 1.4 0.8 0.3 1.4 0.8 0.3 GDP-ppp/person 1.3 1.6 1.6 0.9 1.2 1.5 Energy/GDP -0.9 -0.8 -0.7 -1.5 -1.2 -1.0 Carbon/energy -0.1 -0.3 -0.6 -0.6 -1.3 -3.4
a The energy and carbon intensities in the WEC-IIASA scenarios span ranges of values considerably wider than those displayed in the “official” IPCC scenarios and nearly as wide as displayed in the full range of scenarios that the IPCC reviewed (Alcamo et al.� ������ 1DNLüHQRYLü� et al. 1998). GDP figures are corrected for purchasing-power parity. Carbon intensities are “net”, meaning they don’t count carbon stored in durable products or sequestered.
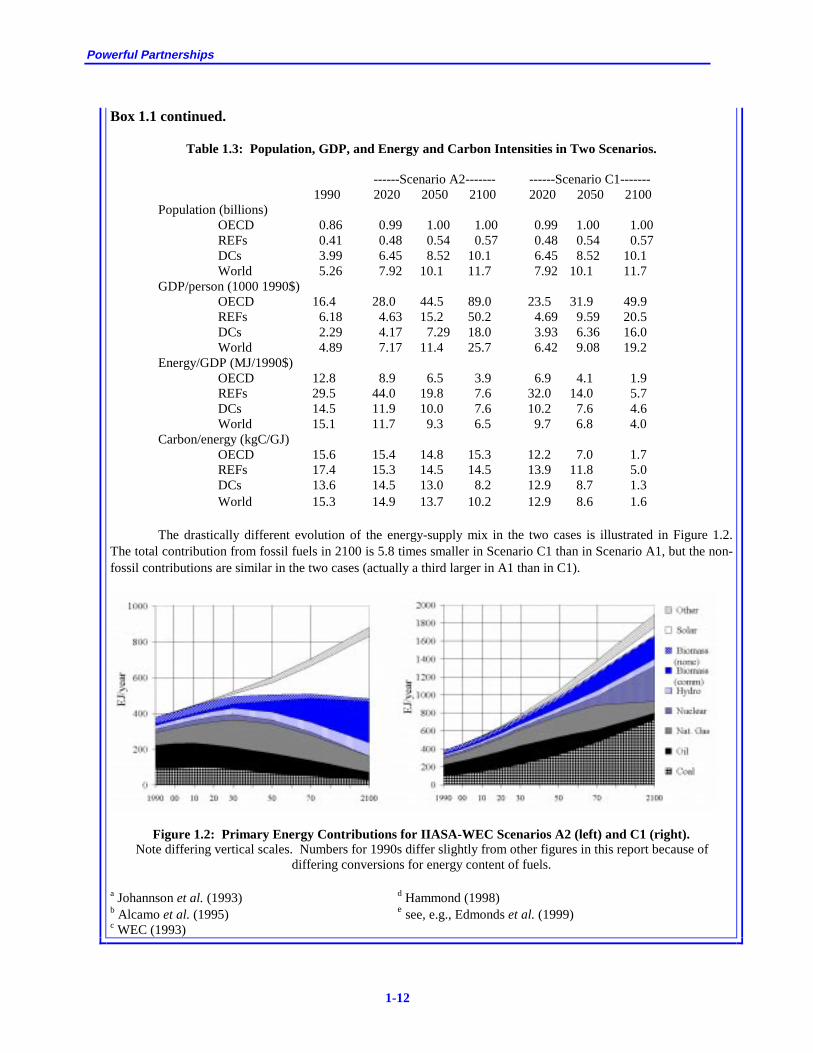
Powerful Partnerships
1-12
Box 1.1 continued.
Table 1.3: Population, GDP, and Energy and Carbon Intensities in Two Scenarios.
------Scenario A2------- ------Scenario C1------- 1990 2020 2050 2100 2020 2050 2100
Population (billions) OECD 0.86 0.99 1.00 1.00 0.99 1.00 1.00 REFs 0.41 0.48 0.54 0.57 0.48 0.54 0.57 DCs 3.99 6.45 8.52 10.1 6.45 8.52 10.1 World 5.26 7.92 10.1 11.7 7.92 10.1 11.7
GDP/person (1000 1990$) OECD 16.4 28.0 44.5 89.0 23.5 31.9 49.9 REFs 6.18 4.63 15.2 50.2 4.69 9.59 20.5 DCs 2.29 4.17 7.29 18.0 3.93 6.36 16.0 World 4.89 7.17 11.4 25.7 6.42 9.08 19.2
Energy/GDP (MJ/1990$) OECD 12.8 8.9 6.5 3.9 6.9 4.1 1.9 REFs 29.5 44.0 19.8 7.6 32.0 14.0 5.7 DCs 14.5 11.9 10.0 7.6 10.2 7.6 4.6 World 15.1 11.7 9.3 6.5 9.7 6.8 4.0
Carbon/energy (kgC/GJ) OECD 15.6 15.4 14.8 15.3 12.2 7.0 1.7 REFs 17.4 15.3 14.5 14.5 13.9 11.8 5.0 DCs 13.6 14.5 13.0 8.2 12.9 8.7 1.3 World 15.3 14.9 13.7 10.2 12.9 8.6 1.6
The drastically different evolution of the energy-supply mix in the two cases is illustrated in Figure 1.2.
The total contribution from fossil fuels in 2100 is 5.8 times smaller in Scenario C1 than in Scenario A1, but the non-fossil contributions are similar in the two cases (actually a third larger in A1 than in C1).
Figure 1.2: Primary Energy Contributions for IIASA-WEC Scenarios A2 (left) and C1 (right). Note differing vertical scales. Numbers for 1990s differ slightly from other figures in this report because of
differing conversions for energy content of fuels. a Johannson et al. (1993) d Hammond (1998) b Alcamo et al. (1995) e see, e.g., Edmonds et al. (1999) c WEC (1993)

CHAPTER 1: U.S. Interests and Government Roles
1-13
• Capital requirements will present major challenges for all energy strategies. Capital investment in energy technologies is driven upwards by high energy growth rates per se (because more facilities must be built than under lower growth rates); by depletion of the most concentrated and convenient fossil fuels (because more dispersed, dilute, and difficult fuels—such as unconventional oil and gas, as well as coal—are costly to extract and process); by increasing reliance on highly processed energy forms such as electricity and hydrogen; and by increasing use of capital-intensive renewable and nuclear energy options. All energy scenarios for the next century contain some mixture of these capital-cost-inflating characteristics. Even with considerable allowance for countervailing downward influences on capital costs of energy technologies from technological innovation, the IIASA-WEC study estimated worldwide capital investments in energy supply to be in the range of $12 to $19 trillion 1997$ for the period 1990 to 2020 and $17 to $34 trillion 1997$ for the period 2021 to 2050, with about half of the total investments required in the developing countries. These figures omit investments in increasing energy-end-use efficiency, inclusion of which the IIASA-WEC study estimated could lead to as much as a doubling of the indicated investment requirements. By that study’s estimates, the total energy-supply and energy-end-use-efficiency investment requirements in developing countries are likely to amount to 3.5 to 4.5 percent of GDP in the period 1990-2020 and 3 to 4 percent of GDP in the period 2021-2050, or between a seventh and a fifth of anticipated gross domestic investment in those countries in the same period. Mobilizing these sums in competition with investment requirements for telecommunications and transportation infrastructure, water and sanitation systems, sustainable agriculture, modern manufacturing technologies, health, and education may pose considerable challenges.
• Technological change will be crucial for future energy systems. A substantial degree of
technological innovation in the energy sector has been part of “business as usual” for a century and a half, and BAU scenarios posit that it will continue to deliver reductions in energy intensity and in the capital intensity of energy technologies throughout the next century as well. Scenarios entailing faster than BAU economic growth and development, faster replacement of inexpensive oil and gas with more challenging energy sources, or faster reductions in emissions of greenhouse gases and other pollutants would require higher than BAU rates of energy-technology innovation. Even BAU rates of innovation could fail to materialize, however, if recent sharp declines in public and private investment in energy R&D in the United States and other industrialized countries—where most such R&D is done—were to persist and spread.15 The consequences of lower innovation rates could be serious. For example, if the average rate of reduction in energy intensity worldwide over the next half century turned out to be the 0.4 percent per year experienced by the United States in the 1990s rather than the 0.75 percent per year postulated in the IIASA-WEC “B” scenario, world energy requirements in 2050 would go up by 20 percent. And without the cost-reducing effects of energy innovation, capital investment requirements in the electricity sector for the period 1990-2020 under the IIASA-WEC scenarios would be 8-15 percent higher in the OECD countries and 25-40 percent higher in the developing countries—an extra $1.7-2.2 trillion altogether.16
• Rates of change in global energy systems will remain slow. Capital turnover times in many energy end-use applications are only a decade or two, allowing relatively rapid change and timely rectification of mistakes and missed opportunities. But the lifetimes of energy-supply
15 Recent global patterns of spending on research, development, demonstration, and deployment of advanced energy
technologies are described in detail in Chapter 2. 16 See 1DNLüHQRYLü� et al. (1998), p 104. Electricity-sector investments represent about two-thirds of the energy
system totals. Impacts of lack of innovation on the non-electric investments were not estimated.
Powerful Partnerships
1-14
technologies are typically four decades and more, and those of energy-supply and energy-demand infrastructures (such as transmission grids and the layouts of cities and transport networks) even longer. Thus the fundamental character of the energy system changes only slowly, and deployment of technologies that turn out to be poorly suited to future conditions and requirements tends to lock in their excessive costs and impacts for decades. The time scales for progressing from fundamental research to deployment of improved technologies are such, moreover, that the energy options available for deployment today are the legacy of the energy research, development, and demonstration (RD&D) that has been done (and not done) over the past 30 years, and the adequacy of the array of energy options that will be available to be deployed in the year 2020 and beyond will be shaped by the RD&D programs that are (or are not) put in place today and in the years immediately ahead.
The foregoing portrayal of the characteristics of the energy future under a variety of possible scenarios, based on the IIASA-WEC study, is broadly consistent with other recent studies and with this panel’s views about the situation. We would emphasize more than the IIASA-WEC authors did, however, the role of the global climate-change issue as a major driver and shaper of energy-technology innovation—and of international cooperation on such innovation—over the next few decades. We agree with IIASA-WEC that local and regional pollution problems are seen by most decision makers in the developing countries as more immediately dangerous and less uncertain than the hazards of global climate change (and rightly so). But we believe that just the substantial possibility that the climate-change problem will develop in the manner depicted for “business as usual” in the Intergovernmental Panel on Climate Change Second Assessment (described here in Box 1.3) justifies a larger effort in energy-technology innovation—and in international cooperation in this domain—than would be required to address the other environmental, economic, and international security challenges looming in the world’s energy future.
Box 1.2: Small Particle Pollution and Chronic Health Problems Recent studies indicate that serious chronic health problems—both mortality (life-shortening) and
morbidity (illness)—are strongly correlated with small particles (diameters less than 2.5 microns) in the air that can penetrate into the deep lungs and remain there.a Much small-particle air pollution is caused by the burning of fossil fuels—both direct emissions of small particles and the formation of small sulfate and nitrate particles in the atmosphere from gaseous emissions of both SO2 and NOx. (Extremely high small-particle concentrations also occur in indoor air in dwellings in developing countries where either biomass fuels or coal are burned in unvented stoves for cooking and water heating.b) Although there is still considerable uncertainty relating to the health impacts of small particles, current evidence suggests they may be large—as much as a few percent of total mortality—even in industrialized countries where pollutant emissions are already controlled to relatively high levels.c The small particle problem is particularly vexing because adverse impacts on human health appear to be a linear function of the exposure, i.e., there is no threshold below which the pollution is considered safe.c
a Pope et al. (1995) b see Smith (1993) c Ostro (1993), Pope et al. (1995)
In the 1997 PCAST study, our predecessor panel noted that the uncertainties surrounding the IPCC’s “best estimate” portrayal of the climate consequences of a BAU energy future cut in both directions: the reality might turn out to be better than the IPCC’s depiction, but it might also turn out to be worse. Given this, and given that the “best estimate” entails consequences that much of the world’s population would deem unacceptable, prudence calls for an energy-technology innovation program that will put into place the capacity to reduce GHG emissions in the decades ahead to well below BAU levels,
CHAPTER 1: U.S. Interests and Government Roles
1-15
at affordable costs, if—as seems likely—such reductions prove to be necessary. Pondering this potential requirement, the 1997 PCAST study concluded that
because of the large role of fossil-fuel technologies in the current U.S. and world energy systems, the technical difficulty and cost of modifying them to reduce carbon dioxide emissions, their long turnover times, their economic attractiveness compared to most of the currently available alternatives, and the long times typically required to develop new alternatives to the point of commercialization, this possible greenhouse-gas-reduction mandate is the most demanding of all of the looming energy challenges in what it requires of national and international energy R&D efforts.
We emphatically concur, while adding two points. First, the weight of the additional observations
and analyses that have been published in the climate-science literature since the IPCC’s 1995 Second Assessment (and even since PCAST’s 1997 report) supports the propositions that GHG-related changes in climate are increasingly apparent in global weather patterns and that these changes, as they grow in step with increasing GHG concentrations in the atmosphere, are likely to influence human well-being in ways far more negative than positive (see Box 1.4.). Second, it has become increasingly apparent in the global energy-policy, climate-policy, and sustainable-development literatures,17 in international meetings,18 and very specifically in briefings before our panel by prominent energy experts from other countries,19 that the importance of the climate-energy challenge for the well-being of the whole planet is now understood by a wide cross-section of analysts and policymakers in industrialized and developing countries alike. This is not to say, of course, that there is agreement on the measures to be taken and how these should be paid for. There isn’t, as was plain at the 3rd Conference of the Parties (COP) to the UNFCCC in Kyoto in December 1997 and the 4th COP in Buenos Aires in November 1998. But, equally plainly, recognition that all countries have a significant stake in preventing unmanageable degrees of climate change is rapidly becoming global. U.S. Benefits from ERD3 Cooperation The reasons the United States should be engaged in international cooperation on ERD3 include the generic benefits of international cooperation on RD3 (that is, benefits that would apply to cooperation on innovation in many different kinds of technologies and products), augmented by benefits that arise from specific characteristics of energy technologies, energy challenges, and the links between these and U.S. national interests and values. The generic benefits of cooperation include:
• gaining access to diverse R&D capacities (such as particular kinds of facilities and expertise) that are increasingly widely dispersed among countries rather than concentrated in the United States;20
17 See, e.g., Goldemberg (1998). 18 See Journé and Reppy (1998) and Reddy et al. (1997). 19 For example, Daniel Bouille, Fundacion Bariloche, Argentina; Burkhard Holder, ISES and Fraunhofer Institute,
Germany; Joachim Luther, EUREC and Fraunhofer Institute, Germany; Jin-gyu Oh, Korean Energy Economics Institute, Korea; Dong-Seok Roh, Korean Energy Economics Institute, Korea; Roberto Schaeffer, Federal University of Rio de Janeiro, Brazil; Yingyi Shi, Beijing Energy Efficiency Center, Beijing; P.R. Shukla, Indian Institute of Management, India.
20 Alic et al. (1992), Porter and Stern (1999).

Powerful Partnerships
1-16
• sharing the costs of research, development, and demonstration of kinds of innovations from which the gains would not be mainly appropriable by the country of origin (or which require RD&D investments larger than any one country is willing to undertake);21
• reducing costs of emerging technologies more rapidly through the accelerated learning that results from conducting demonstrations and precommercial deployments in more and bigger markets than the ones available domestically;
• enhancing U.S. firms’ understanding of and access to large commercial markets for their products in other countries;22 and
• accelerating the development and international deployment of technologies whose use elsewhere would improve regional or global economic, environmental, or political conditions to the benefit of the United States.23
In the subsections that follow, we address how these generic rationales for international cooperation in technological innovation relate more specifically to energy technologies, energy challenges, and U.S. interests and values related to these. U.S. Economic Interests in International Cooperation on ERD3
As discussed in the 1997 PCAST report, U.S. economic interests in the energy situation in this country and the world relate to the desirability, from an economic standpoint, of: controlling costs of energy to U.S. consumers and industries; avoiding inflation and recession, in this country and world- wide, from oil-price shocks; limiting the impact of energy imports on the U.S. balance of trade; maintaining and expanding the market share of U.S. companies in the multi-hundred billion dollar global energy-technology market; and enhancing the long-term markets for other U.S. exports by building the energy basis for sustainable economic prosperity in developing countries. These U.S. economic interests in energy are served by international cooperation in ERD3 in a variety of ways.
First, to the extent that international cooperation in ERD3 can accelerate the pace, broaden the scope, or lower the cost of energy-technology innovation in this country (through whatever combination of access to R&D capacities and insights abroad, direct cost-sharing in joint R&D projects, and faster learning through demonstration and deployment in more and bigger markets), this will tend to lower the costs of energy to U.S. consumers and firms below what they would otherwise be. While real costs of energy in the United States are near their long-term historical levels (and low compared to those of the 1970s and 1980s), they still account for a not insignificant share of the cost of living (and a bigger share for the poor than for the rich); they still affect the international competitiveness of U.S. firms in energy-intensive sectors of the economy; and they could be driven up in the future, as noted in the earlier PCAST report, “by increasing competition for world oil output, by manipulation of the world oil market, by political instability in the Persian Gulf, by environmentally motivated requirements to reduce emissions from fossil-fuel combustion, and by other eventualities of both foreseeable and unforeseeable types”.
21 Arrow (1962). 22 Granstrand et al. (1993). 23 We include, in the category of benefit to the United States, the sense of U.S. citizens that this country is
appropriately discharging the obligation of the world’s richest nation to assist those less fortunate. See the discussion below on “International Cooperation on ERD3 and U.S. Values”.
CHAPTER 1: U.S. Interests and Government Roles
1-17
Box 1.3: The Assessments of the Intergovernmental Panel on Climate Changea
The emission of heat-trapping carbon dioxide gas from fossil-fuel combustion is the largest contributor to
the possibility that amplification of the atmosphere’s “greenhouse effect” by human activities will significantly change the global climate. The evidence is compelling that the global composition of the atmosphere with respect to carbon dioxide and some of the other greenhouse gases (GHG) has already been significantly influenced by human activities, but there has been uncertainty and controversy about whether the imprint of GHG-induced climate change is already discernible in the complex patterns of global temperature, precipitation, cloudiness, oceanic circulation, and so on, all of which are subject to substantial natural variability. Considerable uncertainty and controversy have also surrounded estimates of the pace at which climatic change will become more pronounced as greenhouse-gas concentrations continue to grow and about the magnitude and geographic distribution of the physical, ecological, and human consequences. In the face of growing concerns and controversies about the potential magnitude of this problem and what to do about it, the World Meteorological Organization and the United Nations Environment Programme jointly established, in 1988, the Intergovernmental Panel on Climate Change (IPCC), with a mandate to “(a) assess available scientific information on climate change, (b) assess the environmental and socioeconomic impacts of climate change, and (c) formulate response strategies”. The First Assessment Report of the IPCC b served as the principal technical input to the negotiation of the United Nations Framework Convention on Climate Change, which was completed in 1992 and came into force in 1994 after ratification by 164 nations (including the United States). All parties to this treaty—industrialized and developing countries alike—agreed in it to formulate and implement national programs for mitigating climate change and to “cooperate in the development, application, and diffusion, including transfer, of technologies, practices, and processes” to control GHG emissions. The IPCC followed up its 1990 “First Assessment” with supplemental assessments in 1992 and 1994 and a major “Second Assessment” completed in 1995 and published in 1996.c Among the principal findings of the 1995 assessment were that: • “the balance of evidence suggests a discernible human influence on global climate”; • the increase in mean global surface air temperature between 1990 and 2100 under a mid-range emissions
scenario would probably lie between 2.2 and 6.5 degrees Fahrenheit, with higher increases in the middle of continents and at high latitudes; the atmospheric carbon dioxide concentration in 2100 under this scenario would be the highest it has been in 50 million years;
• the warmer temperatures will lead to an increase in sea level (“best estimate” for the mid-range scenario about
one-and-a-half feet by 2100, continuing to increase thereafter), an “increase in the occurrence of extremely hot days and a decrease in the occurrence of extremely cold days”, and “a more vigorous hydrological cycle” (which is projected to result in more high-rainfall events and more floods);
• “climate change is likely to have wide-ranging and mostly adverse impacts on human health”; • “boreal forests are likely to undergo irregular and large-scale losses of living trees because of the impacts of
projected climate change”; • agricultural productivity “is projected to increase in some areas and decrease in others, especially the tropics
and subtropics”; and • other negative impacts are possible “on energy, industry, and transportation infrastructure; human settlements;
the property-insurance industry; tourism; and cultural systems and values”.

Powerful Partnerships
1-18
Box 1.3 continued
The 1995 Assessment also emphasized that many uncertainties remain and called particular attention to the possibility of “surprises” arising from the non-linear nature of the climate system. And it presented further analyses indicating, as previous IPCC assessments and the work of others have also done, that rapid reductions in the rate of increase of greenhouse-gas concentrations in the atmosphere will be very difficult to achieve even if political agreement can be reached that this is desirable, not least because of the long residence times of these gases (decades to centuries) in the atmosphere. The ultimate objective of the Framework Convention on Climate Change is “stabilization of GHG concentrations in the atmosphere at a level that would prevent dangerous anthropogenic interference with the climate system”. While there is as yet no formal agreement on the level that meets this condition, few serious analysts of climate change think that CO2 concentrations more than twice the preindustrial value—that is, more than 550 parts per million by volume (ppmv)—would not pose significant dangers. In order to stabilize at 550 ppmv, the IPCC and others have shown, cumulative emissions between 1990 and 2100 would need to be less than two thirds those expected under BAU, and annual emissions would need to begin to decline after peaking at no more than 11 GtC per year around 2030. The lowest-carbon scenarios in the IIASA-WEC study (e.g., Scenario C1) would stabilize atmospheric CO2 at about 450 ppmv. These kinds of outcomes—stabilization at 550 ppmv or less—can only be achieved with a combination of sustained reductions in energy intensities and rapid expansion of the contribution of low-carbon-emitting energy options (renewable, nuclear, and carbon-sequestering fossil-fuel technologies) to global energy supply. a Much of this box is condensed from the treatment in the earlier PCAST study on “Federal Energy Research and Development for the Challenges of the Twenty First Century” (PCAST 1997). b IPCC (1990) c IPCC (1992, 1994, 1996)
Second, the leverage of international cooperation in ERD3 on U.S. oil-import bills and U.S. vulnerability to oil-price shocks is not limited to cooperation’s cost-lowering effects on domestic alternatives to imported oil; it includes as well the downward pressure on world oil prices that comes from the effects of ERD3 cooperation in speeding up the development and deployment of affordable alternatives to imported oil in other countries. A yardstick for judging the potential economic importance of the first of these two leverage points is the cost of U.S. oil imports, which was about $60 billion per year in the mid-1990s and was projected by the U.S. Department of Energy to reach about twice that figure (in 1995 dollars) by 2015.24 A corresponding yardstick for the second is the size of world oil trade, which in 1997 was some 280 billion dollars and which in the IIASA-WEC scenarios most closely resembling “business as usual” reaches 400-500 billion 1997$ per year in 2020.25 Third, the understanding of and access to foreign markets that the United States gains by international cooperation in RD3 is of particular importance in the case of energy technologies because an unusually large (and rapidly growing) share of the market for these technologies is outside of the United States. (Table 1.4 shows the growing preponderance of the non-OECD countries in world energy-supply
24 This figure is for the “reference” case in the Energy Information Administration’s “Energy Outlook” document
for 1997 (EIA 1997). 25 See BriWLVK� 3HWUROHXP� ������� DQG� 1DNLüHQRYLü� et al. (1998). More directly relevant—although also more
controversial—are model-derived estimates of the differences between expenditures on oil imports under high-innovation versus BAU scenarios. In the IIASA-WEC study, for example, oil import costs for the United States and Canada in 2020 under the high-innovation Scenario C1 were 60 billion 1997$ lower than in the low-innovation Scenario B.
CHAPTER 1: U.S. Interests and Government Roles
1-19
investments between 1990 and 2050, as modeled in the IIASA-WEC scenarios.) The concentration of the main energy-technology-market action outside of the United States today is particularly pronounced in the case of nuclear-energy technology (100 percent of the market for new reactors outside the United States in the near term), wind-energy technology (90+ percent of the new wind turbine market outside the United States in recent years), photovoltaic cells (80+ percent outside this country in recent years), and coal-fired power plants (most of the market is elsewhere now and probably will continue to be for at least the next two or three decades).26
Box 1.4: Climate Science Since the Second IPCC Assessment Since the Second IPCC Assessment, the scientific evidence concerning human influences on the global
climate system has continued to accumulate. In particular, recent data and analyses show more persuasively than before that the surface temperature of the Earth is increasing; that this increase can be attributed, in large part, to human-caused increases of greenhouse gases in the atmosphere; and that the continuation of these trends is likely to be associated with climatic changes of forms and degrees capable of adversely affecting large numbers of people. In what follows we elaborate briefly on some of these findings. Of the 120 to 140 years for which thermometer records are sufficiently complete to define a global average temperature, the 11 warmest years have all occurred since 1983. The three warmest years on record were 1998, 1997, and 1995, in that order.a According to “proxy” temperature records embodied in glaciers and ice sheets, lake sediments, corals, tree rings, and the like, the last 10 years appear to have been the warmest decade (and 1998 appears to have been the warmest year) in the Northern Hemisphere in 1,000 years. Worldwide, the twentieth century has been the warmest in at least the last 500 years.b Greenhouse gases from human activities have emerged as the dominant driver of these global-average temperature increases in the 20th century. While solar variability, volcanic eruptions, and El-Nino cycles also contribute to these global temperature patterns, the 20th century record cannot be explained solely by invoking these phenomena.c The regional patterns of temperature changes across the surface of the Earth and the vertical patterns of temperature changes as one ascends through the atmosphere provide further evidence that what is being observed is human-induced global warming. These patterns are consistent with what is expected under anthropogenic climate change and are inconsistent with hypotheses suggesting that solar variability and/or the urban-heat island effect can be used to explain the instrumental temperature record.d Field data, complemented by modeling studies, suggest that continuing increases in average temperature will be accompanied by altered global precipitation patterns, increased incidence of floods, droughts, and destructive storms, and large increases in the “heat index” (combining temperature and humidity) in geographic regions that already range from unpleasant to practically unlivable in summer. More catastrophic changes cannot be ruled out, such as the collapse of the West Antarctic Ice Sheet (which could raise sea level by 5 meters in the space of 500 years) or weakening of the ocean-circulation patterns that carry heat in winter to the Southeastern United States and to Western Europe.e a The U.S. National Climate Date Center considers records to be adequate back to about 1880, while the UK
Meteorological Office goes back to about 1860. See http://www.ncdc.noaa.gov/ol/climate/research and http://www.meto.gov.uk.
b See, e.g., Mann et al. (1999) and Pollack et al. (1998). c Mann et al. (1998). d See Wigley et al. (1998), Wentz and Schabel (1998), and Peterson et al. (1999). e See Karl and Knight (1998), Knutson et al. (1998), Oppenheimer (1998), and Broecker (1997).
26 See, e.g., Siegel and Rackstraw (1999) and Siegel (1999).

Powerful Partnerships
1-20
Table 1.4: Cumulative Investments In Energy-Supply In IIASA/WEC Scenarios
trillion 1997$ in 1990-2020 2021-2050
OECD 4.8 – 9.2 4.1 - 13 REFs 2.0 – 3.3 2.0 - 5.8 DCs 4.5 – 7.1 11 - 19
Worlda 11 - 19 17 - 37 6RXUFH��1DNLüHQRYLü�et al. (1998). Some totals do not add because of rounding, and because the maximum and minimum numbers may be associated with different scenarios for each of the regions. Finally, the generic argument that U.S. technological cooperation with other countries serves U.S. economic interests by fostering growth in economies that in consequence become larger markets for U.S. goods of all kinds—most often made in connection with cooperation with developing countries—applies with particular force to the case of cooperation on energy technology, because energy is such an indispensable (and often even limiting) ingredient in economic development. The point is illustrated by a comparison of the “muddling through” and “high innovation/low carbon” scenarios in the IIASA-WEC study (Scenarios B and C1, respectively): ppp-corrected GDP in the developing countries in the latter scenario is larger than in the former by 3.7 trillion 1997$ in 2020, 9.7 trillion 1997$ in 2050, and 35 trillion 1997$ in 2100. U.S. Environmental Interests in International Cooperation on ERD3 The United States gains environmentally from international cooperation on ERD3, first of all, to the extent that such cooperation increases (through access to important capabilities, cost sharing, etc.) the pace and scope with which high-environmental-impact energy technologies used in the United States can be replaced with lower-environmental-impact technologies at competitive cost.27 Progress in this direction directly improves the environmental quality experienced by U.S. citizens by reducing the local and regional air and water pollution problems to which energy-supply technologies are often the dominant contributors, and it reduces the contribution of the United States to the growth of global environmental problems—above all GHG-induced climate change—and thereby reduces the longer-term risks and damages that the United States (and other countries) ultimately will experience from this set of problems. A subsidiary benefit of any accelerated improvement, through international cooperation on ERD3, of the environmental characteristics of U.S.-deployed energy technologies is the value of the U.S. example of progress in this direction for helping to persuade other countries of the reasonableness of moving along this path, too. (Their progress in this direction benefits the United States by reducing their contributions to the growth of global environmental problems that impose costs and risks on this country.) The largest potential leverage of international cooperation in ERD3 on global environmental problems that threaten the United States, however, is through the effects of that cooperation in hastening the deployment of lower-environmental impact energy-supply as well as energy-efficiency technologies in the developing countries and reforming economies. This leverage is high both because so much of the world’s potential growth in energy use in the next century is in these countries, and because the existing and BAU levels of environmental performance of energy technologies in these countries are so low. Figure 1.3 shows the dominance of the contributions of developing countries and reforming economies to the future world energy growth in the IIASA-WEC Scenario A2. Table 1.5 shows the difference in
27 What cost is competitive can be influenced, of course, by taxing the most worrisome forms of emissions (carbon,
sulfur, fine particulates) or achieving a similar result by regulation.

CHAPTER 1: U.S. Interests and Government Roles
1-21
carbon emissions between Scenario A2 and the low-emissions Scenario C1. The task here, of course, is actually to achieve the degree of international cooperation on low-environmental-impact ERD3 that would be needed to realize some significant part of the emissions-reduction potential illustrated by Table 1.5.
Table 1.5: Net Carbon Emissions Under IIASA-WEC Scenarios A2 And C1.
Scenario A2 Scenario C1 Carbon emissions (GtC) in 1990 2020 2050 2100 2020 2050 2100
OECD 2.8 3.8 4.3 5.4 2.0 0.91 0.16 REFs 1.3 1.5 2.3 3.1 1.0 0.85 0.33 DCs 1.8 4.6 8.1 11 3.4 3.6 0.95
World 5.9 9.9 15 20 6.3 5.3 1.4 6RXUFH��1DNLüHQRYLü�et al. (1998). Some totals do not add because of rounding. A vigorous and effective program of international cooperation on ERD3 along the North-South axis, in particular, would be likely to have the further benefit of enhancing the sense of common interest and joint purpose that will be so important in strengthening the wider collaborative framework for addressing the global energy/climate-change challenge. The UNFCCC, which after all, as a ratified international treaty, is the law of the land in the United States and the more than 160 other nations party to it, calls explicitly for such cooperation. The prospect of securing this cooperation, with the expected benefits in accelerated access to technologies seen as important contributors to sustainable-development goals, was clearly one of the primary inducements to developing countries to join the UNFCCC when it was negotiated at the beginning of the 1990s (when the evidence about the pace and scope of GHG-induced climate change itself was considerably less comprehensive and compelling than it is today). Now it seems likely that evidence of actual commitment on the part of the North to strengthen North-South cooperation on ERD3 will be a prerequisite for agreement by most countries in the South on specific commitments to reduce their future GHG emissions below BAU-type trajectories. This is clearly a matter of the greatest importance, not only because of the growing role of emissions from the South in the problem but also because the United States and other key countries in the North may continue to tie their own willingness to make and keep reductions commitments to the willingness of the South to join a reductions regime. In this crucial sense of joint willingness to move forward at all, then, as well as in the practicalities of how to do it, improving international cooperation in ERD3 is likely to be indispensable. (The “good news”, as much of the rest of this report will show, is that there are many promising ways to do this.) We note finally, under the heading of U.S. environmental interests in ERD3 cooperation, that climate change is not the only environmental impact of energy technologies that, by respecting no geographic boundaries, creates incentives for the United States to cooperate in improving the technologies used in other countries. Transboundary air pollution is another such problem, including especially the long-distance transport of particulate hazes and the precursors of acid deposition.28 Still another is leaks and spills of oil into the oceans—a global “commons”—from drilling rigs, tankers, and coastal refineries and storage tanks. And a last one, underscored for all the world by the Chernobyl accident in 1986, is the transboundary movement of radioactivity following accidents at nuclear-energy facilities. This problem gives impetus to international cooperation to improve the safety of such facilities not only because of 28 The United States is better protected by geography from these problems than most countries are and so, for
example, does not have such strong incentives to participate in controlling Chinese sources of these kinds of emissions as, say, Japan does (Phar and Wan, 1998). But U.S. incentives to participate in controlling emissions sources in Mexico and the Caribbean are considerable.

Powerful Partnerships
1-22
direct concerns with the economic and health impacts of the radioactivity that may cross boundaries after an accident, but also because of the ramifications, for the use of nuclear energy around the world, of even one more accident near the size of Chernobyl. If political pressure to shut down nuclear-energy operations elsewhere became irresistible after such an accident, there could be substantial local, regional, and ultimately even global environmental consequences from the rapid substitution of fossil-fuel-fired electricity generation that, under circumstances similar to today’s, would be the most likely result.
Figure 1.3: Distribution of Energy Growth in IIASA-WEC Scenario A2 U.S. Security Interests in International Cooperation on ERD3 The connections between energy and national and international security were discussed at some length in the previous PCAST report. The relevant interests of the United States to which international cooperation in ERD3 are germane include reducing the potential for conflict over access to oil and gas resources; minimizing links between the use of nuclear-energy technologies and the acquisition of nuclear-weapons capabilities by nations of proliferation concern or by subnational groups; and avoiding energy problems in other countries with economic, environmental, or political consequences severe enough to aggravate or generate possibilities for armed conflict. With respect to reducing the potential for conflict over access to oil and gas, we have already treated above, under “economic interests”, the ways in which international cooperation in ERD3 can contribute to reducing the dependence both of the United States and of other countries on imported oil. These connections of ERD3 cooperation to oil-import reductions in the United States and abroad are as beneficial to this country’s security interests as to its economic ones. On this point the earlier PCAST panel wrote:
To say that growing tensions and potential problems for the national-security interests of the United States and its allies are likely to arise from intensifying competition for world

CHAPTER 1: U.S. Interests and Government Roles
1-23
oil and gas supplies is not to recommend that the United States and other nations pursue energy independence, which is neither feasible nor, in today’s multiply interdependent world, even desirable. But it is desirable to try to limit the tension-producing potential of overdependence on imports (especially on imports from regions of precarious political stability), as well as the tension-producing potential of resources of disputed ownership, by working to diversify sources of supply of oil and gas (including domestic supplies in the major importing regions), to develop further the non-oil-and-gas sources of portable fuels and electricity, and to increase the efficiency of energy end-use.
With respect to minimizing the potential links between nuclear-energy use and nuclear-weapons capabilities, there are three technological leverage points: (a) discouraging the use of the less proliferation-resistant existing variants of nuclear-energy technology in favor of the more proliferation-resistant existing variants; (b) improving technical capabilities for monitoring and protecting nuclear-energy facilities of existing types against diversion of their nuclear materials; and (c) exploring, through R&D, the potential of alternative proliferation-resistant nuclear-energy technologies for possible future use.29 It is in the nature of all these approaches that international cooperation is absolutely essential to their success. Most nuclear-energy facilities are outside of the United States, as are all of the prospective increases in nuclear-energy capacity in the immediate future and much of the vulnerability of weapon-usable materials in nuclear-energy facilities to theft by subnational groups. Thus, while what the United States does about these matters domestically is of some importance, what is done elsewhere (above all in Asia, in terms of the potential for expansion of nuclear energy in the next few decades) will be paramount in determining the evolution of nuclear energy’s proliferation risks. In this situation, U.S. participation in international cooperation on RD3 in nuclear energy—comparative assessment of available nuclear-energy technologies, RD3 to improve safeguards on the ones that are deployed, R&D in pursuit of more proliferation-resistant options for possible use in the future—is essential if this country expects to have much influence on this issue. The most wide-ranging and far-reaching connection between international cooperation on ERD3 and U.S. security interests, however, is not about oil or nuclear energy per se but about the role of adequate, affordable, and low-environmental-impact energy supplies in helping to build the basis of an enduring prosperity for all of the world’s people. That economic problems can produce political instability and conflict is so well known as to need no elaboration here. The historic and prospective links between environmental problems and conflict have been less intensively studied and publicized, but recent studies have shown in considerable detail how important these links can be.30 Global climate change, in particular, if not deflected by improved technologies and effective policies from its likely path under “business as usual”, poses a variety of risks—in terms of water availability, agricultural output, fisheries yields, forest productivity, disease patterns, sea-level rise, flows of environmental refugees arising from all of these, and disputes about blame and responsibility—whose potential to generate international tensions and increase the likelihood of conflict is hard to doubt.
29 Along with technological approaches for minimizing proliferation risks there are, of course, extremely important
political ones, including maintenance of the Non-Proliferation Treaty and Comprehensive Test-Ban Treaty regimes, progress in nuclear-arms reductions by the existing nuclear-weapon states, the provision of adequate authority and budget to the International Energy Agency’s nuclear-energy safeguards operations, the minimization of proliferation incentives through alliances and security assurances, and so on. These kinds of approaches, as important as they are, do not obviate the need for complementary technical measures to minimize the contribution of nuclear-energy systems to proliferation possibilities. See, e.g., Holdren (1989).
30 See Lipschutz and Conca (1993), Homer-Dixon et al. (1993), Kennedy et al. (1998), and especially Homer-Dixon (1999).

Powerful Partnerships
1-24
Because energy is both an indispensable ingredient of economic prosperity and the dominant ingredient of many of the principal environmental threats to human well-being, including above all the threat of climate change, getting energy right is going to be crucial to the prospects of meeting economic aspirations worldwide without intolerable consequences for the environmental dimensions of well-being—crucial, in other words, to creating the economic and environmental foundation for a stable world order, and thus crucial to U.S. security interests. The largest leverage available to the United States on this problem—on getting energy right around the world—is international cooperation on ERD3. International Cooperation on ERD3 and U.S. Values
Nearly 3 billion people in the world lack adequate sanitation. Some 1.5 billion people do not have access to a clean and reliable source of water. Hundreds of millions lack access to a hospital or medical facility with even the most rudimentary capacity to sterilize equipment, refrigerate medicines, or heat wards. And hundreds of millions of women and children labor long and hard to collect “traditional” biomass fuels, and then often suffer debilitating respiratory and other illnesses from the use of these energy forms in poorly ventilated indoor environments. The technologies to produce inexpensive, clean, and reliable sources of energy—along with the political will and economic means to secure and distribute those technologies—could significantly alleviate this human suffering. Many citizens of the United States believe that the people of the world have a fundamental right to a decent existence (including adequate food, clothing, and housing); they also believe that the United States as a nation has an obligation to exercise its leadership and leverage its wealth to help secure that existence. Thus, on one level, the United States should participate in international ERD3 activities not only because they promote U.S. interests, but because it is the right thing to do—because this nation should and will be judged on what it offers those significantly less fortunate.
But the potential to fulfill U.S. values does not stop with securing the basic components of a
decent existence for the people of the world. At the next level, access to a clean and reliable source of energy can mean the difference between time devoted to securing an education and time devoted to acquiring fuel, the difference between a local economy in which there are choices for productive engagement and one in which subsistence activities are the norm. Efficient and clean technologies can reduce the environmental impacts associated with supplying energy and, at the same time, deliver the prosperity required to release people from their immediate needs and make resources available to pursue higher and broader aspirations for self-fulfillment, building civil society, and environmental management and preservation. Thus, U.S. participation in international ERD3 activities can give people the means to fulfill other basic values—the right to education, opportunity, self-determination, environmental stewardship, and security.
RATIONALES AND ROLES FOR GOVERNMENT INVOLVEMENT That international cooperation in energy-technology innovation serves U.S. interests and values
would not in itself justify government engagement in or support of such cooperation if there were reason to believe that private-sector activity was doing and would continue to do everything along these lines that U.S. interests and values require. Certainly, as the portrayal of patterns and trends in international cooperation in ERD3 in Chapter 2 will make clear, the role of the private sector is very large—with private international investment flows far larger than public ones, in the energy sector as in others—and growing. The case for government involvement depends on the ways in which the large and growing portfolio of private-sector activities in international cooperation on ERD3 may, notwithstanding its size and diversity, nonetheless fall short of fully addressing the U.S. interests and values at stake, and on the ways in which government participation and policies can contribute to reducing these shortfalls. It is to these specific rationales and roles for government involvement that we now turn.
CHAPTER 1: U.S. Interests and Government Roles
1-25
Rationales The standard catalog of reasons that private-sector activities may fail to adequately serve
society’s interests (market “failures” or “barriers”), includes: externalities (such as environmental pollution), public goods (such as national security), neglect of the special needs of the poor (who are under-represented in economic markets); excessive concentrations of market power (monopoly, oligopoly, cartel); lack of adequate information (which may afflict either producers or consumers); and enlargement of the gap between society’s interests in energy innovation and private willingness to invest in it by problems of market structure, magnitude of risk, size of investment, long time horizon for returns, or nonappropriability of research results by the firms doing the research. These contributors to the difference between public and private incentives to invest in innovation constitute rationales for government action wherever forms of intervention are available that can generate public benefits from the alleviation of the market failure or barrier that are worth more than the costs of the intervention.
The bigger the costs of a market failure (or, equivalently, the bigger the benefits of remedying it),
the stronger the case for government involvement. Thus it is important that in the case of energy markets and, more particularly, international cooperation in energy innovation, many of the listed kinds of market failure tend to be substantial. We have already argued, for example, that the environmental externalities of energy supply are large (and, with unabated growth of the climate-change problem, likely to become much larger)31 and that the national-security public good that is at stake in energy choices of various kinds is also very large. In addition:
• the special needs of the poor are of particular importance in relation to energy choices because
energy is so indispensable to meeting the basic human needs whose provision is in doubt for the poorest of the poor, because the cost of energy is a much higher part of the cost of living for the poor than for the affluent, because the poor are more at risk from the recession and unemployment that large and sudden energy price increases can bring, and because the poor tend to be more imperiled by energy’s environmental impacts (from indoor air pollution to global climate change);
• the issue of excessive concentration of market power was very important, in the relatively recent past, in the case of the Organization of Petroleum Exporting Countries (OPEC) oil cartel, and without action to prevent this it is likely to become important again;
• the market failure of inadequacies in information tends to be important in the energy field in general because of the diversity and technical complexity of the options and, in relation to international dimensions of energy in particular, because the developing countries tend to lack the large analytical establishments, highly educated consumers, and public-information programs that are required;
The problems related to attenuation of private-sector incentives to perform energy RD3 also tend to be large in the energy sector, in some cases for reasons of the long time horizon associated with development and substantial deployment of new energy technologies, in others because of the large size of the investments involved, in still others because of the small profit margins in energy commodity markets, and in many more because of particular characteristics of market structure and/or non-appropriability of
31 Quantifying and monetizing market failures is generally difficult, and doing so for the environmental externalities
of energy supply is no exception. In the rough attempts that have been made, however, it is not unusual to find estimates of the external environmental costs of energy supply approaching or exceeding the market prices of that energy. 6HH��H�J���+ROGUHQ��������DQG�1DNLüHQRYLü�et al. (1998).

Powerful Partnerships
1-26
research results (varying in ways that require case-by-case discussion, which is provided in Chapters 4 and 5). Beyond the market failures and barriers just discussed, other rationales for government involvement include complementarity of public and private capabilities (which, in the issues of interest here, can be in relation to research, development, demonstration, deployment, or the interaction of these) and needs for policy change to lower barriers to beneficial private or public activity that have been created by other government policies with other aims. With respect to complementarity, for example, there are exceptional capabilities in the Department of Energy’s national laboratories relating to research in the basic energy sciences—materials science, chemical engineering, earth sciences, and so on—that underpin the potential for advances in a wide variety of energy-technology applications, including many that would be of particular importance in developing countries. For reasons discussed in Chapter 2 and also in the earlier PCAST energy R&D study, these kinds of large-laboratory, basic-energy-sciences capabilities, which are an important part of what the United States has to offer to international cooperative efforts on energy innovation, are becoming increasingly scarce in the private sector over time.32 The interactions between international ERD3 policies and other energy and non-energy policies are taken up in a separate subsection, below. Roles The roles for sensible government engagement with international cooperation on ERD3 can be categorized in terms of the intersections of the rationales just described with the diverse kinds of cooperative activities that fall under the heading of ERD3. The latter include joint participation in and/or funding or other encouragement of
(1) efforts to improve the technical, economic, and environmental characteristics of the mix of energy options available in the marketplace, including: (a) the conduct of fundamental energy-related research and applied energy-technology research and development, and the construction or improvement of facilities and the acquisition of equipment for these activities; (b) demonstration and niche and precommercial deployment of innovative energy technologies; (c) education, training, and information exchange to improve capacities for the foregoing; and (d) managerial and institutional innovation to support all of the above;
(2) efforts to increase the rate of deployment of the available energy options that best address the
interests and values of the parties to the cooperation, including: (a) integrated assessment of the benefits, costs, and risks of alternative energy technologies and energy-system designs; (b) education of government policy makers, energy suppliers, energy consumers, and the public about the available options; (c) formulation of performance standards with respect to desired energy-technology characteristics; (d) creation or improvement of infrastructure to support targeted technologies; (e) provision or arrangement of financing for targeted technologies; (f) support for targeted technologies (which may include tax incentives, loan guarantees, production credits and price guarantees, subsidy/auction combinations, portfolio standards, and green marketing); (g) other measures to correct perverse incentives and lower bureaucratic barriers obstructing deployment of targeted technologies; and (h) managerial and institutional innovation to support all of the above.
32 Specific examples of the relevance of these kinds of capabilities to particular foci of international cooperation in
energy R&D are provided in Chapters 4 and 5, along with examples of other kinds of government/private-sector complementarity relating to ERD3 cooperation.

CHAPTER 1: U.S. Interests and Government Roles
1-27
It is critical, of course, given the much larger scale of private-sector activities compared to government activities in most of the facets of both of these categories, that the government activities be designed with a sharp focus on the specific market failures or barriers to be overcome and/or the specific public-private complementarities to be exploited, and on how government efforts can enable and catalyze much larger private-sector undertakings. INTERACTIONS BETWEEN ERD3 COOPERATION AND OTHER NATIONAL POLICIES The international cooperation on ERD3 undertaken by private-sector and public-sector actors is influenced by a wide array of policies besides those designed to address such cooperation directly. These include policies focused on domestic energy RD&D within the cooperating countries, their energy policies besides those focused on RD&D, and non-energy policies with a wide variety of foci. The kinds of energy policies that may be relevant, other than those focused on RD&D, include subsidies, price controls, and taxes on existing energy technologies; deregulation and privatization of energy industries; and environmental regulation of energy technologies. The kinds of non-energy policies that may be relevant include, particularly, trade policy, intellectual property rights policy, antitrust policy, tax policy, foreign policy, and defense policy. A thorough treatment of how all of these policies may either complement or interfere with policies and measures aimed at promoting international cooperation in ERD3 is far beyond what could be accomplished within the framework of our study, but we offer in what follows a few observations on some of the most important interactions. Domestic Energy and Environmental Policies The domestic environment for energy RD&D is the foundation on which forays into international ERD3 cooperation must be built. It is not possible to cooperate effectively if the deficiencies in the domestic foundation of one or more of the partners are too large. It can and should be part of the international ERD3 cooperation strategy of the United States to help its partners build the domestic capacities from which a more effective interaction can proceed, but a robust U.S. domestic energy RD&D effort is the foundation of it all. Achieving this was, of course, the focus of the 1997 PCAST study on “Federal Energy R&D for the Challenges of the 21st Century”, and we take this opportunity to underline the importance of implementing its recommendations as an important part of the basis for successful cooperation on the international front. Deregulation and restructuring of energy industries have been changing the environment for energy-technology innovation in ways that were spelled out in some detail in the 1997 PCAST study. As noted there, it is critical that means for reflecting environmental costs and public-goods benefits in ERD3 decisions be preserved and strengthened as deregulation and restructuring proceed. It is likewise important, from the standpoint of international ERD3 cooperation, that this be happening as well in the countries with which the United States is trying to cooperate. Without that, much of the potential benefit of innovation in high-efficiency and low-emissions energy technologies will not be realized because market conditions will produce smaller deployments of these technologies than society’s interests warrant. Consider society’s interest in reducing the emissions of carbon from the world’s energy system. It is conceivable that vigorous national and international efforts on innovation in low-carbon-emitting energy technologies will produce an array of technologies that are not only much lower in carbon emissions but also less expensive than the fossil-fuel technologies that dominate U.S. and global energy supplies today. But it seems more likely—if the environmental and social costs of energy use are not reflected in the market price—that many of the low-carbon options will remain costlier than conventional fossil-fuel technologies (where low-cost fossil fuels are available) for some decades to come. In that

Powerful Partnerships
1-28
event, and assuming that the climate-change problem continues to evolve along the lines that the IPCC assessment and subsequent evidence suggest it will, the energy-system performance that society’s interests require will only be forthcoming if this country and others impose either carbon taxes or, equivalently, binding caps on emissions implemented through tradable permits.33 Trade and Intellectual Property Rights Policies The capacity and desire of U.S. companies to engage in joint ventures with entities in other countries and even merely to market their technologies abroad are influenced by a wide variety of policies adopted by this and other countries relating to trade and intellectual property rights. Closely related to policy stances on these issues is the long-standing tension between the competitive and cooperative aspects of international economic relations. With respect to trade policies, key issues are restrictions on the transfer of militarily sensitive technologies, trade barriers that countries erect to restrict the access of foreign manufacturers to domestic markets, and incorporation into international trade regimes of provisions to protect the environment. Protecting technologies of genuine military significance is obviously important, but equally obviously this can be overdone. The boundaries of what needs to be protected are inherently fuzzy, but ought to be reviewed periodically with an eye to the trade-offs between caution in the protection of military advantage, on the one hand, and the economic, environmental, and even security benefits of greater technology transfer and cooperation, on the other. As for trade barriers designed to protect domestic markets, these are generally as inimical to the long-run interests of the country trying to protect itself as to the interests of the world as a whole—a proposition no less applicable to innovative energy technologies than to other domains—and the reasonably steady U.S. policy to oppose such barriers therefore is in step with this country’s interests in increasing ERD3 cooperation. Incorporating protections for the environment into international trade regimes, which has been another reasonably steady aim of U.S. policy on other grounds, also supports this country’s interests in ERD3 cooperation insofar as those involve the transfer of low-environmental-impact energy options. International agreements to protect intellectual property rights are essential to assure companies that innovations they have paid to develop will reap a fair return in the international marketplace. Without the protection of such agreements, firms may be deterred from entering into joint-venture relationships under which their technologies can be manufactured in receiving countries. In this connection, the agreement on Trade-Related Aspects of Intellectual Property Rights concluded at the Uruguay Round of the General Agreement on Tariffs and Trade (GATT) was an important step forward. The efforts of the U.S. Patent and Trademark Office toward a truly global patent regime, as embodied in the proposed Patent Law Treaty, are also moving in the right direction.34 Although differences of view between developing and industrialized countries about these intellectual property rights issues are sometimes cited as major obstacles to North-South ERD3 cooperation, the value of the intellectual property rights in a technology is generally only a small part of the cost of producing and deploying it.35 Thus, enforcement of an intellectual property rights regime need not, in principle, be a major barrier to North-South technology cooperation and transfer. The related larger question with respect to international cooperation on technological innovation is how to strike a balance between cooperation and competition—that is, for example, from the perspective of the United States, between the benefits to this country of cooperation and the costs it 33 Lee (1995). 34 Stoll (1998). 35 See Goldemberg (1999) and Wallerstein et al. (1993).
CHAPTER 1: U.S. Interests and Government Roles
1-29
imposes by strengthening the capabilities of countries that are or will become economic competitors of the United States. Although this is a trade-off that in some respects must be made on a case-by-case basis, we think that too often decision-makers thinking about it do so without reflecting on all of the benefits of cooperation, taking into account the full range of U.S. interests and values that are at stake as we have laid them out here for the case of international cooperation on energy innovation. We also think major trends at work in the world are both increasing the benefits of international cooperation over time and decreasing the relevance of concerns about competition. The benefits of cooperation are being increased by the globalization of energy problems (tying U.S. interests ever more tightly to energy outcomes in other countries, as discussed earlier in this chapter) and by the globalization of innovation capacities (making the flow of innovation benefits from cooperation a two-way street, as discussed in Chapter 2). The relevance of concerns about competition is being reduced by a steady decline in the national character of the innovation process and of economic activity more generally, marked by an increasing prevalence of international mergers, alliances, and joint ventures, by growing investments of U.S. firms in R&D and manufacturing, activities abroad of foreign firms in R&D and manufacturing activities in the United States, and by other forms of economic globalization.36 Anti-Trust and Tax Policies By influencing what kinds of mergers, acquisitions, and joint ventures are undertaken—and ultimately influencing the degree of concentration or fragmentation in whole industries—anti-trust policy affects both the motivation and the capacity for technological innovation.37 In concentrated industries, there may be a tendency to slow the pace of innovation in order to maximize profits from existing products, but also a tendency to invest in longer-term R&D because the gains from this are more appropriable than in more fragmented industries. Anti-trust policy weakens these trends when it discourages concentration, strengthens them when it allows it. Insofar as international cooperation on ERD3 is promoted by mergers, acquisitions, and joint ventures taking place across international boundaries, the encouragement or discouragement of these by anti-trust policies in the countries involved will play a role in how much and what kinds of such activity take place. The tax policies of the United States and other countries likewise influence the incentives for investment in RD&D by multinational firms. A recent review of the influences of U.S. tax policy on these incentives, sponsored by the U.S. National Research Council, concluded that provisions in the corporate tax code relating to deferral of tax on income earned abroad and to the deductability of R&D expenditures in the United States against income earned abroad can “exert first-order influence on the level, location, and composition of research and development spending” by firms that conduct business in several nations.38 The review found, moreover, that while such firms are a minority of U.S. corporations, they account for more than three-quarters of corporate R&D spending in this country. Foreign and Defense Policies Besides the restrictions on transfer of or cooperation on militarily sensitive technologies, discussed above under the heading of trade policy, foreign and defense policies have influenced international ERD3 cooperation in three other principal ways: denial or severe restriction of cooperation with countries deemed to be adversaries of the United States; the withholding or promotion of bilateral
36 See, e.g., Mowery and Rosenberg (1989), Federal Trade Commission (FTC 1996), Hamburg Institute (1996),
Wessner (1997), and NSB (1998). 37 This argument has been elaborated in the context of the U.S. domestic technology-innovation context in a recent
article by Hart (1999). 38 Poterba (1997).

Powerful Partnerships
1-30
cooperation arrangements of various kinds as part of carrot-and-stick diplomacy in support of many different U.S. foreign policy goals; and the specific interactions of U.S. nuclear non-proliferation policy with the extent and character of the international RD3 cooperation this country undertakes in relation to nuclear-energy technology. These particular policy arenas are rife with tensions and contradictions between competing goals: Should the United States constrain clean-energy cooperation with China over concerns about human-rights issues? Are overall U.S. security interests served by withholding nuclear-energy cooperation from India and Pakistan because of those countries’ nuclear weapons programs? There are no easy prescriptions for resolving such questions. We can only urge that the choices that are made about them be made with explicit attention to the full range of U.S. interests at stake, including the ways in which non-cooperation on nuclear energy could increase proliferation dangers and the ways in which non-cooperation on the energy basis for sustainable development, more generally, could ultimately imperil the economic and environmental basis of a stable world. LEVERAGE OF INTERNATIONAL ERD3 COOPERATION As the earlier PCAST study of U.S. energy R&D policy discussed at some length, retrospective analysis of the contributions, to economic and environmental progress, of particular R&D efforts or of investments in innovation as a whole, is fraught with analytic difficulties and uncertainties even if, overall, the overwhelming consensus among economists who have studied this matter is that the returns to investment in innovation are very large.39 Prospective analysis of what future investments in innovation will bring is even more difficult. In the words of the earlier study
[P]redicting the leverage of energy R&D against the challenges described above requires making assumptions not only about what innovations a given R&D program is likely to produce but also about the nature and effectiveness of the enabling policies that are implemented to accelerate the penetration of worthwhile results into the marketplace. Indeed, the impact on the energy system of the innovations that emerge from R&D will also be affected by policies besides those explicitly intended to affect this (including, for example, tax policies, public-utility-regulatory policies, and so on) and by factors that are partly to largely outside the realm of policy to influence at all, such as the rate of discovery of inexpensive natural gas resources and the rates of growth of national economies.
As the discussion in preceding sections suggests (and as that in the chapters to follow will make even clearer), the inherent difficulties of predicting in detail the leverage of investments in innovation are even larger when the complications of international cooperation and technology transfer under all of complexities of the international economic and political environment are added to the equation. The previous PCAST study took a two-pronged approach to trying to clarify the potential leverage of innovation despite the uncertainties. The first was to compare historical rates of improvement, for periods of low and high innovation and for various countries, in cost, efficiency, and other measures of performance of various energy-supply and energy-end-use technologies and in the energy intensity and carbon intensity of aggregate economic activity.40 Reviewing the data of this type cited in the 1997 PCAST study as well as the results of the more wide-ranging review of recent trends in such indicators in the 1998 IIASA/WEC study41 indicates that 39 PCAST (1997, Chapter 1). 40 IEA (1997). 41 1DNLüHQRYLü�et al. (1998).

CHAPTER 1: U.S. Interests and Government Roles
1-31
• measures of performance of new equipment of particular types (e.g., automobiles, refrigerators,
fossil-fueled power plants) often improved at rates from 2 to 5 percent per year during high-innovation periods of one to three decades’ duration over the past half century or so;
• the average performance of all deployed equipment of particular types often improved at rates in
the range of 1 to 3 percent per year for similar periods; • the average energy intensity of all economic activity (energy divided by GNP) has tended to fall
at rates of 0.5 to 1 percent per year at places and times when energy prices and policies were not particularly conducive to innovation and at 1.5 to 3 percent per year at places and times when conditions for innovation were more auspicious (except for China, where this rate of improvement in recent decades appears to have been in the range of 5 percent per year);
• the average carbon intensity of primary energy supply (carbon emissions divided by total energy
supply), which has been falling worldwide at an average rate of about 0.3 percent per year for the past century, has fallen at about twice that rate since 1980 and, in the most impressive instance of reduction in this index, fell in France between 1976 and 1991 at more than 2.5 percent per year.42
The second approach used in the earlier PCAST study to illuminate the potential leverage of innovation was to compare the results of recent scenario-based studies of projected rates of improvement in the energy intensity of economic activity and the carbon intensity of energy supply.43 Those results, together with those in the more recent WEC/IIASA study and in the Battelle scenario paper commissioned by this panel,44 suggest that
• in high-innovation scenarios for the United States, rates of decline in energy intensity could average 1.5 to 2 percent per year and rates of decline in carbon intensity 0.5 to 0.8 percent per year even in the decade 2000-2010, with higher rates of decline achievable later;
• in high-innovation scenarios for the world as a whole, rates of decline in energy intensity could
average 1.2 to 1.5 percent or more per year and rates of decline in carbon intensity 0.4 to 0.6 percent or more per year in the period 2000-2020, with rates of decline in energy intensity exceeding 2.5 percent per year and rates of decline in carbon intensity exceeding 1.5 percent per year achievable in the period 2020-2050.
No scenario-construction exercise, each of which is based on a particular energy-economic model embodying a large numbers of assumptions, can ever be definitive. But the general consistency of results across a rather wide range of such exercises conducted by different groups using different models, coupled with the consistency of all of these with the range of historically observed performance in periods of high and low innovation incentives, gives some confidence that the results summarized here for high-innovation cases are not likely to be greatly in error as estimates of what might be achievable if both the incentives and capacities for a high degree of energy-technology innovation can be put in place 42 The French reduction in carbon intensity in this period was achieved primarily by rapid expansion of nuclear
energy’s contribution to electricity supply. 43 The main studies cited there were, for the United States, the Department of Energy’s “five-lab” study (DOE
1997) covering 1997 to 2010 and the contemporaneous “five-NGO” study (ASE 1997) covering the same period with a second phase extending to 2030 and, for the world, studies covering the period 1990-2100 published by the World Energy Council (WEC 1995) and the Intergovernmental Panel on Climate Change (IPCC 1996).
44 Edmonds et al. (1999).

Powerful Partnerships
1-32
worldwide and maintained over the next several decades. And the implications of achieving this are quite striking, as already indicated above in Box 1.1 and in the subsequent discussions of how U.S. economic, environmental, and security interests could be influenced by the differences between high-innovation and low-innovation energy futures. Consider just the global figures: if energy intensity of economic activity worldwide can be reduced at an average rate of just 1.4 percent per year from 2000 to 2050 (which is well within the range of figures just described), the energy needed to generate a dollar of GNP will fall by half in that period. If the combination of reductions in energy intensity of economic activity and carbon intensity of energy supply were to amount to a 2.8 percent per year decline in the ratio of carbon to economic activity (which would be pushing harder but is still within the range of possibilities described above), the amount of carbon emitted per dollar in 2050 would be only one fourth of what it was in 2000, and total carbon emissions in 2050 would very probably be lower than they are today. More detailed analyses show that world energy-system performance in this range (and continuing after 2050) would be compatible with stabilizing the atmospheric concentration of carbon dioxide at 450 ppmv under middle-range forecasts of world economic growth and at 550 ppmv (twice pre-industrial levels) under the highest economic growth rates that most analysts would consider plausible.45 The high-innovation, high-cooperation futures, then—with their lower energy requirements per dollar of GNP, lower carbon emissions per unit of energy supplied, better U.S. access to foreign energy-technology markets as well as to foreign innovation capabilities, and faster and more sustainable economic growth in developing countries—are likely to be:
• better in terms of oil-import dependence and oil-price-shock vulnerability; • better in terms of energy costs to U.S. firms and consumers; • better in terms of U.S. sales of energy and non-energy technologies and products abroad; • better in terms of the environmental conditions experienced by Americans and others around the
world (and not just because of lower rates of climate change associated with lower carbon emissions, but also because environmental impacts of many other kinds will be reduced as a result of reductions in energy intensity and the energy-supply-technology changes undertaken to reduce carbon intensity); and
• better in terms of the political stability and sense of satisfaction that will result from U.S.
cooperation in building a better quality of life for the least fortunate people on the planet as well as for the most fortunate.
The questions that remain are whether the existing global efforts in energy-technology innovation and in cooperative approaches to diffusing it are likely to be adequate to bring this future within reach and, if not, what most needs to be done to strengthen these efforts in order to make them adequate. It is to those questions that we turn in the chapters that follow.
45 See Hoffert et al. (1998), IPCC (1996).
CHAPTER 1: U.S. Interests and Government Roles
1-33
REFERENCES Alcamo et al. 1995: J. Alcamo, A. Bouwman, J. Edmonds, A. Grübler, T. Morita, and A. Sugandhy, “An Evaluation of the IPCC IS92 Emission Scenarios,” in Climate Change 1994: Radiative Forcing of Climate Change and an Evaluation of the IPCC IS92 Emission Scenarios (London: Cambridge University Press, 1998), pp. 237-304. Alic et al. 1992: J.A. Alic, L.M. Branscomb, H. Brooks, A.B. Carter, and G.L. Epstein, Beyond Spinoff (Cambridge, MA: Harvard Business School Press, 1992). Arrow 1962: K.J. Arrow, “Economic Welfare and the Allocation of Resources for Invention” in The Rate and Direction of Inventive Activity (Princeton University Press, 1962). ASE 1997: Alliance to Save Energy, American Council for an Energy-Efficient Economy, Natural Resources Defense Council, Tellus Institute, and Union of Concerned Scientists, Energy Innovations: A Prosperous Path to a Clean Environment (Washington, DC: Alliance to Save Energy, 1997). British Petroleum 1998: British Petroleum, BP Statistical Review of World Energy (London, 1998). Broecker 1997: W.S. Broecker, “Thermohaline Circulation, the Achilles Heel of Our Climate System: Will Man-Made CO2 Upset the Current Balance?” Science, Vol. 278 (1997), pp. 1582-1588. Bryan 1899: William Jennings Bryan, speech (Washington: 22 February 1899). DOE 1997: U.S. Department of Energy, Interlaboratory Working Group on Energy-Efficient and Low-Carbon Technologies, Scenarios of U.S. Carbon Reductions: Potential Impacts of Energy-Efficient and Low-Carbon Technologies to 2010 and Beyond (Washington, DC: 1997). Edmonds et al. 1999: Jae Edmonds, S.H. Kim, and H. Pitcher. “The Long-Term Shape of Global Energy Systems.” Paper prepared for the PCAST Panel on International Cooperation in Energy RD3 (February 1999). EIA 1997: Energy Information Administration, U.S. Department of Energy, Annual Energy Outlook 1997 (Washington, DC: U.S. Government Printing Office, 1997). EIA 1998a: Energy Information Administration, U.S. Department of Energy, International Energy Annual 1997 (Washington, DC: U.S. Government Printing Office, 1998). EIA 1998b: Energy Information Administration, U.S. Department of Energy, Annual Energy Review 1997 (Washington, DC: U.S. Government Printing Office, 1998). EIA 1999: Energy Information Administration, U.S. Department of Energy, http://www.eia.doe.gov/ FTC 1996: Federal Trade Commission, Anticipating the 21” Century: Competition Policy in the New High-Tech Global Marketplace (Washington, DC: FTC, May 1996). Goldemberg 1998: J. Goldemberg, “Leapfrog Energy Technologies,” Energy Policy, Vol. 26, No. 10 (1998), pp. 729-741.

Powerful Partnerships
1-34
Goldemberg 1999: J. Goldemberg, “A Perspective from the South on ERD3,” Paper prepared for the PCAST Panel on International Cooperation in Energy RD3 (February 1999). Granstrand et al. 1993: O. Granstrand, L. Hakanson, and S. Sjolander, “Internationalization of R&D: A Survey of Some Recent Research,” Research Policy, Vol. 22 (1993), pp. 413-430. Hamburg Institute 1996: Hamburg Institute for Economic Research, Kiel Institute for World Economics, and National Research Council, Conflict and Cooperation in National Competition for High-Technology Industry (Washington, DC: Academy Press, 1996). Hammond 1998: Allen Hammond, Which World?: Scenarios for the 21st Century (Washington, DC: Island Press, 1998). Hart 1999: David M. Hart, “Antitrust and Technological Innovation,” Issues in Science and Technology, Vol. 15, No. 2 (Winter 1998-99), pp. 78-81. Hoffert et al. 1998: M. Hoffert, K. Caldeira, A. Jain, E. Haites, L. Harvey, S. Potter, M. Schlesinger, S. Schneider, R. Watts, T. Wigley, and D. Wuebbles, “Energy Implications of Future Stabilization of Atmospheric CO2 Content,” Nature, Vol. 395 (1998), pp. 881-884+. Holdren 1989: John P. Holdren, “Civilian Nuclear Technologies and Nuclear Weapons Proliferation,” in C. Schaerf, B. Holden-Reid, and D. Carlton, eds., New Technologies and the Arms Race (London: MacMillan, 1989). Holdren 1990: John P. Holdren, “Energy in Transition,” Scientific American (September 1990) pp. 156-163. Holdren 1992. John P. Holdren, “The Transition to Costlier Energy” in L. Schipper and S. Meyers, eds. Energy Efficiency and Human Activity: Past Trends, Future Prospects (Cambridge: Cambridge University Press, 1992). Holdren and Pachauri 1992: J. Holdren and R. Pachauri, “Energy,” Chapter 4 in International Council of Scientific Unions, An Agenda of Science for Environment and Development into the 21st Century (Cambridge, UK: Cambridge University Press, 1992), pp. 103-118. Homer-Dixon 1999: Thomas Homer-Dixon, Environment, Scarcity, and Violence (Princeton, NJ: Princeton University Press, 1999). Homer-Dixon et al. 1993: T. Homer-Dixon, J.H. Boutwell, and G.W. Rathjens, “Environmental Change and Violent Conflict,” Scientific American, Vol. 268, No. 2 (February 1993), pp. 38-45. IEA 1997: International Energy Agency, Indicators of Energy Use and Efficiency: Understanding the Links Between Energy and Human Activity (IEA, May 1997). IPCC 1990: Intergovernmental Panel on Climate Change, Climate Change: The IPCC Scientific Assessment (Cambridge, UK: Cambridge University Press, 1990). IPCC 1992: Intergovernmental Panel on Climate Change, Climate Change 1992: The Supplementary Report to the IPCC Scientific Assessment (Cambridge, UK: Cambridge University Press, 1992). IPCC 1994: Intergovernmental Panel on Climate Change, Climate Change 1994: Radiative Forcing of
CHAPTER 1: U.S. Interests and Government Roles
1-35
Climate Change and an Evaluation of the IPCC IS92 Scenarios (Cambridge, UK: Cambridge University Press, 1994). IPCC 1996: Intergovernmental Panel on Climate Change, Climate Change 1995: The Science of Climate Change (Cambridge, UK: Cambridge University Press, 1996). Johansson et al. 1993: Thomas B. Johansson, Henry Kelly, Amulya Reddy, and Robert H. Williams, eds., Renewable Energy: Sources for Fuels and Electricity (Washington, DC: Island Press, 1993). Journe and Reppy 1998: V. Journe and J. Reppy, “Report of the 3rd Pugwash Workshop on Implementing the Framework Convention on Climate Change,” Pugwash Newsletter, Vol. 35, No. 2 (1998), pp. 42-49. Karl and Knight 1998: T.R. Karl and R.W. Knight, “Secular Trends of Precipitation Amount, Frequency, and Intensity in the USA,” Bulletin of the American Meteorological Society, Vol. 79 (1998), pp. 231-241. Kennedy et al. 1998: Donald Kennedy, David Holloway, Erika Weinthal, Walter Falcon, Paul Ehrlich, Roz Naylor, Michael May, Steven Schneider, Stephen Fetter, and Jor-San Choi, Environmental Quality and Regional Conflict (New York: Carnegie Corporation of New York, December 1998). Knutson et al. 1998: Thomas R. Knutson, Robert E. Tuleya, and Yoshio Kurihara, “Simulated Increase of Hurricane Intensities in a CO2-Warmed Climate,” Science, Vol. 279 (1998), pp. 1018-1020. Lee 1995: Henry Lee, ed., Shaping National Responses to Climate Change (Washington, DC: Island Press, 1995). Lipschutz and Conca 1993: R.D. Lipschutz and K. Conca, The State and Social Power in Global Environmental Politics (New York: Columbia University Press, 1993). Mann et al. 1998: M.E. Mann, R.S. Bradley, and M.K. Hughes, “Global-Scale Temperature Patterns and Climate Forcing Over the Past Six Centuries,” Nature, Vol. 392 (1998), pp. 779-787. Mann et al. 1999: M.E. Mann, R.S. Bradley, and M.K. Hughes, “Northern Hemisphere Temperatures During the Past Millennium: Inferences, Uncertainties, and Limitations,” Geophysical Research Letters, Vol. 26, No. 3 (15 March 1999), pp. 759+ Mowery and Rosenberg 1989: David C. Mowery and Nathan Rosenberg, Technology and the Pursuit of Economic Growth (New York: Cambridge University Press, 1989). 1DNLüHQRYLü� et al�� ������ � 1�� 1DNLüHQRYLü�� $�� *U�EOHU�� DQG� $�� 0DF'RQDOG�� HGV��� Global Energy Perspectives (Cambridge, UK: Cambridge University Press, 1998). NSB 1998: National Science Board, “Science and Engineering Indicators 1998,” Chapter 4 in U.S. and International Research and Development: Funds and Alliances (Washington, DC: National Science Foundation, 1998). Oppenheimer 1998: M. Oppenheimer, “Global Warming and the Stability of the West Antarctic Ice Sheet,” Nature, Vol. 393 (1998), pp. 325-332. Ostro 1993: Bart Ostro, “The Association of Air Pollution and Mortality: Examining the Case for Inference,” Archives of Environmental Health, Vol. 48 (1993), pp. 336-342.

Powerful Partnerships
1-36
PCAST 1997: President’s Committee of Advisors on Science and Technology, Federal Energy Research and Development for the Challenges of the Twenty-First Century (Washington, DC: Office of Science and Technology Policy, November 1997). Peterson et al. 1999: T.C. Peterson, K.P. Gallo, J. Lawrimore, T.W. Owen, A. Huang, and D.A. McKittrick, “Global Rural Temperature Trends,” Geophysical Research Letters, Vol. 26 (1999), pp. 329-332. Pharr and Wan 1998: Susan J. Pharr and Ming Wan, “Yen for the Earth: Japan’s Pro-Active China Environment Policy,” in M.B. McElroy, C.R. Nielson, and P. Lydon, eds., Energizing China: Reconciling Environmental Protection and Economic Growth (Cambridge, MA: Harvard University Press, 1998). Pollack et al. 1998: Henry N. Pollack, Shaopeng Huang, and Po-Yu Shen, “Climate Change Record Subsurface Temperatures: A Global Perspective,” Science, Vol. 282 (1998), pp. 279-281. Pope et al. 1995: C. Pope III, M. Thun, M. Namboodiri, D. Dockery, J. Evans, F. Speizer, and C. Heath Jr., “Particulate Air Pollution as a Predictor of Mortality in a Prospective Study of U.S. Adults,” American Journal of Respiratory and Critical Care Medicine, Vol. 151 (1995), pp. 669-674. Porter and Stern 1999: M.E. Porter and S. Stem, The New Challenge to America’s Prosperity: Findings from the Innovation Index (Washington, DC: Council on Competitiveness, 1999). Poterba 1997: James M. Poterba, ed., Borderline Case: International Tax Policy, Corporate Research and Development, and Investment, National Research Council Board on Science, Technology, and Economic Policy (Washington, DC: National Academy Press 1997). Reddy et al. 1997: A.K.N. Reddy, R.H. Williams, and T.B. Johannson, Energy After Rio: Prospects and Challenges (New York: United Nations Development Programme, 1997). Siegel 1999: Jack S. Siegel, International Collaborations in Fossil Energy Research, Development, Demonstration, and Deployment, Energy Resources International, Inc., paper prepared for the PCAST Panel on International Cooperation in Energy RD3 (February, 1999). Siegel and Rackstraw 1999: Judith M. Siegel and Kevin Rackstraw, “U.S. Renewable Energy Experience in the International Marketplace,” paper prepared for the PCAST Panel on International Cooperation in Energy RD3 (February 1999). Smith 1993: Kirk R. Smith, “Fuel Combustion, Air Pollution Exposure, and Health: The Situation in Developing Countries,” Annual Review of Energy and the Environment, Vol. 18 (1993), pp. 529-566. Stoll 1998: Robert L. Stoll, “Visions of Future Patent Systems and Current Steps Toward Them: The View of the USPTO,” Office of Legislative and International Affairs, United States Patent and Trademark Office, Remarks before the AIPLA (Arlington, VA: October 15, 1998). Turner et al. 1990: B. Turner, W. Clark, R. Kates, J. Richards, J. Mathews, and W. Meyer, eds., The Earth as Transformed by Human Action (Cambridge, UK: Cambridge University Press, 1990). Wallerstein et al. 1993: M.B. Wallerstein, M.E. Mogee, and R.A. Schoen, eds., Global Dimensions of Intellectual Property Rights in Science and Technology (Washington, DC: National Academy Press, 1993).

CHAPTER 1: U.S. Interests and Government Roles
1-37
WEC 1993: World Energy Council, Energy for Tomorrow’s World (New York: St. Martin’s Press, 1993). WEC 1995: World Energy Council and International Institute for Applied Systems Analysis, Global Energy Perspectives to 2050 and Beyond (London: WEC, 1995). Wentz and Schabel 1998: F.J. Wentz and M. Schabel, “Effects of Orbital Decay on Satellite-Derived Lower-Tropospheric Temperature Trends,” Nature, Vol. 394 (1998), pp. 661-664. Wessner 1997: Charles Wessner, ed., International Friction and Cooperation in High-Technology Development and Trade (Washington, DC: National Academy Press, 1997). Wigley et al. 1998: T.M. Wigley, R.L. Smith, and B.D. Santer, “Anthropogenic Influence on the Autocorrelation Structure of Hemispheric-Mean Temperatures,” Science, Vol. 282 (1998), pp. 1676-1679. World Bank 1998: World Bank, World Development Report 1998 (Washington, DC: 1998).

2-1
CHAPTER 2 THE INTERNATIONAL LANDSCAPE OF ERD3
A man’s feet should be planted in his country, but his eyes should survey the world.
George Santayana1
n examining U.S. participation in international energy research, development, demonstration, and deployment (ERD3) cooperation, it is useful to have an understanding not only of the activities of this type now being undertaken by the U.S. government and this country’s private sector, but also of those
being carried out by other countries and organizations. This chapter provides an overview of such activities, drawing a map of the international ERD3 landscape as it currently stands and describing the socioeconomic forces—growing energy demand, globalization of energy industries and of the processes of innovation, and so on—that are shaping its evolution. The remainder of this chapter consists of six main sections. The first discusses the challenges of describing ERD3 activities, noting the advantages and limitations of various approaches, and the second identifies some of the major national and international trends influencing the ERD3 landscape. With this background, the report then describes the major players in international collaborative ERD3 efforts, within the United States and elsewhere, according to whether they are part of the private sector, the public sector, or—like the World Bank and the United Nations—fit into neither of these categories. DESCRIBING ERD3 ACTIVITIES Given the difficulty of describing every ERD3-relevant activity and institution, we present here a selection of information chosen to provide context for the assessments and recommendations contained in the rest of the report. In considering this information, it is important to be aware of its limitations, specifically:
• There is no simple way to measure the effectiveness of ERD3 efforts. Although there are a number of proxy metrics of effectiveness—e.g., the size of ERD3 expenditures, the number of patents resulting from particular research programs, and so on—such measurements are almost always open to different interpretations. For example, declining ERD3 expenditures may not necessarily mean less effective programs if unnecessary costs or unproductive programs are being eliminated and the efficiency of the remaining outlays is improved.
• Analysis of ERD3 efforts is often limited by a lack of reliable data. For example, information
about private-sector activities may be proprietary or simply not collected, and comparisons between countries can be distorted by the difficulties encountered in attempting to correct for exchange-rate fluctuations and purchasing-power disparities.
1 George Santayana (1954)

Powerful Partnerships
2-2
• It is difficult to separate ERD3 from RD3. Technologies not explicitly developed for the energy
sector may nonetheless have a significant influence on the energy future. For example, the efficient turbines used in many new power stations were derived from aircraft engines, and the application of information technology has revolutionized many parts of the electricity supply chain. Thus, although it is vital to ensure the sufficiency of ERD3 efforts, spillovers from RD3 being carried out in other areas are also important.
• Non-energy policies affect ERD3. Just as energy technologies are not the only technologies that
affect the energy sector, energy policies are not the only policies that influence energy RD3. Decisions about—among other things—trade, taxation, and the environment can all have important indirect effects on the research, development, and deployment of energy technologies (see Chapter 1).
AN EVOLVING LANDSCAPE The context in which ERD3 activities are carried out is constantly changing under the influence of a variety of economic, political, and social forces that produce new challenges and opportunities. Among the most important forces shaping international ERD3 efforts have been the following:2
Growing demand for energy services As discussed in Chapter 1, world energy consumption is expected to increase substantially over the next 20 years, with most of the new demand arising in developing countries, in particular China and India. This dramatic growth, coupled with an increased openness to foreign investments, will result in large new markets for energy technologies. For example, an annual investment of more than $100 billion is projected for new or modified electricity generation capacity in developing countries over the next 10 years, while the market for energy-efficiency technologies in those countries, estimated at $9.5 billion in 1996, is projected to grow to between $30 billion and $67 billion by 2015.3 Such markets clearly present potential opportunities not only for U.S. firms, but for suppliers from other countries. Purchasers of energy technologies would like to be able to use the competition between rival suppliers to ensure that their needs for technology transfer, local capacity building, and products specifically tailored to regional markets are met, and some of the larger countries may have leverage to do so. At the same time, the long lifetime of much energy-related capital stock and the “lock-in” that often occurs once technology standards are set mean that current choices will shape the technological trajectories and options available over the coming decades. Participation in international ERD3 collaboration now may therefore result in important opportunities in the future. Energy prices As noted in PCAST 97, low energy prices diminish the incentives both for the development and commercialization of new energy technologies and for making improvements in energy efficiency.4 A recent report by the Council on Competitiveness found, among other things, that low U.S. gasoline prices (see Figure 2.1) mean that “[domestic] customer demand for innovation for fuel-efficient or alternative-
2 See, for example, CoC (1998), de Sa (1999), and NSB (1998). 3 USAID (1997). Note that the total market for end-use equipment is much larger than that for efficient equipment. 4 PCAST (1997).
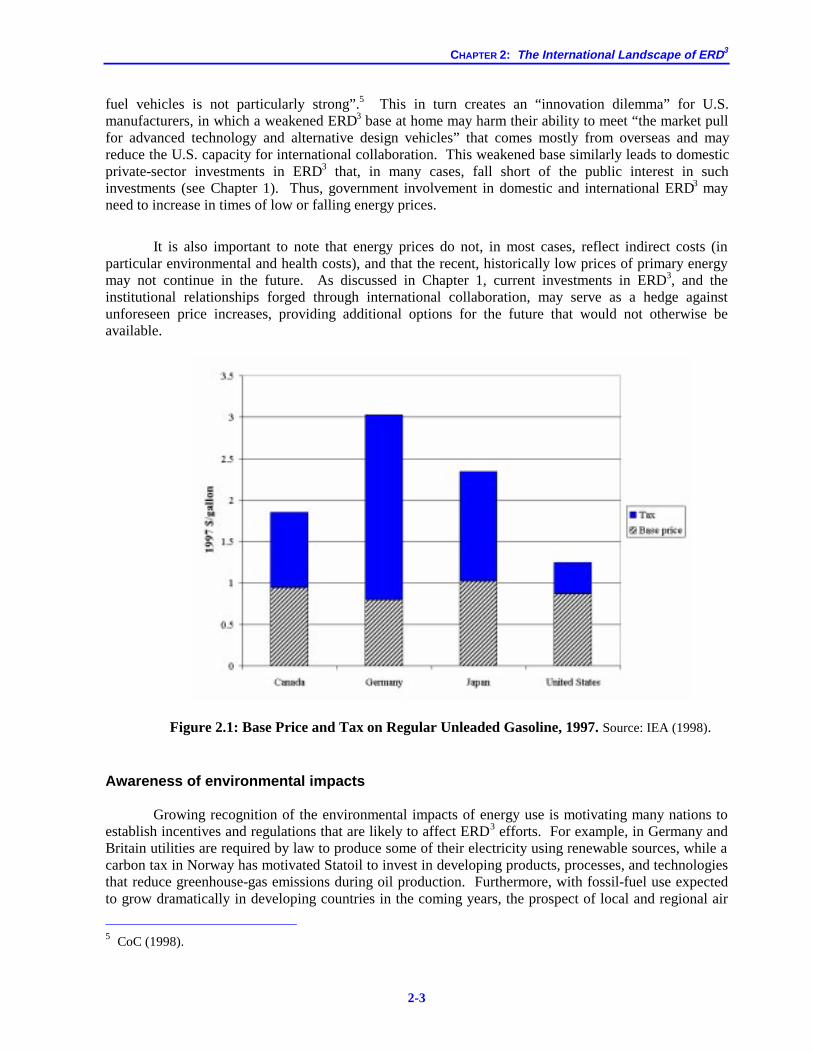
CHAPTER 2: The International Landscape of ERD3
2-3
fuel vehicles is not particularly strong”.5 This in turn creates an “innovation dilemma” for U.S. manufacturers, in which a weakened ERD3 base at home may harm their ability to meet “the market pull for advanced technology and alternative design vehicles” that comes mostly from overseas and may reduce the U.S. capacity for international collaboration. This weakened base similarly leads to domestic private-sector investments in ERD3 that, in many cases, fall short of the public interest in such investments (see Chapter 1). Thus, government involvement in domestic and international ERD3 may need to increase in times of low or falling energy prices.
It is also important to note that energy prices do not, in most cases, reflect indirect costs (in particular environmental and health costs), and that the recent, historically low prices of primary energy may not continue in the future. As discussed in Chapter 1, current investments in ERD3, and the institutional relationships forged through international collaboration, may serve as a hedge against unforeseen price increases, providing additional options for the future that would not otherwise be available.
Figure 2.1: Base Price and Tax on Regular Unleaded Gasoline, 1997. Source: IEA (1998). Awareness of environmental impacts Growing recognition of the environmental impacts of energy use is motivating many nations to establish incentives and regulations that are likely to affect ERD3 efforts. For example, in Germany and Britain utilities are required by law to produce some of their electricity using renewable sources, while a carbon tax in Norway has motivated Statoil to invest in developing products, processes, and technologies that reduce greenhouse-gas emissions during oil production. Furthermore, with fossil-fuel use expected to grow dramatically in developing countries in the coming years, the prospect of local and regional air
5 CoC (1998).

Powerful Partnerships
2-4
pollution, as well as the threat of global-climate change, should motivate international ERD3 collaboration to help reconcile the goals of economic growth and environmental protection.6 The developed world has a unique opportunity to help developing countries pursue efficient production processes, burn fossil fuels more efficiently, and use renewable energy sources, so that economic growth can occur with lower energy intensity and less pollution than in the past. (These efforts serve the interests of the United States as well, as detailed in Chapter 1.) Globalization An important development in the private sector has been the recent appearance of global energy firms. One detailed study summarized this phenomenon as follows:7
Until recently, outside of the world’s few major integrated oil companies, only a handful of energy companies were considered multinational. Currently, in addition to the scores of petroleum companies that can now be classified as multinational, the scope of many coal companies, petroleum pipeline companies, electric utilities, and power generation equipment and construction companies, has become increasingly global. Through consolidations, mergers, acquisitions, and strategic alliances, the world’s energy companies have also become more integrated. Oil and gas companies have become electricity companies; domestic regional electric utilities have become multinational electricity companies; electricity distribution companies have become generation companies; and generation companies have become distribution and transmission companies.
Increasing globalization is having a number of impacts on ERD3 activities. For example, the dramatic increase in foreign direct investment, which, for most developing nations, now far exceeds foreign aid receipts, is forcing governments to rethink the relationship between aid programs—including those in the energy sector—and private investment flows (Figure 2.2). In addition, the growing capacity for RD3 in countries such as South Korea and India, as well as the increasingly global nature of competitive pressures (leading to faster diffusion and turnover of energy technologies) means that countries should not only ensure the vitality of their domestic ERD3 base in order to remain competitive, but that international collaboration is increasingly valuable, offering access to foreign innovations and markets. Restructuring of energy markets Energy sector restructuring and reform has resulted in widespread privatization of formerly government held petroleum, electricity, and coal operations.8 Along with the trend towards globalization and the opening of borders to private capital flows noted above, this has meant that almost all industries in the energy sector—dealing with resource production, equipment manufacture, power generation, transmission, and distribution, and so on—are increasingly competing in open, international markets. This has increased international technology flows and the growth of niche firms that have been able to take rapid advantage of new market opportunities. Chapter 3 contains a more extensive discussion of the impacts of—and opportunities deriving from—energy-sector restructuring. 6 See, for instance, a recent World Bank report (“Clear Water, Blue Skies”), which estimates that the total cost of
air and water pollution in China (a large percentage of which is energy related) is in the vicinity of 8 percent of GDP, or over $50 billion annually. (World Bank, 1997).
7 EIA (1996, p. 4) 8 EIA (1996).
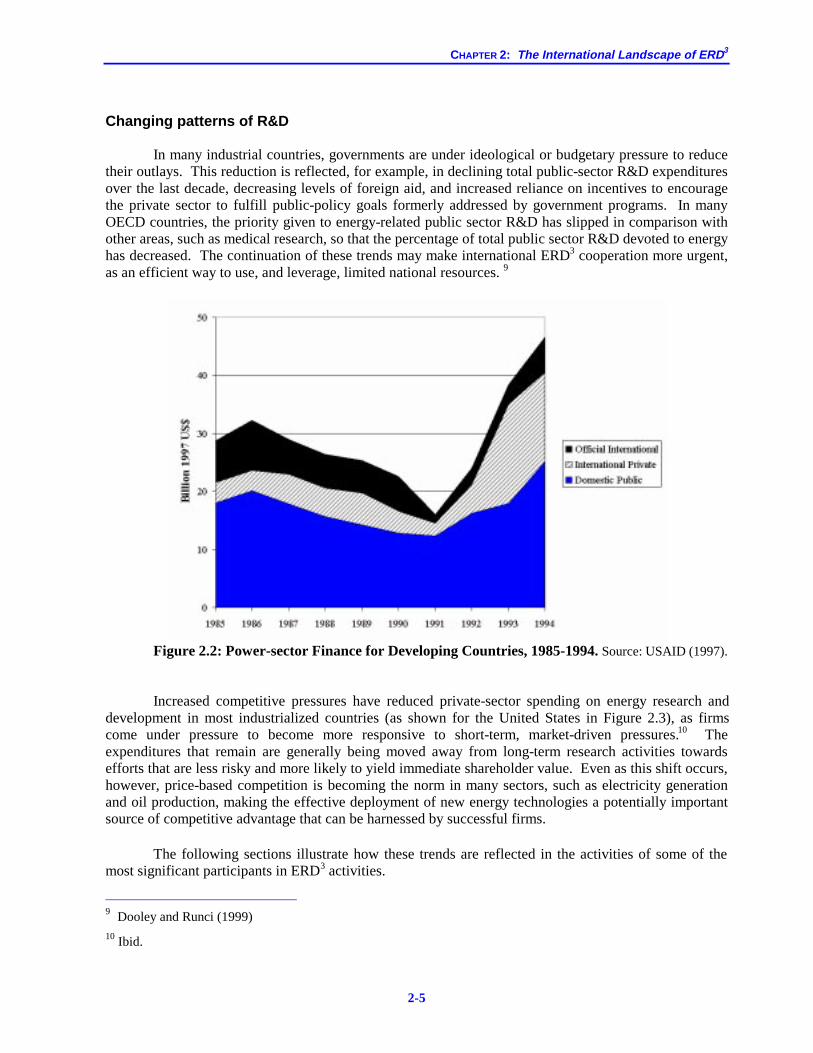
CHAPTER 2: The International Landscape of ERD3
2-5
Changing patterns of R&D In many industrial countries, governments are under ideological or budgetary pressure to reduce their outlays. This reduction is reflected, for example, in declining total public-sector R&D expenditures over the last decade, decreasing levels of foreign aid, and increased reliance on incentives to encourage the private sector to fulfill public-policy goals formerly addressed by government programs. In many OECD countries, the priority given to energy-related public sector R&D has slipped in comparison with other areas, such as medical research, so that the percentage of total public sector R&D devoted to energy has decreased. The continuation of these trends may make international ERD3 cooperation more urgent, as an efficient way to use, and leverage, limited national resources. 9
Figure 2.2: Power-sector Finance for Developing Countries, 1985-1994. Source: USAID (1997).
Increased competitive pressures have reduced private-sector spending on energy research and
development in most industrialized countries (as shown for the United States in Figure 2.3), as firms come under pressure to become more responsive to short-term, market-driven pressures.10 The expenditures that remain are generally being moved away from long-term research activities towards efforts that are less risky and more likely to yield immediate shareholder value. Even as this shift occurs, however, price-based competition is becoming the norm in many sectors, such as electricity generation and oil production, making the effective deployment of new energy technologies a potentially important source of competitive advantage that can be harnessed by successful firms. The following sections illustrate how these trends are reflected in the activities of some of the most significant participants in ERD3 activities.
9 Dooley and Runci (1999) 10 Ibid.
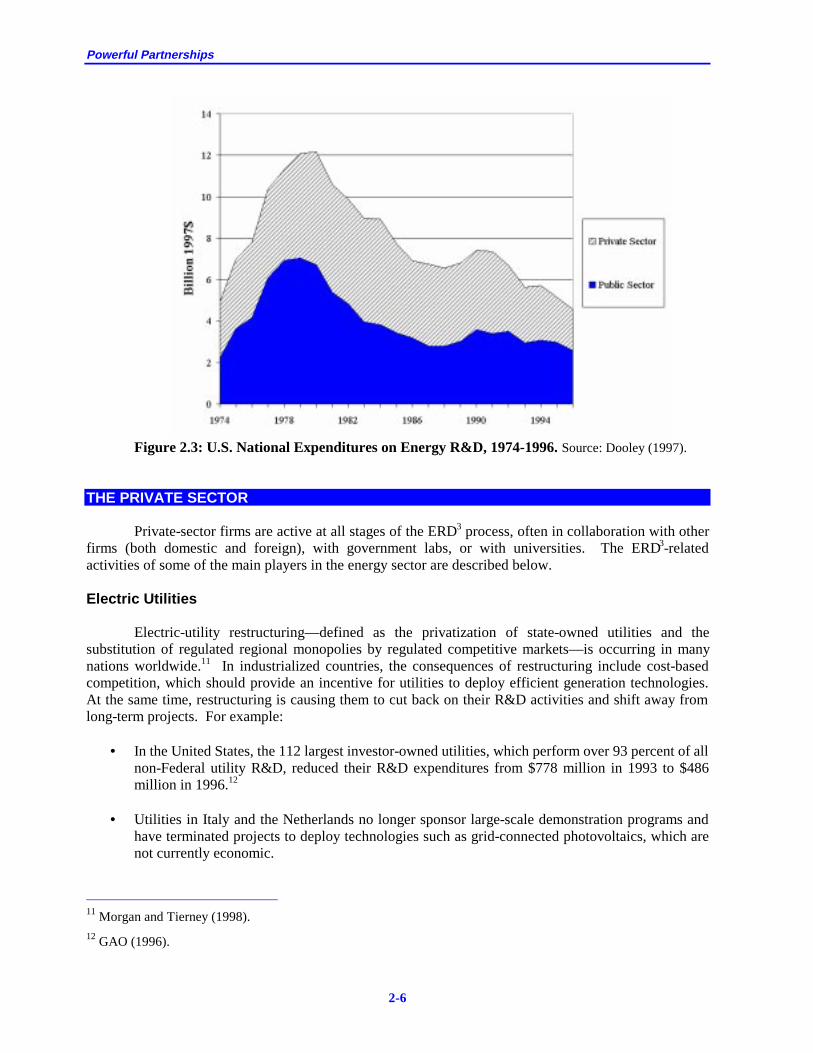
Powerful Partnerships
2-6
Figure 2.3: U.S. National Expenditures on Energy R&D, 1974-1996. Source: Dooley (1997).
THE PRIVATE SECTOR
Private-sector firms are active at all stages of the ERD3 process, often in collaboration with other firms (both domestic and foreign), with government labs, or with universities. The ERD3-related activities of some of the main players in the energy sector are described below. Electric Utilities Electric-utility restructuring—defined as the privatization of state-owned utilities and the substitution of regulated regional monopolies by regulated competitive markets—is occurring in many nations worldwide.11 In industrialized countries, the consequences of restructuring include cost-based competition, which should provide an incentive for utilities to deploy efficient generation technologies. At the same time, restructuring is causing them to cut back on their R&D activities and shift away from long-term projects. For example:
• In the United States, the 112 largest investor-owned utilities, which perform over 93 percent of all non-Federal utility R&D, reduced their R&D expenditures from $778 million in 1993 to $486 million in 1996.12
• Utilities in Italy and the Netherlands no longer sponsor large-scale demonstration programs and
have terminated projects to deploy technologies such as grid-connected photovoltaics, which are not currently economic.
11 Morgan and Tierney (1998). 12 GAO (1996).

CHAPTER 2: The International Landscape of ERD3
2-7
• Sweden’s Vattenfall, the sixth largest utility in Europe, which in the 1980s invested 70-80 percent of its corporate R&D in long-term efforts, now spends 80 percent on near-term R&D at the business-unit level instead.13
On the other hand, global restructuring has given utilities a strong incentive to make international investments, forming joint ventures and partnerships to gain access to overseas markets. This has been facilitated by the onset of privatization in developing countries, driven by the recognition that the investment required to meet future demand is beyond the means of their domestic capital markets. As a result, foreign firms—including a number of U.S. utilities—have become involved in the construction of new generation capacity and transmission lines overseas, which may lead to the more rapid diffusion and deployment of energy technologies.14 Electric-Equipment Manufacturers The manufacture of power-generation equipment is dominated by a few large, international companies (such as ABB, GE, and Siemens), that compete in a world market that has recently been characterized by oversupply and rapidly declining prices. With most new demand coming from recently deregulated markets in developing countries and increased emphasis on the cost of electricity generation as the criterion for equipment choice, firms are finding that they need to be as skilled at deal making and project financing as at technology development in order to prosper. In response to the globalization of their markets, most large equipment makers are forming international collaborations in engineering, manufacturing, and sales, and are recognizing the need to establish technology bases in new markets, often with local management.15 There is also a growing interest in distributed generation, in which small, modular electricity generators are located near consumers. These generators can be free-standing or grid connected, may be based on new technologies such as fuel cells, microturbines, or renewables, and are suitable for both residential and industrial applications. ERD3 on distributed generation is being carried out by the large electrical-equipment firms, either alone (e.g., Siemens) or in partnership (e.g., ABB-Volvo and GE-Elliott), as well as by companies not traditionally involved in this sector, such as Allied Signal. Natural Gas Companies Like the electricity industry, the gas sector is moving away from integrated monopolies toward separate, competitive markets for production, distribution, and supply. These markets are often characterized by increased regional trade, more international joint ventures, diversification by companies into electricity generation and other businesses, and a growth of niche companies. Gas firms are making substantial, though decreasing, commitments to natural-gas R&D—for example, in the United States, the industry will spend roughly $114 million in 1999 through the Gas Research Institute (GRI) down from over $200 million in 1990.16 Nonetheless, there are some innovative gas-based technologies that may be nearing the market, ranging from microturbines for the distributed generation described above, to high-efficiency power-generation systems, which couple high-temperature fuel cells with a gas turbine for electricity generation.
13 Dooley and Runci (1999). 14 For example, a recent estimate suggests that nearly 40 U.S. electricity companies have investments in 30 foreign
countries, including Europe, Australia, South America, India, China, and the Pacific Rim (IERE 1997). 15 IERE (1997). 16 GRI (1998).
Powerful Partnerships
2-8
Oil Companies The large oil companies have traditionally been among the most global of firms, producing, refining, and distributing their products throughout much of the world. Recently, slow demand growth and abundant supplies have kept oil prices low, providing little incentive to halt the decline in expenditures for technology development that occurred throughout the 1990s. (For example, between 1990 and 1996, the R&D expenditures of the four largest U.S. oil firms halved in real terms to a total of just over $1 billion in 1996.)17 Furthermore, the expectation of continued low prices has led some to predict that fundamental changes are imminent in the oil sector, with large multinational firms either evolving into “energy companies,”18 merging into “supermajors” with revenues of $50 billion and up,19 or being upstaged by service companies, like Halliburton and Schlumberger, that can form partnerships to supply technology, information, and financing on a country-by-country basis.20 Firms would like to deploy new technologies to gain competitive advantage, particularly to increase the profitability of their exploration and production efforts, within the constraints of their tight profit margins. Renewable Energy and Energy Efficiency Companies Recently, the renewable energy and energy-efficiency industries have grown worldwide. For example, the market for wind technology has increased at an average annual rate of 25 percent since 1990, currently standing at over $2 billion per year.21 In Washington alone, the state’s 274 renewable energy and energy efficiency firms now employ approximately 4,000 people and earn almost $1 billion in annual revenue.22 Elsewhere, the Royal Dutch/Shell group is planning to invest $500 million in renewable energy technologies. For international ERD3 activities, two notable developments are:
• The use of microenterprise: Recently, programs that provide financial services, training, and capital have been set up in developing countries to encourage microenterprise-based commercialization of renewable energy and energy-efficiency technologies. For example, the Solar Development Corporation—a joint venture of the World Bank and several foundations—is raising $50 million in capital to assist microenterprises that distribute, finance, and sell off-grid photovoltaics in developing countries, while the Inter-American Development Bank’s Microenterprise Unit is working in Latin America and the Caribbean to set up companies such as Soluz Dominicana, which, in its first year of operation, installed 1,000 solar home systems in the Dominican Republic.
• The proliferation of energy service companies (ESCOs): ESCOs, which already operate in many
industrialized countries, improve the energy efficiency of their customers’ operations by providing hardware, installation, third party financing, and performance guarantees. USAID in 1998 launched a program to nurture the creation of ESCOs in developing countries, and U.S. owned and operated ESCOs have enjoyed increasing success in penetrating markets in the Czech
17 PCAST (1997). 18 Stanislaw (1999). 19 McWilliams (1997). 20 Bijur (1998). 21 Siegel and Rackstraw (1999). 22 WEPG (1999).
CHAPTER 2: The International Landscape of ERD3
2-9
Republic, Brazil, Chile, Korea, and Thailand.23 The International Finance Corporation, the World Bank, and the European Union are working to form ESCOs in China, India, and Eastern Europe, an effort that—if successful—could help to diffuse innovative technologies and practices to these countries.
Consortia A number of international, predominantly private-sector consortia exist, providing a way for firms to voluntarily share resources in pursuit of common, usually pre-competitive, interests, including some collaborative international ERD3 programs. Examples in the United States include the Electric Power Research Institute (a California-based research consortium of electric utilities, with an annual budget of over $500 million and more than 700 U.S. members, and growing international participation), as well as numerous industry and trade associations, such as the U.S. Energy Association, the American Wind Energy Association, and the Export Council for Energy Efficiency. THE PUBLIC SECTOR Although the private sector has become increasingly important in the ERD3 arena over the last few years, governmental expenditures, legislation, and regulation remain major forces shaping national and international capabilities for utilizing energy technologies and partnering in collaborations. (See Chapter 1.) Governments of all countries play an important role in energy-related activities. We describe a few of those efforts below, including those in the United States, Japan, Germany, the European Union, Brazil, China, India, and the Russian Federation. The United States As shown in Table 2.1 and Figure 2.4, several Federal agencies support different areas of the United States’ international ERD3 efforts. Data collected for the Panel by RAND found that in FY 1997, the United States government spent about $235 million in support of about 320 projects that could be counted as formal international collaborations on ERD3 activities, just 0.3 percent of the total public-sector support for all research and development that year ($73.9 billion).24 It must be noted that many of the programs identified in this review have already been substantially modified, often reduced. An example is the International Thermonuclear Experimental Reactor, accounting for most of the international fusion budget, which was canceled in FY99. Further, of the projects examined, most of the funding goes to U.S. researchers for their contributions to collaborative work and in many cases the work would be done by the United States even if there was no collaboration, but the collaboration provides a means to leverage the U.S. R&D investments with work by foreign counterparts. The majority of collaborative projects are supported through the Department of Energy or the U.S. Agency for International Development (Figure 2.4); are either multinational or carried out in
23 Witcher (1999). 24 To arrive at the figures for Federal spending cited in this section, RAND identified project-level funding in which
a U.S. government-funded researcher or technical team cooperated with a foreign researcher, a foreign research institution, or a multinational research project in activities involving the RD3 of energy supply, conversion, or efficiency technologies. Excluded from the search were projects supported by the Department of Defense, loans and loan guarantees, and activities classified as basic energy sciences, nuclear-waste containment, nuclear-materials tracking, or global-climate-change monitoring. FY 1997 data for the U.S. Agency for International Development were unavailable, so estimates were based on FY 1998 levels.

Powerful Partnerships
2-10
partnership with East European countries (Figure 2.5); and involve work addressing either electricity production, distribution, and use (including efficiency, nuclear fission, nuclear fusion), or multiple energy-supply sources (Figure 2.6).
The U.S. government has three, complementary approaches to international ERD3 efforts,
namely: energy-technology development, largely undertaken by the Department of Energy, foreign assistance, for which the U.S. Agency for International Development is mostly responsible; and trade support in energy goods and services, falling under the mandate of the Department of Commerce, Export-Import Bank, the Trade and Development Agency, and the Overseas Private Investment Corporation. The activities of these agencies are described in more detail below.
Department of Energy (DOE)
DOE has responsibility for implementing and supporting the United States’ energy-related efforts, including Goal V of the National Energy Strategy, to “cooperate internationally in global issues”, by promoting “clean and efficient energy systems and science and technology collaboration”.25 The DOE’s ERD3 programs include R&D, technology demonstrations, information exchange, training, and policy support. Through roughly 160 active international agreements, DOE collaborations help leverage resources, spread the costs and risks associated with long-term research, and provide access to specialized expertise overseas. Much of the DOE’s international ERD3 effort is carried out through the National Laboratories, thirteen of which reported collaborative work with foreign researchers and institutions, with most expenditures on international-related activities going toward U.S. research and U.S.-produced equipment.
Figure 2.4: US Collaborative ERD3 Projects by Agency Expenditure, FY 1997.
Total is approximately $235 million. Source: RAND
25 DOE (1998).

CHAPTER 2: The International Landscape of ERD3
2-11
Figure 2.5: US Collaborative ERD3 Projects by Partner, FY 1997. Source: RAND
Figure 2.6: US Collaborative ERD3 Projects by Area, FY1997. Source RAND.
By area, the DOE’s activities include: • Efficiency: DOE’s international programs that explicitly promote energy-efficiency are small but
highly leveraged—for example, the Office of Buildings Technologies spent $100,000 to develop
0
20
40
60
80
100
120
Multinat’l E. Europe Asia Mid-East W. Europe N. America S. America
Powerful Partnerships
2-12
a plan for improving the energy efficiency of Russian housing, which led first to a $1 million grant from the Trade Development Agency and then to a $300 million World Bank loan to Russia. The Office of Industrial Technologies has assisted China with the preparation of an energy conservation law that took effect in 1998 and a motor systems efficiency program that is now underway. Since 1994, DOE has managed the Committee on Energy Efficiency Commerce and Trade (COEECT), a working group of 14 agencies that assists U.S. companies, especially small firms, access international energy-efficiency markets.
• Fossil: DOE’s international fossil energy programs have supported the development of oil
resources, the use of clean coal technologies, and the promotion of natural gas. Sample projects include advanced gas turbines and fuel cells (in Argentina, Canada, Guatemala, Mexico, Peru, and the Philippines), cogeneration (in India and Mexico), biomass power (in India and Mexico), and establishment of the Oil and Gas Environmental Forums in Latin America and China (Box 2.1). With USAID, DOE has implemented six coal projects in India, ranging from coal cleaning to emissions monitoring. Research activities have ranged from characterization of heavy crude oil in Venezuela to deep water CO2 disposal with Japan and Norway.
• Nuclear Fission: The DOE’s Nuclear Energy Office completed its program of international cooperation on conventional nuclear reactor development in 1997. Collaborations on breeder-reactor technology and reprocessing (with Japan), liquid-metal reactors (with Korea), high-temperature gas reactors (with Japan, Germany, and Switzerland), and others have been canceled due to changes in U.S. policy. The main focus of current international fission-energy program funding is to ensure reactor safety in Eastern Europe and the Former Soviet Union, where several countries generate significant amounts of electricity using nuclear power. Activities include helping countries evaluate the safety characteristics of their reactors, installation of safety equipment, improving training and procedures, and enhancing spent fuel storage. Reactor safety is DOE’s largest international energy program.
• Nuclear Fusion: The DOE’s nuclear fusion program has had a history of international
cooperation, dating back to the 1960s, but most recently has been centered around the International Thermonuclear Experimental Reactor (ITER). Proposed by the USSR in 1985, ITER was subsequently developed as a collaboration among Europe, Japan, Russia, and the United States through conceptual design (1988-1990) and engineering design (1992-1998). Congress directed DOE to end U.S. participation in ITER in FY 1999, and future U.S. options are currently being explored.26
• Renewable Energy: Although 80 percent or more of the market for such renewable energy
technologies as photovoltaics and wind energy is outside the United States, DOE’s international activities in this area have been very modest, concentrating on technology development such as small-scale wind-diesel hybrids, renewable resource assessment, the development of international standards, trade support, rural electrification, and technical assistance.27 DOE projects are highly leveraged through cooperation with other Federal agencies, industry, and the Multilateral Development Banks (MDBs). For example, targeted DOE international programs worth about $18 million between FY 1993 and FY 1998 have helped an estimated $1.9 billion worth of renewable projects into the funding pipeline of MDBs. This has particular benefits for U.S. firms as MDB loan programs do not allow the tied aid commonly used by foreign competitors (Chapter 3), helping level the playing field and giving U.S. firms a competitive chance.
26 Dean (1999), Taylor (1999). 27 Siegel and Rackstraw (1999).

CHAPTER 2: The International Landscape of ERD3
2-13
DOE’s international energy RD3 activities offer substantial U.S. benefits, most recently with a Memorandum of Understanding signed with China for a $100 million clean energy program. Environmental Protection Agency (EPA) Although EPA sponsored only a few international ERD3-related projects in FY 1997, with expenditures totaling just $1.7 million, EPA has initiated a number of successful programs around the world, often in collaboration with other Federal agencies. The early involvement of EPA has also been of use in initiating new international ERD3 programs that later leverage additional funding from other sources and participation by other organizations. For instance, EPA helped establish Energy Efficiency Centers in Poland, the Czech Republic, Russia, the Ukraine, Bulgaria, and China; these centers have subsequently attracted funding from DOE, USAID, MDBs, and other donors, and have been instrumental in influencing energy and environment policies favorable to clean energy technologies, preparation and financing of major projects, and market-transformation activities. Similarly, EPA funded early work in Thailand to promote Demand Side Management programs, which has since led to major financing by a number of other donors, and substantial policy and program changes by the Government of Thailand and the Thai Electric Utility Company which have resulted in a substantial fraction of Thailand’s electrical energy service requirements being met by demand reductions.
In addition, EPA has focused on encouraging the adoption of energy-efficient building technologies, on helping to institute energy-related codes, standards and labeling, and on greenhouse-gas mitigation analysis. China and Russia are the EPA’s principal bilateral partners, with successful projects including the transfer of energy-efficient refrigerator technology to China, and the improvement of energy-supply planning in Moscow. In addition—supporting the idea that the United States should lead by example—China recently invested $65 million on promoting the adoption of high-quality, energy-efficient, compact-fluorescent lighting through an effort that, in many ways (including the name), is modeled on EPA’s domestic “Green Lights” program. U.S. Agency for International Development (USAID) USAID is in charge of foreign assistance-programs, funded in part due to the recognition that developing countries are critical to U.S. interests. The total USAID agency budget across all sectors is about 0.5 percent of the Federal budget, and supports programs in more than 80 nations (excluding Communist countries such as China, North Korea, and Cuba), with in-country missions determining and managing their own specific portfolios of activities. Although historically focused on the public sector, USAID is increasingly engaged with private enterprise—for example, USAID’s global energy strategy aims to foster market reforms in the energy-sector and to stimulate international and domestic private investments, as well as to promote renewables, clean energy technologies, and energy efficiency.28 These goals are targeted through a number of technology partnership programs, such as those between utilities in the United States and those in developing and transition countries, and “Technology Cooperation Agreements,” which serve as channels for public- and private-sector resources to assist the transfer of technologies that reduce greenhouse-gas emissions (Box 2.1). In FY 1998, USAID spent roughly $94 million on 44 energy-related programs, focused largely on improving policies and providing the training needed to create open markets for technology
28 USAID (1998).

Powerful Partnerships
2-14
commercialization. For example, the “Asia Sustainable Energy Initiative,” which operates in India, Indonesia, and the Philippines, funded the placement of sustainable-energy advisors in each of these countries, the development of renewable and efficiency projects, and exchange programs for senior policy makers and technical experts. With funding from the USAID, the U.S. Energy Association (USEA) has established an Energy Partnership Program (EPP) that establishes practitioner-to-practitioner, multi-year partnerships between U.S. and developing-country utilities and regulatory agencies (Box 2.1). In 1998, USAID launched a program to nurture the creation of Energy Service Companies (ESCOs) in developing countries. USAID also leads the Energy and Environment Training Program, training nearly 10,000 people from 94 countries over the past decade (Chapter 3). Finally, USAID has established strong field programs through Renewable Energy Project Support Offices and a number of USAID country missions (Box 2.2).
Box 2.1 Fostering the International Dialogue on Energy
One efficient and effective means of transferring information and experience is through simple “face to face” exchange, either through a series of workshops and conferences or actual personnel exchange between countries and firms. Examples of two such programs—one launched by DOE, and the other sponsored by USAID—are highlighted below. DOE’s Western Hemisphere Oil and Gas Environmental Forum
The Western Hemisphere Oil and Gas Environmental Forum is a cooperative effort between the private and state-owned oil and gas companies in the United States and Latin America. The Forum’s mission is to foster industry cooperation to improve the health, safety, and environmental performance of oil and gas activities throughout the hemisphere. The Forum encourages both direct information exchange and contacts among members of participating companies, and dialogue with the environmental community and government. It has done so through a series of 11 official meetings, at which issues such as upstream environmental impact assessments, management systems, and performance indicators have been on the agenda. From the beginning, member companies pledged to provide future support for the Forum. Originally supported by DOE, the Forum became self-supporting in 1996. USAID and USEA: Energy Partnership Program
The United States Energy Association (USEA) is the U.S. Member Committee of the World Energy Council (WEC) and, as such, coordinated participation of the United States in WEC. USEA also manages agreements funded by USAID that provide opportunities to transfer U.S. energy expertise to developing nations and expose U.S. companies to emerging markets.
Since 1990, the USEA has managed an “Energy Partnership Program” on behalf of USAID. The Program
matches U.S. utilities and regulatory agencies with overseas counterparts in over 21 countries based on compatibility of needs and capabilities, similarity of energy systems, and potential common business interests. Once selected, the participating organizations execute partnership agreements that extend for a two-year period, and result in the exchange of senior executives of the partner organizations to exchange information on market-based energy production, transmission, distribution, regulation, and climate-change mitigation. The benefits to foreign partners include the dissemination of information on “best technologies and practices”; the improvement of management and financial performances; and an increase in energy efficiency. At the same time, the partnerships allow U.S. participants to identify and develop strategic partnerships, identify both short- and long-term business opportunities, and develop their own staff capabilities.
Source: DOE www.fe.doe.gov/international; USDOE (1998); USEA (1998).

CHAPTER 2: The International Landscape of ERD3
2-15
Department of Commerce
The U.S. & Foreign Commercial Service (US&FCS) of the Department of Commerce’s International Trade Administration counsels U.S. businesses on exporting through offices based in the United States and overseas. Local offices provide market information, export counseling, export assistance, and other services to U.S. energy-supply and energy-efficiency technology exporters, and facilitate overseas contacts through international offices. The program is designed to increase both the number of firms exporting technologies and the number of markets to which they export. It also promotes and facilitates the participation of U.S. firms in trade shows, and encourages additional support and facilitation for such activities by other private- and public-sector organizations. The FY 2000 budget request for the US&FCS amounts to $183 million, covering all U.S. trade activities, which is level funding as compared to FY 1999.29
Trade Assistance Agencies
In addition to technology development and foreign aid, the Federal government operates three agencies that support trade, including exports of U.S. energy-related goods and services. Although these agencies generally promote established technologies, rather than supporting ERD3, their role in establishing links with fast-growing overseas markets is clearly important in setting the stage for international collaboration.
• U.S. Export-Import (Ex-Im) Bank: The Ex-Im Bank is a government-held corporation that provides loans and guarantees to U.S. exporters and to foreign purchasers of non-military U.S. goods and services. Ex-Im is the U.S. government’s largest source of financing for international energy projects—of the $12.2 billion total it loaned out in FY 1997, a little over $1 billion went to energy projects, mostly related to electricity generation, coal processing, and petroleum refining. Despite its concentration on fossil fuels, the Ex-Im Bank does have a specific “Environmental Exports Program” which has, for example, guaranteed credit lines for customers in India buying solar-energy components from a firm in New Jersey, loaned $49.7 million to a Nevada company that will build, own, and operate four geothermal plants in the Philippines, and insured the $440,000 dollar sale of wind turbines to Mexico from California.30 A recently initiated effort between the U.S. government and selected developing and transition economies will attempt to establish a “Clean Energy Fund” in the Ex-Im Bank to buy-down the cost and risk of efficiency and renewables projects. The Fund is, however, expected to total only a small fraction of the amount loaned for a single coal-fired power plant.
• Overseas Private Insurance Corporation (OPIC): OPIC is an independent Federal agency that
provides political-risk insurance and financing to U.S. companies wishing to invest in transition economies or developing countries. In FY 1997, 40 percent of the $2.3 billion worth of insurance and financing that OPIC provided went toward energy projects, mostly related to oil and gas development and power generation.
• U.S. Trade and Development Agency (TDA): TDA helps U.S. companies enter overseas markets
by funding feasibility studies, reverse trade missions, conferences, and technical assistance, especially for infrastructure and industrial projects in middle- and low-income countries. In FY 1997, TDA invested $7.5 million, 16 percent of its total budget, in 65 energy and power
29 Siegel and Rackstraw (1999). 30 Ex-Im (1998).
Powerful Partnerships
2-16
activities, supporting projects involving commercially-proven technologies for gas transmission and distribution, clean coal, power-plant rehabilitation, renewables, and energy efficiency.31
Efforts have been made in the past to strengthen U.S. clean energy technology export support.
The Energy Policy Act of 1992 (EPACT), for example, contained numerous provisions intended to stimulate the export of renewable energy, energy-efficiency, and clean coal technologies to developing nations.32 As stated in the Act, these provisions were intended to meet the dual goals of promoting the export of U.S. technologies, while assisting foreign nations in meeting their energy needs in an “environmentally acceptable manner consistent with sustainable development policies.” The Act recognized the need for financial assistance to U.S. companies to help them compete successfully against Japanese and European firms, as well as the need to build the capacity of developing nations to use U.S. energy technologies. Further, the Act explicitly recognized the importance of energy-efficiency technologies in reducing greenhouse gas emissions in developing countries. Finally, the Act authorized significant funding for the programs. Since 1992, however, few of the EPACT’s energy technology export provisions have been implemented as envisioned in the Act. The export assistance programs never received much more than $2 million in annual appropriations, and recently the renewable energy export program has been zeroed out. Other OECD Members Other OECD members—in particular Japan, Germany, and the European Union (EU), some of whose activities are highlighted below—are also major participants in collaborative international ERD3 projects with both developed and developing countries, often pursuing projects directly related to their commercial and environmental interests. For example, Japan’s promotion of efficiency in China’s coal-fired power plants is, in part, an effort to reduce acid rain in the region, and the EU’s proximity to the countries of Central Europe and the Former Soviet Union (FSU) is an important driver of ERD3 cooperation focusing on nuclear safety in those nations. The European Union (EU) In addition to their own activities, the European Union’s member states support several international ERD3 programs through the EU that aim to provide mechanisms for the demonstration and deployment of new energy technologies, the dissemination of information, and indigenous capacity-building. Some of these efforts—especially those hosted in Eastern Europe and the FSU—take advantage of existing, low-cost opportunities to improve energy efficiency through technology deployment. The EU’s activities help European energy-technology vendors position themselves to capitalize on emerging opportunities in the global marketplace, and establish pathways for institutionalized cooperation between the EU and non-EU countries. Some of the most significant programs are:
• ALTENER: This program’s mission is to eliminate barriers to the penetration of renewable
31 TDA (1998a, 1998b). 32 EPACT provisions included: (a) training under Section 1203, to be administered through USAID, authorized at
$6 million per year for five years beginning in FY 1993; (b) building on earlier legislation enacted in 1984, the formation of an Interagency Working Group under Section 1207, divided into sub-working groups on renewable energy exports (the Committee on Renewable Energy Commerce and Trade) and energy efficiency exports (the Committee on Energy Efficiency Commerce and Trade) under Section 1608, and directed to consult with industry groups and NGOs and make recommendations as to the coordination of Federal export programs; (c) energy technology export trade promotion through the Trade Promotion Coordinating Council under Section 1607; and other provisions.
CHAPTER 2: The International Landscape of ERD3
2-17
energy sources within the European Union and in selected countries in Central and Eastern Europe and the Mediterranean. Activities include financing feasibility studies of the potential of renewable energy sources in participating countries (up to 100 percent support), and pilot actions aimed at creating or extending renewable energy infrastructure (up to 50 percent support). The budget for ALTENER was $48 million between 1993 and 1997; its successor, ALTENER II, which will operate from 1998 until 2002, has a budget of $33 million for FY 1999.
• JOULE-THERMIE: This program houses ERD3 collaborations carried out between the EU’s
member states. With over $1 billion of funding between 1995 and 1998, these programs primarily focused on decreasing the environmental impacts of energy use, developing renewable energy technologies, and research into fossil-fuel use.
• PHARE and TACIS: The EU’s technical assistance programs aim to develop capacity and
management skills, and provide advice, expertise, and direct financing for energy-infrastructure projects outside the Union. Each program has a different geographic focus: PHARE sponsors projects in Central and Eastern Europe; TACIS operates in the FSU and Mongolia. Projects are financed from a variety of funding sources, including the European Development Fund and the European Investment Bank. Between 1994-1996, PHARE's total budget was $176 million, and that of TACIS was $460 million.
• SYNERGY: With a 1997 budget of $7.2 million, the SYNERGY program promotes energy
cooperation between EU member states and countries in Asia, Latin America, Africa, and the Middle East. Projects aim to contribute to EU goals, such as the international economic competitiveness of European energy industries, energy-supply security, and global environmental protection, by providing advice, training, analysis, and support for regional cooperation. Projects in Asia and Latin America have promoted the diffusion of European energy technologies in these markets, and ongoing cooperative efforts initiated under the SYNERGY program include the Euro-Mediterranean Forum, the Balkans Task Force, and the new China-European Community Group.
Japan The Japanese government is the world’s largest supporter of ERD3 activities, spending over $2.5 billion in total in 1997, the majority of which went toward nuclear energy R&D. With regard to international ERD3 collaboration, the Japanese government funds a number of programs in all areas of energy research, some of the most significant being:33
• Climate Technology Initiative (CTI): Japan, together with the Australia, the Netherlands, and the United States, has led the effort on the CTI, and served as the first chair of the multilateral venture. The CTI is an effort to pool the climate-related energy-technology expertise of Canada, Finland, Germany, Japan, the Netherlands, Norway, Australia, and the United States, primarily in the areas of oceanic and geological sequestration of carbon dioxide and large-scale solar power generation. The chair of the CTI rotates among member nations, and it is currently held by the United States.
• Energy Conservation Center, Japan (ECCJ): ECCJ is a government-owned corporation that
promotes energy efficiency in Japan, but also sends experts overseas to assist in identifying and
33 Dooley (1999).
Powerful Partnerships
2-18
implementing opportunities for making energy-efficiency improvements, and trains visitors from other nations in energy conservation practices. ECCJ worked with 95 countries in 1995.
• Fast Breeder Reactors: In April 1998, Japan announced that in the future it would collaborate
with Russia and France to share the costs and risks associated with the development of breeder reactors.
• International Thermonuclear Experimental Reactor (ITER): Japan has consistently been one of
the leading supporters of fusion research through its participation in the ITER project, a collaborative energy R&D program involving Europe, Japan, Russia, and (until recently) the United States. In 1997, the Japanese government devoted $189 million, a considerable portion of its fusion research program, to participation in ITER.
• Japan Development Bank: In 1997, the Japan Development Bank, in cooperation with the World
Bank and the Japanese Environment Agency, founded a 3-year “Global Environment Program” to transfer environmental technologies and know-how to developing nations, with an initial focus on the public and private sectors of Brazil, India, China, Nigeria, and Russia.
• Other programs: The Japanese government also has three rather large programs focusing on
international aspects of ERD3: “International Cooperation for Energy and the Environment (Green Aid Plan),” allocated $80 million in 1998, seeks to help developing nations reduce their greenhouse-gas emissions by transferring knowledge and deploying technology; “Providing the Foundations for International Facilitation of Clean Coal Technology,” was given $22 million in 1997; and “Promoting International Joint Research Projects with the Oil-Supplied Countries,” was allocated $20 million in 1997.
Germany After Japan and the United States, the German government is the next largest sponsor of energy R&D, spending $394 million in 1997. Over the last decade, Germany has sharply reduced its funding for nuclear fission R&D programs, but—through collaborative ventures with industry, tax credits, and other measures—is trying to both increase the share of renewables in its domestic fuel mix, and assist its growing wind and solar energy industries in becoming prominent in world markets. Germany is engaged in international ERD3 cooperation on a variety of levels and through a variety of institutional arrangements. With OECD countries, its activities include participation in IEA, ITER, and the programs of the EU, as well as bilateral agreements for science and technology cooperation, including three on energy R&D with the DOE. Germany also has bilateral science and technology agreements with several countries in Asia, Africa, Latin America, Central and Eastern Europe, and the FSU, encompassing efforts to improve energy efficiency and reactor safety, to establish indigenous capacity for energy and environmental research, and to demonstrate and deploy renewable energy technologies. Between 1974 and 1995, the German government spent some $360 million on renewable energy projects in the developing world, the majority of which focused on solar thermal and photovoltaic systems to operate water pumps and desalination plants. 34
34 Runci (1999).

CHAPTER 2: The International Landscape of ERD3
2-19
Non-OECD Nations Many valuable opportunities for international ERD3 collaborations lie in partnerships with nations outside the OECD, whose rapidly growing demand for energy services will result in enormous needs for new energy-technology infrastructure of the coming years. Brief overviews of four non-OECD countries that are emerging as important players in ERD3 are provided below. Brazil Brazil has rapidly growing oil, natural gas, and electricity markets, and produces large amounts of hydroelectric power. Due to financial difficulties and the need for capital to respond to its increasing energy needs, Brazil’s energy sector has experienced a considerable shift away from its traditional, government controlled monopoly structure in an attempt to create a favorable climate for private investment. As a result there are many opportunities in the Brazilian energy sector, ranging from an already substantial market for petroleum equipment and services, to an increasing demand for natural gas technology, thermal electricity generation, and pollution-control equipment.35 One notable example of collaboration between the United States and Brazil already in existence is PROCEL, a Brazilian government program launched in 1986 to fund energy conservation projects in both the private and public sectors, which has received assistance from USAID, DOE, and EPA (see Box 3.1). In addition, Brazil has one of the world’s largest renewable energy programs, namely production of ethanol from sugar cane. Begun in 1976 as a way to both reduce oil imports and stabilize domestic sugar output, ethanol fuel production reached nearly 14 billion liters per year in 1996-97, providing about 42 percent of the fuel consumed by Brazil’s light vehicles. Production of ethanol from sugar cane supports nearly one million jobs in rural areas, and provides environmental benefits, including improved urban air quality and reduced carbon emissions. Brazil avoided about 9 million metric tons of carbon emissions due to bio-ethanol use in 1996-97, equivalent to nearly 20 percent of its actual carbon emissions from burning fossil fuels.36 China China is the world’s second largest energy consumer and the biggest user and producer of coal. With current projections that Chinese energy consumption could almost double over the next 25 years, this period will be a crucial “window of opportunity,” in which improved energy technologies will, or will not, be implemented, with lasting local and global consequences for the environment, the economy, and human health. Like many other developing countries, China does not yet have major energy R&D programs of its own, although extensive efforts to deploy technologies that increase energy efficiency, along with structural changes, have meant that, over the last 20 years, energy use has grown only half as fast as the economy. While the scope for further improvements is large, it is not yet clear how incentives for efficiency will be incorporated into China’s current program of market-based reforms, although the National Power Corporation recently announced that it would institute a 3-year moratorium on new conventional thermal power projects, concentrating instead on making improvements to the power grid and developing renewable and clean coal generation technologies.37
35 EIA (1998a). 36 Machado (1997). 37 Logan (1999).

Powerful Partnerships
2-20
Coal will continue to be the dominant fuel source in the near future, and thus there are significant opportunities to engage in cooperative exchanges of technology, information, and practices for deployment of coal power technologies that can achieve progressively higher efficiencies over the coming decades with decreasing emissions of both pollutants and greenhouse gases. Natural gas (which currently accounts for less than 2 percent of energy use) may at the same time increase in importance, particularly with the increased attention currently being paid to the development of coal-bed methane, and the rapid growth in the number of vehicles will result in increased demand for oil. China is also likely to be one of the few places where new nuclear plants will be installed in the next two decades, with a planned increase in nuclear capacity of 30 GW by 2020. The Chinese market therefore constitutes one of the few opportunities for the deployment of new reactor technology, and ensuring the safe operation of the expanding number of nuclear plants is of obvious importance. Renewable energy, particularly biomass, wind, and solar, also has substantial promise in China, as do other distributed and rural power systems. India Currently the world’s sixth largest energy consumer, India’s demand for energy is increasing rapidly—for example, the electricity sector alone is projected to grow at an annual rate of 4.6 percent through 2010, an expansion that will require major infrastructure investments. At present, all of India’s energy industries are dominated by government involvement and ownership.38 Recognizing the need for private capital, however, India allowed private firms to enter the electricity-generation business in 1991, and privatization of existing transmission and distribution networks is being considered. Private-sector involvement in the exploration and production of oil and gas has also begun, with government-approved production-sharing contracts, including several with U.S. firms. As result of fiscal and financial incentives for renewable energy, and support from organizations including the World Bank, the UN Development Program, and the Global Environment Facility, India became the world’s third largest wind energy producer in 1996, and also has a large market for photovoltaic technology—the United States alone exported about 12 percent of its PV cells and modules to India in 1995.39 India has received assistance in new power-generation projects, institutional reform, technology transfer, and energy-efficiency enhancement from a variety of multilateral donors (including the World Bank Group and the Asian Development Bank), as well as through bilateral arrangements with individual countries, in particular Japan, which has been by far the largest donor of aid to India. USAID has an extensive program with India (Box 2.2).
In May 1998, in response to a series of nuclear tests, economic sanctions were imposed on India by the United States and Japan, and bilateral assistance from many other countries was suspended or terminated. Such sanctions forbid U.S. banks from lending to India’s government, prohibit new loans and loan guarantees from agencies such as OPIC and the Export-Import Bank, and require the United States to oppose multilateral assistance by organizations such as the World Bank and the International Monetary Fund. These measures could severely affect prospects for collaboration in the energy sector—for example, U.S. opposition recently forced the delay of $865 million of World Bank loans for energy infrastructure and road construction.40
38 TERI (1998). 39 EIA (1998b). 40 EIA (1998b).
CHAPTER 2: The International Landscape of ERD3
2-21
Box 2.2: USAID Programs in India USAID has been very active in India in promoting privatization of the power sector, renewable energy, and
energy efficiency. In one such program, USAID has been partnering with the National Thermal Power Corporation (NTPC) to develop a national network of efficient power plants in India, with the goal of reducing carbon emissions by 2 million metric tonnes by 2001. The program emphasizes technical assistance and demonstration projects for meeting these goals. NTPC invested $2.5 million in new energy-efficient technologies in the first year of the program, and invested in feasibility studies for further improvements in the group’s seventeen power plants (which produce among them 25% of India’s power).
USAID has also supported bagasse (sugar cane fiber residues) cogeneration in India through policy studies,
cost-shared grants, and technical assistance. Partners in this project include the Indian government and universities, and private-sector firms and other NGOs in both India and the United States. Through USAID’s and partner’s efforts, over 300 MW of bagasse cogeneration are now on line, with significant reductions in annual carbon emissions from power plants. Furthermore, government regulations and appropriate tariffs for cogenerated power have been established, which will allow continued opportunities for efficient deployment of cogenerated power (see Combined Heat and Power Initiative in Chapter 3).
There is also an Indian private power initiative being promoted under the direction of USAID, the goal of
which is to facilitate the establishment of an institutional framework to catalyze efficient private power projects. The Indian Government, State Electricity Boards, Indian NGOs, and U.S. firms and NGOs are all participating in the initiative, which has led to the establishment of a framework for supporting and promoting private power nationally, and the training of over 400 energy-sector professionals. In addition, the restructuring efforts are expected to leverage a $600 million loan for investment in new power-generation projects.
Source: Jefferson Seabright. Presentation to PCAST IERD3 Panel, November 20th, 1998.
Russian Federation In contrast with the high priority placed on ERD3 during the Soviet period, energy-related research activities accounted for only about $35 million, or 0.7 percent, of reported civilian RD3 spending in 1993, and—given the pressures on the Russian government to stabilize its precarious fiscal situation by cutting expenditures—are likely to decline further in the near future. In 1994, Russia announced a new Energy Strategy, which signaled a fundamental shift in ERD3 policy away from increasing gross energy output to promoting efficiency, resource conservation, and environmental protection. Perhaps more important is the need for fundamental institutional reforms—for example, eliminating energy subsidies to domestic consumers, fostering competition, and encouraging the development of capital markets—to generate incentives for adopting new technologies. Indeed, international actors engaged in cooperative energy-sector activities in Russia have generally focused on providing technical assistance to support such reforms. OTHER MAJOR PLAYERS As well as governments and firms, a multitude of other institutions of diverse scale and scope are involved in ERD3 activities, ranging from the programs carried out by the International Energy Agency on behalf of its 24 member governments, to multilateral organizations, such as the World Bank, to small NonGovernmental Organizations (NGOs) operating at the local level. A selection of some of the most important global players is provided below.

Powerful Partnerships
2-22
The Global Environment Facility (GEF)
The GEF is the financial mechanism for implementing the global conventions agreed to at the 1992 U.N. Conference on Environment and Development, including the Framework Convention on Climate Change. The GEF is implemented by the World Bank, the U.N. Development Program, and the U.N. Environment Program, and has an independent Council with 32 member nations. Through 1993, the GEF energy-efficiency and renewable energy portfolio consisted of 63 projects in 38 countries, with a GEF commitment of $610 million and associated financing of $4.8 billion for those projects. GEF’s total budget for 1994 to 1998 was $2 billion, and for 1998 to 2002 is expected to be $2.75 billion.
The GEF’s energy-related activities are largely aimed at paying the incremental costs of reducing the greenhouse-gas (GHG) emissions arising from development projects. Meeting these costs is often not justified at a local or national level, but can be justified when the global benefits of reduced GHG emissions are included. There are two categories of incremental costs that qualify for GEF’s involvement:
• Identifying and reducing institutional barriers, such as transaction costs, that are preventing the deployment of energy-technologies that would otherwise be cost effective. At present GEF has two Operational Programs (OPs) in this category, “Removal of Barriers to Energy Efficiency and Energy Conservation” (OP 5) and “Promoting the Adoption of Renewable Energy by Removing Barriers and Reducing Implementation Costs” (OP 6).
• Buying-down the price of new technologies that offer the potential for large GHG-emissions
reductions but are not yet cost-effective, although they have good prospects for becoming cost-effective with accumulating experience. GEF has several programs in this category, “Reducing the Long-Term Costs of Low Greenhouse Gas Emitting Energy Technologies” (OP 7).
GEF is also developing two other Operational Programs, one to promote sustainable transport and
the other for carbon sequestration. In all instances, GEF aims to leverage its funds to make technological and institutional innovations self-perpetuating through market forces, without continuing subsidies.41 The International Atomic Energy Agency (IAEA) Based in Vienna, the IAEA serves as the world's central intergovernmental forum for scientific and technical cooperation in the nuclear field, and as the international inspectorate for the application of nuclear safeguards and verification measures covering civilian nuclear programs. A specialized agency within the United Nations system, the IAEA came into being in 1957 and, in 1997, had 128 Member States and a budget of $232 million. Among its activities are the creation of databases and methodologies to compare the costs and benefits of nuclear power with other ways of generating electricity, and technical cooperation programs that try to encourage safe operation of nuclear reactors, safe disposal of nuclear waste, technology transfers, and capacity building. The International Energy Agency (IEA) Formed in 1974 as an autonomous agency of the OECD Member countries, the IEA’s mission has evolved from its original focus on mitigating oil-supply disruptions to promoting diversity, efficiency, and flexibility within the energy sector in general. To this end, the IEA, among other activities, coordinates international cooperation in ERD3 activities via “Implementing Agreements” (IAs) that
41 See also the page 3-29 and footnote 43 for recent GEF initiatives.

CHAPTER 2: The International Landscape of ERD3
2-23
provide a framework for collaboration between both member and non-member countries.42 Projects cover fossil fuels, renewable energy technologies, fusion power, and energy end-use technologies, with activities ranging from pre-competitive development to the deployment of commercial-ready technologies, and member countries elect to join individual IAs. Altogether, there are forty IAs operating through a combination of jointly-funded activities, independent activities coordinated through a shared research agenda, and activities directly supported by the IEA. It is estimated that the level of effort for all these types of cooperation is between $120 million and $150 million per year. Non-Governmental Organizations (NGOs) NGOs have been active in creating markets, advocacy, training, technology demonstration, and financing in the energy sector of many countries. Some NGOs facilitate community involvement in environmental issues, such as energy-related air pollution in Eastern Europe. Others are developing innovative financial and service networks for the deployment of clean energy technologies—such as household PV-powered lighting systems—to rural areas of developing countries. Many NGOs are involved in community development work that involves energy technology; examples range from the provision of clean water for households to agricultural development. NGOs can play a particularly important role in energy technology deployment because of their strong community involvement.43
NGOs such as the International Institute for Applied Systems Analysis (the source of the scenarios described in Box 1.1)—take the form of national and international research institutes and organizations. In many countries, national academies of science, engineering, and medicine provide a way to call on expertise from academic, private sector, and policy communities, e.g., to advise on and analyze the complex issues involved in choosing and implementing energy strategies. The academies often work together with foreign counterparts to provide international perspectives and forge cooperative recommendations—examples include an ongoing China-U.S. Academy study of energy options, and a India-U.S. Academy effort that is just beginning. In addition, the International Council for Science Unions (ICSU)—an NGO comprising 95 multidisciplinary National Scientific Members (scientific research councils or science academies) and 25 international, single-discipline Scientific Unions—is a major international forum for the scientific community. For example, ICSU provided “An Agenda of Science for Environment and Development into the 21st Century”—including a section on energy44—for the UN Conference on Environment and Development (the Rio Conference), and was the originator of the International Geosphere-Biosphere Program, an international scientific effort to understand human impacts on the global climate system. Regional Development Banks The United States is a shareholder in the four major development banks that focus on regional economic-development issues. All of these banks make significant loans to the energy sectors of developing countries, generally concentrating on traditional energy-infrastructure projects, although many are starting small programs to encourage energy efficiency and the use of renewable energy technologies. The banks are:
42 IEA (1998). 43 Tirpak (1999). 44 Holdren and Pachauri (1992).
Powerful Partnerships
2-24
• The African Development Bank Group (AFDB) is based in Abidjan, Cote d’ Ivoire and has 77 member nations, 53 from Africa and the remainder from North and South America, Europe, and Asia. In 1997, AFDB lent a total of $1.6 billion to its African member countries, of which approximately $115 million went to the energy sector.
• The Asian Development Bank (ADB) is composed of 16 non-regional and 40 regional members,
including China, India, Indonesia, Korea, Pakistan, Philippines, and Thailand. The energy sector received the largest proportion of the ADB’s new loans in 1997, accounting for $13.5 million of the $50.8 million total lending.
• The European Bank for Reconstruction and Development (EBRD) assists the transitions toward
market-oriented economies in Eastern Europe and the Commonwealth of Independent States. In 1997, the EBRD approved loans for 143 new projects worth approximately $3.6 billion, of which 11, totaling $375 million, went to the energy sector. Approximately half of these loans went to projects that facilitated the establishment of ESCOs, and the rest went to improve or establish electricity projects, particularly in hydroelectric, geothermal, and gas generation.
• The Inter-American Development Group (IDB) serves Latin America and the Caribbean.
Overall, out of its $6 billion total lending in 1997, the IDB loaned $1 billion for energy-sector projects. The IDB has recently created the “Sustainable Markets for Sustainable Energy Program” to improve energy efficiency in industry, urban transportation, and rural areas and encourage the use of renewables.
The United Nations (UN)
Within the United Nations, three major organizations are involved in creating and carrying out energy programs and initiatives: the United Nations Development Program (UNDP), the United Nations Environment Program (UNEP), and the GEF (see above). In addition, several UN agencies exist for specific energy resources, e.g., the IAEA for nuclear issues (see above), and a host of other UN agencies and programs also support initiatives ranging from energy-policy creation and management to direct funding of programs. Between 1974 and 1994, UNDP alone invested a total of $412 million in 916 energy-sector projects, a majority of them located in Latin America and Asia. About a third involved energy planning, another third involved projects in the oil, natural gas, or electricity sectors, and the remainder was divided among projects in energy efficiency, coal, renewables and nuclear energy. UNDP established a separate energy account in 1980 to focus on funding of renewable energy to meet the energy needs of rural communities. UNEP also carries out other energy-related programs, for example promoting the dissemination of information on energy-efficient technologies. The World Bank Group The World Bank provides about $20 billion a year to developing and transition countries, mostly in the form of loans. Because of the increases in energy consumption, mainly in transportation and industrial sectors, associated with economic growth, energy has been an integral part of the World Bank’s work in development. The World Bank assists developing countries in undertaking energy projects using instruments such as loans, credits, guarantees, technical assistance, and equity participation—about 7 percent of its total annual lending is devoted to “electric power and energy”, almost all of which has traditionally been devoted to large-scale fossil fuel and hydro-electricity projects.

CHAPTER 2: The International Landscape of ERD3
2-25
Although the majority of the World Bank’s current and past energy projects have promoted conventional energy sources that add to global air pollution and greenhouse-gas emissions, it also participates in efficiency and renewables initiatives, such as: the Global Environment Facility (see above); the Energy Sector Management Assistance Program (a joint undertaking with UNDP and bilateral donors to provide technical assistance in energy sector reform, energy efficiency, and renewable energy, among others); and the Asia Alternative Energy Program (an effort that aims to identify and implement commercially viable energy efficiency and renewable projects, which is currently responsible for over $1 billion worth of projects in 12 Asian countries). The International Finance Corporation (IFC) is the “private sector” arm of the World Bank, which takes equity and debt positions in private firms for development purposes. It has inaugurated projects for efficient lighting in Poland, and, with the GEF, has created or is trying to create several funds to be implemented by a financial intermediary. For instance, a proposed “Renewable Energy and Energy Efficiency Fund,” with a $30 million investment, will be matched with $210 million of private equity. The fund will be managed by a private firm and will operate as a for-profit organization, but will be confined to investing in renewable- energy and energy-efficiency projects, preferably with financial needs below $30 million (see Box 3.5 for examples of other programs). CONCLUSIONS A number of themes emerge from the survey of the international ERD3 landscape presented in this chapter. First, and most obvious, is the sheer diversity of participants who play a role in ERD3 efforts, including public, private, intergovernmental, and non-governmental institutions active in the research, development, demonstration, and deployment of energy technologies in developed and developing countries. With activities being carried out at many scales and in many different locations, an enormous potential exists for international collaborations to enhance the effectiveness and efficiency of the global ERD3 enterprise. Second is the recognition that the private sector has become the dominant channel for the global deployment and commercialization of energy technologies. Yet, despite the worldwide wave of privatizations in the energy sector, and the realization that only private capital can provide the hundreds of billions of dollars that will need to be spent every year on energy technologies if the rapid global growth in demand for energy services is to be met, the private sector alone cannot do everything. For example, as described earlier in this chapter, market pressures are forcing firms in many energy industries to scale back their long-term R&D, concentrating instead on the deployment and commercialization of technologies that can rapidly yield an advantage in the increasingly competitive global marketplace. Important roles still exist for governments and other institutions, although it is not clear that these players have fully adapted to the realities of the new ERD3 landscape. Finally, it has become increasingly apparent to the Panel in the course of reviewing global ERD3 activities that there are many currently under exploited opportunities for the United States government to bolster international cooperation in energy innovation in ways that would greatly benefit its own citizens and the world as a whole. These opportunities and the specific actions that the Federal government should take in order to take advantage of them are presented in the remainder of this report.

2-26
Table 2.1: Representative Federal Agency Roles in International ERD3
Focus
Information Exchange
Insurance, Financing or Loan Guarantees
Trade Promotion
Training
Policy
Technology Role
U.S. Agency for Interna-tional Develop-ment (USAID)
Develop-ment assistance
Disseminates technology information in over 80 countries.
USAID is the principal U.S. foreign assistance agency, funding energy, industrial and infrastructure projects overseas.
Funds pre-feasibility studies and demonstration projects, which frequently result in orders for advanced energy technologies.
Supports training to build human and institutional capacity in ERD3, energy and industrial policy, and technical skills.
USAID places considerable emphasis on institutional reform, particularly energy sector and regulatory reform.
Funds technology demonstrations and engages the private sector in partnerships that can promote energy-technology deployment
Committee on Energy Efficiency Commerce and Trade (COEECT)
Trade Coordinates activities of Federal Agencies involved in promoting exports of energy-efficiency technologies.
Committee on Renewable Energy Commerce and Trade (CORECT)
Trade Coordinated the activities of Federal agencies involved in promoting exports of renewable energy technologies. Funding zeroed out for FY 1999, none requested FY2000.
Department of Commerce (DOC)
Trade promotion and information
DOC is the agency with principal responsibility for gathering and disseminating data on trade. NIST provides information and access to U.S. and international standards
Supports a broad range of energy-technology trade activities, including overseas missions and in-country specialists through the U.S. & Foreign Commercial Service. DOC supports feasibility studies, promotes U.S. businesses abroad, and hosts the Trade Information Center.
Sponsors training and exchange in science and technology fields.
Helps represent U.S. private-sector energy companies and technology providers in bilateral and multilateral standards development, and environmental and trade negotiations.
DOC’s National Institute for Standards and Technology (NIST) provides a venue for scientists and engineers to collaborate internationally, and the Advanced Technology Program cost-shares with industry high-risk technology development.
Department of Energy (DOE)
R&D DOE exchanges information with bi- and multilateral partners on basic research, processes, technology performance, and energy systems analysis.
DOE technical assistance helps reduce risk for the private sector.
Provides technical assistance, feasibility studies, and technology demonstrations. Supports trade missions.
Training and exchanges to advance research on fundamental processes, technology development, demonstration, and implementation of energy technologies. DOE trains U.S. and foreign scientists and researchers.
Provides technical support and assistance in energy policy and regulation overseas, helping to shape patterns of global energy supplies and technology choices.
DOE is the principal energy technology RD3 agency. Its role includes basic, long-term, and applied R&D, demonstration, and deployment.

2-27
Focus
Information Exchange
Insurance, Financing or Loan Guarantees
Trade Promotion
Training
Policy
Technology Role
U.S. Export-Import Bank
Trade financing
Provides export-credit support through loan guarantees, insurance, direct loans, and grants to U.S. firms engaged in export of energy goods and services.
Offsets tied-aid from other governments to level the playing field for U.S. firms.
Department of the Interior
Natural resource manage-ment
DOI exchanges information on energy resource management.
Provides information about energy resources and promotes private-sector investment in resource development
Interior Dept. supports RD3 of technologies for prospecting and extraction of energy resources.
Department of State
Internat’l relations and policy
Provides framework for info exchange.
Supports U.S. trade promotion
Plays central role in formulation of policy.
Department of Treasury
Finance and trade
Provides guidance to multilateral development banks.
Oversees U.S. monetary and related policy.
Environ-mental Protection Agency (EPA)
Environ-mental protection
EPA participates in information exchange about technology performance, especially for the adoption of codes and standards.
EPA can identify early opportunities for trade development, particularly in areas such as air quality. Efforts to date include encouraging energy-efficient building technologies, sustainable sources of energy, and greenhouse-gas-mitigation analysis.
Supports international collaboration and technical training to address global and cross-boarder environmental risks.
Provides technical support for international environmental negotiations. Consults with foreign governments on environmental policy and regulatory issues. EPA experience with voluntary programs could be useful overseas.
EPA has had a limited international role in collaborative energy technology R&D — its efforts focus on the demonstration and deployment of technologies to promote its core mission.
National Science Foundation
R&D Funds overseas exchange of research, scientists and engineers.
Promotes partnerships between U.S. scientists and their foreign colleagues.
Provides support for analytical work carried out under IIASA, such as the WEC scenarios described in Chapter 1.
Funds joint research between U.S. /foreign scientists/ engineers in basic and early applied R&D. Helps ensure U.S. involvement in advanced research worldwide.
Nuclear Regulatory Commission
Nuclear material control and safety
Participates in worldwide information exchanges on ERD3 and reactor operations.
Provides training in regulatory approaches, plant safety, material safeguarding, waste management, and facilities decommissioning.
Advises countries on regulatory methods and standards and licensing.
Supports cooperative efforts resulting in the purchase of equipment.

2-28
Focus
Information Exchange
Insurance, Financing or Loan Guarantees
Trade Promotion
Training
Policy
Technology Role
Overseas Private Investment Corpor-ation
Political insurance for trade
Provides political-risk insurance against currency inconvertibility, political instability, and expropriation, as well as loans and loan guarantees.
Supports American firms involved in power generation.
Small Business Administra-tion
Trade finance
Provides financial support to small business to expand export sales.
U.S Trade and Develop-ment Agency
Project feasibility studies
Focuses on providing grants for feasibility studies and reverse trade missions.
Helps to identify areas in which technical training, workshops, and assistance may help influence project success.
U.S. Trade Representa-tive
Trade policy
Supports U.S. export efforts.
Oversees U.S. trade policy.
CHAPTER 2: The International Landscape of ERD3
2-29
REFERENCES Bijur 1998: P. Bijur, “It Is A Dark And Stormy Night . . .,” FT Energy Economist (October 1998). CoC 1998: Council on Competitiveness, Going Global: The New Shape of American Innovation (Washington, DC: Council on Competitiveness, September 1998). de Sa 1999: P. de Sa, “The Changing Landscape of Energy-Technology Development and Commercialization,” forthcoming paper (Cambridge, MA: Belfer Center for Science and International Affairs, 1999). Dean 1999: Stephen Dean, Lessons Drawn from ITER and Other International Fusion Collaborations, Paper prepared for the PCAST Panel on International Cooperation in Energy RD3 (February 1999). DOE 1998: U.S. Department of Energy, Comprehensive National Energy Strategy (Washington, DC: DOE, 1998). Dooley 1997: J. Dooley, “U.S. National Investments in Energy R&D: 1974-1996,” Report PNNL-1 1788 (Washington, DC: Pacific Northwest Laboratory, December 1997). Dooley 1999: J. Dooley, “Japanese Energy R&D,” forthcoming paper (Washington, DC: Pacific Northwest Laboratory, 1999). Dooley and Runci 1999: J. Dooley and P. Runci, Adopting a Long View to Energy R&D and Global Climate Change. Paper prepared for the PCAST Panel on International Cooperation in Energy RD3 (February 1999). EIA 1996: Energy Information Administration, U.S. Department of Energy, Privatization and the Globalization of Energy Markets (Washington, DC: EIA, October 1996). EIA 1998a: Energy Information Administration, U.S. Department of Energy, Country Analysis Brief: Brazil (Washington, DC: EIA, October 1998). EIA 1998b: Energy Information Administration, U.S. Department of Energy, Country Analysis Brief: India (Washington, DC: EIA, July 1998). Ex-Im 1998: Export-Import Bank, Export (Washington, DC: Ex-Im Bank, 1998). GAO 1996: U.S. General Accounting Office, Federal Research: Changes in Electricity-Related R&D Funding (Washington, DC: U.S. General Accounting Office, 1996). GRI 1998: Gas Research Institute, 1999 to 2003 Plan Research & Development: 1999 Program (Chicago: GRI, April 1998). Holdren and Pachauri 1992: John P. Holdren and R. Pachauri, “Energy,” in International Council of Scientific Unions: An Agenda of Science for Environment and Development into the 21st Century (Cambridge, U.K.: Cambridge University Press, 1992), pp. 103-118. IEA 1998: International Energy Agency, Review of IEA Implementing Agreements (1995-1998) [DRAFT], Report IEA/CERT (48)98 (Paris: IEA, October 9, 1998).
Powerful Partnerships
2-30
IERE 1997: The International Electric Research Exchange, IERE 22nd General Meeting Proceedings (San Francisco: IERE, 1997). Logan 1999: Jeffrey Logan, “China Initiates Three-Year Ban on New Power Plants,” China Energy Efficiency Information Bulletin, Vol. 5, No. 2 (February, 1999). Machado 1997: I.C. Machado, “Greenhouse Gas Emissions and Bio-Ethanol Production/Utilization in Brazil,” in S.K. Ribeiro and L.P. Rosa, eds., South-South North Partnership on Climate Change and Greenhouse Gas Emissions (Rio de Janeiro: Federal University of Rio de Janeiro, November 1997). Mathews 1997: Jessica Mathews, “Power Shift,” Foreign Affairs, Vol. 76, No. 1 (January/February 1997), pp. 50-66. McWilliams 1997: Gary McWilliams, “Technology is What’s Driving This Business,” Business Week (November 3, 1997), pp. 146-148. Morgan and Tierney 1998: M.G. Morgan and S.F. Tierney, “Research Support for the Power Industry,” Issues in Science and Technology (Fall 1998), pp. 81-87. NSB 1998: National Science Board, Science & Engineering Indicators—1998 (Arlington, VA: National Science Foundation, 1998). PCAST 1997: The President’s Committee of Advisors on Science and Technology, Federal Energy Research and Development for the Challenges of the Twenty-First Century (Washington, DC: Office of Science and Technology Policy, November 1997). Runci 1999: Paul Runci, “Energy R&D in Germany,” forthcoming paper (Washington, DC: Pacific Northwest Laboratory, 1999). Santayana 1954: George Santayana, "Reason in Society," in The Life of Reason (New York: Charles Scribner and Sons, 1954). Seabright 1998: Jefferson Seabright, Presentation to PCAST Panel on International Cooperation in Energy RD3 (November 20, 1998). Siegel and Rackstraw 1999: J. Siegel and K. Rackstraw, U.S. Renewable Energy Experience in the International Marketplace, Paper prepared for the PCAST Panel on International Cooperation in Energy RD3 (February 1999). Stanislaw 1999: Joseph Stanislaw, President, Cambridge Energy Research Associates, quoted in “Low Oil Prices Force Industry to Recreate Itself,” Gas Daily (February 9, 1999). Taylor 1999: J. Taylor, International Cooperation on Energy Research, Development, Demonstration, and Deployment (RD3) for Nuclear Power, Paper prepared for the PCAST Panel on International Cooperation in Energy RD3 (February 1999). TDA 1998a: U.S. Trade and Development Agency, TDA Brief: Promoting U.S. Technology in Power and Energy (Arlington, Virginia: TDA, September 1998).

CHAPTER 2: The International Landscape of ERD3
2-31
TDA 1998b: U.S. Trade and Development Agency, TDA Brief: Improving the Environment through U.S. Energy Technology (Arlington, VA: TDA, November 1998). TERI 1998: Tata Energy Research Institute, Energy Data Directory and Yearbook 1998/99 (New Delhi: TERI, 1998). Tirpak (1999): Merideth Tirpak, Information for Energy Policy Makers: Working Effectively with NGOs, Policy Analysis Exercise, Harvard University, John F. Kennedy School of Government, April 6, 1999. USAID 1997: Office of Energy, Environment, and Technology, Global Bureau, U.S. Agency for International Development, The Energy Efficiency Market in Developing Countries: Trends and Policy Implications (Washington, DC: USAID, 1997). USAID 1998: U.S. Agency for International Development, Climate Change Initiative 1998-2002 (Washington, DC: USAID, 1998). USDOE 1999: U.S. Department of Energy, Office of Fossil Energy briefings before the PCAST Panel on International Cooperation in Energy RD3 (November 1998 & January 1999). USEA (1998): U.S. Energy Association, Energy Partnership Programs for Asia, Africa, and Latin America (Washington, DC: USEA, 1998). WEPG 1999: Washington Energy Policy Group, 1999 Biannual Energy Report (Olympia, WA: WEPG, February, 1999). Witcher 1999: Daniel Witcher, Jr., The Experience of the U.S. ESCO Industry in the International Market, Paper prepared for the PCAST Panel on International Cooperation in Energy RD3 (February 1999). World Bank 1997: The World Bank, Clear Water, Blue Skies: China’s Environment in the New Century (Washington, DC: 1997).

3-1
CHAPTER 3 FOUNDATIONS OF INTERNATIONAL COOPERATION
ON ENERGY INNOVATION
In industrialized and developing countries, regulatory frameworks should be directed at safeguarding competition and the consumer interest. Regulators should also provide a framework that encourages the main actors to take account of the longer-term vision required for sustainable energy provision and use. World Energy Council Statement 19991
hapter 1 described the U.S. interests and values at stake in energy-technology innovation and international cooperation with respect to it; Chapter 2 described the array of international ERD3 activities now underway in the public and private sectors alike. Between these lies a significant
gap of under-addressed challenges and under-exploited energy technology and policy opportunities. The remainder of this report is devoted to actions that the U.S. government could take—partly independently but mainly in concert with other governments, with multilateral organizations, and with the private sector—to narrow that gap in the years and decades immediately ahead. We divide the measures that could be taken into four categories. The first category, treated in this chapter, addresses shortcomings in what we call the foundations of international cooperation on energy innovation. By this we mean the fundamental capacities—in the United States, in potential partner countries, and in international organizations linking these—for organizing, funding, conducting, and evaluating activities all along the ERD3 “pipeline”: energy R&D; demonstrations of potentially commercializable technologies that emerge from this R&D; cost buy-down of demonstrated technologies along the "learning curve" that relates cost to cumulative production; and measures to shape the environment for commercial deployment of innovative technologiesincreasing incentives, lowering barriers (especially in relation to finance), and setting appropriate standardsto reflect their public benefits.2
We are concerned in this chapter, then, with generic measures to strengthen, within and among countries, the capacities to carry out and cooperate on activities all along the ERD3 pipeline—including not just research and development but also demonstration, cost buy-down, and commercial deployment—
1 WEC (1998) 2 While the core of our focus in this report is on international cooperation related to these activities, that focus
cannot be entirely separated from evaluations of and attempts to strengthen the relevant U.S. and foreign domestic ERD3 capacities as both a basis and a focus for international cooperative efforts. The previous PCAST energy R&D study (PCAST 1997) addressed in great detail the status of U.S. domestic energy R&D capabilities and how to strengthen these (with lesser emphasis on demonstration and deployment). We do not attempt to summarize those earlier findings in any comprehensive way here, but we do refer to them from time to time, and we hope that readers of this report will read at least the Executive Summary of that earlier report.

Powerful Partnerships
3-2
and cutting across all categories of energy-supply and energy-end-use technologies. Opportunities for cooperation that focus on specific energy-end-use and energy-supply technologies are discussed in Chapters 4 and 5, respectively, and improvements in the practices and institutional arrangements through which the United States government manages and coordinates its international ERD3 activities are treated in Chapter 6. Our treatment of the foundations of international ERD3 cooperation in the rest of this chapter begins with a discussion of the weaknesses in the various parts of the ERD3 pipeline around the world and the ways these weaknesses are being accentuated, to some extent, by trends in the public and private sides of the energy sector and in public-private interactions. We then turn to recommendations aimed at addressing these weaknesses through initiatives in three categories: building basic capacity for ERD3, shaping energy-sector reform to address the full range of society’s interests in it, and strengthening the financing mechanisms available for the deployment of high-public-benefit energy options.
TRENDS AFFECTING THE ERD3 PIPELINE
Energy is fundamental to the functioning of a modern economy, and, accordingly, building this sector has been a central focus of all countries during their economic development. Energy-supply systems have historically been very large in order to achieve economies of scale, involving immense capital investments. The energy system, including both energy conversion (e.g., electricity generation) and the transmission and distribution networks of “pipes and wires,” has been regarded as having the characteristics of a “natural monopoly” that requires huge infrastructure investments—the duplication of which would be economically inefficient. This consideration led to state-owned, -operated, and/or -regulated energy-supply systems in order to control or guide the development of this sector, assist the mobilization of capital for these huge projects, and thereby encourage economic development. The natural monopoly character of the system provided the basis for a social contract between the energy supplier and energy consumers. In exchange for granting the supplier (a regulated private company or a state-owned enterprise) the exclusive right to provide energy, the supplier would be obligated to provide certain public benefits that the free market would not otherwise provide. Notable among these public benefits were the “obligation to serve” all customers with reliable supplies of energy, and, recently in a number of countries, also the provision of services aimed at overcoming institutional barriers to cost-effective investments in energy-efficiency improvement on consumers’ premises or that take into account environmental externalities.
Recently, however, industrialized and developing countries alike have begun to “restructure” their energy sectors to encourage privatization and competition. In the industrialized countries this restructuring has been driven to a considerable extent by technological developments that have undermined some of the natural monopoly features of the energy system. In particular, electricity generation is no longer regarded as a natural monopoly (although “pipes and wires” networks still have this feature). Advances in gas turbine, fuel cell, and various renewable energy technologies have made it possible to generate electricity cost effectively with low levels of pollution over a wide range of scales and configurations. This includes generation at sites at or very near customers’ premises, where operation in combined heat and power modes becomes especially attractive. Complementing these technological advances has been a growing recognition that natural gas is a much more abundant energy resource than was thought to be the case in decades past. This observation is closely related to the new technological opportunities for energy conversion in that many of the recent technological advances that undermine the natural monopoly concept for power generation are best exploited using natural gas fuel. These new technological opportunities in turn have led to demands by manufacturers and other energy consumers for institutional reforms (e.g., deregulation of electric generation and natural gas price deregulation) to exploit these new technological opportunities so as to reduce prices, improving the efficiency of the economy.

CHAPTER 3: Foundations of International Cooperation
3-3
In developing countries the reform process has been driven by the need to address some of the difficulties and inefficiencies that have emerged in their publicly run energy systems, including:3
• heavily subsidized energy prices, implemented to aid the poor and encourage development in
agriculture and key industries, but also often driven by short-term political considerations over long-term economic consequences;
• institutional and political biases for large, highly visible projects, both domestically and through
multilateral development banks, which tended to emphasize “development now, environmental protection later”;
• tariff and non-tariff barriers used to favor in-country technologies, which have resulted in more
expensive, more polluting, and less capable energy systems.
Because of various subsidies, excess staffing, weak managerial and technical performance,
ineffective revenue collection methods, and other factors, the energy sectors of many countries have generated large budget deficits. By the late 1980s, average electricity tariffs across developing countries were 45 percent below the OECD weighted average, and electricity prices in Latin American and the Caribbean, in particular, averaged only about 70 percent of long-run marginal costs.4
At the same time, bilateral concessionary financing has sometimes distorted markets and promoted technologies on behalf of the donor’s domestic industry. Multilateral lending institutions have favored large-scale conventional energy projects over smaller-scale clean energy-technology projects because of the lower transaction costs of large projects; the perceived lower risks of standardized large projects; and the corresponding fiduciary responsibilities of the MDBs to protect their client countries’ interests.
Entering the 1990s developing countries faced the prospect of financing a $1 trillion expansion of their power generation systems by the turn of the century, with little prospect that this would be feasible under business-as-usual conditions. With little or no retained earnings, their energy companies have typically been wholly dependent on outside sources for financing energy projects. Their poor financial performance has made it exceedingly difficult for them to raise capital from commercial sources. Historically, their governments, motivated by the conviction that energy supply expansion, particularly electricity supply expansion, is key to economic growth, would raise the needed capital for “infrastructure development” purposes. But in recent years many of these governments have faced severe fiscal constraints that have made it impossible for them to continue to “bail out” their energy companies.
These factors have placed enormous financial and institutional stress on public sector energy
institutions that are now leading to substantial restructuring and reform of energy sectors around the world, with a strong shift to commercial terms and private markets. For example, many developing countries began a process of “opening up” their power sectors, with privatization of power companies
3 Many countries, for instance, have used State Energy Boards to develop their energy sectors. These Boards
allowed the state to, among other things: (a) conduct centralized energy planning and exercise regulatory control—an important function given other institutional and private-sector weaknesses; (b) mobilize capital, in part through provision of sovereign guarantees—an often unavoidable response to the weakness of domestic capital markets and international perceptions of political and economic risks; and (c) exercise important negotiating power. In the past, such public control of energy systems was warranted, but the historical rationale for public-sector control is now eroding in most countries.
4 Schramm (1993).

Powerful Partnerships
3-4
and, increasingly, elements of competition as well in electricity markets. Energy-sector reforms are helping make the sector more efficient and more responsive to economic needs and are making energy markets in developing countries more attractive business opportunities for foreign investors.
The technological revolution that has driven energy-sector reforms in the industrialized countries
is of direct relevance to this situation in developing countries. For example, the technologies that make it feasible to provide competitive power at smaller scales also reduce the need for state-mobilized capital and make possible the market entry of more private-sector entities.
In many respects, ongoing activities in the energy sector mirror broader economic reform—with
greater reliance on markets and the private sector—that is occurring in much of the world and contributing to rapid economic growth. Many developing countries have been enacting national economic and trade reforms and opening up their markets to promote economic growth.
One possible unintended consequence of energy-sector economic reform is to disable many
traditional mechanisms for addressing public concerns, including support for energy RD3, strengthening energy security, ensuring equity, and reducing environmental impacts.
Low and declining levels of RD3 (Chapter 2) and the public/private barriers to energy-technology innovation pose substantial difficulties for the RD3 of innovative energy technologies essential for meeting the global energy-linked challenges described in Chapter 1. Because of the dramatic change in the basic structure of the energy sector—driven in part by technological advanceit is not reasonable to expect traditional forms of achieving public goals to work nearly as effectively, if at all, as they have in the past. New forms of public-private partnerships are needed to harness market forces and mobilize private capital for rapid energy-technology innovation along the full spectrum of the RD3 value chain. STRENGTHENING THE ELEMENTS OF THE ERD3 PIPELINE The elements of the energy-technology innovation pipeline5 include research, development demonstration, “buying down” the costs of innovative energy technologies along their learning curves, and widespread deployment. These steps are tightly interconnected: R&D leads to innovative technologies for demonstration and deployment, while lessons from demonstration and deployment propagate backwards in the pipeline to guide targeted basic research and applied energy-technology R&D.6 These steps, moreover, entail not only technical but also financial and institutional dimensions. The financial dimension entails a web of public and private investment, with changes in level and form at each stage of the RD3 process, including even, for small- to medium-scale technologies, the availability of retail finance to facilitate end-user purchase of the technology. Institutionally, the pipeline involves public and private research laboratories, public-private technology demonstrations, mechanisms for publicly assisted buy-down of costs of innovative-technologies manufactured by the private sector, and a variety of other arrangements.
5 The “pipeline” metaphor is used here to simplify the discussion of policy mechanisms and of agency and
institutional roles, but we emphasize that the actual RD3 process is much more complex. As noted in PCAST 1997, “With globalization and increased competition, ever shorter product cycles, and increasingly sophisticated technology, this model no longer works well and can even be seriously counterproductive. Rather than a pipeline, a more realistic image today might be a complex tapestry, with the various stages—basic science, applied research, development, demonstration, commercialization—all strongly entangled and inseparable throughout the process. R&D today is a dynamic process with extensive interactions among all stages.” [See pages 7-14 to 7-20 of PCAST (1997)].
6 PCAST (1997).

CHAPTER 3: Foundations of International Cooperation
3-5
For every technology and every geographic and economic setting, careful consideration must be
given to the design of the combination of technical, financial, and institutional mechanisms that will ensure, at each step of the energy RD3 pipeline, the most effective use of public and private funds, the least possible public and private exposure to risk, the best use of competition to quickly drive costs down and performance up, the greatest transparency and smallest transaction costs, and the most effective public- and private-sector coordination as a technology moves through the pipeline. We turn now to some of the specific factors that must be taken into account at the different steps of that pipeline. Research and Development
For a variety of reasons, the private sector under-invests in energy R&D relative to the public benefits that could be realized from such investments. This includes their inability to appropriate the full benefits of their investments, the long term and/or high risk of the investments, and the low return on investments that address externalities such as air pollution that are not costed in the market (see Chapter 1 and the PCAST 1997 energy R&D report). Consequently, it has long been recognized that the public sector has a vital role to play in supporting R&D, and it should continue to play this roleobviously with increasing private-sector participation as a technology moves towards a potentially marketable application or product. In the United States, the Department of Energy has been the principal public sponsor of energy R&D, with some support from the Environmental Protection Agency and others. A variety of mechanisms are used to encourage partnerships with the private sector within the United States (including, for instance, Cooperative Research and Development Agreements).
The increasingly global character of the innovation environment makes it difficult even for
nations to fully capture the benefits of investing in R&D. This impediment—on top of difficult budgetary constraints and a lack of appreciation for the importance of technological innovation for meeting the challenges—reduces the national incentive to invest in R&D. International cooperative R&D efforts can address this problem by sharing costs and risks and by exploiting comparative advantages in innovation capacity, while minimizing competitive problems to some extent by virtue of the distance between R&D and commercial deployment. At the same time, the added complexity of cooperative efforts must be considered and kept to a minimum. Demonstration
The demonstration phase typically consists of building one or more energy-technology manufacturing or energy production/use facilities of increasing scale to prove the technical and potential commercial viability of the technology. The private sector faces substantial difficulties in conducting such demonstrations. The time horizons for returns, although shorter than for R&D, are often still too long; the risks are—or are perceived to be—too high; the capital requirements can be large and sufficient capital thus difficult to obtain; the improved energy technologies may receive little or no return for reducing emissions or other externalities; and the pilot plants and even full-size first-of-a-kind commercial demonstration facilities typically cannot compete against low-margin energy commodities provided by conventional energy technologies. These difficulties can be likened to rolling an increasingly heavy boulder up-hill (see below). Thus, public support for demonstration is warranted as a means of realizing the public benefits associated with new, clean, and efficient energy technologies.
In the United States, public support for demonstration has been principally provided through
DOE by several different measures, with varying success. Internationally, U.S. government support for overseas demonstrations may be warranted in cases where domestic demonstrations cannot sufficiently test technologies against the conditions that characterize overseas markets, or where there is little or no domestic market for the technology. The U.S. government could support overseas demonstrations by
Powerful Partnerships
3-6
providing technical and/or other assistance to help establish demonstration support facilities in nations undergoing energy-sector restructuring and to assist the activities of these facilities. Some promising public-private mechanisms are discussed in more detail in the section on energy-sector restructuring below. Buy-Down
Once a technology has been demonstrated at a potentially commercially viable scale, there remains a long process of building a series of such systems to scale up equipment manufacturing facilities and also to learn how to reduce manufacturing, system installation, and operations and maintenance costs to competitive levels.7 This process is described as driving costs down the “learning curve.”8 Many products, for instance, have costs that drop by 10-30 percent for every doubling of cumulative production.9 To move a new technology into the market, its higher initial costs relative to competing products must be covered. As cumulative production volume increases, costs will be reduced until some innovative technologies become fully competitive with conventional technologies. The process of paying for the difference between the cost (price)10 of a new technology and the cost of its competitors is known as early deployment “buy-down”—or simply buy-down—and is illustrated in Figures 3.1 and 3.2. The “triangular” area under the curve in Figure 3.1 indicates the “buy-down” cost to make the product commercially competitive. Small modular technologies produced in factories often exhibit particularly strong learning curve cost reductions and are thus good candidates for using buy-down strategies to lower their costs.
In some industries, such as the semiconductor industry, companies will often “forward price”—that is, initially sell the product below cost in order to increase rapidly the sales volume and drive the costs of the technology down its learning curve. This allows them to reduce costs faster than their competitors to gain market share. Because advanced semiconductors have greater capability than technologies of the previous generation, they also generally command higher prices, which reduces the manufacturers initial losses when they sell below cost to capture market volume.
Such forward pricing is more difficult in the energy sector. When the new technologies offer
environmental benefits not fully valued in market prices, firms are reluctant to bear the buy-down cost burden. Because energy manufacturers are competing to sell commodity energy into a highly competitive market, they cannot expect to capture higher values for next-generation energy technologies at market entry. There are few or no high-value niche markets to sell into in order to reduce the overall buy-down 7 It is important to note that economies of scale and economies of learning, as described below, are two distinct
phenomena. 8 The “learning curve” represents a subset of the broader “experience curve” phenomenon. The learning curve
describes economies that can be achieved at the level of the individual firm through organizational learning—such as improved management, workforce training and organization, and other variable aspects of the production process. The “experience curve” captures, in addition to organizational learning, industry-wide improvements as a result of R&D and technological advance, capital, and all other aspects of reducing product cost. “Learning curve” will be used here interchangeably with “experience curve” as it is the more familiar term, with the understanding that as used here “learning curve” encompasses the full range of potential improvements that can be realized through capital, labor, and technological advances.
9 Argote and Epple (1990) 10 Note that the reference here is to “costs” rather than “prices”. The intent is to drive “costs” down the learning
curve. In practice, only “prices” are observable and may vary in the short-term independently of cost. In particular, companies may forward price their product to more rapidly expand cumulative production and thereby more quickly drive underlying costs down the learning curve; such company efforts are desirable and should be encouraged in the overall buy-down process.
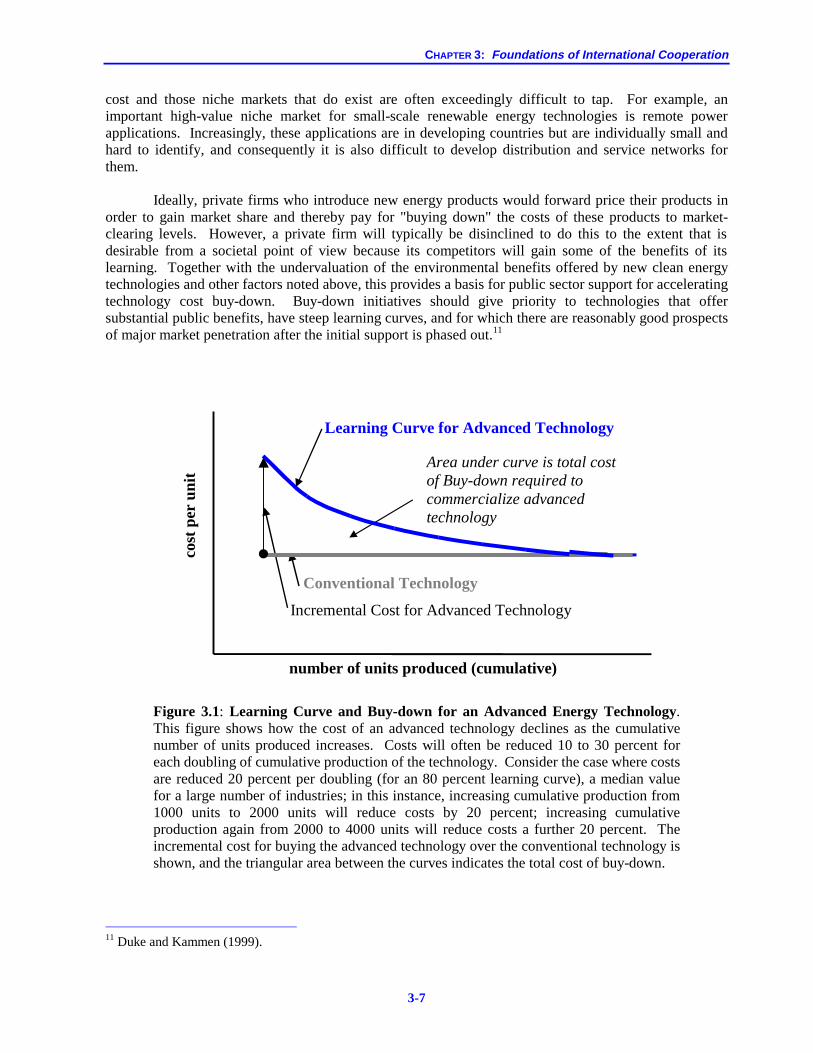
CHAPTER 3: Foundations of International Cooperation
3-7
cost and those niche markets that do exist are often exceedingly difficult to tap. For example, an important high-value niche market for small-scale renewable energy technologies is remote power applications. Increasingly, these applications are in developing countries but are individually small and hard to identify, and consequently it is also difficult to develop distribution and service networks for them.
Ideally, private firms who introduce new energy products would forward price their products in
order to gain market share and thereby pay for "buying down" the costs of these products to market-clearing levels. However, a private firm will typically be disinclined to do this to the extent that is desirable from a societal point of view because its competitors will gain some of the benefits of its learning. Together with the undervaluation of the environmental benefits offered by new clean energy technologies and other factors noted above, this provides a basis for public sector support for accelerating technology cost buy-down. Buy-down initiatives should give priority to technologies that offer substantial public benefits, have steep learning curves, and for which there are reasonably good prospects of major market penetration after the initial support is phased out.11
number of units produced (cumulative)
cost
per
uni
t
Area under curve is total costof Buy-down required tocommercialize advancedtechnology
Learning Curve for Advanced Technology
Conventional Technology
Incremental Cost for Advanced Technology
Figure 3.1: Learning Curve and Buy-down for an Advanced Energy Technology. This figure shows how the cost of an advanced technology declines as the cumulative number of units produced increases. Costs will often be reduced 10 to 30 percent for each doubling of cumulative production of the technology. Consider the case where costs are reduced 20 percent per doubling (for an 80 percent learning curve), a median value for a large number of industries; in this instance, increasing cumulative production from 1000 units to 2000 units will reduce costs by 20 percent; increasing cumulative production again from 2000 to 4000 units will reduce costs a further 20 percent. The incremental cost for buying the advanced technology over the conventional technology is shown, and the triangular area between the curves indicates the total cost of buy-down.
11 Duke and Kammen (1999).

Powerful Partnerships
3-8
The Global Environment Facility (GEF), created to help pay the incremental costs for technologies that offer significant global environmental benefits in developing countries (see Chapter 2), has a relatively new program with which it is beginning to gain experience with systematic technology cost "buy-down" strategies—e.g., through its Photovoltaics Market Transformation Initiative. The United States has strategic interests—both with respect to leverage against global economic, security, and environmental problems and with respect to private-sector access to overseas markets—to ensure that such mechanisms and institutions for buy-down are implemented more broadly and systematically in restructured markets. These mechanisms and institutions, and the role the United States could play in establishing them, are discussed in more detail below. Deployment
After a new technology has proceeded through the R&D, demonstration, and buy-down portions of the pipeline, it is ready for large-scale deployment. But even if the new technology then appears fully "cost-effective" on paper, typically there are still significant barriers to its widespread deployment. Barriers at this stage include: (a) convincing potential purchasers of the technology’s advantages and overcoming their concerns about its risks; (b) the need for feasibility studies; (c) building a distribution and service network; (d) providing adequate financing for prospective users (especially important for new technologies that are cost-effective on a lifecycle cost basis but cost more “up front” than the technologies that would be replaced); and (e) overcoming transaction costs that are high relative to the monetary value of the project (particularly important for new, small-scale technologies for which efficient product distribution and service networks are not in place).
Within the United States, a variety of agencies provide support aimed at overcoming some of
these problems for overseas deployment activities, including USAID, Department of Commerce, the Export-Import Bank, the Trade and Development Agency, and the Overseas Private Investment Corporation, and to a lesser extent the Department of Energy and Environmental Protection Agency (see Chapter 2). The deployment efforts of these agencies focus on supporting U.S. technology exports and supporting companies directly.
Especially daunting in developing countries has been the challenge of providing finance down to
the retail level, so that prospective users can get access to the credit that would enable them to purchase small-scale technologies. Institutions such as the World Bank prefer to move large loans to minimize their transaction costs and risks, and have done relatively little to support the provision of retail finance for small-scale and distributed projects. Nonprofits such as the Grameen Bank in Bangladesh have done a very effective job, but this model has proven difficult to widely deploy outside of Bangladesh; continued work to develop such mechanisms is very important. UPGRADING PUBLIC-SECTOR PERFORMANCE
Even when the energy sector has been restructured to encourage maximum participation by private industry in the RD3 pipeline, significant gaps remain that must be “bridged” by the public sector (Figure 3.2). Frequently, in the United States and elsewhere, these public-sector plugs have been haphazardly applied. Public-sector involvement is required to realize the full extent of the public goods that derive from energy innovations and avoid the full range of negative externalities caused by conventional energy technologies. Although the record of the public sector in helping to bring new technologies to market has been mixed (PCAST 97), the deficiencies in the record to this point are an argument for improving that participation, not eliminating it. Developing a suitably strengthened RD3

CHAPTER 3: Foundations of International Cooperation
3-9
pipeline will require initiatives based on public-private partnerships that have the following characteristics:12
• effective in quickly establishing reasonably large production and market demand levels for clean energy technologies, allowing companies to scale up production with some confidence that there will be a market in which to compete;
• efficient in driving down costs as cumulative production increases;
• minimally disruptive of existing energy-financial systems during the transition period;
• able—within available financial resources—to support a diversified portfolio of options;
• easily and transparently administered and requiring minimal administrative overheads; and
• temporary, with "sunset" provisions built into the commercialization incentive scheme ab initio, but long enough to catalyze the desired activity.
In addition, country partners in these activities should have the capacity and ability to assimilate
new technologies into their energy infrastructure. Relevant questions in this connection are:
• Is the host country’s energy sector positioned to select the most appropriate technologies and introduce them in cost-effective ways that will enable their diffusion by market mechanisms?
• Does the host country have in place or otherwise available to it funding mechanisms to allow it to participate in the RD3 process?
• Are the U.S. public and private sectors in the best position to leverage the opportunities to work cooperatively with various host countries?
The United States, as an international leader in promoting policies and practices that encourage
market forces, has an opportunity to work with other countries to craft initiatives that would encourage competition as an alternative to failed centralized planning, while maintaining and strengthening the protection of public benefits. Measures to protect such benefits have been built into government planned and/or regulated systems over past decades in response to demonstrated public needs. These have included measures to reduce environmental externalities, to provide services to the poor and disenfranchised, to provide portfolio diversity to reduce risk of energy supply disruptions, to support energy R&D, and to support demonstration and accelerated deployment activities for new energy-supply and end-use technologies with public benefits. Of particular interest here are measures that help support energy RD3 activities that address the multiple challenges posed by conventional energy systems (see Chapter 1).
A window of opportunity exists in the next few years, while countries are reforming their energy
sectors, to use the experiences of developing and industrial country leaders in energy-sector reform to promote market-oriented restructuring that makes provision for these public benefits. This must be done before other, less desirable, practices are locked into place and lock out public-benefit considerations. The United States, which is also undergoing these changes, can itself benefit from the lessons learned in other countries further along in this process.
12 PCAST (1997)

Powerful Partnerships
3-10
It is in the U.S. national interest to promote policies and practices that rely on competition, open
markets, and international partnerships. U.S. companies will benefit through greater access to emerging markets. Other countries will benefit from access to the highest performance, cleanest, lowest cost technologies available worldwide and to market competition that can improve overall system performance and that can lead to the reduction or elimination of state subsidies and energy-sector deficits. Those countries that become involved first are more likely to become regional leaders in developing and deploying these advanced energy technologies. Resulting collaborations will benefit from the technical and market strengths of the parties involved and the rigors of full market competition. Establishing mechanisms to accelerate the development and adoption of advanced clean energy technologies will benefit the environment and reduce cost and risk. Portfolio diversity can boost use of local resources and help reduce reliance on imported fossil fuels. These international partnerships offer win-win opportunities for all involved. In what follows we describe four sets of measures for strengthening the foundations of international energy RD3 cooperation, shaped by the motivations and criteria described above. We begin with measures to build basic capacity for energy RD3, because in some respects these measures underpin all the others. We then turn to measures for shaping energy-sector reform to address the full range of society’s interests in it and measures to facilitate demonstration and technology cost buy-down, and finally measures for strengthening the financing mechanisms available for the deployment of energy options that offer high public benefits.
Barriers
• Difficulty of capturingbenefits of R & D
• Long time horizons• High risks
• Difficulty of capturingbenefits of demonstration
• Long time horizons• Risks• Large capital costs
• Financing of incrementalcost
• Cost uncertainty• Technological and other
risk
• High transaction costs• Price for competing
technologies doesn’tinclude externalities;
• Lack of retail finance• Lack of information
Existing Participants, Institutions, and Mechanisms
DoEUSAID
U.S. Trade Agencies
GEFMDBs
Value Chain
Lab/Bench scale PilotsSmall
Medium
Commercial scale$/unit
MW/plant
# of units deployed
Research & Development Demonstration Buydown Widespread Deployment
Figure 3.2: The RD3 Value Chain and Pipeline. This figure illustrates the RD3 value chain, the process of scaling up demonstrations and then buying down the cost; the barriers to RD3, and the existing gaps in institutional coverage in the RD3 pipeline, particularly for demonstrations and buy-down. Shading indicates more vigorous activity by the relevant institution.
CHAPTER 3: Foundations of International Cooperation
3-11
CAPACITY BUILDING There is solid empirical evidence that market reform is not enough—individual and institutional capacity building are also essential to widespread deployment of clean, efficient energy technologies in developing and transition countries.13 Capacity building is needed to form and staff the public sector institutions and research institutes that are supporting energy-sector reform and sustainable energy development, as well as to staff the private companies that will produce, market, install, and service new clean energy technologies. All of these technology push efforts must be balanced with corresponding capacity building efforts on the market pull side—to identify user needs, raise awareness of means for meeting those needs, and train users in how to apply technologies effectively to meet those needs. Such work is necessarily region specific. It is also necessary to promote understanding of energy-economic-development interactions among policymakers. We therefore recommend below an initiative on building local capacity.
Developing and transition countries require multidisciplinary expertise and training in:14
• technology development, adaptation, and dissemination;
• monitoring and evaluation;
• the individual and institutional behaviors that promote or impede adoption of new energy technologies and energy-sector restructuring;
• approaches for educating end-users on the benefits of new energy technologies and how to effectively use them;
• design and introduction of financial mechanisms for dissemination of renewable and efficient technologies (e.g., microcredit, technology leasing, rent-to-own initiatives);
• the design and management of national or regional energy systems;
• assessing the impacts of energy and non-energy policies on regional and national energy systems; and
• understanding the intricacies of energy-environment-society interactions. There are many examples of valuable U.S. support for institutions and capacity building in the
sustainable energy area. National energy-efficiency and/or renewable energy centers and programs have been established in Argentina, Brazil, China, Eastern Europe, India, and Thailand, among others (see boxes 3.1 and 3.2). Almost 10,000 people from 94 countries have received training under USAID’s Energy and Environment Training Program over the past decade.15 Valuable capacity building and technology transfer programs also include the Energy Partnership Program, the Environmental Enterprise Assistance Fund, the U.S.-Asia Environmental Partnership, and the Technology Cooperation Agreement Pilot Project.16 But in various other cases U.S. assistance still tends to be too short in duration and
13 Chantramonklasri (1990) 14 Kammen (1999) 15 Jefferson Seabright, USAID, personal communication, April 1999. 16 U.S. Department of State (1999).

Powerful Partnerships
3-12
episodic, with insufficient attention given to long-term strategic efforts aimed at market development and transformation, development of regional capacity for training and education, and multidisciplinary understanding of energy-sector design within the constraints imposed by environmental and societal concerns.
Box 3.1: Brazil’s National Electricity Conservation Program
Brazil’s national electricity conservation program, PROCEL, promotes end-use electricity conservation as well as electricity transmission and distribution (T&D) loss reduction. PROCEL supports a wide range of projects in the areas of: R&D and demonstration; education and training; testing, labeling and standards; marketing and promotion; private sector support; and implementation projects with utilities, states, municipalities, and businesses.
PROCEL began in 1986. By 1996, PROCEL was spending about $10 million on its "core projects" and
facilitating about $40 million in low-interest loans for energy-efficiency projects (through an energy-efficiency financing program that PROCEL initiated). Core funding rose to nearly $20 million per year in 1997 and 1998, with about $100 million in low-interest loans for major projects approved each of these years.
PROCEL has had its biggest impact in the following areas: (a) increasing the energy-efficiency of
refrigerators and freezers through testing, labeling and voluntary agreements with manufacturers; (b) increasing the efficiency of motors through testing, labeling, and R&D projects; (c) increasing the market for energy-efficient lighting technologies such as compact fluorescent lamps; (d) increasing the energy-efficiency of street lighting and of fluorescent lamp ballasts; (e) reducing electricity waste in industry through audits, workshops and information dissemination; and (f) installation of meters in previously unmetered households. Overall, PROCEL’s cumulative efforts reduced electricity consumption and supply-side losses by about 2.4 TWh/yr in 1996 and 3.8 TWh/yr in 1997. The latter value is equivalent to about 1.3 percent of total electricity consumption in Brazil as of 1997.
The electricity savings already occurring in 1997 enabled utilities in Brazil to avoid constructing about 1,130 MW of new capacity, thus avoiding about $2.3 billion of investments in new power plants and T&D facilities. In contrast, PROCEL and its utility partners have spent about $170 million on energy-efficiency and power supply improvement projects during 1986-97. Thus, from the utility sector perspective, PROCEL has achieved an overall benefit-cost ratio of around 14:1.
U.S. energy-efficiency experts, with funding from USAID, DOE, and EPA, assisted PROCEL over the years in a number of areas including: • identification of energy-efficiency potential and analysis of cost effectiveness; • design of energy-efficiency projects and programs; • development and negotiation of testing, labeling and standards activities including voluntary agreements with
equipment manufacturers; • policy recommendations, some of which have been accepted and acted on (e.g., adoption of a "wires charge" to
fund utility energy-efficiency programs in the context of utility sector restructuring); • development and implementation of a methodology for evaluating PROCEL’s energy and peak demand savings;
and • conception and preparation of a $43 million energy-efficiency loan proposal to the World Bank and
complementary $20 million grant proposal to the Global Environment Facility.
In providing this support, U.S. experts worked closely with Brazilian partners, often under the leadership of these partners, in order to help build strong and effective energy-efficiency institutions and efforts in Brazil. A long-term commitment, focus on collaboration and capability building, and patience were key to the success of this program. Source: H. Geller et al. (1999).

CHAPTER 3: Foundations of International Cooperation
3-13
BOX 3.2: Energy-efficiency Centers in Eastern Europe, the Former Soviet Union, and China The centrally planned economies of Eastern Europe, the Soviet Union, and China wasted vast quantities of
energy at their peak. Recognizing that the transition away from central planning would be a critical time to address this problem, U.S. government and non-governmental agencies began creating energy-efficiency centers in these countries in 1990. Centers are now operating in 6 countries (Bulgaria, China, the Czech Republic, Poland, Russia, and Ukraine), helping to lower energy bills, and to reduce local pollutants and greenhouse gas emissions. These centers have helped stimulate a private sector business volume in energy-efficiency technology transfer valued at 10 to 20 times the total cost of the centers themselves.
The centers were provided with three years of core funding by EPA, USAID, DOE, the MacArthur and C.S. Mott Foundations, and the World Wildlife Fund and are staffed entirely by in-country experts. Each center was required to become self-financing after three years, which each has done through a combination of contracts and grants from their own governments and international organizations, including private businesses.
Each center provides four main services: (a) policy analysis for reform and efficiency; (b) business development through market conditioning and assistance to private firms; (c) training in finance and demonstrations of new technology; and (d) public education and outreach.
The centers help make energy-efficiency business possible. Many private firms complain that transition economies lack the legal, policy, and financial infrastructure that western markets enjoy—which have developed over many decades. Transferring energy-efficiency technology on a scale commensurate with regional and global needs requires market conditioning, including steps to reform prices, eliminate supply subsidies, privatize ownership of industry and homes, develop codes and standards for new buildings and equipment, and develop and package finance for major investment projects.
The centers have succeeded in policy and finance beyond most expectations. For example:
• New apartment buildings in six Russian cities, including Moscow, are now built according to standards written by CENEf, the Russian Center for Energy Efficiency.
• China is developing three energy service companies with a $200 million World Bank/GEF project, and is improving the quality of energy-efficient lighting with a $65 million Chinese government grant, thanks to BECon, the Beijing Energy Efficiency Center.
• Ukraine has invested $6 million in Kyiv government buildings and in private factories at Gostomel and Avdeevka to cut staggering energy costs, thanks to the help of Arena-Eco, the Ukrainian efficiency center. Arena-Eco has helped develop over $100 million in efficiency financing, which now awaits approval.
• Poland has implemented a utility reform law that ensures independent power producer access to the national grid, thanks to legislation drafted by FEWE, the Polish Foundation for Energy Efficiency.
• The Czech Republic has spent $500 million to switch from coal to gas to improve efficiency and reduce air pollution, with the help of SEVEn, the Czech Energy Efficiency Center.
• Bulgaria is participating in the Framework Convention on Climate Change, in part due to the analyses performed by EnEffect, the Bulgarian Center for Energy Efficiency.
Independent evaluation of the centers by the U.S. Congress Office of Technology Assessment was very
positive. One evaluation stated that "a strong assistance program can be a major element in helping Central and Eastern Europe through their present difficulties." Energy efficiency assistance will be beneficial for both the United States and the recipients regardless of political developments. "In particular, information programs such as the energy-efficiency centers, technical demonstrations, and training could be expanded".a
a OTA (1993)

Powerful Partnerships
3-14
A major barrier to improved design of energy development and deployment programs is the paucity of data on how "on the ground" individual or institutional behaviors impede or promote these programs, and how the design of future projects can take into account these behaviors in order to improve performance. Many energy projects have been carried out around the world; although there have been a number of reviews of these programs over time, there is still too little systematic external peer-reviewed monitoring, evaluation, and development of lessons learned.17 A few studies that begin to address this problem of under-reporting and analysis have recently appeared.18 We therefore propose two initiatives in this section, a "high priority initiative" on training and institution building and another important initiative on promoting interdisciplinary research. Together, these capacity building initiatives should be funded at $20 million per year in FY2001, increasing to $40 million per year in FY2005. These funds should be supplemental to existing budgets for international energy RD3 activities and to the budgets proposed in the 1997 PCAST study of domestic energy R&D programs. High Priority Initiative: Building Local Capacity
Goal Build local capacity in energy technology and policy RD3 in developing and transition countries.
U.S. Actions
(1) Increase support for existing regional centers for RD3 of sustainable energy options, and establish
new sustainable energy centers in regions with significant need that cannot be met by other means; and
(2) Expand existing and develop new training programs for energy analysts and managers, to include traveling workshops and internet-based courses and expert assistance, as well as require that in-country technical and managerial training be a component of NGO technology demonstration and deployment projects supported by the U.S. government. Elaboration
Training for both public and private sector staff engaged in advanced clean, efficient energy
technology RD3 activities might be carried out at regional training institutes for these purposes.19 This training would emphasize the fundamentals of the technology, technology assessment, and a wide range of skills required for effective technology management—including both technical skills and business skills relating to manufacturing, project development, marketing, and plant operation, among others. It would also address issues of energy system use—identifying potential user needs and training them in the effective application of technologies. A training institute might be organized to specialize in a particular
17 The reasons for this lack of peer-reviewed or widely available material are discussed in Kammen (1997) and
Kammen (1999). 18 See Smith et al. (1993) on improved stoves in China, Acker & Kammen (1996) and Kammen (1996) on
photovoltaics in Kenya, Byrne et al. (1998) on wind turbines in Inner Mongolia, and Karekezi and Turyareeba (1995) on improved stoves in East Africa..
19 STAP (1996)
CHAPTER 3: Foundations of International Cooperation
3-15
clean energy technology. Training institutes for prospective staff positions in companies that would produce, market, and install new clean energy technologies might be developed in close cooperation with such companies; these companies would ultimately be expected to help support these training institutes. Prospective trainees might be drawn from the community of applicants with good basic backgrounds in engineering and/or science who seek new careers relating to these areas but have little or no specialized skills. In addition, courses and training in broader issues of the impacts of non-energy policies on national energy systems, or of energy-economy-development interactions should be offered to local business or government leaders whose portfolios extend beyond energy to other economic, development, or environmental issues. In parallel, capacity building must be linked with real programs and projects and broader market transformation. The initiatives identified in energy efficiency and clean energy supply thus complement this initiative.
The U.S. government could support capacity building and training in transition and developing
countries through several different mechanisms:
• increased support 20 of existing advanced energy-technology centers such as PROCEL in Brazil (Box 3.1), energy-efficiency centers in Eastern Europe and Russia (Box 3.2), and others in Africa, Asia, and Latin America;
• establishment of new sustainable energy centers21 in regions where there is significant need that can not be met by other means (with costs to be shared with the host country or region, other OECD nations, and multilateral or regional development banks);
• required in-country technical and managerial training as a component of grants or financing awarded to NGOs for activities directly supporting or facilitating technology demonstration or deployment;
• development of traveling intensive workshops and internet-based courses and expert assistance, spanning the full range of topics listed above (including a “train-the-trainer” component so that additional courses can be offered by in-country or in-region personnel).
Anther Important Initiative: Interdisciplinary Research
Goals:
To support interdisciplinary research on technology and policy development and transfer in order
to monitor/evaluate projects, increase knowledge of how "on the ground" dynamics work, improve design of the technology transfer process, and strengthen understanding of policy and institutional change.
U.S. Actions
Support cooperative interdisciplinary research to independently monitor/evaluate and to improve understanding of the dynamics of success/failure in innovative energy-sector technology and policy programs.
Elaboration
20 Such support might be provided on a competitive, peer-reviewed basis in most cases, just as U.S. research and
development institutes compete for funding. 21 As above, such centers might be established on a competitive, peer-reviewed basis.
Powerful Partnerships
3-16
Relatively small grants provided by U.S. agencies on a peer-reviewed competitive basis could be
used to support collaborative technology-transfer studies; these studies should be characterized by detailed field work and rigorous qualitative and quantitative analysis. These grants could serve as annexes to existing U.S.-Government-, World-Bank-, GEF-, or UNDP-funded technology transfer, demonstration, or deployment projects. Researchers must, however, be independent of the practitioners involved in advanced clean energy-technology RD3. Additional requirements might include: multidisciplinary research teams that include researchers from both developed and developing nations; a competitive peer-reviewed application process detailing the research; explicit requirements for providing the lessons learned from the research in a constructive fashion to the groups or individuals being studied as well as to others doing related projects; and the publication of report(s) and peer-reviewed journal article(s).22 SHAPING ENERGY SECTOR REFORM Background Industrial countries undergoing energy-sector reform in the 1990s have generally focused on various combinations of privatization, unbundling, and competition.23 Similarly, developing nations have typically pursued four types of reform, often implemented as a package in the following sequence:24
• Commercialization. Under commercialization, governments maintain ownership of electric utilities but remove subsidies and preferential fiscal policies, while requiring full recovery of capital, operations, and maintenance costs.
• Privatization. For many nations, privatization follows commercialization, and can include the sale of existing facilities to private firms, the purchase of power by electricity providers from private power producers, and independent regulation.
• Unbundling. Nations may choose to restructure their electricity sectors by "unbundling" utilities into independent firms that individually provide generation, transmission, distribution, and retail services.
• Competition. Finally, reforms have also included competition for wholesale power and, less often, retail services.
As noted above, this process of energy-sector restructuring fails to address important public
benefits and other goods that the market cannot adequately provide. These deficiencies include: inadequate investment in research, development, and deployment; lack of consideration of externalities in the pricing of energy; insufficient investment in individual and institutional energy-sector capacity; lack of needed diversity in energy portfolios; inadequate investments in technology buy-down; an inability to implement integrated resource planning and demand-side management programs; inadequate provision of rural energy services; and inequities with respect to energy access for the poor or disenfranchised.
22 Kammen (1999). 23 “Unbundling” refers to the disaggregation of traditionally vertically integrated utility activities in the areas of
generation, transmission, and distribution. 24 Kozloff (1998), Kozloff et al. (1998)
CHAPTER 3: Foundations of International Cooperation
3-17
Our prospective developing and transition country partners will need funding mechanisms to support their public interests. An especially promising way to do this would be to create, as an integral part of energy-sector reform, a Public Benefits Fund (PBF), by levying a small non-bypassable wires/pipes charge on the sales of all electricity/gas that is produced, and use the revenues from such a fund to help provide the public benefits that a free market could not provide. This approach to protecting public benefits has been demonstrated by Brazil (Box 3.1). In the United States, such a fund based on a non-bypassable wires charge was created as an element of the recent California legislation that restructured the electric power industry in that State; and the Administration’s electric industry restructuring bill pending before Congress calls for a national PBF based on a non-bypassable wires charge. Both the California and proposed Federal PBF have provisions that some of these funds would be used to support ERD3 activities relating to new clean energy technologies. A possible incentive for establishing a PBF via a non-bypassable wires/pipes charges is discussed below (see “Debt for Public Benefits Fund Swap”). Other mechanisms might also be considered, tailored for each country's needs.
Possible public actions to advance public benefits where the market is deficient—and possible
roles for U.S. involvement—include: • R,D,&D Support. Governments might fund R&D and demonstration directly, or through use of a
portion of a PBF or by other mechanisms. National R&D support through a PBF or by other means might also be leveraged through partnerships with the United States in R&D activities identified in Chapters 4 and 5.
• Externality Costing. Many of the costs of energy use, particularly energy-linked national security concerns and local, regional, and global environmental impacts, are not typically included in energy prices. It would be a serious oversight to not internalize these external costs—to “get the prices right”—when reforming/restructuring the energy sector, notwithstanding the technical25 and political difficulties of doing so. Local capacity building is needed to identify and approximately quantify these external costs, and mechanisms are needed to factor these costs into the decision process for selecting energy technologies. These mechanisms might include externality taxes, feebates, cap and trade systems, regulations, and others. If revenues are raised, they might be used to support public benefits, generate general revenues, or offset other taxes or fees. The United States could provide technical assistance for developing methodologies to identify, quantify, and approximately value externalities to provide the basis for policies that would seek to internalize these costs (recognizing that the United States itself does not adequately do this.)
• Capacity Building. Education and training have long been recognized as a public good. Technical, financial, managerial, and policy capabilities are needed for open, competitive markets to develop and function effectively. Leveraged public support to develop these capabilities is needed and might be provided through support from a Public Benefits Fund, leveraged with bilateral and multilateral assistance. Again, the United States could provide technical advice to support capacity building, or offer direct support for capacity building and training in cases where such activities would support U.S. public interests or values (as outlined in the initiatives above).
• Portfolio Diversity. An energy system based on a single or a few energy resources and systems is
vulnerable to breakdown and disruption, with potentially serious impacts on the economy and 25 Because of the complexity of the processes involved and the many uncertainties, dollar estimates of externalities
typically have wide uncertainty ranges. For example, estimates of the health costs of small particle air pollution have a cost variation to within a standard deviation ranging from one-fourth to four times the median value. See, for example, Rabl and Dreicer (1999), Spadaro and Rabl (1998), and Spadaro et al (1998).
Powerful Partnerships
3-18
public welfare. Competitive energy markets will not adequately invest to minimize these risks. With the costs of disruption spread across the economy, private firms cannot capture the full benefits of their investment.26 Mechanisms to incorporate diversity in the energy-sector portfolio are needed to hedge the risk of energy supply disruption. These could take the form of percentage share limits for particularly vulnerable energy resources and technologies in the energy system. Establishing portfolio diversity should be coordinated with mechanisms for buying down technology costs, such as the Clean Energy Technology Obligation discussed below. The main U.S. contribution to establishing such mechanisms would be through technical advice, with additional measures described below.
• Technology Buy-down. As noted above, markets have inherent difficulties in buying the cost of a new energy technology down its learning curve. Mechanisms for technology cost buy-down are needed. These could include the Clean Energy Technology Obligation mechanism described below.
• Integrated Resource Planning and Demand-Side Management. There is an inherent imbalance between developing energy supplies—where there is a focused large-scale industry with ready access to capital at commercial rates—and developing energy efficiency—where individual consumers face significant information barriers, high transaction costs, and often difficult access to relatively expensive capital. Yet, energy-efficiency investments are often the most cost-effective. Mechanisms are needed to evaluate the opportunities for energy efficiency and to reduce information barriers and transaction costs for, or provide other assistance to, potential end-users of efficient equipment. Integrated Resource Planning (see below) done on a planning (not a regulatory) basis can help identify and evaluate the opportunities; Demand Side Management efforts can address information (labeling), transaction cost, codes and standards, and other barriers to the use of efficient technologies. These could be supported through the Public Benefits Fund, and the United States, with significant experience in both areas, could provide needed technical advice.
• Rural Energy Services. Although there is a critical need for access to reliable and cost-effective
energy supplies in rural areas, providing such access typically involves much higher infrastructure and transaction costs than providing energy to urban areas. The United States and other industrial countries first brought energy to rural areas through large subsidies and low-cost loan programs. For developing and transition countries, mechanisms are needed to provide energy services to rural areas in the most cost-effective ways. The Rural Energy Concession is one promising mechanism for providing energy services competitively to rural areas, with assistance for incremental costs from a PBF or other sources (see below).
• Equity for the Poor or Disenfranchised. Energy-sector reform, and the removal of subsidies for energy, might leave the poor with prohibitively high energy costs. Mechanisms are needed to provide needed energy services to the poor without reversing sector reform, inappropriately subsidizing various groups, or drawing down public funds. The Public Benefits Fund could be used to help fund incremental costs; mechanisms like Rural Energy Concessions (see below) provide a useful model for competitively extending energy services to the rural poor, while capping the overall obligation and level of support. The main U.S. contribution could be to provide technical advice and expertise needed to establish such mechanisms.
26 Note that some economists would argue that even with costs spread across the economy, markets left to
themselves would be able to deal efficiently with supply disruptions, but in practice would be constrained by government action concerning costs and returns.

CHAPTER 3: Foundations of International Cooperation
3-19
A different set of challenges is posed by natural gas. Natural gas is the cleanest of the fossil fuels. Wherever it is readily available in the industrialized countries, it has been widely used for domestic applications (cooking, domestic hot water, space heating), for providing heat and combined heat and power in commercial buildings and industry, and for central station power generation. In power generation applications the natural gas-fired combined cycle has become the thermal power generating technology of choice because the electricity generated this way is highly competitive on both economic and environmental grounds. Moreover, new gas liquids technology offers the promise of enabling natural gas to make substantial inroads in transportation and other liquid fuels markets. Despite the attractions of natural gas, its use is in the embryonic stage of development in many developing countries.
The private sector is fully capable of making the needed investments relating to expanded use of natural gas and is launching many combined cycle power projects in those developing countries that have some access to new natural gas supplies. Such development efforts are sometimes constrained, however, by an inadequate regulatory infrastructure within the country and the “chicken-and-egg” quandary of developing a complete regulatory structure in advance of investment, before there is an experience base with natural gas development within the country. The result can be indecision, even paralysis, preventing the initiation of both regulatory and gas infrastructure development.27 For countries with embryonic gas development, there is often a lack of transparency in rules relating to pipeline investments by the private sector.
The private sector is carrying out major projects in Latin America and other regions to bring natural gas from remote sources to major energy demand centers—often via pipelines that cross international borders. Pipeline construction activities linking huge gas supplies in Siberia/Central Asian Republics/Middle East and energy-hungry, gas-poor regions of Asia and the Indian subcontinent, however, are inhibited by political constraints and often ambiguous foreign policies of countries that would be major stakeholders in large, international gas projects.
Thus, for natural gas there is a pressing need for policy reforms related to infrastructure
development that would help accelerate the process of bringing natural gas-based energy technologies to the many prospective consumers.
This discussion shows that a range of public policies and tools are required both to remove the
bottlenecks that impede private-sector participation and to “bridge the gaps” in the innovation pipeline where private-sector investments are insufficient to meet public needs. It is not enough to create the conditions for privatization and competition in restructured markets; mechanisms and policies for maintaining and promoting innovation (Figure 3.2), internalizing the cost of externalities, and providing resources for addressing the needs of the poor and disenfranchised are required as well.
Obviously, a significant portion of the burden for clearing the bottlenecks and inserting the plugs
in overseas RD3 pipelines lies with in-country governments, multilateral development banks, and other international institutions. We describe them here not because we believe the U.S. government can or should do everything to ensure a smoothly flowing RD3 pipeline in other nations, but because a glimpse
27 To initiate development of the natural gas pipeline infrastructure, a State energy agency will often be charged with
selecting a developer to undertake a project. With this approach, each developer will find political support for its case and, as this evolves, a decision in favor of one developer may become, effectively, a decision against the supporters of other developers. It can then become politically more comfortable to make no decision rather than any decision. Governments without prior experience with gas infrastructure may also find it difficult to make decisions regarding pipeline franchises and pipeline economic regulation, as well as providing information to, access for, and negotiating production contracts with the private sector.
Powerful Partnerships
3-20
into the complexity of the innovation process and the required flexibility of public-sector policies and institutions provides a context for the U.S. actions recommended in this chapter.
Two clusters of initiatives are described below to meet these sector reform and innovation
pipeline needs: the Energy Sector Reform Initiative, and the Demonstration and Cost Buy-down Initiative. Because energy-sector reform involves so many different players along the whole spectrum of the ERD3 pipeline, the initiatives we present below, while treated as “separable” objects, should be viewed as a cluster of actions, each of which is important—but not sufficient in the absence of the other actions—to spur adequate reform. High Priority Initiative: Assistance for Energy Sector Reform
Goal
To support and shape energy-sector reform and restructuring in developing and transition countries—moving towards open, competitive markets with improved financial performance—while retaining incentives for energy-technology innovation that addresses public goods and externalities.
U.S. Actions
(1) Provide technical and policy advice—including through direct provision of personnel to the relevant partner-country organizations or through multilateral institutions—to countries considering or undergoing energy-sector reform, with emphasis on: (a) “getting prices right” through elimination of price controls and subsidies for conventional energy sources and through internalizing environmental costs; and (b) creating Public Benefits Funds (PBFs) to provide resources for advancing public benefits in the restructured energy sector—with funds raised through non-bypassable wires/pipes charges or by other means, including initial support from debt swaps in appropriate cases (see below).
(2) Provide technical and policy assistance in establishing evolutionary regulatory frameworks for
natural gas grids, beginning with simple pipeline systems linking large gas producers with large users and growing into grids serving a much wider range of producers and consumers.28
The Energy Sector Reform initiative should be funded at $20 million per year in FY2001, increasing to $40 million per year in FY2005. These funds should be supplemental to existing budgets for international energy RD3 activities. These funds do not include support that could be provided for initiating PBFs through debt swaps, as discussed below. Elaboration
The challenge of rapidly deploying new energy technologies is most acute in developing
countries, where energy-sector growth is often high and energy-sector institutions face serious financial, technical, and managerial challenges—even in the absence of energy-sector restructuring and a shift towards commercial terms and markets. Technical and policy support is urgently needed in support of sector restructuring as efforts go forward in Africa, Asia, and Latin America.29
28 The main regulatory concern associated with initial pipeline projects is to ensure that these projects are formulated
in ways that do not inhibit their eventual evolution into grids that serve wide ranges of suppliers and consumers. 29 See: e.g. Albavera (1995); ESMAP (1996); Girod and Percebois (1998); Gray (1995); World Bank (1998a).
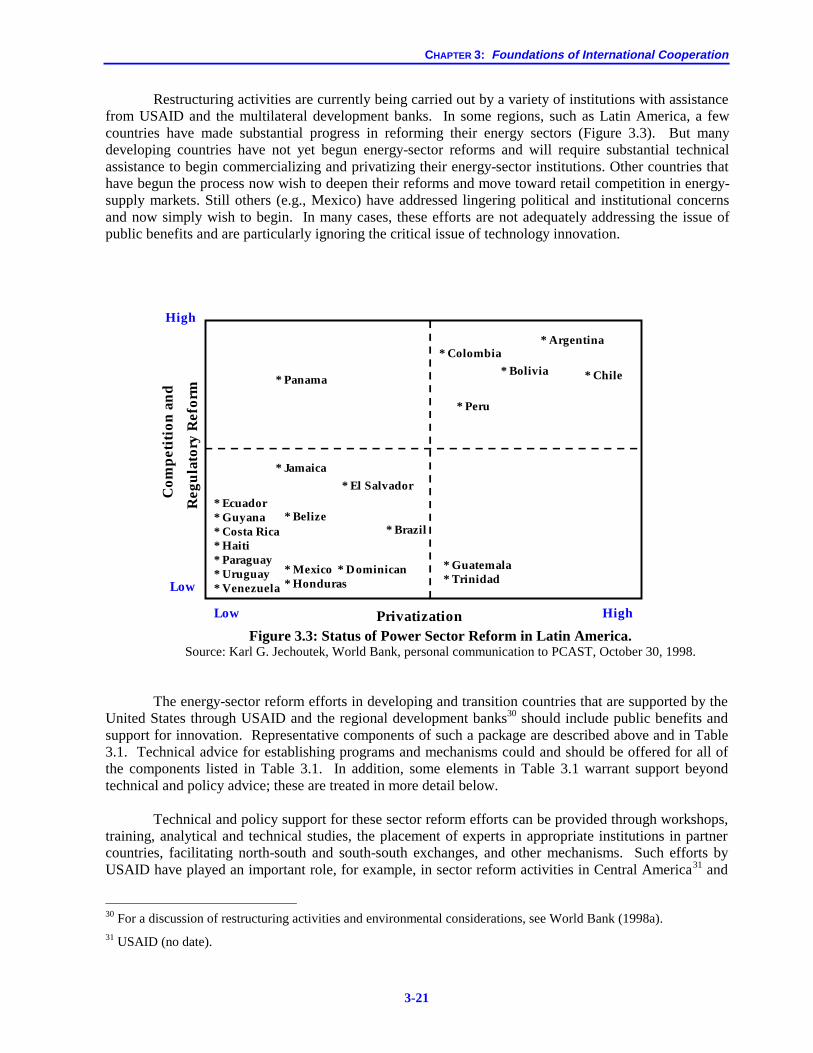
CHAPTER 3: Foundations of International Cooperation
3-21
Restructuring activities are currently being carried out by a variety of institutions with assistance from USAID and the multilateral development banks. In some regions, such as Latin America, a few countries have made substantial progress in reforming their energy sectors (Figure 3.3). But many developing countries have not yet begun energy-sector reforms and will require substantial technical assistance to begin commercializing and privatizing their energy-sector institutions. Other countries that have begun the process now wish to deepen their reforms and move toward retail competition in energy-supply markets. Still others (e.g., Mexico) have addressed lingering political and institutional concerns and now simply wish to begin. In many cases, these efforts are not adequately addressing the issue of public benefits and are particularly ignoring the critical issue of technology innovation.
* Panama
* Jamaica* El Salvador
* Ecuador* Guyana* Costa Rica* Haiti* Paraguay* Uruguay* Venezuela
* Belize* Brazil
* Mexico* Honduras
* DominicanRep.
* Colombia* Argentina
* Bolivia * Chile
* Peru
High
High
Low
Low
Com
pet
itio
n a
nd
Reg
ula
tory
Ref
orm
Privatization
* Guatemala* Trinidad
Figure 3.3: Status of Power Sector Reform in Latin America.
Source: Karl G. Jechoutek, World Bank, personal communication to PCAST, October 30, 1998. The energy-sector reform efforts in developing and transition countries that are supported by the
United States through USAID and the regional development banks30 should include public benefits and support for innovation. Representative components of such a package are described above and in Table 3.1. Technical advice for establishing programs and mechanisms could and should be offered for all of the components listed in Table 3.1. In addition, some elements in Table 3.1 warrant support beyond technical and policy advice; these are treated in more detail below.
Technical and policy support for these sector reform efforts can be provided through workshops,
training, analytical and technical studies, the placement of experts in appropriate institutions in partner countries, facilitating north-south and south-south exchanges, and other mechanisms. Such efforts by USAID have played an important role, for example, in sector reform activities in Central America31 and
30 For a discussion of restructuring activities and environmental considerations, see World Bank (1998a). 31 USAID (no date).

Powerful Partnerships
3-22
USAID’s Energy Partnership Program is actively engaged in pairing U.S. energy regulators with counterparts in developing countries (Box 2.1). Tapping state as well as federal expertise is important, because many of the ongoing energy-sector reforms in the United States are taking place at the state level.
Table 3.1: Representative Mechanisms for Incorporating Public Benefits Mechanism Description/Discussion U.S. Action
Energy-Sector Reform
Energy price rationalization, privatization of energy firms, unbundling of energy activities, introduction of wholesale/retail competition. Reform should include establishment of mechanisms or institutions that advance ERD3 and other public benefits, as below.
Technical advice Leveraging activities of
multilateral development banks
Externality Costing or Controls
Internalization of externalities through technology/fuel taxes, feebates, cap and trade systems, regulation, or other approaches to incorporate externalities in energy decision-making
Technical advice
Public Benefits Fund
Established as part of restructuring through a nonbypassable wires/pipes charge, as done by Brazil (Box 3.1), or by other means. Establishment could be facilitated by debt for public benefits swaps. Funds could be used for ERD3, capacity building, IRP, DSM, technology cost buy-down, rural concessions, equity for the poor, etc. Competition, rigorous budgeting processes, or other mechanisms should be established to ensure effective use of the funds.
Technical advice
Debt for Public Benefits Fund Swap
For highly or moderately indebted nations, a portion of debt payment under debt relief could be directed towards establishment of a Public Benefits Fund, with agreement that other mechanisms would continue Fund support after the debt is forgiven.
Debt relief
Demonstra-tion Support Facility
Mechanism for carrying out in-country demonstration projects. Demonstrations to be funded from GEF, PBF, energy production tax credits for qualifying U.S. firms/projects, other public/private funds.
Technical advice Energy production tax credits. (see below)
Portfolio Diversity
To reduce system vulnerability to a supply disruption, percentage share limits could be specified for vulnerable energy supplies. Should be coordinated with CETO.
Technical advice CETO (see below)
Clean Energy Technology Obligation
Competitive mechanism for launching qualifying clean energy technologies in the market and buying their costs down their learning curves in a systematic manner. Incremental costs could be paid by GEF, host country PBF, and other public/private support.
Technical advice Encouragement of GEF
participation (see below)
Integrated Resource Planning
Analytical work to identify mix of energy supply/demand resources to meet energy service needs at the lowest cost as a policymaking aid; often used to identify underutilized energy-efficient technologies.
Technical advice (see below)
Demand Side Management
Mechanisms to lower market barriers to use of cost-effective energy-efficient technologies, some of which are described in Chapter 4.
Technical advice
Rural Energy Concessions
Competitive mechanism for providing rural energy services, often with PBF support.
Technical advice (See Box 3.3)
“Getting prices right” requires the elimination of price controls and subsidies for conventional energy technologies, and also the inclusion of the external costs—such as environmental impacts, national security impacts, and others—of conventional energy use. A number of U.S. states consider environmental costs in their electricity sector planning, either qualitatively or quantitatively,32 and
32 OTA (1995).

CHAPTER 3: Foundations of International Cooperation
3-23
although the United States overall does not adequately internalize externalities, there is considerable U.S. technical and policy expertise that can be tapped to assist other countries in this area. Support for identifying, measuring, valuing, and costing externalities could be provided, being careful to not let the numerous uncertainties paralyze the process of establishing approximate costs.
Externalities can also be internalized through "cap and trade" systems where a cap is placed on overall emissions, within which permits for emissions can be traded. Based on the success of this approach for controlling SOx emissions in the United States, U.S. agencies such as USAID and EPA should help developing countries that are interested in setting up similar emissions cap and trading schemes or other approaches; EPA, for example, signed in April 1999, a Statement of Intent to work with China in this area. Accurate emissions monitoring is critical to the success of such policies, and developing countries often falter with respect to implementation of environmental regulations. Thus, U.S. assistance and expertise could be particularly valuable in helping to establish and implement emissions monitoring and verification programs. In addition, U.S. specialists could assist with implementation of more conventional emissions standards programs, including efforts to establish output-based emissions standards (i.e., grams per kWh output rather than per MJ of fuel input). This approach would encourage efficiency improvements in power generation. In all of these efforts, particular emphasis should be devoted to encouraging and supporting policies that will speed up the introduction of inherently clean energy technologies. Establishing Public Benefit Funds can provide financial resources for advancing public benefits (see Table 3.1). As noted above, a PBF can be created by levying a small nonbypassable wires/pipes charge on all sales of electricity or gas, as done in Brazil and California. The U.S. could in some cases assist the establishment of a PBF by providing Debt Relief, as discussed below. Mechanisms for clean energy technology demonstration, cost buy-down, and deployment efforts should be incorporated in policies for the reformed and restructured energy sector. These are listed in Table 3.1. Demonstration and buy-down are discussed further below under the Demonstration and Cost Buy-down Initiative. For deployment, a discussion of Integrated Resource Planning is provided below, as is an example of a Rural Energy Concession (Box 3.3).
BOX 3.3: Argentinean Concessions For Rural Electrification
As part of its electric industry restructuring activity that is privatizing the power sector, the Argentine government has created an electricity concession market for 1.4 million heretofore unserved rural inhabitants, as an alternative to the conventional—and costly—approach of extending the existing electricity grid to remote areas. Competing firms bid on the right to provide energy services to a rural region; the winning bid is that which seeks the lowest government subsidy per energy hookup providing a fixed minimum level of energy service. The winning firm then provides electricity services to dispersed rural residences and public facilities (e.g., schools, medical centers, drinking water services, etc.) with the least costly of available energy technologies (e.g., PV panels, small wind mills, hydraulic microturbines, and diesel-driven generators). In these concessions, renewable technologies are often found to be competitive with diesel generators, and it is likely that a large share of residences will receive power from household photovoltaic or small wind systems.
The total investment for the Argentinean program is $314 million, which will be financed by fees paid by private users ($142 million), subsidies from already existing funds managed by provincial states ($75 million), and national subsidies ($97 million), including support from GEF.
A regulatory framework is needed to guide natural gas pipeline infrastructure development. The
United States can provide technical, financial, legal, policy, and regulatory advice in this area in order to lay the foundation for rapid development of natural gas. (TDA, for example, hired a U.S. law firm to
Powerful Partnerships
3-24
provide legal assistance to Vietnam to help them negotiate pipeline contracts; Vietnam was hesitant to go forward without such assistance because they lacked experience in this area. This broke a negotiations logjam, allowing regulatory development and associated pipeline contract negotiations to go forward.33) Finally, this initiative would support analysis of energy-sector reform and restructuring around the world, identifying key lessons for consideration in the United States as this country also undergoes reform and restructuring.
Elaboration: Debt Relief and Energy-Sector Restructuring Debt relief could be awarded to nations undergoing adequate energy-sector restructuring, with
some debt "savings" used to establish Public Benefits Funds. High levels of debt reduce the abilities of poor countries to invest in sustainable economic development, educate their citizens, reduce poverty, manage natural resources, and mitigate environmental degradation. Fourteen nations—home to about 440 million people—have a net present value (NPV) of debt that is greater than national annual GNP; the average per capita purchasing power parity (PPP) in these nations is about $1100 (U.S.). An additional 16 nations with 670 million citizens have an NPV of debt that is between 50 and 99% of national annual GNP; the average PPP in these nations is just $3,700 per capita (U.S.).34
In September 1996, the World Bank and the IMF launched an initiative to secure debt relief for the Heavily Indebted Poor Countries (HIPC) that pursue economic and social policy reforms. All creditors, including multilateral financial institutions, are participating in the initiative, but only Uganda and Bolivia have received substantial benefits under the program to date.35 President Clinton has unveiled a proposal to extend this initiative by more than tripling the amount of debt that would qualify for forgiveness under the HIPC initiative.
Limited debt relief could be used to initiate Public Benefits Funds under energy-sector restructuring. Under the HIPC initiative, the debt-relief schedule calls for a six-year period between initiation of reforms and forgiveness of debt. Debt payments (or a fraction of debt payments) for qualifying nations could instead be diverted to a PBF during that ‘probationary’ period.
Establishment of PBFs through debt-relief mechanisms could also be extremely beneficial in moderately indebted nations (those that don’t currently qualify for participation in the HIPC initiative, but are suffering significant debt burdens nonetheless). Many of these nations are rapidly developing and have reasonable energy and education infrastructures, which makes them compelling theaters of innovation and attractive as innovation partners. In these countries, debt-service payments for a portion of the national debt could be diverted to PBFs for a finite period, after which that portion of the debt would be forgiven. 36
These payments—whether from highly or moderately indebted nations—would be used only to establish a PBF; wire charges or other mechanisms for maintaining the fund would have to be established (within some specified period of time) before debt would be forgiven. A debt-relief/PBF program should
33 Joseph Grandmaison, Trade and Development Agency, Personal Communication to PCAST International Energy
Panel, Nov. 20. 1998. 34 Economic and population statistics from World Bank (1998), average PPP per capita are weighted for population
size. 35 More information is available at http://www.worldbank.org/html/extdr/hipc/pb-hipc.htm. Note that the HIPC
countries are determined by debt-to-export ratios (on a net-present-value basis). 36 There would be several other compelling options for such diversions, including education, poverty reduction, or
capital investment funds.

CHAPTER 3: Foundations of International Cooperation
3-25
be limited to nations beginning or undergoing energy-sector restructuring; such programs could also be tied to larger economic reforms.
The U.S. government should pursue such debt-relief measures in cooperation with other creditor nations and multilateral financial institutions. The costs of this program would depend on: (a) the number of nations eligible for the program based on their level of indebtedness and their ability and willingness to undergo energy-sector restructuring; (b) the required size of the PBF initiation funds, and thus the portion of debt to be forgiven; and (c) the current value of that portion of the debt. Table 3.2 gives an indication of the cost of a debt-relief/PBF program in some representative nations.
Table 3.2: Indicators of Debt and Possible Debt for PBF Swaps
Brazilc China Indonesia Philippines Malaysia India S. Africa
Total Electricity Generation in 1995 (TWh/y)
265 887 60.4 25.7 42 398 164
Debt-equivalent value of 1 mill/kWh PBF, assuming a 10 percent discount rate (billion $)
2.6 8.9 0.6 0.25 0.42 4.0 1.7
External debt, total and as percent of GNPb
TOTAL (billion $)
179 129 129 41 40 90 24
As percent of GNP
26 17 64 51 52 22 18
Debt forgiveness for 1 mill/kWh PBF as percent of total debt 1.5 6.9 0.45 0.6 1.0 4.5 6.9 (a) IEA, International Energy Annual 1995 (b) World Bank, World Development Report, Knowledge for Development, 1998/99. Oxford University Press (c) Note that these countries do not necessarily currently qualify for debt relief under either the World Bank’s “Heavily
Indebted Poor Countries” Debt Initiative, or President Clinton’s proposed extension of that program. We include these countries here to indicate possible costs of a debt relief program; such a program could extend only to HIPC nations or be structured to include partial debt relief for other nations.
Elaboration: Integrated Resource Planning
Integrated resource planning (IRP) is a process whereby a planning authority identifies and helps pursue the mix of supply and demand-side resources that meet energy service needs at the lowest cost.37 The objective is to maximize services such as heat, light, refrigeration, and motive power—not energy per se—per dollar invested. When least-cost energy services are identified that are not being taken advantage of, mechanisms can be instituted to help capture them. IRP assessments can be supported by funding from the PBF or by other means. IRP has been successfully applied in many portions of the United States. For example, IRP led to energy-efficiency investments of well over $1 billion by utilities in the Pacific Northwest during 1980-95, resulting in 8 TWh per year of electricity savings by 1995 at an average cost of 2 to 2-1/2 cents per kWh saved.38 37 NARUC (1988) 38 Ogden (1996)
Powerful Partnerships
3-26
For capital-starved developing countries where energy services are undersupplied, an integrated resource planning perspective can be very valuable. IRP studies have helped to guide policymakers to increase support for end-use energy-efficiency efforts in Brazil,39 India, and Sri Lanka40. In developing and transition countries pursuing utility privatization and increasing competition in electricity generation, IRP can direct planners, regulators, and utilities to the largest, most cost-effective energy savings opportunities. Besides direct costs, environmental and social costs associated with different energy resource options can be included in IRP studies. IRP studies can be done by energy ministries or state energy agencies, utility regulatory commissions that are now being set up in numerous developing countries, or utilities themselves where electricity supply is still a monopoly. In countries where market reforms are in place, IRP studies can be used as a complement to competition in determining the appropriate mix of technologies, by identifying those low-cost options that are not yet being selected by the market due to various market barriers that inhibit their selection (see Chapter 4). Such studies can be used as a basis for developing programs aimed at overcoming these barriers. U.S. agencies such as USAID and DOE that are assisting developing countries with regulatory reform and utility sector restructuring should promote use of an IRP perspective and assist LDCs in implementing IRP. Likewise, the United States should use its influence with the World Bank and regional development banks to have these organizations actively promote IRP in their sector reform efforts. The United States has considerable expertise and experience in this area. With a few million dollars of planning support and assistance, U.S. agencies and experts could help developing countries expand energy services and save billions of dollars in doing so. High Priority Initiative: Demonstration and Cost Buy-down Mechanisms Goal
To facilitate the demonstration, in foreign contexts, of advanced energy technologies with significant public benefits and to provide the means to “buy down” to competitive levels the costs of technologies in this category that have learning-curve characteristics making this practical. U.S. Actions
(1) Assist in establishing a Demonstration Support Facility (DSF), preferably at the Global Environment Facility (GEF), to provide a framework for clean energy demonstration projects that would attract support from the private sector as well as from various public-sector sources (including the GEF and PBFs or government grants in host countries);
(2) Award energy-production tax credits to U.S. firms participating in demonstration projects that are carried out under the DSF and that meet approved criteria (including being formulated so as to not conflict with U.S. opposition to tied aid);
(3) Assist in establishing a Clean Energy Technology Obligation (CETO), preferably at the GEF, that would use competitive instruments (such as the auction based Non-Fossil-Fuel Obligation of the United Kingdom or the Renewable Portfolio Standard in the United States41) to "buy down" the
39 Geller (1991) 40 Padmanabhan (1999) 41 The Renewable Portfolio Standard is currently under consideration at the federal level in the United States.
CHAPTER 3: Foundations of International Cooperation
3-27
costs of targeted innovative technologies with incremental cost support provided by the GEF and by the host country through PBFs or government grants.
Funding for this cluster of initiatives is recommended at $40 million in FY2001 increasing to $80
million in FY2005. The funding levels for these activities are particularly difficult to estimate, because the level of U.S.-sponsored financing that might be required for such activities is dependent on technological progress, actions taken by foreign or multilateral institutions and especially the role of the GEF in supporting these mechanisms, and other factors. If demonstration and buy-down efforts are primarily undertaken bilaterally by the United States, higher funding levels would be needed than if done multilaterally.
Elaboration: The Demonstration Support Facility A formal mechanism, a Demonstration Support Facility (DSF), could be established within the
Global Environment Facility to support private-sector sponsored, pre-commercial demonstrations of clean and efficient energy technologies. The U.S. should strongly encourage the GEF to undertake this mission and could provide technical and policy advice in support. If the GEF does not establish a DSF, the United States should provide advice and bilateral support for establishing DSFs within individual countries undergoing reform.42 The United States could also award energy production tax credits to U.S. firms participating in qualifying demonstration projects carried out under GEF organized or host-country DSFs. These credits would be formulated to ensure that they did not conflict with U.S. opposition to tied aid. Finally, direct domestic support for demonstration projects of appropriate clean energy technologies could be expanded through DOE (see PCAST 97), if such expansion is warranted because of lack of activity in GEF or host-country DSFs.
Regardless of which of these or other demonstration mechanisms are used, criteria should be established for demonstrations of clean energy technologies covering energy-efficiency/conservation, renewable/distributed energy resources, advanced clean fossil energy technologies, and advanced nuclear technologies, and bids for these projects should be solicited.
Criteria for projects should include: (a) the technology to be demonstrated must be a clean energy
technology (CET) that meets pollutant and greenhouse gas emissions, liquid and solid waste, and other environmental requirements, safety requirements, and national security (including energy security and proliferation resistance) requirements, and can potentially meet cost targets; (b) the demonstration must be a first-of-a-kind plant (but CETs already demonstrated elsewhere that must be modified to conform to host country conditions would qualify); (c) demonstrations must be of technologies that are of near-commercial scale or on a clear path to quickly reach that level; (d) the technology should have good prospects for wide replication if the demonstration project is successful.
Consortia of public and private institutions in one or more countries could submit proposals in
response to these solicitations (solicitations could be tailored to ensure that small businesses as well as larger firms would be able to participate in these projects). Projects should be led by private-sector participants, and winning proposals would have to include business plans for deployment follow-up to successful demonstration. These business plans should indicate levels of support that might subsequently be needed for “buy-down” and estimate market potential following demonstration and buy-down in relation to public-sector support that might be required for demonstration and buy-down.
42 Individual demonstration projects have also been carried out on a bilateral basis, such as the EPA and DOE CFC-
free Super-Efficient Refrigerator project with China (Fulkerson et al. 1999).

Powerful Partnerships
3-28
Project financing would be divided into base costs and incremental costs. The base cost is the part of the total project cost that would make the project fully cost-competitive today if the incremental cost were zero. Base costs would be financed by the private-sector participants, with partial World Bank/IFC financing as appropriate. There would be at least four public-sector contributions to support qualifying demonstration projects that involve U.S. firms: the GEF would contribute to incremental cost associated with climate change benefits; the host-country’s PBF would make a contribution to advance host country interests; the United States would contribute via production (not investment) tax credits to participating U.S. companies; appropriate U.S. agencies would provide technical support for studies and ancillary R&D. The total public-sector contribution should be the lesser of the non-economic part of the project or some appropriate specified percentage (e.g., 50%).
A substantial expansion of activities to demonstrate emerging clean energy technologies is needed to expand the portfolio of technologies available to deal with the economic, environmental, and security problems posed by conventional energy technologies. Support for overseas demonstrations would ideally come from existing international institutions, such as the Global Environment Facility (GEF). Under its Operational Program Number 7 the GEF is able to provide grants to pay for the incremental cost for demonstrations of emerging technologies that offer climate change benefits (see Chapter 2). To date, however, the GEF has had limited experience with demonstrations. Its experience is primarily with a biomass integrated gasifier combined cycle power project in the Northeast of Brazil, with several others in preparation. (This demonstration project has multiple sources of investment support, including equity contributions from the private-sector partners, a World Bank loan, plus a GEF grant to cover the incremental cost relating to climate-change benefits.)
The activities of the GEF relating to demonstration should be greatly expanded. One way to expand the resources available for demonstrations within the GEF would be to reallocate existing resources. The GEF has identified two categories of projects that qualify for ‘incremental cost’ funding. The first category involves technologies that are apparently fully cost-effective but whose deployment in the market is inhibited by high transaction costs and other institutional barriers; Operational Programs 5 and 6, relating to energy efficiency and renewable energy, are of this nature (see Chapter 2). The second category, supported under Operational Program 7, involves new technologies that offer the potential for large GHG emissions reduction, are not yet cost-effective, but have good prospects for becoming cost-effective if they can be successfully demonstrated and if costs can subsequently be reduced to market clearing levels with accumulating experience via appropriate technology cost "buy-down" mechanisms. More demonstration and technology cost buy-down projects (the second category) could be funded under GEF’s existing budget if the World Bank supported activities now under Operational Programs 5 and 6. The World Bank should take these activities on, as discussed below under Finance, but in doing so there should be a careful hand-off of program activities between GEF and the World Bank to ensure that these important activities are not inadvertently dropped. The U.S. Government should encourage the World Bank to take on these activities, then allowing a significant expansion of GEF’s demonstration activities—perhaps through establishment of an international, GEF-sponsored DSF as a formal mechanism established under Operational Program 7. In the absence of an increase in demonstration activities through GEF, the U.S. government should provide technical advice to enable the establishment of domestically supported Demonstration Support Facilities in developing and transition countries undergoing energy-sector restructuring.
The U.S. government could award production tax credits to U.S. firms participating in demonstration projects carried out under DSFs. To qualify for the tax credits, Treasury must approve of the qualifying-technology and team criteria established for the DSF, and the project must meet other relevant U.S. Treasury criteria as well (e.g., provisions for small-business participation) and should not explicitly or implicitly counter other considerations such as U.S. opposition to tied aid. In addition, the
CHAPTER 3: Foundations of International Cooperation
3-29
DOE should provide technical support relating to qualifying demonstrations, for studies and ancillary R&D.
If the efforts of the GEF and overseas DSFs are insufficient to allow reasonable U.S. firm participation in international demonstration projects, the U.S. government should consider expanding direct support for such activities through increased DOE and USAID funding. Support for international demonstrations should, however, be limited to either those technologies that have already been demonstrated in the United States, but which must be reshaped to conform to developing or transition country conditions, or technologies for which there is no significant market in the United States (e.g., small-scale [< 500 kW] biopower technologies that would be too labor-intensive to be viable in U.S. markets).
Elaboration: The Clean Energy Technology Obligation
The most serious gap in the innovation pipeline (Figure 3.2) is the lack of a mechanism to buy down the cost of an innovative clean energy technology to competitive levels.43 Mechanisms for technology cost buy-down should be included in energy-sector reforms.
In some industrialized countries where energy-sector restructuring has or is taking place, this challenge is being addressed by creating, in ways that are consistent with the general principles of restructuring, small guaranteed markets to help launch new energy technologies. In these programs, prospective providers of qualifying energy technologies compete for shares of these markets. Examples of such programs are the Renewables Non-Fossil Fuel Obligation (NFFO) in the United Kingdom and the proposed Renewable Portfolio Standard (RPS) in the United States (Box 3.4).
This Panel proposes—as a key element in energy-sector reform in the host developing or
transition country—a Clean Energy Technology Obligation (CETO) for accelerating deployment of promising new commercially-ready CETs targeted for deployment in partnership with the U.S. and/or other industrialized country partners, when the prices for these CETs are above market-clearing levels. The CETO would use competitive instruments to launch in the market over a specified period of time (~5-10 years) specified capacities for those CETs targeted for deployment. CETO competitions would be organized by guaranteeing markets sufficiently large that CET manufacturers will expand production capacity to levels where economies of manufacturing scale can be realized, and there is opportunity for reducing costs significantly by advancing along learning curves. Such market guarantees should be provided only if bid prices do not exceed specified ceiling prices. Markets offering high value for CET-generated energy would be identified to minimize the subsidies needed for CET cost buy-downs.
CETO competitions could be organized in various ways, such as the NFFO or the RPS. If modeled after the NFFO, the CETO would involve a series of auctions to buy down the costs of specified quantities of targeted CETs (See Figure 3.5), exploiting the phenomenon that technology costs tend to decline as technologies advance along their learning curves (Figure 3.6). CETO would differ in two important respects from the British NFFO or the American RPS. First, the CETO would include a range of qualifying CETs that offer major environmental benefits—e.g., coal IGCC cogeneration or trigeneration systems (see Chapter 5), as well as renewable or energy-efficiency technologies, or others might be included. Second, unlike the NFFO or the RPS, in which the incremental cost of buying down the technology cost is fully paid for by energy consumers in the form of a small increase in the energy price, only part of the incremental cost for CET cost buy-down under the CETO would be paid for by
43 As this report was in press, the GEF Council endorsed a note proposing strategic partnerships for renewable
energy including various financial mechanisms, simplified approval processes, supporting policy and regulatory frameworks, and others to accelerate cost buy-down of renewable energy technologies (World Bank, 1999).

Powerful Partnerships
3-30
host-country consumers (in the form of a contribution to the PBF). For CETO, part of the incremental cost that represents climate change benefits would be paid for from an international fund—both because these benefits are global rather than national, and because resources for long-term investments are scarce in developing and transition countries.
Box 3.4: Market Transformation Initiatives and the Restructuring of the Electric Industries The propensity of the private-sector to underinvest in the commercialization of advanced clean energy
technologies (CETs) under the competitive market conditions to which the electric industry is evolving is widely recognized in the policy debates in those industrialized countries where energy-sector restructuring is well underway. There, new market transformation initiatives that would promote the advancement of such technologies are being given close scrutiny as key elements of policies to regulate the transition to a more competitive electricity market. Examples of such regulatory measures aimed at launching renewable technologies in electric markets while making maximum use of market forces in finding the most economically efficient ways to do so are the Renewable Portfolio Standard (RPS) in the United States and the Renewables Non-Fossil Fuel Obligation (NFFO) in the United Kingdom.
In the United States, various states are experimenting with an RPS, which is also a provision in various
electric industry restructuring bills pending before Congress. An RPS requires that each electricity supplier provide a specified percentage of total sales as renewable electricity; each supplier must either generate this renewable electricity or purchase tradable renewable energy credits from others who produce more than the required amount. The specified percentage would typically increase gradually over time until some target date (e.g., to 7.5 percent non-hydroelectric renewables for 2010-2015 in the Administration’s electric industry restructuring bill) and subsequently would be phased out.
Under the Renewables NFFO, launched as part of the 1989 Electricity Act that privatized the electric
power sector, the UK government mandated that 1,500 MW of renewable electricity supplies will have been purchased by electric utilities by the year 2000 in a series of auctions. The NFFO and some variants of the RPS specify separate financing packages (tranches) for different technology subclasses so that a portfolio of technologies is advanced.
Both measures offer the potential for stimulating price convergence between renewable and conventional electric-generating technologies several ways. First, the mandating of specified volumes for capacity purchases makes possible cost-cutting via learning and experience [e.g., costs typically decline as function of cumulative production (see Figure 3.1)]. Second, the announcement at the beginning of the program of increasing mandated purchase volumes over time increases the confidence of vendors to expand production capacity over time, thereby gaining economies of scale. Third, the use of auctions introduces a strong competitive element into the process that will also tend to drive down costs. The power of such mechanisms in stimulating cost convergence is reflected by the Renewables NFFO experience: the average bid price declined two-fold over the series of four auctions to date (Figure 3.4). In both cases the incremental cost of “buying down” the cost of the new technologies is borne by all electric ratepayers, but the cost is small (e.g., in the case of the Renewables NFFO an increase in the electricity price since 1990 of 0.5 percent or less).
The CETO should be limited to those technologies that offer major environmental benefits, have
steep learning curves (see Figure 3.6, for example), and have good prospects for becoming widely competitive in the not too distant future under market conditions after subsidies are removed.44 Two concerns that warrant close scrutiny in designing a CETO: (a) the need to minimize the risks of “picking winners”—that is, prematurely narrowing options outside of competitive forces—and (b) the need to focus resources in favorable theaters for innovation.
44 Duke and Kammen (1999)

CHAPTER 3: Foundations of International Cooperation
3-31
The “picking winners” concern can be dealt with in part by designing a CETO that promotes a diversified portfolio of CETs, with limits on the total subsidy available for any particular CET. As pointed out by the previous PCAST Energy R&D Panel, there is a wide range of promising CETs that are small and modular, so that diversified portfolios can be constructed for which the aggregate buy-down costs should not be prohibitively high. In addition, the portfolio mix could be adjusted over time to eliminate support for those technologies for which experience in the cost buy-down process shows lack of promise for continuing cost reduction.
0
2
4
6
8
10
12
1990 1991 1992 1993 1994 1995 1996
cent
s/kW
h (1
996
$)
Figure 3.4: Reduction In The Price Of Power Offers Under The United Kingdom Non-Fossil Fuel Obligation (NFFO). Note that overall consumer prices increased by 0.5 percent or less under the NFFO. Source: Power in Europe, February 1997. CETO competitions should be carried out where the prospects for success in the innovation
process are high. Because technology successfully launched in the market in one region will often subsequently diffuse to other regions, favorable conditions for CETO-like activity are often needed only somewhere in order to establish CETs in the market. Of course, even after costs of CETs have been bought down, other actions may be needed to reduce various market barriers (see, for example, Table 4.1).
Conditions conducive to CET innovation include: (a) an internal market large enough to establish
the CET in the market; (b) rapid energy demand growth (so that large production volumes can be built up quickly, thus enhancing the prospects for rapid cost reduction); (c) economically efficient energy markets; (d) strong and established environmental policies; (e) an adequate science/engineering infrastructure; (f) adequate rules for the protection of intellectual property; and, (g) strong national interest on the part of the host country in becoming a market leader in export as well as domestic markets, for the cluster of technologies that would be included in the CETO.
CETO competitions could be organized either by multilateral agencies or by the United States in
partnership with the host country. The World Bank, the IFC, and the GEF could form a strong
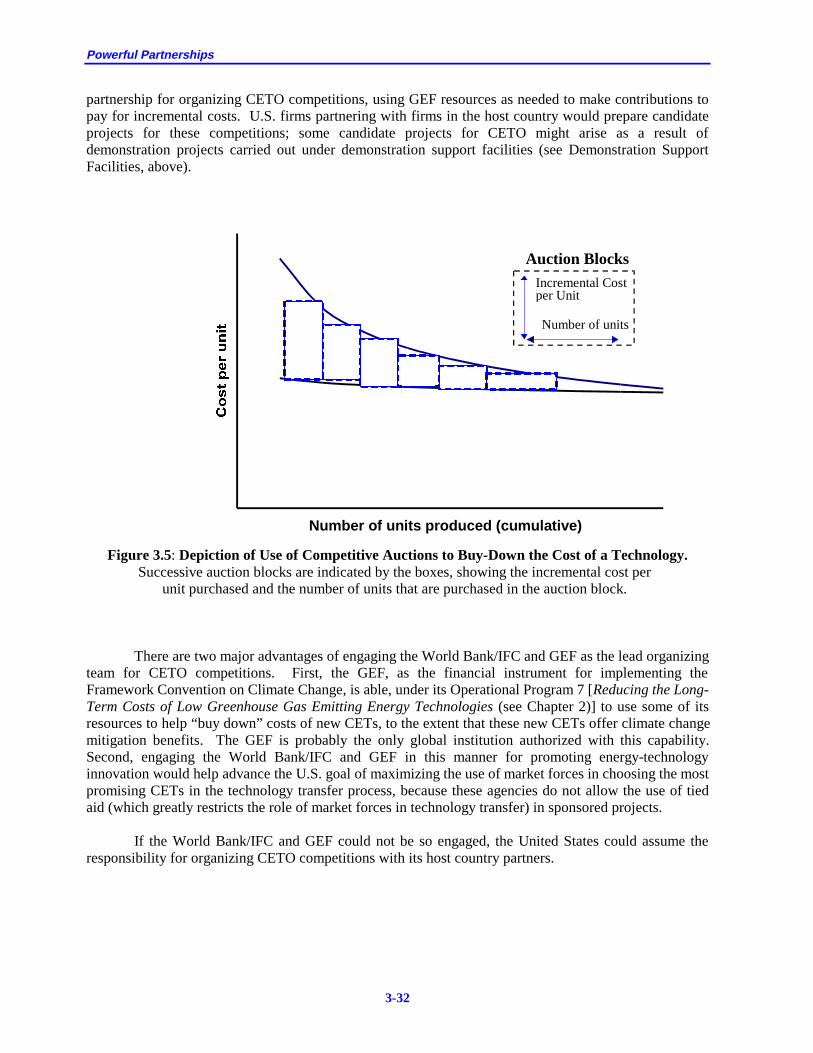
Powerful Partnerships
3-32
partnership for organizing CETO competitions, using GEF resources as needed to make contributions to pay for incremental costs. U.S. firms partnering with firms in the host country would prepare candidate projects for these competitions; some candidate projects for CETO might arise as a result of demonstration projects carried out under demonstration support facilities (see Demonstration Support Facilities, above).
Number of units produced (cumulative)
Auction BlocksIncremental Costper Unit
Number of units
Figure 3.5: Depiction of Use of Competitive Auctions to Buy-Down the Cost of a Technology.
Successive auction blocks are indicated by the boxes, showing the incremental cost per unit purchased and the number of units that are purchased in the auction block.
There are two major advantages of engaging the World Bank/IFC and GEF as the lead organizing team for CETO competitions. First, the GEF, as the financial instrument for implementing the Framework Convention on Climate Change, is able, under its Operational Program 7 [Reducing the Long-Term Costs of Low Greenhouse Gas Emitting Energy Technologies (see Chapter 2)] to use some of its resources to help “buy down” costs of new CETs, to the extent that these new CETs offer climate change mitigation benefits. The GEF is probably the only global institution authorized with this capability. Second, engaging the World Bank/IFC and GEF in this manner for promoting energy-technology innovation would help advance the U.S. goal of maximizing the use of market forces in choosing the most promising CETs in the technology transfer process, because these agencies do not allow the use of tied aid (which greatly restricts the role of market forces in technology transfer) in sponsored projects.
If the World Bank/IFC and GEF could not be so engaged, the United States could assume the
responsibility for organizing CETO competitions with its host country partners.

CHAPTER 3: Foundations of International Cooperation
3-33
20000
10000
5000
1000
100
10 100 1000 10000 100000
1982
1987
1963
1980
Windmills (USA)(learning rate ~ 20%)
RD&D phase
Commercializationphase
USAJapan
Cumulative MW installed
19811983
500
Photovoltaics(learning rate ~ 20%)
Gas turbines (USA)(learning rate ~ 20%, ~10%)
US
(199
0)$/
kW
1995
1992
200
2000
Figure 3.6: Learning Curve Relationships for Photovoltaics, Wind Generators, and Gas Turbines. All three have similar learning curves; however, after 1963 the gas turbine learning curve increased substantially, indicating attenuated experience effects. Note that gas turbines also have fuel costs and associated capital investment that are not shown here. Source: IIASA/WEC (1995).
FINANCE Even with proper energy-sector reform and robust capacity building, clean and efficient energy technologies might not be deployed—even after successful demonstration and cost buy-down—because of financial and other barriers.45 For example, energy-efficiency (EE) and renewable energy (RE) projects face several barriers relative to conventional energy projects. There can be a general lack of knowledge of and exposure to RE and EE projects in many markets. Transaction costs—including feasibility studies, legal and engineering fees, costs associated with securing financing, and permitting costs—are relatively inelastic with respect to project size, and thus place a disproportionate burden on small-scale projects relative to large-scale projects. Developers are frequently deterred by the inability of their potential customers to guarantee repayment of loans. This can be particularly problematic in restructured markets, where newly minted private-sector energy firms may not have a sufficient credit history to secure competitive loans on the commercial market. Asking host governments to provide sovereign guarantees to secure long-term debt fails to sufficiently shift the liability for energy projects from the public to the private sector. In addition, governments can only assume limited amounts of
45 This initiative and discussion benefited especially from Econergy (1999).

Powerful Partnerships
3-34
exposure through guarantees, and small-scale energy projects fare unfavorably when pitted against large-scale energy projects or other development projects in securing these guarantees.46 Clean energy technologies also face barriers due to their often higher initial capital costs. Independent power producers want to recover their investment in the shortest possible time, particularly as they generally do not have the capacity to underwrite the debt on their projects and so rely on higher capital cost, shorter repayment period market financing. As a result, they generally prefer low capital cost conventional fossil-fired power plants, rather than higher capital cost clean energy technology systems even though the lifetime cost per unit energy output may be the same or lower. The lower capital cost of the fossil power plants means less of the developer’s capital is at risk. In contrast, the clean energy-technology system has higher capital cost but lower or no (for some renewables) fuel costs—which reduces the impact of inflation, volatile fuel prices, fuel-supply disruptions, or other problems. In order for technologies that are cost-competitive on a life-cycle basis but have high front-end capital costs to then compete in these markets, financing mechanisms are needed to extend loan repayment times while minimizing transaction costs. These financial barriers illustrate the importance of building not just an innovation pipeline, but also a web of matching private-sector financial mechanisms to provide support at every stage. These range from investors (e.g., pension funds) to investment banks (that can securitize the loan portfolios) to national/regional banks to local banks or village credit facilities that provide credit to local equipment distributors and end-users. These facilitating mechanisms to get finance to the end-user parallel the corresponding equipment manufacturing, and distribution and maintenance networks required to get the technology to the end-user.
There are some embryonic activities that could be helpful in addressing these financing barriers, such as various activities of the World Bank Group (see Box 3.5) and the Clean Development Mechanism that emerged from the Kyoto Protocol (see Box 3.6). But the Panel believes that more needs to be done and therefore proposes two initiatives: one aimed at encouraging the multilateral development banks to increase support for advanced CETs and to increase domestic financial support for such technologies; the second to expand a program of grants for feasibility studies, project planning, and other technical assistance for such projects. The Panel recommends that funding for the two Finance initiatives described below—Finance for Clean Energy Technologies and Technical, Financial, and Feasibility Analysis for U.S. Firms—should begin at $40 million in FY2001, increasing to $80 million in 2005, including necessary administrative expenses. High Priority Initiative: Finance for Clean Energy Technologies
Goals:
To overcome financial barriers to deployment of clean and efficient energy technologies in developing and transition economies.
46 This can occur for several reasons. Host governments may be tempted to promote known conventional
technologies. Because feasibility and project-development studies can be proportionately more expensive for small-scale projects, there is an increased probability that the risks won’t be quantified with the same accuracy as they are for large-scale projects. Host governments may also be swayed by the desire to fund or guarantee ‘more visible’ large-scale projects.
CHAPTER 3: Foundations of International Cooperation
3-35
U.S. Actions
(1) Encourage increased financing for clean and efficient energy technologies from the Multilateral Development Banks (MDBs), including (a) establishing or expanding "trust funds" through the relevant U.S. agencies (such as DOE, USAID, EPA and the U.S. Trade and Development Agency) that the MDBs can draw upon to support U.S. agency-approved technical assistance for project planning work, and (b) developing contingency plans and mechanisms for reinforcing, if necessary, the transition in World Bank and other MDB energy-project funding away from conventional energy technologies in favor of clean energy technologies (which is being driven by the ability of reformed energy markets to attract private capital for conventional technologies and the desirability of not distorting these markets with publicly supported MDB funds); and
(2) additional measures implemented by U.S. agencies to facilitate market-based finance of clean and
efficient energy technologies, including creating a fund administered by the Overseas Private Investment Corporation (OPIC) to provide financing for these types of projects (to be phased out as the MDBs complete the transition to supporting clean energy technologies and advancing other public benefits).
Box 3.5: World Bank Policy Mechanisms Encouraging Clean Energy Technologies Several World Bank Group policy mechanisms encourage the deployment of clean energy (including clean
coal) and renewable energy technologies in the context of private-sector international cooperation. For example, the Solar Development Corporation (SDC) is a new program for FY99 with the objective of accelerating growth of off-grid photovoltaic markets. SDC utilizes a combination of financing of private-sector business activity for off-grid photovoltaic applications, plus business advisory, training, and market development services for entrepreneurs. The total funding proposed for this initiative was $50M for FY99. The Photovoltaic Market Transformation Initiative (PVMTI) has a very different purpose, being focused on market barriers faced by private companies in three countries: India, Kenya and Morocco. The goal of PVMTI is to expand these nascent markets to be larger and more sustainable. The program, administered by IFC, solicits proposals and awards them on a competitive basis in amounts ranging from $500,000 to $5M. The IFC-GEF Renewable Energy and Energy Efficiency Fund (REEF) was created, based in part on a feasibility analysis supported by USAID, EPA, DOE and others. This fund, as its name suggests, encompasses a broader array of energy technologies. The REEF is designed to stimulate investment in small, less-than 50 MW projects that use high-investor-risk technologies. The REEF will provide debt and equity for such projects. These and other World Bank Group mechanisms with an energy focus rely to some degree on GEF support at a total of $150M across all such projects. The World Bank estimates the leverage of this financing at roughly $1 billion.
Elaboration: Multilateral Development Banks Energy-sector reform and restructuring are opening energy markets around the world. As these
markets open, private investors and companies are able to earn market returns on their investments in the energy sector. Under these conditions, the capital needed for capacity expansion will flow to these countries from commercial capital markets. This largely removes the rationale for Multilateral Development Bank (MDB) support of conventional energy-supply projects.47 Indeed, MDB financing for conventional energy-supply projects in these restructured markets leads to significant market distortions because MDB financing costs are less than for commercial loans. MDB involvement in conventional
47 “Conventional” here refers to technologies that can attract private sector capital flows and be implemented
without the need for public-sector support.
Powerful Partnerships
3-36
energy projects in countries where energy-sector reforms have not been put in place can similarly be counterproductive by providing subsidized loans that can delay needed sector reform. A key MDB activity should then be to use its financial strengths to accelerate energy-sector reforms while simultaneously phasing out its support of conventional energy-supply technologies.
There remains, however, critical roles for the MDBs in supporting the widespread deployment of advanced clean energy technologies. Commercial investors will often be reluctant to finance these technologies because the technologies are new and unfamiliar to them, or because the technologies require modest price premia in return for significant reduction in environmental impacts that are not fully valued by the market. Also, private investors typically want as rapid a return on their investment as possible with minimal risk; clean energy technologies—often involving higher initial capital costs even if their lifecycle costs are no greater than for conventional technologies—will generally require longer amortization periods that reduce their attractiveness to private investors. As the MDBs drive energy-sector reform forward and phase out their support for conventional energy projects, they should play major roles by helping support: (a) the development of mechanisms to protect public benefits in the new market-oriented competitive environment of the energy sector (including mechanisms that help move advanced clean energy technologies through the RD3 pipeline, as described above); (b) the deployment of advanced clean energy-supply and energy-efficiency technologies that provide significant public benefits that are not adequately valued by the market, or for which deployment is constrained by high transaction costs or other institutional or market barriers such as high initial capital costs; (c) the development of physical and institutional infrastructures that will be compatible with the clean energy technologies of the future, particularly distributed energy systems; and (d) program monitoring and evaluation to track the effectiveness of sector reform and the performance of the Bank in supporting clean energy technologies, and to identify further market or institutional barriers to these technologies and means of addressing them. Interdisciplinary research—complementing the initiative described above—is also needed at the World Bank to improve understanding of how “on-the-ground” dynamics work, strengthen understanding of technology transfer and policy and institutional change, and improve project design.
Some at the MDBs appear to recognize the necessity of this change in focus and several activities have begun (Box 3.5). This Panel strongly encourages this MDB transition from conventional technologies to supporting clean energy technologies. The Panel does not—at the present—believe it is appropriate to establish a specific externally mandated timeline for completing phase-out of support for conventional technologies nor for establishing interim portfolio standards for the percentage of clean energy technology that the MDBs should be supporting. (As part of good management practice, however, the MDBs themselves may wish to set internal targets and timelines for increasing energy-sector lending for clean energy technologies.) Should the MDBs fail to make significant progress towards completing this transition from conventional to clean energy technologies in the next several years, the Panel believes that specific plans for phasing out support for conventional technologies and specific targets in support of clean energy technologies should be established.
Recognizing that the MDBs lack some of the needed technical expertise in these new clean
energy technologies, the Panel: (1) encourages the MDBs to strengthen their internal capabilities48; and (2) recommends that trust funds be established for the MDBs to use in hiring through U.S. Agencies needed national laboratory and private-sector experts to provide the MDBs technical assistance in developing clean energy-technology programs. Specifically, funds should be allocated to DOE, USAID, EPA, USTDA, or other appropriate agencies and made available to the World Bank and other multilateral development banks to support broader technical assistance relating to clean energy technology for
48 For example, this might be done through the formation and/or strengthening of technical units such as the Asia
Alternative Energy Program, which are linked directly with and play a central role in country energy-sector programs. DOE and USAID have provided funding and in-kind assistance to this program.

CHAPTER 3: Foundations of International Cooperation
3-37
programs in developing and transition economies. Some of these funds could be used to conduct project-based feasibility studies; others might be used to support studies that would assess broader issues relating to widespread deployment of particular clean energy technologies in specific countries or regions (estimating market potential, discussing implications of successful deployment, identifying barriers, etc.). Funds could be dispensed through the agencies to the MDBs once projects or markets had been identified as promising. Such a funding mechanism already exists—the USTDA’s “Evergreen” fund is used to assist institutions such as the IFC to fund feasibility studies and for other supports.49 Funding is limited, however, and should be expanded, particularly to include Agency, national laboratory, private sector, university, and NGO expertise.
Box 3.6: The Clean Development Mechanism
At Kyoto, industrialized and developing nations agreed to develop an innovative, market-based approach to promote sustainable development and provide cost-effective reductions of greenhouse gas emissions, although the details of the mechanism have not yet been determined. Called the Clean Development Mechanism (CDM), it might work as follows. A company from an industrialized country could help build a highly efficient plant in a developing country rather than a less efficient plant previously planned. This would result in emissions reductions below what would have been the case without the project investment. Those reductions would be certified as credits, and the developing nation and investing company would then determine how to share the credits. The developing country could acquire technology and capital investment as well as a share of credits it could sell or bank. The company could acquire a share of credits it could use to meet its emissions reduction commitments at home. The CDM will: • assist in achieving sustainable development by providing an incentive for investments in developing countries,
helping those countries toward cleaner energy and economic growth. • allow, in combination with emissions trading and joint implementation, industrialized countries to secure the
most cost-effective emissions reductions wherever they may be found. • promote the diffusion of climate-friendly technologies and create a worldwide market for them. • aid those countries that are most vulnerable to climate change since, under the Protocol, a "share of the
proceeds" from qualifying projects is to be used to assist those countries in meeting the costs of adaptation.
A number of issues must be resolved to make the CDM operational, including determining baselines, verification methods, institutional structures, and allocating project proceeds. The CDM is to be designed to be an efficient, transparent, accountable, and flexible market-based mechanism that ensures cost-effective reductions through public- and private-sector investment in clean energy and carbon sequestration projects. Wherever possible, the CDM should use existing institutions to streamline the process.
Elaboration: OPIC-based Financing
OPIC should—by Administration mandate—establish a loan facility to provide funding for renewable energy (RE) and energy-efficiency (EE) projects.50 This funding would be for eligible investors in such projects. U.S. Government exposure could be ‘capped’ by guaranteeing only a fraction of the loan, or by providing credit guarantees that act to extend the loan repayment period. U.S. government exposure would be limited to the appropriation provided for the partial guarantee. The private 49 TDA maintains trust funds at six multilateral development banks (MDBs): the World Bank, the international
Finance Corporation, the European Bank for Reconstruction and Development, the African Development Bank, the Inter-American Development Bank, and its private-sector arm, the Inter-American Investment Corporation. TDA uses these funds for technical assistance and feasibility studies. Most are known as "Evergreen Funds." That is, through periodic drawdowns and replenishments of existing funds at the banks, TDA maintains a minimum balance at all times so that each fund is readily available to help U.S. businesses take advantage of time-sensitive projects.
50 This initiative and discussion benefited especially from Econergy (1999).
Powerful Partnerships
3-38
sector and other participating financial institutions would be liable for the remainder of the risk, which would total 75-80 percent. Significantly, the private sector would share the risk—indeed to carry the bulk of it. Precedents exist for this targeted type of financial mechanism in the activities of the World Bank and its International Finance Corporation (IFC).
OPIC is considered to be the U.S. institution with the most experience with this type of guarantee mechanism, and could dispense these funds directly, perhaps by pooling or ‘bundling’ the credit-line requirements of numerous RE and EE projects in order to reduce the transaction costs associated with small-scale projects. In addition, OPIC might choose to work with other financial institutions that have already set up bundled credit lines for RE and EE projects.51 In each case, the risks and assets of all the projects are pooled or bundled, and therefore OPIC would be able to offer the credit backing at lower cost (lower interest rates) than would be available for individual small-scale projects. The purpose of this new instrument would be to "create the market," that is, to get the market going, and the cost of doing so would be covered in part by charging fees for the use of the guarantee. The program should therefore be phased out after five years or so of operation in a particular market.
The fund would provide selected risk mitigation instruments for private or joint public-private development of renewable energy and energy-efficiency projects internationally, and help reduce the high transaction costs associated with small-scale energy projects. This, in conjunction with other mechanisms such as CETO, could significantly increase the market penetration of small-scale renewable energy or energy-efficiency projects in restructured markets. This could also help balance the OPIC portfolio, which is now weighted towards fossil energy technologies. Important Initiative: Technical, Financial, & Feasibility Analysis Assistance for U.S. Firms
Goal: To provide additional measures implemented by U.S. agencies to facilitate market-based finance
of clean and efficient energy technologies.
U.S. Actions (1) Establish a program of grants for feasibility studies, project planning, and other technical assistance
for energy-efficiency and renewable energy projects in developing and transition economies, dispensed by USTDA, USAID, EPA, and DOE (as a complement to the technical assistance funds dispensed through the multilateral development banks; see Multilateral Development Bank initiative above).
The OPIC-based financing support identified above should be complemented by grants dispensed
through USTDA, USAID, or DOE to provide technical assistance, finance project-development plans, or fund feasibility studies. Funds in these agencies could be used to provide grants to U.S.-based firms
51 A successful example of a line of credit is one created in the United States by Proven Alternatives Capital
Corporation (PACC), a San Francisco-based company. PACC developed a $30 million line of credit with Banque Paribas to finance targeted investments in commercial, industrial, and institutional energy efficiency programs and projects. The pool of capital is non-recourse, with the collateral for each project’s financing limited to the physical assets, contracts and cash flow of the project. The fund pools many projects into one portfolio, thereby increasing the credit strength of the overall portfolio and reducing the interest rate. PACC’s role includes fund administration, loan documentation, structuring customer contracts, and negotiating non-standard approvals. The minimum project size is $1 million, and $5 million is the maximum size.

CHAPTER 3: Foundations of International Cooperation
3-39
participating in international renewable energy or energy-efficiency projects; these grants could be used to develop project plans, conduct feasibility studies, or offset the high transaction costs associated with securing lending. FILLING THE GAPS
The above initiatives, together with increasing support from the trade agencies for advanced clean energy technologies—a trend that this Panel strongly endorses—can help bridge the gaps in the innovation pipeline and establish a strong environment for market-driven advanced clean energy-technology development and deployment. This is indicated in Figure 3.7.
In addition to the development assistance activities of USAID and the financial mechanisms
discussed above in terms of the Multilateral Development Banks and the partial loan guarantee fund, the trade agencies—Department of Commerce, Export-Import Bank, Overseas Private Investment Corporation, and Trade and Development Agency—play an extremely valuable role in assisting the export of U.S. energy technologies. In the last several years these agencies have become much more proactive in supporting clean energy technologies. This is very important and the Panel strongly encourages further efforts in support of clean energy-technology exports together with improved linkages with DOE, EPA, and USAID, and greater consideration of the broader strategic role the Trade Agencies can play in moving advanced clean energy technologies through the innovation pipeline.
Proposals for “filling the gaps”
DOE/EPA AID
USAID/DOE/EPATrade Agencies
GEF
MDBs
CETO (via GEF)DSF (GEF or in-country)
Value Chain
Lab/Bench scale PilotsSmall
Medium
Commercial scale$/unit
MW/plant
# of units deployed
Research & Development Demonstration Buy-down Widespread Deployment
Figure 3.7: Filling the "Gaps" In The Innovation Pipeline. This figure illustrates how the initiatives described in this chapter can plug the gaps in the innovation pipeline. This includes greater use of agency support of R&D and demonstration technical assistance; the DSF and CETO for clean energy technology demonstration and buy-down; the MDBs through the shift from conventional to clean energy technologies and retail finance for widespread deployment; DOE/EPA/USAID/TDA to provide technical assistance to the MDBs as they transition to supporting clean energy technologies; USAID/DOE/EPA and others to assist in capacity and market conditioning in the host country; and the Trade Agencies in support of clean energy technology exports. Darker shading indicates more vigorous activity by the relevant institution.

Powerful Partnerships
3-40
BOX 3.7: TIED AID Tied aid— in which government-to-government financing is reciprocally tied to the purchase of goods—
began as a significant trade barrier to U.S. exporters in the early 1980s. Since that time, the deployment of energy technologies in developing countries has provided a platform for certain industrial nations to use tied-aid as a means of dominating rapidly expanding energy markets such as wind and solar-photovoltaic energy. Recognizing the trade-distorting impact of such practices, the 1992 agreement amongst OECD countries, known as the Helsinki Package sought to eliminate tied aid in those instances where the project in question would be commercially viable. Nations that wish to carry out tied-aid agreements must report it to the OECD's Tied Aid Consultations Group. Other nations can offer challenges to whether a project is being appropriately labeled as non-commercially viable. To date, this group has culled 58 of 114 challenged projects as inappropriate for tied aid on this basis.
Notwithstanding such progress and in contrast to it, the example of wind energy exports to India from Denmark provides a case study of how devastatingly effective tied-aid can be in blocking U.S. exporters. Danish manufacturers of wind turbines benefited from a 1988 tied-aid agreement (a grant of $30 million) that led to further joint ventures between Danish and Indian companies. By 1994, almost all of the newly installed 180 MW of wind capacity in India went to Danish companies.a China's market for wind turbines raises the specter of a repeat outcome; to date nearly all of the 247 MW of installed capacity can be linked to tied-aid soft loans and grants.
The United States has attempted to fight tied-aid in general by matching the concessionary financing
offered by foreign competitors through the Ex-Im Bank and "war chests" provided by Congress. For example, Ex-Im bank has established a Tied Aid Capital Projects Fund that offers financing packages matching the concessional packages of tied-aid projects and that had budgetary resources of $341 million in 1998. While important, this approach to fighting tied aid is difficult to administer, particularly for many renewable and other small-scale technologies. What is then needed is a generic approach to fighting tied-aid, particularly as the number of small-scale projects increases.
There remains a problem in the case of innovative clean energy technologies that are not yet commercially
viable and so are not considered under the Helsinki tied-aid provisions. Such technologies need support to buy them down the learning curve to commercial viability, but when foreign competitors do this through tied aid and the United States does not, U.S. manufacturers are severely disadvantaged.
The CETO organized under GEF and the MDBs could help level the playing field for U.S. manufacturers
and buy down the cost of these technologies, while at the same addressing in a generic manner the U.S. government dilemma of opposing tied aid here and abroad, but at the expense of U.S. firms. At the same time, it is important to ensure that these actions are designed to contribute to the development of local capacity and markets—in contrast to tied aid which can often distort and damage local market development.
a PERI (1995)
Any discussion of trade quickly leads to the "tied aid" issue. U.S. manufacturers strongly
expressed their frustrations to the Panel concerning foreign tied aid practices, such as providing below-market-rate financial support to that country’s products. The Panel does not support the use of tied aid, but does acknowledge the difficult situation that U.S. manufacturers are placed in by foreign tied aid. Responding to foreign tied aid requires a more proactive and aggressive effort, particularly in the case of small-scale energy-efficiency and renewable energy projects that are small, dispersed, and difficult to track.
The innovation pipeline proposed by the Panel embeds within it mechanisms to reduce use of tied aid. In particular, under open competitive bidding processes the MDBs exclude explicit tied aid practices. Thus, by making use of mechanisms such as the DSF and CETO, U.S. companies can potentially access a mechanism that levels the playing field for them and gives them a fair chance of moving their innovative
CHAPTER 3: Foundations of International Cooperation
3-41
technologies through the innovation pipeline. This also enables developing and transition countries to access the most cost-effective high-performance technologies available and avoids donor tied aid that can lead to use of lower quality equipment. Such equipment can prematurely fail or require excessive and expensive maintenance and parts. Issues of tied aid are discussed in Box 3.7.
Standards can also play a significant strategic role in trade (Box 3.8). A number of countries have used standards as a competitive weapon by working with host countries and trying to implement standards that will be favorable to their equipment and lock out the equipment of competitors. Developing countries need to be sensitive to the standards issue to protect their interests. Standards are needed that encourage open competitive markets, minimize waste, and provide other benefits.
Box 3.8: International Standards and Conformity Assessment Procedures International standards are an essential tool for a country to ensure that imported energy technologies
conform to necessary technical specifications, yet in many instances can also pose a substantial barrier to U.S. exports.a Across all U.S.export markets, international technical standards are estimated to impede the sale of $20 billion to $40 billion of U.S.goods and services.b The international community has taken positive steps towards curbing the abuse of standards. The General Agreement on Trade and Tariffs contains an Agreement on Technical Barriers to Trade (Annex 1a) that endorses the broad principles necessitated if technical standards are to serve their useful purpose and establishes practices and safeguards to that end. Implementation, however, is on a case-by-case, country-by-country basis. In the case of Japan, the United States has sought to eliminate such barriers through negotiation, for example through the US-Japan Initiative on Deregulation and Competition of June, 1997. The Energy Working Group enumerated several Japanese regulations that impede the sale of U.S.equipment and services, including regulations for approval and inspection, for increasing capacity of existing power plants, and certification of stand-by generators. In addition, the United States has requested that Japan sign the 1998 Global Agreement for harmonization of technical regulations for motor vehicles, which include energy conservation, and pressed Japan to accelerate its efforts to adopt performance-based regulations. With an eye toward the Far East as a whole, at the November, 1997 APEC Leader’s meeting the United States, Japan and 16 others endorsed a program of accelerated trade liberalization, which included the energy sector.
Conformity testing of products upon entry into a country can also be manipulated as a trade barrier when the importing country will not accept the U.S. exporter’s certification of compliance with relevant technical standards. Such is the case in Taiwan, where U.S. exports of air conditioning and refrigeration equipment must be tested for energy-efficiency and capacity before clearing customs.a
The rapid expansion of demand for energy technologies in developing countries heightens the possible damage of trade barriers as U.S. firms vie for these markets. A shift to performance-based standards that would allow the marketplace to determine which of a number of competing technical standards to use, would help reduce the abuse of standards as technical barriers to trade. Performance-based standards would be particularly applicable in the case of energy technologies, especially in a future necessitating rapid technological innovation to meet the economic, environmental, and national security challenges identified in this report. c
a USTR (1999) b Mallet (1998) c Nelson Milder, ASME, personal communication, April 1999.

Powerful Partnerships
3-42
CLOSE
The actions and mechanisms described in this chapter—capacity building, energy-sector reform that advances public benefits—and financing, build the foundation for a coherent and strategic energy-technology innovation pipeline. The next two chapters identify high leverage ERD3 opportunities that can benefit from these actions and mechanisms.
CHAPTER 3: Foundations of International Cooperation
3-43
REFERENCES Acker and Kammen 1996: R. Acker and D.M. Kammen, “The Quiet (Energy) Revolution: The Diffusion of Photovoltaic Power Systems in Kenya,” Energy Policy, Vol. 24 (1996), pp. 81-111. Albavera 1995: Fernando Sanchez Albavera, “Globalization and Restructuring the Energy Sector in Latin America,” Cepal Review (August 1995). Argote and Epple 1990: Linda Argote and Dennis Epple, “Learning Curves in Manufacturing”, Science, Vol. 247 (23 February 1990), pp.920-924. Byrne et al. 1998: J. Byrne, B. Shen, and W. Wallace, “The Economics of Sustainable Energy for Rural-Development: A Study of Renewable Energy in Rural China,” Energy Policy, Vol. 26 (1998), pp. 45-54. Chantramonklasri 1990: N. Chantramonklasri, “The Development of Technological and Managerial Capability in the Developing Countries,” in M. Chatterji, ed., Technology Transfer in the Developing Countries (London: The MacMillan Press, Ltd.), pp. 36-50. Duke and Kammen 1999: Richard Duke and Daniel M. Kammen, “The Economics of Energy Market Transformation Programs,” The Energy Journal, in press. Econergy 1999: Econergy International Corporation, Financing Renewable Energy and Energy Efficiency Projects in International Markets, Paper prepared for the PCAST Panel on International Cooperation in Energy RD3 (February 1999). ESMAP 1996: Energy Sector Management Assistance Programme, Symposium on Power Sector Reform and Efficiency Improvement in Sub-Saharan Africa, Johannesburg, December 5-8, 1995, Report 182/96 (World Bank and UNDP, June 1996). Fulkerson et al. 1999: William Fulkerson, Mark D. Levine, Robert N. Schock, and Thomas J. Wilbanks, Developing Country Partnerships for Environmental Energy Technology Research, Development, Demonstration and Deployment (RD3), Paper prepared for the PCAST Panel on International Cooperation in Energy RD3 (February 1999). Geller 1991: H. Geller, Efficient Electricity Use: A Development Strategy for Brazil (Washington, DC: American Council for an Energy-Efficient Economy, 1991). Geller et al. 1999: H. Geller, G. Pimentel, J.A. Medeiros, and A. Pinhel. Update on Brazil’s National Electricity Conservation Program (PROCEL) (Washington, DC: American Council for an Energy-Efficient Economy, 1999). Girod and Percebois 1998: Jacques Girod and Jacques Percebois, “Reforms in Sub-Saharan Africa’s Power Industries,” Energy Policy, Vol. 26, No. 1 (1998), pp. 21-32. Grandmaison 1998: Joseph Grandmaison, Trade and Development Agency, personal communication to PCAST Panel on International Cooperation in Energy RD3 (November 20, 1998). Gray 1995: Dale Gray, “Reforming the Energy Sector in Transition Economies,” World Bank Discussion Paper (1995).

Powerful Partnerships
3-44
IIASA/WEC 1995: International Institute for Applied Systems Analysis and World Energy Council Global Energy Perspectives to 2050 and Beyond (Laxenburg, Austria and London, UK: 1995). Kammen 1996: D.M. Kammen, “Household Power in a New Light: Policy Lessons, and Questions, for Photovoltaic Technology in Africa,” Tiempo: Global Warming and the Third World, Vol. 20 (1996), pp. 1-8. Kammen and Dove 1997: D.M. Kammen and M.R. Dove, “The Virtues of Mundane Science”, Environment Vol. 39, No. 6 (1997), pp. 10-15. Kammen 1999: D.M. Kammen, Building Institutional Capacity for Small-Scale and Decentralized Energy Research, Development, Demonstration, and Deployment (ERD3) in the South. Paper prepared for the PCAST Panel on International Cooperation in Energy RD3 (February 1999). Karekezi and Turyareeba 1995: S. Karekezi and P. Turyareeba, “Woodstove Dissemination in Eastern Africa-a Review,” Energy for Sustainable Development, Vol. 1, No. 6 (1995), pp. 12-19. Kozloff 1998: Keith Kozloff, Electricity Sector Reform in Developing Countries: Implications for Renewable Energy, Renewable Energy Policy Project Research Report, No.2 (April 1998). Kozloff et al. 1998: Keith Kozloff et al., The Environmental Implications of Power Sector Reform in Developing Countries, U.S. Agency for International Development, Office of Energy, Environment, and Technology, Report No. 98-05, March 1998. Kushler 1998: M. Kushler, An Updated Status Report of Public Benefit Programs in an Evolving Electric Utility Industry. (Washington, DC: American Council for an Energy-Efficient Economy, 1998). Mallet 1998: Robert Mallet, "Why Standards Matter", Issues in Science and Technology (Winter 1998-99). NARUC 1988: National Association of Regulatory Commissioners, Least Cost Utility Planning Handbook for Public Utilities Commissioners (Washington, DC: 1988). Ogden 1996: D. Ogden, Boosting Prosperity: Reducing the Threat of Global Climate Change Through Sustainable Energy Investments (San Francisco, CA: The Energy Foundation, 1996), pp. 14-16. OTA 1993: U.S. Congress, Office of Technology Assessment, Energy Efficiency Technologies for Central and Eastern Europe, OTA-E-562 (Washington, DC: U.S. Government Printing Office, May 1993). OTA 1995: U.S. Congress, Office of Technology Assessment, Renewing Our Energy Future, OTA-ETI-614 (Washington, DC: U.S. Government Printing Office, September 1995). Padmanabhan 1999: Personal communication with Mr. Srinivasan Padmanabhan, Asia Alternative Energy Unit, The World Bank (Washington, DC: March 5, 1999). Parthasarathi 1998: A. Parthasarathi, “India’s Transition to a Sustainable Energy Base,” The Sustainable Energy Industry Journal (1998).
CHAPTER 3: Foundations of International Cooperation
3-45
PCAST 1997: President’s Committee of Advisors on Science and Technology, Federal Energy Research and Development for the Challenges of the Twenty-First Century (Washington, DC: Office of Science and Technology Policy, November 1997). PERI 1995: Princeton Economic Research, Inc., Government Export Assistance Available to European Wind Turbine Manufacturers: an analysis of guidelines for export assistance and examples of application by the wind power industries of Germany, Denmark, and the Netherlands, Report to the National Renewable Energy Laboratory, DRAFT (March 24, 1995). Rabl and Dreicer 1999: A. Rabl, and M. Dreicer. “Health and Environmental Impacts of Energy Systems,” International Journal of Global Energy Issues (in press). Reddy et al. 1997: Reddy, A.K.N., R.H. Williams, and T.B. Johansson 1997. Energy After Rio: Prospects and Challenges (New York: UNDP, 1997), pp. 138-139. Schramm 1993: Gunter Schramm, “Issues and Problems in the Power Sectors of Developing Countries,” Energy Policy (July 1993), pp. 735-747 Smith et al. 1993: K.R. Smith, G. Shuhua, K. Kun, and Q. Daxiong, “100 Million Biomass Stoves in China: How Was It Done?” World Development, Vol. 18 (1993), pp. 941-961. Spadaro et al. 1998: J.V Spadaro, A. Rabl, E. Jourdain, and P. Coussy, External Costs Of Air Pollution: Case Study And Results For Transport Between Paris And Lyon. International Journal of Vehicle Design, Vol. 20 (1998), pp. 274-282. Spadaro and Rabl 1998: J.V. Spadaro and A. Rabl, Social Costs and Environmental Burdens of Transport: an Analysis Using Two Case Studies in France, unpublished manuscript (October 1998). STAP 1996: Scientific and Technical Advisory Panel, Global Environment Facility, International Industrial Collaboration for Accelerated Adoption of Environmentally Sound Energy Technologies in Developing Countries: Potential Roles for the Global Environment Facility in Supporting the Requisite Targeted Research and Technological Capacity-Building, (Washington, DC: STAP, 16 September 1996). USAID (no date): The Success of Private Power in Central America: USAID’s Role, Center for Environment, Bureau for Global Programs (Washington, DC: U.S. Agency for International Development). U.S. Department of State 1999: U.S. Department of State, Bureau of Oceans and International Environmental and Scientific Affairs, United States submissions to the Subsidiary Body for Scientific and Technological Advice (SBSTA) of the United Nations Framework convention on Climate Change (FCCC), “Programs for Technology Transfer (March 15, 1999). USTR 1999: United States Trade Representative, “1999 National Trade Estimate Report on Foreign Trade Barriers (NTE)” http://www.ustr.gov Wilson 1996: John S. Wilson, The New Trade Agenda: Technology, Standards, and Technical Barriers (Washington, DC: School of Advanced International Studies, Johns Hopkins University, 1996). WRI 1998: Patsy Stoneman, ed., World Resources Institute, World Resources 1998-99 (New York: Oxford University Press, 1998), pp. 3 7-93.

Powerful Partnerships
3-46
World Bank 1998: The World Bank, Environment and Energy, Mining and Telecommunications Departments, Fuel for Thought: A New Environmental Strategy for the Energy Sector, draft (Washington DC: October 22, 1998). World Bank 1998: The World Bank, World Development Report 1998/99: Knowledge for Development (Oxford University Press, 1998). World Bank 1999: The World Bank, Global Environmental Coordination Unit, “World Bank Group/Global Environment Facility: Strategic Partnership for Renewable Energy,” A Note prepared for the GEF Council Meetings, May 5-7, 1999 (Washington, DC: May 4,1999).

4-1
CHAPTER 4 EFFICIENT END-USE TECHNOLOGIES
We are in the middle of the industrial revolution. We had better be; we have much to set right.
Jacob Bronowski1
fficient energy use helps satisfy basic human needs and powers economic development. The industrialized world depends on massive energy flows to power factories, fuel transport, and heat, cool, and light homes, and must grapple with the environmental and security dilemmas this use
causes. These energy services are fundamental to a modern economy. In contrast, many developing country households are not yet heated or cooled. Some two billion people do not yet have access to electric lighting or refrigeration. The Chinese enjoy less than one-tenth as much commercial energy per person as do Americans, and Indians use less than one-thirtieth as much (Table 1.1). Raising energy use of today’s world population to only half that of the average American would nearly triple world energy demand. Such growth in per capita energy use coupled with an increase by over 50 percent in world population over the next half-century and no improvement in energy efficiency would together increase global energy use more than four times. Using conventional technologies, energy use of this magnitude would generate huge demands on energy resources, capital, and environmental resources—air, water, and land.
Energy-efficient technologies can cost-effectively moderate those energy supply demands.2 For example, one study found that investments in currently available technologies for efficient electric power use could reduce initial capital costs by 10 percent, life cycle costs by 25 percent, and electricity use by nearly 50 percent compared to the current mix of technologies in use.3 Modest investments in efficient end-use technologies lead to larger reductions in the need for capital-intensive electricity generation plants. Conversely, when unnecessary power plants and mines are built, less money is available for factories, schools, and health care. In the language of economics, there is a large opportunity cost associated with energy inefficiency. It is both an economic and environmental imperative that energy needs be satisfied effectively. Incorporating energy-efficiency measures as economies develop can help hold energy demand growth to manageable levels, while reducing total costs, dependence on foreign sources of energy, and impacts on the environment.
This chapter considers energy end-use technologies and barriers impeding their development and use. Two time periods are examined: the first extends over the next two decades when commercial but underutilized technology could penetrate emerging markets; the second stretches into the longer-term when the full potential of existing technologies has been realized and new technologies that are developed
1 Bronowski (1974) 2 Worrell et al. (1997a) 3 OTA (1992)
Powerful Partnerships
4-2
over this period can be deployed to provide further improvements. Our policy focus in this chapter includes market distortions created by governments in emerging markets, subsidies provided to promote energy supply-trade and development, and a variety of market imperfections that inherently limit full use of cost-effective energy-efficiency technologies.
The global shift towards open, competitive markets is reducing direct market subsidies and
distortions. Nevertheless, inherent market imperfections and inefficiencies will limit the deployment of energy-efficiency technologies to less than their cost-effective potential even with the reduction of direct market subsidies (Table 4.1). As energy-sector reform and restructuring takes place, it is essential that mechanisms to encourage cost-effective efficiency improvements be built into the new structure. Mechanisms for addressing some of these market challenges are described in Chapter 3 and below.
The rapid economic growth in the developing world over the next decades can create a strong
environment for technological innovation.4 Markets for energy-intensive basic materials are growing only slowly in the industrialized countries, but are growing rapidly in developing countries as they build their infrastructures of buildings, factories, and roads. Markets for consumer goods and the factories that produce them will likewise grow faster in developing countries than in industrial countries over the next several decades. With this rapid growth and the construction of new factories and equipment, there is a great opportunity to develop and introduce innovative technologies that can significantly reduce energy use, economic costs, and environmental impacts. U.S. firms can either help develop these technologies in partnership with other countries and participate in this transition, or risk facing competition from these technologies and products in the future as they flow into the United States from other markets. WHAT IS AT STAKE?
The market has not come close to exploiting the full technical potential for energy efficiency. Current practice uses energy perhaps only one-tenth as efficiently as is technically possible over the long-term.5 But energy end-use efficiency is limited by market barriers and market distortions, higher costs for very efficient (but usually immature) technologies, and technology development. PCAST 1997 recommended to the President that the United States set goals of doubling and tripling the fuel economy of light trucks and passenger cars, respectively, and reducing energy use in new buildings by 70 percent by 2030. This PCAST panel recommends that the President launch an initiative to cooperate with other countries to cut global energy demand growth to half of business-as-usual levels over the next five decades.
Energy projections such as those described in Chapter 1 indicate differences in projected energy demand in 2050 between the high and low scenarios of a staggering 450 exajoules (Figure 1.2), about the same as total world energy demand today. That is the equivalent oil output of 25 Saudi Arabias (at 1995 production levels), or the coal production of fifteen Chinas (1995 production levels). The difference between these projections is substantially due to differing assumptions about deployment of energy-efficient technologies.
Ironically, energy is most often wasted where it is most precious. Developing and transition economies such as China, the world’s second largest energy consumer, use much more energy to produce a ton of industrial material than modern market economies (see Table 4.2). Developing-nation
4 Note that a number of other factors are also important in creating a favorable environment for innovation,
including the availability of skilled labor, financing, material resources, and sound government policies. 5 See Gibbons and Chandler (1981), Ayres (1989).
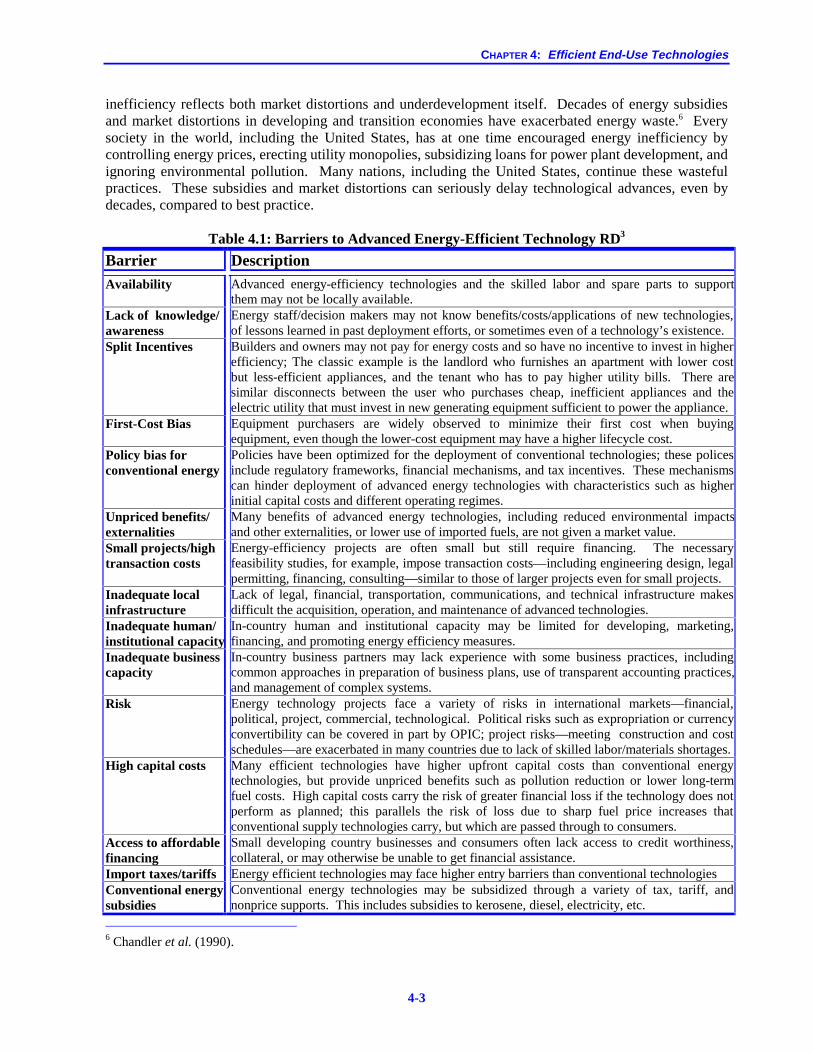
CHAPTER 4: Efficient End-Use Technologies
4-3
inefficiency reflects both market distortions and underdevelopment itself. Decades of energy subsidies and market distortions in developing and transition economies have exacerbated energy waste.6 Every society in the world, including the United States, has at one time encouraged energy inefficiency by controlling energy prices, erecting utility monopolies, subsidizing loans for power plant development, and ignoring environmental pollution. Many nations, including the United States, continue these wasteful practices. These subsidies and market distortions can seriously delay technological advances, even by decades, compared to best practice.
Table 4.1: Barriers to Advanced Energy-Efficient Technology RD3
Barrier Description Availability Advanced energy-efficiency technologies and the skilled labor and spare parts to support
them may not be locally available. Lack of knowledge/ awareness
Energy staff/decision makers may not know benefits/costs/applications of new technologies, of lessons learned in past deployment efforts, or sometimes even of a technology’s existence.
Split Incentives Builders and owners may not pay for energy costs and so have no incentive to invest in higher efficiency; The classic example is the landlord who furnishes an apartment with lower cost but less-efficient appliances, and the tenant who has to pay higher utility bills. There are similar disconnects between the user who purchases cheap, inefficient appliances and the electric utility that must invest in new generating equipment sufficient to power the appliance.
First-Cost Bias Equipment purchasers are widely observed to minimize their first cost when buying equipment, even though the lower-cost equipment may have a higher lifecycle cost.
Policy bias for conventional energy
Policies have been optimized for the deployment of conventional technologies; these polices include regulatory frameworks, financial mechanisms, and tax incentives. These mechanisms can hinder deployment of advanced energy technologies with characteristics such as higher initial capital costs and different operating regimes.
Unpriced benefits/ externalities
Many benefits of advanced energy technologies, including reduced environmental impacts and other externalities, or lower use of imported fuels, are not given a market value.
Small projects/high transaction costs
Energy-efficiency projects are often small but still require financing. The necessary feasibility studies, for example, impose transaction costs—including engineering design, legal permitting, financing, consulting—similar to those of larger projects even for small projects.
Inadequate local infrastructure
Lack of legal, financial, transportation, communications, and technical infrastructure makes difficult the acquisition, operation, and maintenance of advanced technologies.
Inadequate human/ institutional capacity
In-country human and institutional capacity may be limited for developing, marketing, financing, and promoting energy efficiency measures.
Inadequate business capacity
In-country business partners may lack experience with some business practices, including common approaches in preparation of business plans, use of transparent accounting practices, and management of complex systems.
Risk Energy technology projects face a variety of risks in international markets—financial, political, project, commercial, technological. Political risks such as expropriation or currency convertibility can be covered in part by OPIC; project risks—meeting construction and cost schedules—are exacerbated in many countries due to lack of skilled labor/materials shortages.
High capital costs Many efficient technologies have higher upfront capital costs than conventional energy technologies, but provide unpriced benefits such as pollution reduction or lower long-term fuel costs. High capital costs carry the risk of greater financial loss if the technology does not perform as planned; this parallels the risk of loss due to sharp fuel price increases that conventional supply technologies carry, but which are passed through to consumers.
Access to affordable financing
Small developing country businesses and consumers often lack access to credit worthiness, collateral, or may otherwise be unable to get financial assistance.
Import taxes/tariffs Energy efficient technologies may face higher entry barriers than conventional technologies Conventional energy subsidies
Conventional energy technologies may be subsidized through a variety of tax, tariff, and nonprice supports. This includes subsidies to kerosene, diesel, electricity, etc.
6 Chandler et al. (1990).

Powerful Partnerships
4-4
Underdevelopment, or poverty, can accentuate consumer focus on initial price rather than life-cycle value. Buyers of appliances, vehicles, and even factories and power plants will often minimize their first costs, not the life-cycle cost of purchasing and operating an energy-consuming product.7 Such choices often lead to the purchase of low efficiency, high emissions technologies due to their low first cost. In turn, the low efficiency technologies require much more energy supply, which forces heavy capital investment in the energy-supply sector. The high emissions impose heavy health costs on society.
Market distortions and poverty combine to discourage energy efficiency improvements
throughout the market place. Subsidized energy prices have reduced the incentive to purchase high efficiency equipment. Poverty reduces the availability of and access to retail credit to finance energy efficient equipment and increases the risk (real or perceived) that consumers will be unable to repay such loans. Government instability raises costs or deters investors from investing in modern plants and equipment, including energy efficiency and other technical improvements. Technical weaknesses, such as frequent power system brownouts and blackouts, voltage instability, and other factors can deter use of high-efficiency equipment designed for more stable operating conditions. The development of equipment to better meet the operating conditions in developing countries has been slow as these countries have invested relatively little in R&D, and their historically lower technology demand levels have limited their market power to define the capabilities of products developed for the global market. Further, some western nations have also distorted emerging country energy markets with financial subsidies and technical assistance intended to promote their products in energy supply—thus unintentionally discouraging energy efficiency. The worldwide shift to more open, competitive markets will reduce some of the distortions on the supply side, but will do little to change the inherent market barriers on the demand side (Table 4.1). As discussed in Chapter 3, with sector reform it is essential to build into these new structures mechanisms such as integrated resource planning and demand-side management that can help balance investment across the supply and demand sides to be as cost effective as possible. Some of these mechanisms are discussed below.
China, India, Brazil, Russia, and other developing and transition economies are building homes and factories with out-of-date technology, but which will be used for many decades. In cold northern China and Western Siberia, for example, apartments are built with low thermal integrity, leaky windows, and are equipped with appliances half as efficient as American ones. Developing nations thus build in excessive costs, lock out environmental protection, and diminish their own development potential.
Table 4.2: Chinese Industry Remains Energy Inefficient
Items Chinaa Western Levelb China/West
Steel Production, (kgce/ton) 990-1250d 610-780e 1.6 Cement Production, (kgce/ton) 210 135 1.5 Ammonia Production, (kgce/ton) 2,070 1,000 2.1 Ethylene Production, (kgce/ton) 1,600 870 1.8 Thermal Power Generation c (gce/kWh) 420 330 1.3
Notes: Values have been rounded off to 2+ significant figures. (a) 1990 levels; (b) primarily 1980 Japanese levels; (c) values are 1994 levels; (d) Hu et al. (1998) cites an average value for steel making of 1,245 kgce/ton for 1995; (e) Hu (1998) cites values of 732 for Germany and 782 for the United States. Worrell et al. (1997b) also provides a cross-sectoral comparison of energy use in the iron and steel industry for Brazil, China, France, Germany, Japan, Poland, and the United States that indicates higher levels of energy use in China than the other countries, even with substantial gains in efficiency. Principal sources: World Bank, (1993); Chinese Energy Development Report (1997).
7 IPCC (1996)
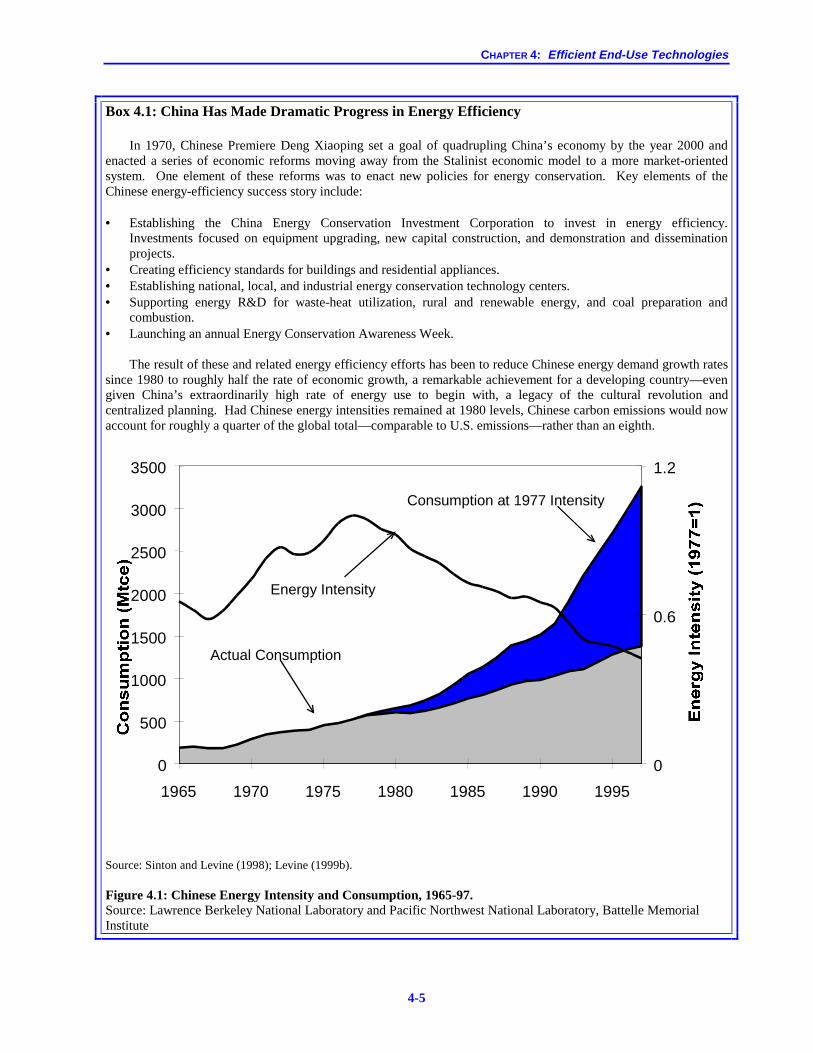
CHAPTER 4: Efficient End-Use Technologies
4-5
Box 4.1: China Has Made Dramatic Progress in Energy Efficiency
In 1970, Chinese Premiere Deng Xiaoping set a goal of quadrupling China’s economy by the year 2000 and enacted a series of economic reforms moving away from the Stalinist economic model to a more market-oriented system. One element of these reforms was to enact new policies for energy conservation. Key elements of the Chinese energy-efficiency success story include: • Establishing the China Energy Conservation Investment Corporation to invest in energy efficiency.
Investments focused on equipment upgrading, new capital construction, and demonstration and dissemination projects.
• Creating efficiency standards for buildings and residential appliances. • Establishing national, local, and industrial energy conservation technology centers. • Supporting energy R&D for waste-heat utilization, rural and renewable energy, and coal preparation and
combustion. • Launching an annual Energy Conservation Awareness Week.
The result of these and related energy efficiency efforts has been to reduce Chinese energy demand growth rates since 1980 to roughly half the rate of economic growth, a remarkable achievement for a developing country—even given China’s extraordinarily high rate of energy use to begin with, a legacy of the cultural revolution and centralized planning. Had Chinese energy intensities remained at 1980 levels, Chinese carbon emissions would now account for roughly a quarter of the global total—comparable to U.S. emissions—rather than an eighth.
0
500
1000
1500
2000
2500
3000
3500
1965 1970 1975 1980 1985 1990 1995
0
0.6
1.2
Actual Consumption
Energy Intensity
Consumption at 1977 Intensity
Source: Sinton and Levine (1998); Levine (1999b).
Figure 4.1: Chinese Energy Intensity and Consumption, 1965-97. Source: Lawrence Berkeley National Laboratory and Pacific Northwest National Laboratory, Battelle Memorial Institute
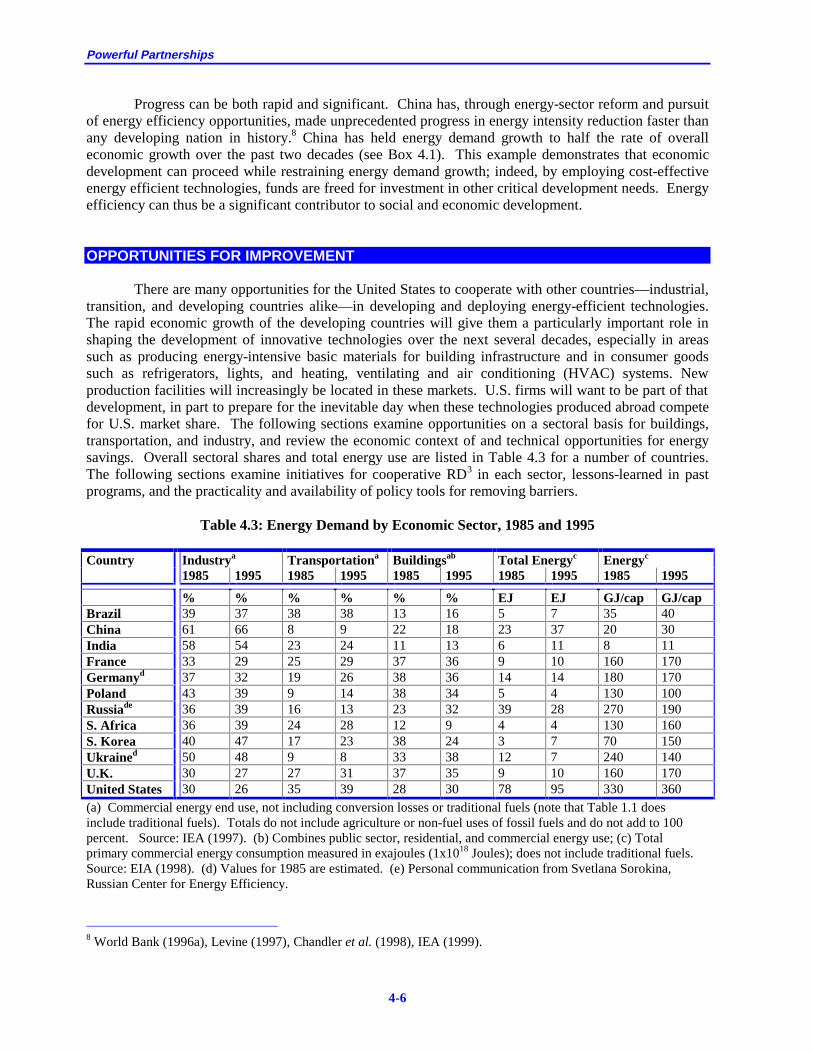
Powerful Partnerships
4-6
Progress can be both rapid and significant. China has, through energy-sector reform and pursuit of energy efficiency opportunities, made unprecedented progress in energy intensity reduction faster than any developing nation in history.8 China has held energy demand growth to half the rate of overall economic growth over the past two decades (see Box 4.1). This example demonstrates that economic development can proceed while restraining energy demand growth; indeed, by employing cost-effective energy efficient technologies, funds are freed for investment in other critical development needs. Energy efficiency can thus be a significant contributor to social and economic development.
OPPORTUNITIES FOR IMPROVEMENT
There are many opportunities for the United States to cooperate with other countries—industrial, transition, and developing countries alike—in developing and deploying energy-efficient technologies. The rapid economic growth of the developing countries will give them a particularly important role in shaping the development of innovative technologies over the next several decades, especially in areas such as producing energy-intensive basic materials for building infrastructure and in consumer goods such as refrigerators, lights, and heating, ventilating and air conditioning (HVAC) systems. New production facilities will increasingly be located in these markets. U.S. firms will want to be part of that development, in part to prepare for the inevitable day when these technologies produced abroad compete for U.S. market share. The following sections examine opportunities on a sectoral basis for buildings, transportation, and industry, and review the economic context of and technical opportunities for energy savings. Overall sectoral shares and total energy use are listed in Table 4.3 for a number of countries. The following sections examine initiatives for cooperative RD3 in each sector, lessons-learned in past programs, and the practicality and availability of policy tools for removing barriers.
Table 4.3: Energy Demand by Economic Sector, 1985 and 1995
Country Industrya Transportationa Buildingsab Total Energyc Energyc 1985 1995 1985 1995 1985 1995 1985 1995 1985 1995
% % % % % % EJ EJ GJ/cap GJ/cap Brazil 39 37 38 38 13 16 5 7 35 40 China 61 66 8 9 22 18 23 37 20 30 India 58 54 23 24 11 13 6 11 8 11 France 33 29 25 29 37 36 9 10 160 170 Germanyd 37 32 19 26 38 36 14 14 180 170 Poland 43 39 9 14 38 34 5 4 130 100 Russiade 36 39 16 13 23 32 39 28 270 190 S. Africa 36 39 24 28 12 9 4 4 130 160 S. Korea 40 47 17 23 38 24 3 7 70 150 Ukrained 50 48 9 8 33 38 12 7 240 140 U.K. 30 27 27 31 37 35 9 10 160 170 United States 30 26 35 39 28 30 78 95 330 360 (a) Commercial energy end use, not including conversion losses or traditional fuels (note that Table 1.1 does include traditional fuels). Totals do not include agriculture or non-fuel uses of fossil fuels and do not add to 100 percent. Source: IEA (1997). (b) Combines public sector, residential, and commercial energy use; (c) Total primary commercial energy consumption measured in exajoules (1x10¹⁸ Joules); does not include traditional fuels. Source: EIA (1998). (d) Values for 1985 are estimated. (e) Personal communication from Svetlana Sorokina, Russian Center for Energy Efficiency.
8 World Bank (1996a), Levine (1997), Chandler et al. (1998), IEA (1999).
CHAPTER 4: Efficient End-Use Technologies
4-7
Key considerations in the initiatives developed below are not just the goals of a new program but who would be involved, what they would do, and why their actions would make a difference. Because market actors differ by end-use sector of the economy, this set of initiatives is organized by buildings, transportation, and industry. The proposals, however, have a strong cross-cutting aspect and are meant to be considered as a package of elements, each addressing a different facet of the overall problem of RD3 of energy efficiency technology. Three of the core questions asked of each element used to fashion this strategy were:
• Is the approach commensurate with meeting the challenges of economic growth and develop-ment, strengthening national security, and protecting the environment?
• Does the program leverage the power of the market place; does it effectively leverage other public activities?
• Will the effort build on the existing strengths of the business, financial, and technical communities?
BUILDINGS SECTOR
Overall, buildings account for about 36 percent of primary energy use,9 with substantial variation among countries (Table 4.3). With global population increasing by 85 million per year, and urban populations in developing countries increasing by over 60 million per year, the correspondingly large number of buildings and modern appliances that these people will require will have a major impact on future energy use. These buildings will have lifetimes of typically 50 to 80 years; thus, delays in improving their energy efficiency will lock in energy waste and unnecessary expense for many decades. In addition, several hundred million households worldwide lack power and running water. For about one-third of the world’s population, cooking and in some cases heating is fueled by firewood, charcoal, or agricultural residues. Building Shells and Appliances
Housing in transition economies usually consists of multi-family buildings constructed of pre-fabricated concrete panels or masonry with poor thermal characteristics. These structures usually have leaky windows, poorly designed and managed district heating systems, and thirty-year-old appliance technology. In Russia, the R-value—a measure of thermal insulation value—of existing buildings often reaches only 1, while R-20 or higher would be justified.10 District heating systems are poorly maintained and leaky, with network losses reaching 30 percent in some cases. Basic heating controls such as radiator valves are often lacking. Furthermore, heating costs in Russia can equal one-quarter to one-third of average household income.11
Use of household electric appliances is growing rapidly in developing countries. Over 90 percent of urban households in China now have appliances such as refrigerators and clothes washers, compared to less than 10 percent only two decades ago.12 Refrigerators and other types of electric appliances produced
9 Worrell (1997a). 10 Matrosov et al. (1997). 11 Bashmakov (1998). 12 Nadel et al. (1995).

Powerful Partnerships
4-8
in developing countries tend to be small but inefficient. Chinese, Indian, and Eastern European refrigerator-freezers typically consume 500 to 800 kWh per year, an amount equal to or higher than the average new American model which may be twice as large in volume. Likewise, electric lighting used in developing countries is dominated by very inefficient incandescent lamps.13
Energy savings of 15 to 30 percent have been achieved in demonstration projects utilizing basic measures such as thermostats, piping insulation, and window weatherization in Russia, Ukraine, Poland, and the Czech Republic.14 It is estimated that more extensive building retrofits could cut energy use 30 to 50 percent in these countries. Efficient refrigerators and other appliances now being produced to a limited degree in Brazil, China, and a few other developing countries use half as much electricity as typical appliances in these countries. And electricity used for lighting in developing countries could be reduced 40 percent or more through use of more efficient lighting technologies—products that are already available and cost effective.15 A large technical, policy, and analytical base exists for improving building and appliance efficiency.16
Advanced building design techniques and associated technologies and appliances available today can cut in half the energy consumption of buildings in the United States and other OECD countries. Savings typically pay for the incremental cost of these more-efficient buildings in less than seven years. Techniques to achieve these savings include use of high-performance wall insulation, infiltration controls, advanced window technology (such as low-emissivity coatings, high-molecular-weight-gas-filled glazings), increasing use of natural lighting and ventilation, reducing heating and cooling loads, and installing high-efficiency heating, cooling, and lighting equipment. The best results come from incorporating specifications for building envelope, equipment, controls, operations, and surrounding environment into a “whole building” framework. Similar or better energy performance improvements are feasible in the developing and transition countries.
Despite positive financial returns on energy improvements, few builders make the requisite additional investment. The research literature attributes this problem to lack of information, lack of financing, perceived risk, and numerous disconnects among architects, contractors, owners, and renters.17 Architects are typically paid a negotiated amount based largely on the cost and size of the building, not on its energy performance. Contractors are paid for construction, and builders are paid a fixed rate per square foot. Construction contracts are based on least first cost, not on least life-cycle cost. The renter who pays the energy bills does not want to replace inefficient equipment for the owner, nor does the owner want to spend more money to purchase efficient equipment. Similar disconnects exist between end-users and utilities. For example, in Brazil the instantaneous electric resistance water heater, costing as little as $10 to $12, is the most popular system for household water heating for showers, but its high peak demand forces utilities to invest $800 to $1000 in generating capacity per installed shower.18 Thus, in all these cases those with the ability to optimize energy performance of a building and its equipment have little or no incentives to do so; those with the incentive to reduce building energy use are often not in a position to do so.
13 Nadel (1997), Geller et al. (1998). 14 Secrest (1994), Martinot (1997). 15 Nadel et al. (1997), Geller et al. (1998). 16 OTA (1992), OTA (1993), Worrell et al. (1997a), Geller and Goldstein (1998), Martinot (1998). 17 Hirst and Brown (1990), Reddy (1991). 18 Geller et al. (1998).

CHAPTER 4: Efficient End-Use Technologies
4-9
A variety of policy interventions can help overcome these barriers, but there is no single solution to them. Codes and standards can usefully establish minimum energy performance levels for manufactured equipment and new buildings. Training, testing, and compliance efforts, however, are needed to successfully implement building codes and equipment standards. Third party Energy Service Company (ESCO) financing can help solve the “first-cost” problem by converting a first cost to an operating cost.19 Tax or financial incentives can also make higher efficiency levels more attractive to the builders and owners sensitive to first costs. This might also include, for example, charging electricity "hookup" fees equal to the present value of all future power demand charges.20 This would encourage the builder/owner to take into account the amount of electric generating capacity that the building will demand. Information, labeling, training, and certification can be useful to educate consumers, improve installation practices, and encourage efficiency levels exceeding minimum codes and standards. Design competitions can encourage raising the ceiling on performance for buildings; similarly "golden carrot" competitions can raise the performance ceiling for appliances and equipment.21
The United States is a world leader in producing energy-efficient appliances, lighting products, and residential and commercial buildings. Mandatory efficiency standards—enacted at the national level for appliances and mass-produced equipment and at the state level for buildings—is a primary reason energy efficiency has improved in the buildings sector over the past two decades.22 Standards drive technological innovation by providing technology-forcing market pull. The average electricity use of new U.S. refrigerators, for example, declined from 1,800 kWh per year in 1974 to about 600 kWh per year in 1998, while the average size and the number of features increased.23 Efficiency standards, first adopted in California and then extended nationwide, caused this dramatic reduction in energy use (Figure 4.2). Similarly, codes and standards also have led to significant efficiency improvements in air conditioning, heating, and lighting technologies.
Appliance efficiency standards already adopted are expected to reduce U.S. electricity use by 88 TWh (2.7 percent) in 2000 and 245 TWh (6 percent) in 2015, leading to net savings of over $160 billion for consumers and about 60 million metric tons less carbon emissions in 2010.24 Savings from building codes and related activities such as software design tools are on the same order of magnitude. Rating and labeling programs such as the EPA/DOE Energy Star effort for appliances, office equipment, and lighting contribute to efficiency improvements in these areas. These activities are extremely cost-effective for the government since all of the investment in more efficient products and buildings is made by the private sector and paid for by consumers—who ultimately reduce their net costs.
Some developing countries realize that codes and standards can be effective and have taken steps to implement them, in some cases with support from U.S. agencies and experts. South Korea launched a standards and labeling program for appliances and lamps in 1992; standards have been ratcheted up over time and equipment efficiency has significantly improved.25 Mexico enacted mandatory efficiency standards on refrigerators, air conditioners, and motors, initially at modest levels of efficiency but later
19 Witcher (1999). 20 Arthur Rosenfeld, personal communication, April 1999. 21 An example is the "Golden Carrot" super-efficient refrigerator program conducted in the United States (Eckert,
1995; Levine et al., 1995a). 22 Geller and Nadel (1994). 23 Geller and Goldstein (1998). 24 Ibid. 25 Egan and du Pont (1998).
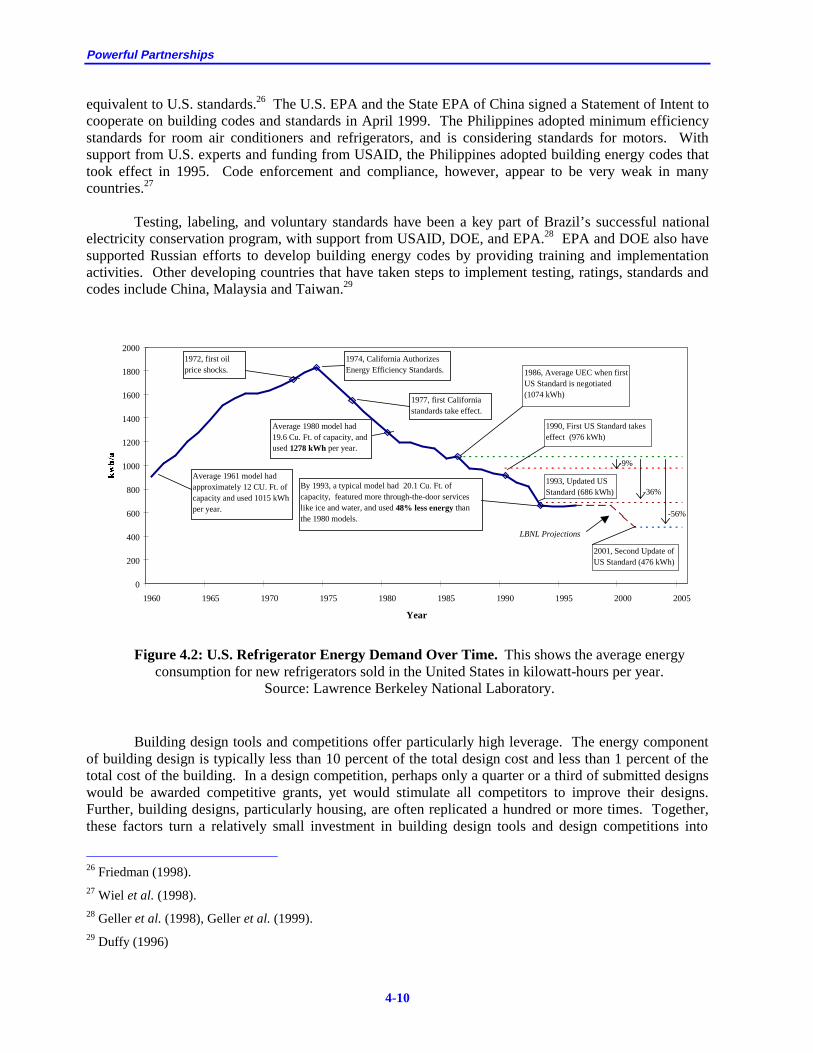
Powerful Partnerships
4-10
equivalent to U.S. standards.26 The U.S. EPA and the State EPA of China signed a Statement of Intent to cooperate on building codes and standards in April 1999. The Philippines adopted minimum efficiency standards for room air conditioners and refrigerators, and is considering standards for motors. With support from U.S. experts and funding from USAID, the Philippines adopted building energy codes that took effect in 1995. Code enforcement and compliance, however, appear to be very weak in many countries.27
Testing, labeling, and voluntary standards have been a key part of Brazil’s successful national electricity conservation program, with support from USAID, DOE, and EPA.28 EPA and DOE also have supported Russian efforts to develop building energy codes by providing training and implementation activities. Other developing countries that have taken steps to implement testing, ratings, standards and codes include China, Malaysia and Taiwan.29
0
200
400
600
800
1000
1200
1400
1600
1800
2000
1960 1965 1970 1975 1980 1985 1990 1995 2000 2005
Year
1972, first oil price shocks.
1974, California Authorizes Energy Efficiency Standards.
1977, first California standards take effect.
Average 1980 model had 19.6 Cu. Ft. of capacity, and used 1278 kWh per year.
By 1993, a typical model had 20.1 Cu. Ft. of capacity, featured more through-the-door services like ice and water, and used 48% less energy than the 1980 models.
1986, Average UEC when first US Standard is negotiated (1074 kWh)
1990, First US Standard takes effect (976 kWh)
1993, Updated US Standard (686 kWh)
LBNL Projections
-9%
-36%
-56%
2001, Second Update of US Standard (476 kWh)
Average 1961 model had approximately 12 CU. Ft. of capacity and used 1015 kWh per year.
Figure 4.2: U.S. Refrigerator Energy Demand Over Time. This shows the average energy consumption for new refrigerators sold in the United States in kilowatt-hours per year.
Source: Lawrence Berkeley National Laboratory. Building design tools and competitions offer particularly high leverage. The energy component
of building design is typically less than 10 percent of the total design cost and less than 1 percent of the total cost of the building. In a design competition, perhaps only a quarter or a third of submitted designs would be awarded competitive grants, yet would stimulate all competitors to improve their designs. Further, building designs, particularly housing, are often replicated a hundred or more times. Together, these factors turn a relatively small investment in building design tools and design competitions into
26 Friedman (1998). 27 Wiel et al. (1998). 28 Geller et al. (1998), Geller et al. (1999). 29 Duffy (1996)

CHAPTER 4: Efficient End-Use Technologies
4-11
substantial leverage on the overall investment in improved buildings.30 Building design competitions would also give visibility to winning architects and winning designs, and would provide opportunities to publicly illustrate the value and performance of these buildings. Many of the features of these advanced designs emulate traditional architecture with its emphasis on natural lighting, solar control with overhangs and awnings, careful design and placement of windows, and other features.31
Capable building design tools are a critical first step, but experience in California has shown that training architects in their use and contractors in how to build to the new specifications are also essential. With these additional training steps, substantial savings are possible. An experiment by Pacific Gas and Electric demonstrated 50 percent energy savings—above California’s strict Title 24 building performance standard—in 6 of 7 buildings that they completed, and 45 percent savings in the seventh.32
While there have been some exceptions, codes and standards activities in developing countries have been ad hoc, limited in scope and geographic coverage, uncoordinated, and in some cases lacking implementation and follow-through. Similar criticisms can be made of U.S. support for codes and standards activities in developing countries. Integrated Resource Planning and Demand Side Management activities can balance efficient end-use efforts with the supply side (Chapter 3). To address generic problems, we recommend a number of initiatives for increased financing, energy-sector reform, and capacity building (see Chapter 3). We also recommend the following initiatives tailored to the unique problems of energy efficiency in the buildings sector. High Priority Initiative: Making Buildings Energy Efficient
Goal
Support cooperative activities with developing and transition countries to reduce overall energy use of new appliances, homes, and commercial buildings by 50 percent over the next two decades compared to current performance. Recommended funding for this initiative together with the following initiative on improved cookstoves is $20 million per year in FY2001, increasing to $40 million per year in FY2005.
U.S. Actions (1) Technical and policy assistance—with participation from DOE, EPA, USAID, and national
laboratories—for the cooperative development and implementation of efficiency standards for, and ratings and labeling of, building equipment and appliances, including cooperation in setting up appliance and equipment testing laboratories and programs; in developing and
30 With similar urbanization rates as industrial countries, there would be roughly 7.5 billion people in urban areas of
today’s low and middle income countries by the end of the 21st century, an increase of about 5 billion from today. With similar occupancy levels as today’s industrial countries, this would require roughly 2 billion residential units and perhaps 100 million commercial buildings, all in round numbers. In turn, if residential unit designs were replicated 40 times and commercial units twice, this would result in roughly 100 million building designs being developed over 100 years, or an average of 1 million designs per year. Impacting 1 million building designs annually is a tremendous challenge that these mechanisms of design tools, design competitions, and codes and standards can address.
31 Adaptation of building design tools to country-specific materials and issues is needed. Further research is also needed, particularly on design for hot/humid climates, for analyzing and minimizing the sensitivity of building design energy performance to inadequacies in construction, and to conduct monitoring and design validation.
32 Arthur Rosenfeld, personal communication, April 1999, Brohard (1998), Eley (1998).

Powerful Partnerships
4-12
analyzing standards; in harmonizing test procedures and standards where there is U.S. interest in doing so; and in implementing voluntary energy-efficiency labeling and promotion programs similar to the EPA/DOE “Energy Star” program.
(2) Similarly organized technical and policy assistance for the development, distribution, and training in the use of building-design software that minimizes energy use in residential and commercial buildings while enhancing building livability and amenity value; for development and monitoring of building design competitions to push the envelope of building energy performance; and for development, analysis, and implementation of building energy codes and standards, including assistance with training, monitoring, compliance, and enforcement programs and with software tools.
(3) U.S. encouragement for the GEF, World Bank, and other multilateral organizations to support the development and adoption of the measures described here as part of aggressive pursuit of building energy efficiency improvements throughout their grant and lending programs.
Elaboration This panel recommends a major initiative to transfer testing, rating, codes and standards programs
to developing and transition economies. It would be delivered by assembling the collective resources and expertise of DOE, EPA, and USAID. Multi-year strategies would be developed for all countries and regions interested in this support. These strategies could be developed and implemented with local partners and tailored to the opportunities and needs of each area. Test procedures, ratings, labels, standards, and building codes might be harmonized with U.S. policies where this makes sense; the U.S. Energy Star labeling program for computers, printers, and copiers serves as an example of this.33 Similarly, efforts to coordinate testing, labeling, and standards efforts among industrialized nations would be expanded. EPA’s efforts to extend Energy Star labeling to Europe and Japan and DOE efforts to harmonize test procedures to promote minimum efficiency standards among OECD nations could be enlarged to include developing and transition nations. Improving building equipment efficiency is particularly important due to the rapid adoption of consumer appliances with development, a process that is occurring much more rapidly and at an earlier stage of development than was the case for today’s industrial countries.34
High quality, user-friendly simulation and design tools can be very valuable for designing buildings that optimize energy use. U.S. national laboratories have developed tools that are used in many countries for building design and for code-related activities.35 Particularly useful examples include DOE-2 and Energy-10 building-design software. Further efforts should be made to develop and disseminate design tools, help with training users, and help with the application of these tools for developing and implementing building codes to set the floor on efficiency performance levels and design competitions to push the ceiling on efficiency performance. DOE should contribute to efforts to develop and apply improved, more user-friendly design tools, including public-private partnerships to incorporate energy design optimization in commercial architectural-design software packages.
In addition to bilateral policy and technical assistance activities, the GEF, World Bank and regional development banks should be encouraged to support this initiative. The GEF and the banks
33 Thigpen et al. (1998). 34 OTA (1992). 35 Mills (1995).

CHAPTER 4: Efficient End-Use Technologies
4-13
should co-fund local energy-efficiency institutions in developing countries to ensure adequate expertise to adapt and implement design, testing, rating, labeling, standards and codes programs. Funding will be needed for additional appliance testing facilities in developing countries, for example. The IFC should offer financing to manufacturers who want to make, or are required to make, more efficient appliances, motors, pumps, and lighting products.
Helping developing and transition countries become more energy-efficient in building design and
construction will benefit U.S. companies in a number of ways. First, U.S. appliance and equipment manufacturers are world leaders in energy efficiency. Their sales through foreign subsidiaries or joint ventures might improve with adoption of U.S.-style efficiency standards overseas. Likewise, foreign markets for energy-efficient, U.S. produced heating-cooling-ventilation systems, windows, and controls would grow if developing countries were to enact and enforce reasonable building energy codes. With active U.S. support, foreign nations are more likely to harmonize test procedures and standards using U.S. methods, benefiting both themselves by moving towards performance-based standards as well as U.S. companies.
India, Indonesia, the Philippines, Brazil, and Mexico could save an estimated 37 gigawatts of baseload power over the next 10 years and 58 gigawatts over the next 20 years if they implemented U.S.-style buildings sector efficiency standards.36 Globally, widespread adoption of appliance standards and new building energy codes alone could reduce energy use in buildings by roughly 25 percent in 2030.37 Improved Cookstoves
Traditional cooking methods using an open fire or charcoal stove generate high levels of fuel use and smoke, causing severe environmental, public-health, and social problems for vast numbers of households (and women in particular) in rural areas of poorer developing countries. Estimates of the annual number of premature deaths due to acute respiratory infections resulting substantially from indoor air pollution, in large part due to smoke from traditional biomass stoves, range up to two million globally.38 The problem of traditional cookstoves and cooking fuels, and the serious environmental, health, and social problems they cause, should not be overlooked. The most important energy service in rural areas of developing countries today is cooking food.
Traditional stoves/fuels are only 10-20 percent efficient and produce high levels of smoke, while
improved stoves using traditional biofuels can improve this efficiency to around 20-30 percent.39 Higher incomes and reliable access to fuel supplies enable people to switch to modern stoves and cleaner fuels such as kerosene, LPG, and electricity. Kerosene, LPG, and electric stoves can improve cooking efficiency to 40-60 percent, greatly reduce smoke, and improve standards of living and public health in developing countries, although at higher monetary costs. But biomass is, due to its low cost and availability, likely to remain the main cooking fuel in rural areas of developing countries for many years to come. Improved biomass stoves may be the most practical option for cutting smoke exposure, reducing fuel waste, and cutting fuel collection burdens for large numbers of poor households in the foreseeable future.
36 Duffy (1996). 37 LBNL (1996). 38 Smith et al. (1999). See also Kammen et al. (1999). 39 Baldwin (1986), OTA (1990), OTA (1992), Reddy et al. (1997).

Powerful Partnerships
4-14
Previous efforts to develop and disseminate improved biomass stoves have met with mixed success.40 China has implemented the most sweeping and successful improved stove program in the world. Around 130 million improved stoves, mostly biomass stoves, were installed in rural areas during 1982-92, meaning over half of rural households in China obtained an improved stove. Although there were problems with quality control and durability in the beginning, these problems were largely overcome and most stoves have saved fuel, improved indoor air quality, and remained in use.41 Lessons from the Chinese national program include targeting regions with adequate interest as well as technical, financial, and managerial capability; limiting government subsidies (about 15 percent of total stove cost in the case of China); producing key stove parts centrally; independently testing and monitoring to evaluate performance; and working with rural enterprises for stove dissemination.42
Kenya also has implemented relatively successful stove programs both for urban areas and rural areas with improved charcoal and wood stoves, respectively, disseminating over 700,000 stoves by the early 1990s. Lessons from this experience include the importance of central production of key components such as ceramic liners, use of small enterprises to produce and market stoves in areas where users can afford to pay, use of women’s groups for stove dissemination in rural areas, and tailoring designs to meet local conditions while maintaining testing and quality control.43
In contrast to the China and Kenya experience, improved stove programs in many other countries have met with much less success for a wide range of technical, economic, social, and institutional reasons.44 This has resulted in cuts in financial support for improved biomass stoves by many bilateral aid organizations. Improving stove efficiency and cutting down indoor smoke levels is, however, feasible and worth seeking. For households that purchase fuel, the fuel savings can pay off the cost of the stove in as little as a few months. For rural households that gather fuel, time spent on this task can be significantly reduced, and other benefits provided.
Technical difficulties abound in attempting to improve biomass stove performance. For example: • Stoves which burn biomass directly under the pot produce smoke because the pot is always at low
(boiling) temperature, which quenches the combustion of volatiles rising from the fire, creating smoke.
• Household-scale biomass gasification units have difficulty turning down the heat quickly and/or
without extinguishing the gasification process.
• Village scale gasifiers face difficulties in setting up the pipeline distribution structure, avoiding gas leaks, and metering gas usage.
There are promising technical routes, but R&D is needed to develop them in a low-cost, low
polluting, efficient package. Alternatively, complementary approaches such as the generation of liquid fuels from biomass may have potential, as discussed in Chapter 5.45
40 Barnes et al. (1994). 41 Smith et al. (1993), Smith (1993). 42 Ibid. 43 Karakezi and Turyareeba (1995) 44 Barnes (1994), Reddy et al. (1997) 45 Other approaches also face difficulties. Charcoal stoves are being widely disseminated in east Africa, but
conversion of wood to charcoal wastes typically half or more of the original energy in the wood. Solar stoves

CHAPTER 4: Efficient End-Use Technologies
4-15
Other Important Initiatives: Developing and Disseminating Improved Cookstoves
Goal
To support cooperative efforts in the development and dissemination of low-cost, low-polluting, and efficient cookstoves fueled by renewable energy resources. These stoves would improve public health and the quality of life mainly in rural areas of Africa and Asia.
U.S. Actions
The United States would support cooperative efforts with foreign counterparts to:
(1) Research and develop low-cost, low-polluting, high-efficiency cookstoves fueled by renewable energy resources, particularly biomass and biomass-derived fuels (see Chapter 5). This research should be closely coupled to field demonstrations to ensure that stoves fully meet user needs and requirements. Emphasis should be on stoves that can be rapidly produced with high levels of intrinsic quality control.
(2) Build human and institutional capacity in stove RD3 in key developing countries; (3) Leverage large-scale deployment of these high-performance stoves through the market.
Elaboration
PCAST recommends that USAID, DOE, and EPA offer support and assistance to improved stove
R&D and dissemination programs throughout Asia, Africa, and other regions where cookstove-related health and environment problems exist. This should include linking universities with substantial technical expertise and NGOs with field expertise with developing country counterparts. Activities should be responsive to local needs and informed by the lessons learned in previous efforts to design and disseminate improved cookstoves. We suggest that USAID lead this initiative, but that both DOE and EPA contribute funding and expertise, as appropriate. U.S. agencies might consider funding South-South collaborations so that successful efforts by countries like China and Kenya can be replicated elsewhere.
This initiative would be closely coordinated with other nations and development agencies supporting improved biomass stove efforts such as the German assistance agency GTZ. At a minimum, funders need to coordinate and avoid duplication and competition, jointly developing and implementing strategies where possible. In addition, the U.S. government would encourage the GEF, World Bank, and regional development banks to contribute to efforts for improved stoves, where appropriate, including making available finance through effective rural micro-credit schemes like the Grameen Bank in Bangladesh.
The primary U.S. interest here is humanitarian—helping to address the severe health, environmental, and social impacts of traditional biomass cooking in developing countries. Reducing indoor smoke and highly elevated levels of particulates and other pollutants could reduce acute respiratory illness found largely in women and children in developing countries, as well as premature death linked to breathing elevated levels of smoke.
may offer some benefits, but only work during sunny daylight hours.
Powerful Partnerships
4-16
TRANSPORTATION SECTOR Background
Transportation accounts for one-quarter of world energy use, with developed nations consuming 70 percent of that amount.46 Developing nations enjoy far less mobility than in the West. Every American could get into an automobile at the same time, and no one would have to sit in the back seat. But in Brazil, there is one car for 13 people and in Asia one for 200 people.47 The torrid annual transportation energy demand growth rate of 2.7 percent experienced during the seventies and eighties slowed to 1.6 percent this past decade, but the growing and increasingly wealthy global population will for decades to come demand expanding passenger and freight services. Improved vehicle technology and transportation systems are critical international energy RD3 needs.
The automobile continues to make inroads around the world. In the post-communist Czech
Republic, automobile ownership increased by one-quarter after 1990 while mass transit use fell by half. Car ownership in Russia surged by 7 percent per year in the 1980s and 9 percent in the 1990s.48 China had only about 3 million cars in 1985, but now adds roughly that same amount annually.49
Some emerging markets manufacture automobiles but do not avail themselves of cost-effective transportation efficiency measures. The Russian-made Lada, Polish-made Polonez, and Chinese-made Volkswagen, for example, lack the four-valve cylinders, special cams, fuel injection, and computer-control technology the west now takes for granted. These technologies can significantly improve efficiency. And in large parts of Asia, inefficient highly-polluting two-stroke engines are widely used in two- and three-wheel vehicles. Four-stroke engines are available on the market that typically cost 25 percent more than the two-stroke engines, but reduce hydrocarbon emissions by 90 percent, increase fuel efficiency by 25 percent, and have simple payback times—at typical annual driving rates—of 2.4 years at gasoline prices of $1/gallon.50 Meanwhile, U.S. automobile fuel economy stalled with the collapse of oil prices in the mid-eighties and the lack of improvement of fuel-economy standards.
Government officials often assume that poorer countries cannot afford the more-advanced technologies because of cost concerns. More efficient and cleaner cars and two- and three-wheel vehicles may cost slightly more to manufacture and purchase, but would reduce fuel cost—often for imported oil—as well as costs associated with air pollution. Air pollution levels have grown rapidly51 and the air pollution costs can be very high, as noted in Box 1.2. Toxic emissions are also a serious concern; the lead in leaded gasoline, for example, can cause brain damage.52 Educating leaders in industry and government on the benefits and costs of new transport technologies and the costs of urban air pollution could help developing and transition nations increase mobility in a more sustainable, cost-effective manner considering all costs associated with transport.
46 IPCC (1996). 47 OECD (1997). 48 SEVEn (1998). 49 China Daily (1999). 50 OTA (1992). 51 Onursal and Gautam (1997). 52 Lovei (1997), Walsh and Shah (1997).

CHAPTER 4: Efficient End-Use Technologies
4-17
Based on sales data from vehicle manufacturers, it is estimated that 43 million two- and three-wheel motorized vehicles were in use in developing and transition countries by 1988.53 This fleet has probably grown by 50 percent over the last decade. In Asian cities such as Calcutta, Mumbai, New Delhi, and Bangkok, two- and three-wheelers account for over 50 percent of the motorized vehicle fleet.54 In China, bicycles are still the predominant travel mode. Nonetheless the motor vehicle fleet in Beijing increased seven-fold between 1980 and 1995, and use of motorized vehicles will continue to grow rapidly as income rises.55
The two- and three-wheel motorized vehicles typically used in Asia are very dirty and relatively inefficient. Most of them are powered by crude two-stroke engines that provide only two-thirds of the fuel economy of an equivalent size four-stroke engine.56 Two-stroke engines emit 3 to 5 times more hydrocarbons and particulates as four-stroke engines of similar capacity. While their fuel economy is still better than that of a modern compact or subcompact car, their emissions per kilometer can be many times greater. These vehicles are a major contributor to highly unhealthy air pollution levels in Asian cities.57 In Taiwan, for example, 73 percent of motor vehicles are motorcycles, and they account for about 35 percent of CO emissions and 18 percent of total HC emissions, even though their motorcycle emissions regulations are the most stringent in the world.
Enormous technical potential exists for reducing the emissions levels and fuel requirements of two- and three-wheel vehicles used today in developing countries. Shifting to four-stroke engines is one obvious opportunity, but newer technologies, including compressed natural gas, electric battery, and fuel cells offer much more potential for fuel economy and environmental protection. The Environmental Protection Agency of Taiwan, for example, has mandated that by 2000 at least 2 percent of the motorcycles sold by each manufacturer must be electrically powered and the national goal is to sell 0.5 million electric scooters by 2004. This follows a 1990 government launched project that has involved six motorcycle manufacturers and several component suppliers and has conducted field tests for a demonstration fleet of 150 electric scooters in 1997.58
Battery powered vehicle range is limited and weight, especially for two- and three-wheelers, is high. Because of this, options such as fuel-cell systems are particularly attractive. Thus, U.S. agencies and multilateral development institutions should together work with the private sector to radically improve two and three-wheel motorized vehicles in developing countries.59 The organization of this effort would benefit from study of the history and experience of the Partnership for a New Generation of Vehicles (PNGV) program in effectively joining public and private interests, including periodic independent merit review.
53 Faiz (1993). 54 Birk and Zegras (1993), Bose (1998). 55 Dengqing, Aling and Xuefeng (1996). 56 Bose (1998). Note the slight difference with the earlier estimates of fuel savings and emissions reductions. These
two sources (Bose 1998, OTA 1992) indicate a range of possible savings. 57 Birk and Zegras (1993), Faiz (1993). 58 Shu (1997). 59 With increased income some now using two- and three-wheelers will shift to automobiles, but many who now
have no motorized transport will enter the market with a two- or three-wheeler. There will be continuing demand for small vehicles, particularly given urban densities in many developing countries.

Powerful Partnerships
4-18
Interest in improving two- and three-wheel vehicles and reducing emissions is increasing among developing countries. India has adopted stricter vehicle emissions standards for two and three-wheelers as well as cars that will take effect in 2000.60 China also is phasing in emissions standards for cars and motorcycles. Likewise, Thailand is gradually tightening its emissions standards on smaller vehicles and has converted some of its three-wheeled taxis to compressed natural gas (CNG). And as noted above, Taiwan has mandated the introduction of electric cycles starting in 2000, and some Chinese cities are considering similar actions.61 Encouraging joint ventures to utilize innovative technologies in scooters and rickshaws should be a major focus of this initiative.
Developing countries face particular challenges in land-use planning and public transit. Urban populations of developing countries are currently increasing by a net of about 60 million people per year and a number of megacities are developing around the world with high population densities and severe congestion and air quality problems. Once roads and buildings are put in place, the overall structure of the city is unlikely to change significantly for many decades to even a century or more; changing the urban form is often just too difficult. Consequently, future urban congestion, livability, and environmental quality in the developing world is being determined today, largely by an unplanned random process of incremental accretion. As one study noted:
“While several middle income developing countries engage in travel forecast modeling (i.e. Thailand, Mexico, Chile and Brazil), the vast majority of developing world cities have almost no indigenous urban transport planning capability, much less any modeling capability”.62
Public transit in developing nations is often overcrowded, poorly maintained, unsafe, and slow,
though not always so in transition countries. Megacities in developing countries are subject to unplanned growth, including shanty towns springing up in peripheral areas. Helping developing countries improve transport and land use planning is the purpose of one of the initiatives described below.
Another factor affecting future transportation energy use is the management and construction of
railroads vis-a-vis highways. Central and Eastern Europe today has fewer roadways than the single country of Italy, though construction of highways is considered a priority in nations like Poland.63 A shift from rail to road freight has occurred in Central Europe, as it has in China, India, and Latin America. Helping developing and transition nations address this modal shift to ensure the most effective, lowest cost, and least polluting transport possible is another area deserving attention.
Action is needed throughout the world—in the United States and elsewhere—to improve transportation systems and limit transportation-linked problems such as urban congestion, local air pollution, dependence on expensive and insecure supplies of oil, and greenhouse gas emissions. For private transport, policy mechanisms that might be considered for controlling these costs include: full-cost pricing of fuels and vehicles, pay-as-you drive insurance, road pricing, fuel taxes, vehicle taxes, registration charges, fuel economy standards, and urban-area access control.
For public transit, steps that can be taken include improving bus and other mass transit systems
and better land-use planning to combat urban sprawl. Developing and sustaining mass transit systems
60 Pachauri (1999). 61 Shu et al. (1997a), Shu et al. (1997b). 62 Zegras et al. (1995). 63 OECD (1997).

CHAPTER 4: Efficient End-Use Technologies
4-19
that are affordable, comfortable, and fast requires heavy capital investment and proper financing to ensure survival of services that can compete with automobiles. Most developing countries have population densities that are many times higher than the United States–up to five times higher in China, for example. These high population densities will greatly constrain use of automobiles in favor of mass transit systems. Some cities such as Curitiba, Brazil (see Box 4.2) and Hong Kong have very successful public transport systems. But car use has been rising rapidly in cities ranging from Mexico City to Nairobi to Beijing, creating heavy congestion, air pollution, and hazardous conditions for pedestrians and bicyclists. Consequently, improving public transportation systems has become a priority in many Third World nations.
Box 4.2: Urban Transport Success Story: Curitiba, Brazil
Curitiba is the capital of the state of Parana in southern Brazil. It has a population of about 2.3 million in its metropolitan area. In the early 1970s, city authorities began to implement urban planning and infrastructure investments designed to combat urban sprawl. Growth was concentrated in the central city and around five linear corridors with higher building densities allowed along these corridors. A sophisticated bus-based public transportation system was developed emphasizing convenience and speed. The bus system includes express bus lanes on major arterial streets, complemented by inter-district and feeder buses as well as highly efficient bus terminals and transfer stations. The bus system is operated by private companies in cooperation with city authorities.
The results are impressive. About 75 percent of all commuters (more than 1.3 million passengers per day) take the bus. Fuel consumption rates in Curitiba are 25 percent lower than in comparable Brazilian cities even though Curitiba is relatively wealthy and has above average car ownership levels. Also, Curitiba has relatively low ambient air pollution compared to other Brazilian cities. And the average Curitiba resident spends only about 10 percent of his or her income on transport, low by Brazilian standards. Sources: Herbst, 1992, and Lewan, 1994
The United States similarly faces significant problems of urban congestion and air quality and has
much to learn about ways to improve overall transport system efficiency. Indeed, U.S. approaches to urban planning and highway transportation systems have often not worked well and perhaps offer useful case studies for other countries of the problems that can arise with insufficient or ineffective land-use and transportation planning. Although there are some shining examples of mass transit systems in the United States—the public transport system in Portland, Oregon, for example—public transit in urban areas of the United States is generally weak. International cooperative RD3 could provide significant benefits to the United States as it grapples with increasing congestion in many of its urban areas.. The lessons learned in other countries—particularly other industrial countries—should be identified and brought back to the United States.

Powerful Partnerships
4-20
High Priority Initiative: Improving Vehicles
Goal
This effort would help research, develop, and demonstrate clean, energy-efficient two- and three-wheel vehicles and buses, and help accelerate their deployment in developing and transition countries. Recommended funding for this initiative, together with the following initiative on New Technologies for Public Transport Systems, is $20 million per year in FY2001, increasing to $40 million per year in FY2005.
U.S. Actions
(1) Integrate and expand activities of DOE, EPA, and USAID—and encourage the same by GEF—on cooperative RD3 of low-cost, efficient, clean power sources for transportation—particularly fuel-cell systems for small vehicles (primarily 2- and 3-wheel vehicles) and hybrid and fuel-cell systems for buses, as well as electric or alternative-fuel propulsion systems where appropriate. The United States would encourage joint ventures involving U.S. and foreign companies to manufacture these vehicles and fuel production systems.
(2) The U.S. would encourage the GEF, World Bank, IFC, and other multilateral development banks
to help finance the vehicle manufacturing capacity, infrastructure, and consumer credit systems necessary for large scale deployment of these advanced vehicles;
(3) The U.S. EPA would provide assistance to developing and transition countries for the analysis
and implementation of emissions standards, including establishment of vehicle testing and inspection programs for all types of motor vehicles.
. Elaboration
A number of ongoing activities could be brought together and expanded to create this initiative.
First, DOE has considerable experience working with the private sector on R&D and commercialization of CNG, electric, and fuel-cell vehicles and their components. DOE can build on this experience and help apply it to developing country two- and three-wheel vehicles. USAID has a project to encourage development and production of small electric cars in India—this experience could be extended to fuel-cell vehicles. The GEF is starting a new operational program in sustainable transport—this could be one of its focal areas. The multilateral banks are gaining experience financing the deployment of small-scale renewable energy and energy efficiency projects—this approach could be extended to innovative, clean, and efficient two- and three-wheelers once they are produced in developing countries.
We propose focusing on two- and three-wheel vehicles rather than cars for a number of reasons. First, the multinational auto companies are actively developing and commercializing advanced electric, hybrid, and fuel-cell vehicles in the industrialized nations, as are some smaller specialized companies. Developing countries should get access to these vehicles once they become widely available and practical, particularly if they insist that multinational and joint venture car makers produce high efficiency, low-polluting vehicles through tight fuel efficiency and emissions standards or mandates for the introduction of advanced technologies. But manufacturers are paying relatively little attention to improving the smaller two- and three-wheel vehicles used predominantly in the developing world.
This initiative would also focus on helping developing countries obtain advanced bus technologies. Innovative hybrid (combination of internal combustion engine and batteries) and fuel-cell

CHAPTER 4: Efficient End-Use Technologies
4-21
buses are under development or in limited production in the United States and other countries.64 The State Science and Technology Commission of China is, for example, developing electric and fuel-cell buses. These technologies greatly reduce or eliminate the soot and smog-producing emissions by traditional diesel engines and are more fuel efficient (see Table 4.4). Developing these technologies for public buses would also have significant spillover effects for trucks, which are major contributors to urban air quality problems in many countries.
Table 4.4: Emissions and Fuel Economy for Selected Bus Technologies Traditional Diesel Diesel Hybrid Electric Methanol Fuel Cell
Nitrogen Oxides (g/mile) 25.0 14.0 0.04 Particulates (g/mile) 1.3 0.4 0.00 Fuel Economy (mpg) 3.6 5.5 6.6a (a) Miles per gallon of diesel-equivalent. Source: Mark and Davis (1998)
This initiative would support cooperation and encourage joint ventures between U.S. and foreign companies including supporting demonstrations, testing, and commercial introduction of innovative bus technologies in developing countries. Fuel cells in particular could be attractive for buses and trucks in developing countries because of the air pollution and health benefits and potential to make methanol or hydrogen from a wide range of locally available feedstocks (see Chapter 5). Health benefits may be especially significant due to the small-particle air-pollution problem from diesel engines (Box 1.2).65
A major challenge of these efforts will be to effectively coordinate the work with ongoing fuel-cell RD3 activities in the automotive arena, to ensure adequate spillover of technological and economic advances into these proposed small vehicle and bus applications.
U.S. companies could play a major role in modernizing two- and three-wheel vehicles in developing countries. A U.S.-led initiative could strengthen U.S. manufacturers of these and related technologies vis-à-vis foreign competitors. Several U.S. companies are developing and even producing electric or hybrid electric buses. USAID is currently implementing a program to introduce small electric vehicles in India, working with U.S. and Indian manufacturers. DOE has supported development of fuel cell buses, and U.S. companies along with Canadian and German manufacturers are in the forefront of fuel-cell and fuel-cell-bus development efforts. Additional support could substantially benefit U.S. technology development efforts and help tap a valuable export market.
Urban air quality could be significantly improved if two-stroke engine-powered vehicles were
displaced by advanced vehicles on a large scale. A modal shift to buses and introduction of advanced bus technologies could significantly affect fuel use and air quality in developing nation cities. By one estimate, a modal shift to buses combined with improved bus and light-vehicle technology in New Delhi, Bangalore, and Calcutta could cut air pollution by one-quarter to one-half in those cities by 2010.66
64 Mark and Davis (1998). 65 New diesel engines reduce the total mass of particulates emitted, but may produce many more small particulates,
fueling concerns about the health impacts of small particulates (Abdul-Khalek et al. 1998; Donaldson et al. 1996; Ferin and Penney 1992; Kittelson 1998; Kruger et al. 1997; Mayer et al. 1995, Warheit et al. 1990).
66 Bose (1998).
Powerful Partnerships
4-22
Emissions of hydrocarbons could be cut in those cities by up to 80 percent, particulates up to 60 percent, and carbon monoxide by as much as 75 percent, compared to business-as-usual. (See Tables 4.8 and associated discussion at the end of this Chapter.)
Box 4.3: Motorized Bikes for Developing Countries Bicycles are still the dominant transport mode in cities in Asia. In Beijing, for example, there are over 8.5
million bicycles and other non-motorized vehicles, compared to about 660,000 motorized vehicles as of 1994 (Dengqing, 1996). But as incomes grow, there will be rapidly growing demand for motorized vehicles and the increased mobility they provide. Use of battery- or fuel-cell powered bikes can serve the demand for greater mobility without adding to (and in some cases improving) air pollution in cities like Beijing.
A motorized bike with a price of $300, based on large-scale production in Asian countries where labor is inexpensive, is still relatively costly for a typical resident of Beijing, Manila, Bangkok, or New Delhi. But if financing were made available through a multilateral bank either directly or passed through to cycle vendors and/or other intermediaries, and if off-peak (i.e., night-time) electricity was provided for battery charging at a reasonable price then the market in urban areas of developing countries could be very large. Likewise, the taxi rickshaw market could be very attractive if financing were available.
Other Important Initiatives: Innovating New Technologies for Public Transport Systems
Goal
This initiative would help developing countries plan more efficient transportation systems, including mass-transit systems and related land-use planning.
U.S. Actions
(1) Support would be provided through U.S. agencies for public-private partnerships with developing countries for transportation planning and analysis, including adaptation and use of travel demand models, transit models, urban-planning tools, and related financial and emissions models. Particular attention would be given to identifying useful model programs from around the world—in industrial, transition, and developing countries alike—and extracting lessons learned that can be adapted for use in developing countries as well as in the United States.
(2) The U.S. would encourage the GEF, World Bank, IFC, and other multilateral development banks
to support the development of public transport systems and related land-use activities.
Elaboration:
The United States is not a model for public transportation systems and transit-oriented urban development—the use of public transit is relatively low and has been declining.67 Nonetheless, the United States has considerable expertise in transportation and land-use planning, expertise often lacking in developing countries. For example, transportation assessments in cities in Thailand, Indonesia, India and Pakistan indicated that there is little expertise or information on transit-oriented land-use planning in these countries.68
67 Mark and Davis (1998). 68 Birk and Zegras (1993).
CHAPTER 4: Efficient End-Use Technologies
4-23
Information exchanges among and training for city planners and leaders in developing countries
can help develop understanding of the opportunities for, and potential impacts from, developing integrated land-use and public-transport plans, and how to balance centralized planning approaches with appropriate market-driven deregulated approaches guided by the insights from planning.69 Together with improved transport technologies, like those used effectively in Curitiba (see Box 4.2) and a few U.S. cities such as Portland, Oregon, these activities can have substantial benefits on urban form, congestion, air quality, and other aspects of urban life.70 USAID- and EPA-supported experts can help urban and transport planners in developing countries adapt and apply integrated land-use and transport models, collect the necessary data, and develop integrated transport and land-use plans that address local problems such as congestion, environmental degradation, and access to public transportation within the economic and other constraints present. USAID has recently conducted such workshops in the Philippines. Facilitating information exchanges between countries, including other industrial countries and developing countries, can be an important component of this effort. Capacity building should be a primary consideration.
This initiative should also be coordinated with the new transportation program of the Global Environmental Facility, particularly to encourage GEF support for a modal shift from personal to public transport, including funding for integrated transportation and land use planning. This initiative would also encourage the MDBs to devote a larger share of transport loans to upgrading and expanding public transport systems.
Developing countries face substantial urban air quality and congestion problems that improved urban design could significantly help. This can also enhance the quality of life and economic growth potential in developing countries, which of course, is of benefit to the United States. Perhaps more importantly, the United States could learn much of use for application inside the United States from this program, particularly from information exchange with other industrial countries. INDUSTRY
Industry consumes roughly 40 percent of the world’s commercial primary energy.71 Production of a few basic energy-intensive materials, including steel, chemicals, cement, and paper, typically accounts for half of those totals. Iron and steel alone accounts for 14 percent of global industrial energy use (Figure 4.3). Emerging markets consume relatively more energy in industry than in buildings or transport because rapid development of infrastructure drives demand for energy-intensive materials. Boilers, kilns, and electric drives rank highest among specific energy-consuming devices in industrial energy use.
Global industrial energy use grew quickly between 1970 and 1990, averaging over 2 percent per
year, while industrial output grew even faster, averaging over 3 percent.72 The economic collapse of the Soviet Union—where industrial energy consumption has shrunk by a third or more73—restructuring in
69 Dowall and Clark (1996). 70 Zegras et al. (1995). 71 Worrell et al. (1997a). 72 World Bank (1996). 73 Chandler (1999).

Powerful Partnerships
4-24
China and elsewhere, and more recently the Asian economic crisis have sharply reduced industrial energy demand growth in those regions over the past five years.74
Emerging-market industries often fail to make use of the energy-efficient and cost-effective
process technologies available to them (industrial-country factories also frequently fail to take full advantage of the energy-efficiency opportunities). China, for example, uses roughly 90 percent more energy to make a ton of steel on average than Japan.75 Countries like Colombia, India, and Indonesia use 60 to 200 percent more energy per ton of pulp and paper than the OECD average.76 U.S. and Russian cement makers frequently use 30 percent more energy per ton of production than counterparts in France or Mexico because they rely heavily on older “wet” cement production-process technology, while other nations have moved on to the “dry” process.77 Chemical plants in emerging markets often have not applied techniques such as advanced membranes, improved catalysts, or even simple energy management practices such as heat recovery or insulation. New processes for energy-intensive materials production can significantly reduce energy use in future facilities. Opportunities include direct reduction of iron ore, stoichiometric chemicals production, production of light-weight smart materials, and many others.
Figure 4.3: A Few Sectors Dominate Global Industrial Energy Use
Source: MD Levine, Lawrence Berkeley National Laboratory
Industry often underutilizes specific devices that enhance efficiency. Important examples include well-known devices such as electronic process controls, heat-recovery boilers, adjustable-speed motor drives, and even steam traps. Improving the efficiency of motors and motor systems offers large energy-saving opportunities in developing countries. Motors consume more industrial electric power than any other device, using one-half to two-thirds of industrial power in Brazil, China, and the United States.78 In
74 Levine (1999a), Levine (1999b). 75 Hu et al. (1998). 76 OTA (1992). 77 OTA (1992), Levine (1999a), Levine (1999b). 78 OTA (1992).
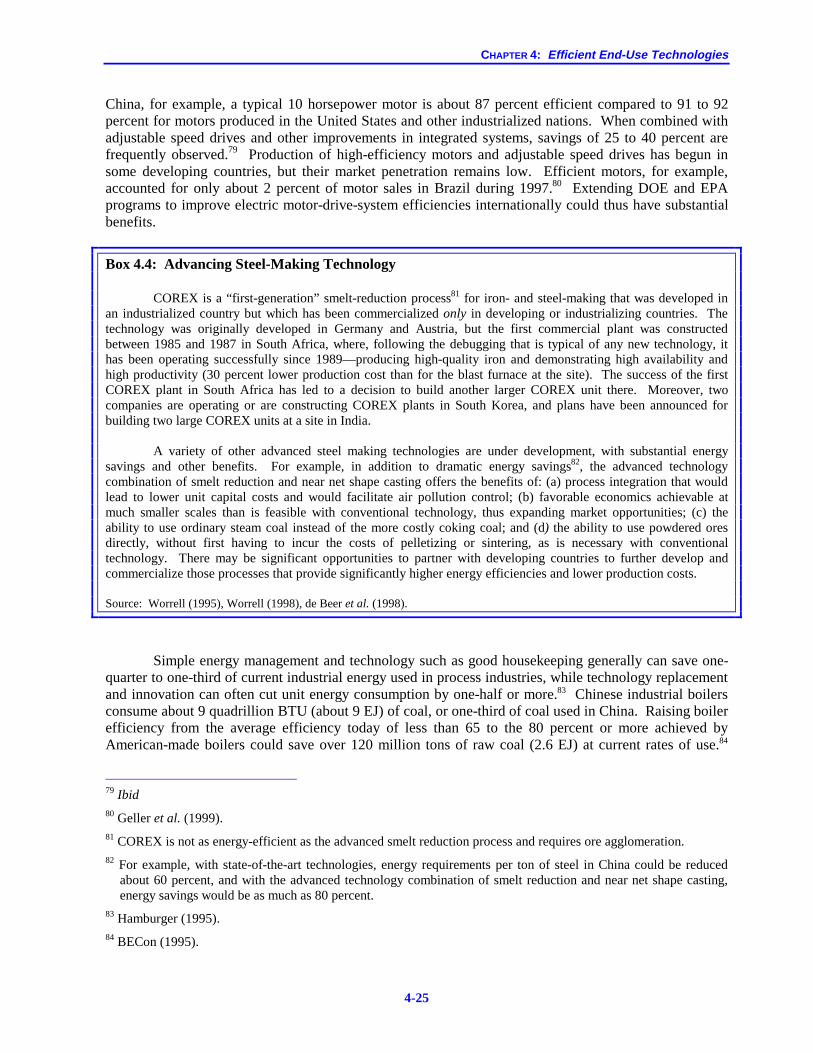
CHAPTER 4: Efficient End-Use Technologies
4-25
China, for example, a typical 10 horsepower motor is about 87 percent efficient compared to 91 to 92 percent for motors produced in the United States and other industrialized nations. When combined with adjustable speed drives and other improvements in integrated systems, savings of 25 to 40 percent are frequently observed.79 Production of high-efficiency motors and adjustable speed drives has begun in some developing countries, but their market penetration remains low. Efficient motors, for example, accounted for only about 2 percent of motor sales in Brazil during 1997.80 Extending DOE and EPA programs to improve electric motor-drive-system efficiencies internationally could thus have substantial benefits.
Box 4.4: Advancing Steel-Making Technology
COREX is a “first-generation” smelt-reduction process81 for iron- and steel-making that was developed in an industrialized country but which has been commercialized only in developing or industrializing countries. The technology was originally developed in Germany and Austria, but the first commercial plant was constructed between 1985 and 1987 in South Africa, where, following the debugging that is typical of any new technology, it has been operating successfully since 1989—producing high-quality iron and demonstrating high availability and high productivity (30 percent lower production cost than for the blast furnace at the site). The success of the first COREX plant in South Africa has led to a decision to build another larger COREX unit there. Moreover, two companies are operating or are constructing COREX plants in South Korea, and plans have been announced for building two large COREX units at a site in India. A variety of other advanced steel making technologies are under development, with substantial energy savings and other benefits. For example, in addition to dramatic energy savings82, the advanced technology combination of smelt reduction and near net shape casting offers the benefits of: (a) process integration that would lead to lower unit capital costs and would facilitate air pollution control; (b) favorable economics achievable at much smaller scales than is feasible with conventional technology, thus expanding market opportunities; (c) the ability to use ordinary steam coal instead of the more costly coking coal; and (d) the ability to use powdered ores directly, without first having to incur the costs of pelletizing or sintering, as is necessary with conventional technology. There may be significant opportunities to partner with developing countries to further develop and commercialize those processes that provide significantly higher energy efficiencies and lower production costs. Source: Worrell (1995), Worrell (1998), de Beer et al. (1998).
Simple energy management and technology such as good housekeeping generally can save one-quarter to one-third of current industrial energy used in process industries, while technology replacement and innovation can often cut unit energy consumption by one-half or more.83 Chinese industrial boilers consume about 9 quadrillion BTU (about 9 EJ) of coal, or one-third of coal used in China. Raising boiler efficiency from the average efficiency today of less than 65 to the 80 percent or more achieved by American-made boilers could save over 120 million tons of raw coal (2.6 EJ) at current rates of use.84
79 Ibid 80 Geller et al. (1999). 81 COREX is not as energy-efficient as the advanced smelt reduction process and requires ore agglomeration. 82 For example, with state-of-the-art technologies, energy requirements per ton of steel in China could be reduced
about 60 percent, and with the advanced technology combination of smelt reduction and near net shape casting, energy savings would be as much as 80 percent.
83 Hamburger (1995). 84 BECon (1995).

Powerful Partnerships
4-26
Particular care will be needed, however, to ensure that the technology chosen does not inadvertently increase greenhouse gas emissions through other pathways.85 Improving existing emerging-market industrial technology by retrofitting steam and motor systems provides rapid return on investment (see Table 4.5).
Generating power on-site offers significant energy-savings opportunities. Some large U.S.
industries routinely generate electric power in combination with steam and heat used in production. The U.S. pulp and paper industry is a leader in industrial cogeneration—or combined heat and power (CHP), as combined heat and power production is called. Most industry today uses Rankine-cycle (steam turbine) systems with electricity-generating efficiencies of about 33 percent or less, about the same (or slightly lower) than conventional central station power generation. New Brayton cycle (gas turbine) CHP systems achieve power generation efficiencies of 55 percent or higher. Higher rates of electricity generation are desirable as electricity is much more valuable than steam both thermodynamically and economically. Table 4.6 indicates the much higher ratios of power production to steam that are possible with different CHP configurations. For both Rankine and Brayton systems, waste heat from the electricity generation cycle is used to produce steam for use in the industrial plant or other purposes. Compared to conventional electric power plants that throw away the waste heat, CHP systems use both the power and the heat, raising overall (electricity plus heat) efficiencies to as high as 80 to 90 percent.
Table 4.5: Energy Efficiency Investments Provide High Returns: The Case of Poland
Option Internal Rate of Return
(percent)
Replacing steam traps >335 Replacing gas residential boilers >210 Installing low pressure sodium street lighting >155 Replacing industrial electric motors >55 Installing industrial heat controls >40 Installing compact fluorescent lights >18
Source: Michalik et al. 1993 These new advanced gas-turbine technologies are cost effective at much smaller scales than in the past, suggesting that “district heating” or “district cooling” can also be cost-effective at much smaller scales, and in many cases the “district” being served can be one or just a small number of buildings.86 This new approach could open up a large potential for CHP, especially given the need to upgrade or replace much of that capacity in the former Soviet Union, Eastern Europe, and China. A number of European countries have demonstrated that industrial CHP and district heating systems can provide 10 percent and more of electric power demand (Figure 4.4). Denmark, in fact, has adopted a goal of providing 100 percent of all new electric generating capacity from CHP. While that country is in a cold climate and therefore has a relatively large heat demand, new technologies are flexible enough that heat demand is not a major constraint, and because cooling can also be provided. Based on the European experience and using these advanced turbine systems, it may be possible to ultimately provide 20-40 percent or more of electric power from CHP systems in a number of developing and transition countries. 85 Note that using circulating fluidized boilers to accomplish this can negate the carbon emissions reductions due to
increased N2O emissions, which can be two orders of magnitude higher than for conventional pulverized coal plants. Using limestone to control sulfur emissions will increase CO2 emissions by up to 30% more than the carbon in the coal used in the boiler alone.
86 Elliott and Spurr (1999).
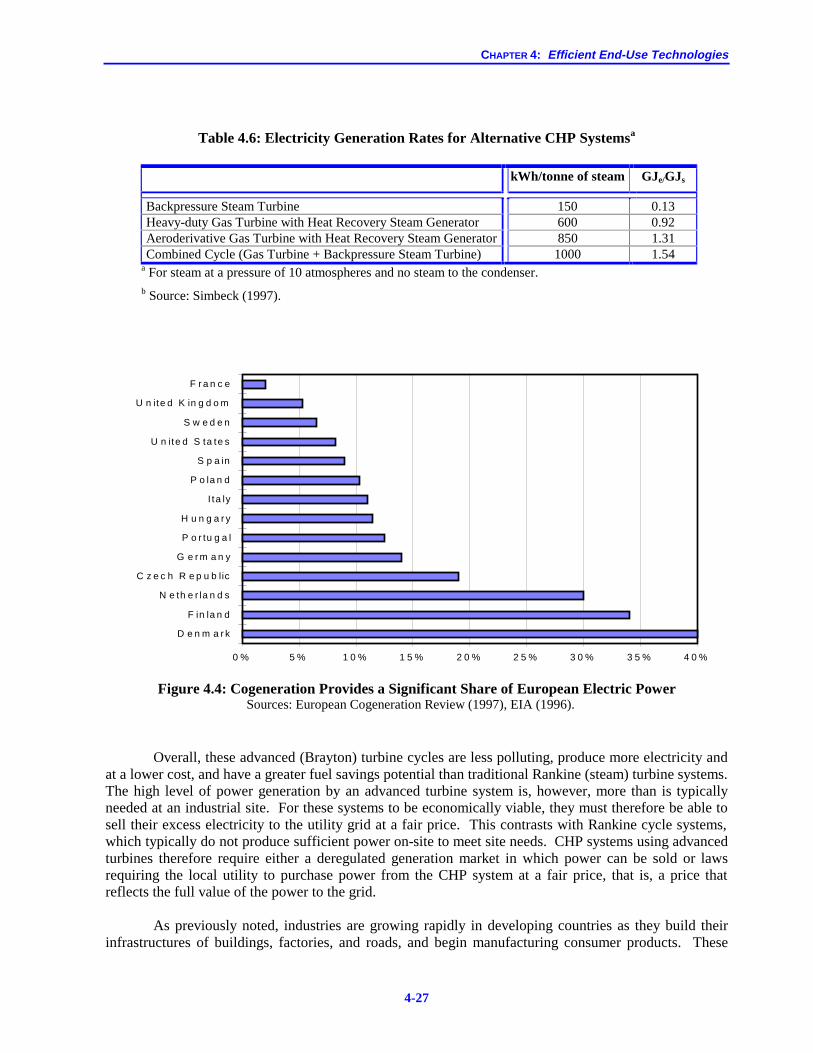
CHAPTER 4: Efficient End-Use Technologies
4-27
Table 4.6: Electricity Generation Rates for Alternative CHP Systemsa
kWh/tonne of steam GJe/GJs
Backpressure Steam Turbine 150 0.13 Heavy-duty Gas Turbine with Heat Recovery Steam Generator 600 0.92 Aeroderivative Gas Turbine with Heat Recovery Steam Generator 850 1.31 Combined Cycle (Gas Turbine + Backpressure Steam Turbine) 1000 1.54
a For steam at a pressure of 10 atmospheres and no steam to the condenser. b Source: Simbeck (1997).
0 % 5 % 1 0 % 1 5 % 2 0 % 2 5 % 3 0 % 3 5 % 4 0 %
D e n m a r k
F in la n d
N e th e r la n d s
C z e c h R e p u b lic
G e r m a n y
P o r tu g a l
H u n g a r y
I ta ly
P o la n d
S p a in
U n ite d S ta te s
S w e d e n
U n ite d K in g d o m
F r a n c e
Figure 4.4: Cogeneration Provides a Significant Share of European Electric Power
Sources: European Cogeneration Review (1997), EIA (1996). Overall, these advanced (Brayton) turbine cycles are less polluting, produce more electricity and
at a lower cost, and have a greater fuel savings potential than traditional Rankine (steam) turbine systems. The high level of power generation by an advanced turbine system is, however, more than is typically needed at an industrial site. For these systems to be economically viable, they must therefore be able to sell their excess electricity to the utility grid at a fair price. This contrasts with Rankine cycle systems, which typically do not produce sufficient power on-site to meet site needs. CHP systems using advanced turbines therefore require either a deregulated generation market in which power can be sold or laws requiring the local utility to purchase power from the CHP system at a fair price, that is, a price that reflects the full value of the power to the grid.
As previously noted, industries are growing rapidly in developing countries as they build their
infrastructures of buildings, factories, and roads, and begin manufacturing consumer products. These

Powerful Partnerships
4-28
industries offer a large opportunity for using CHP systems with advanced turbines. Technology improvement involves more than machines. Simply developing and demonstrating
the technologies for emerging markets is not enough. Efficiency measures must be installed and used correctly. In addition, the barriers that arise from market distortions, inadequate infrastructures, institutional and structural weaknesses, and other problems must be overcome. Solutions to these problems include macroeconomic, energy sector reform/restructuring, and industry-specific responses. Education and training, technical assistance, demonstrations, and finance are needed. This panel has developed a set of initiatives that illustrate measures the President and Congress can use to address these problems and simultaneously help U.S. industry. Two initiatives specific to the industrial sector follow. High Priority Initiative: Inventing the Factories of the Twenty-first Century
Goal The goal of this initiative is to engage U.S. industry in partnerships to reduce the energy intensity
of major energy-using industrial processes in key developing and transition countries over the next two decades by 40 percent compared to their current performance, while improving labor and capital productivity. This effort will be guided by the on-going U.S. “Industries of the Future” program, focusing on areas of high foreign market growth in energy-intensive materials. This initiative should be funded at $10 million per year in FY2001, increasing to $20 million per year in FY2005. U.S. Actions
(1) cooperation between the U.S. public and private sectors and foreign counterparts to develop “technology roadmaps” for more productive and energy-efficient industrial processes geared to local circumstances, with emphasis on energy-intensive basic-materials industries such as iron and steel, chemicals, pulp and paper, and cement;
(2) cooperative development and implementation, starting from these roadmaps, of RD3
work-plans including human and institutional capacity building, pre-competitive research and development, technical exchanges, and pilot demonstration programs;
(3) support by U.S. and partner governments for project development and implementation,
joint-venture creation, and licensing to facilitate technology transfer between U.S. firms and their partners.
Elaboration
Much of the market growth in energy-intensive materials will be in developing countries over the
next several decades as they build their infrastructures of buildings, factories, and transport, and developing countries therefore offer a favorable environment for rapid innovation as new materials production facilities are built. This growth and building will occur with or without U.S. involvement.87 The intent of this initiative is to strengthen the efforts of U.S. firms to partner with foreign counterparts in developing these innovative technologies when it is in the U.S. interest, ultimately strengthening U.S. competitiveness at home and abroad.
87 As noted previously, other factors important in creating an opportune environment for innovation, include the
availability of skilled labor, financing, material resources, and sound government policies.

CHAPTER 4: Efficient End-Use Technologies
4-29
The U.S. DOE already implements an Industries of the Future program, with excellent industrial participation, which engages U.S. energy-intensive industries to develop visions of their technologies into the future. DOE uses these roadmaps to guide its research in pre-competitive areas chosen as most likely to help achieve the private sector’s vision and goals. DOE’s current Industries of the Future effort positions it to lead a similar international industrial-energy-technology RD3 effort. The Agency for International Development can deliver training and support the early participation of potential partners, as described in Chapter 3.
There is an opportunity to cooperate with OECD countries on best-practice industrial processes, energy-efficiency technologies, and efficiency goals for industry. This collaboration would involve an exchange of experts and information with other countries such as the United Kingdom, the Netherlands, Germany, and Australia, which already have programs in which their governments work with industry on “best practices”, sectoral energy-intensity reduction targets, and voluntary agreements. The United States could learn from this experience, and could continue to attempt to replicate and adapt successful European initiatives such as the “Best Practices” program in the Netherlands.88 These enhanced collaborations with other industrial countries would also contribute to collaborative efforts with developing and transition countries. U.S. public, multilateral (for example World Bank, IFC, GEF), and other financing mechanisms as described in Chapter 3 would be used in support of developing and deploying these energy-efficient industrial processes.
Many U.S. firms that produce energy-intensive basic materials already operate in the global marketplace; implementation of this initiative would strengthen their efforts, particularly in developing country markets, and would also support additional exchanges with industrial country counterparts. As noted previously, over the next several decades most of the market growth in energy-intensive materials will take place in the developing countries that are now building their national infrastructures of buildings, factories, and roads. This will create a favorable environment for rapid innovation as new factories are built (Box 4.4). U.S. firms have the choice of either taking a strong leadership role in developing these innovations, or of risking serious challenges in the future as those innovative technologies/products are developed independently abroad and eventually come back and begin to compete with U.S. firms domestically.
Developing-country industrial output is expected to increase by some 2.5 to 3.0 times over current levels by 2020. In comparison, developed-country industrial output is expected to increase by 25 to 35 percent over this period. Reduction of developing-country basic-processing energy intensity by 40 percent over this period would save roughly 10 to 15 EJ per year by the end of this period compared to a business-as-usual performance improvement.89
Almost no U.S. funding currently exists for international industrial-energy-efficiency efforts. Indeed, there is almost no international institutional structure that supports industrial energy-efficient technology development. The U.S. government should leverage its funding by encouraging the European Union, the Japanese New Energy Development Organization, and agencies such as the World Bank and
88 Dowd and Boyd (1998). 89�2XWSXW�OHYHOV�IURP�1DNLüHQRYLü�et al. 1998. Estimated savings based on world industrial energy use of 134 EJ in
1990 (Worrell, 1997a), basic materials processing accounting for half of industrial energy use, global industrial output doubling by 2020, developing country share of industrial output increasing from 14 percent in 1990 to 31 WR����SHUFHQW�LQ�������1DNLüHQRYLü�et al. 1998), BAU energy efficiency improvement at -0.83 percent/year or a 15 percent reduction over this period, and this initiative stimulating a 40 percent reduction in energy use. Together, these give 10 to 15 EJ savings on the basic materials processing energy consumption in developing countries. The fraction of this potential that can actually be realized was not estimated here.

Powerful Partnerships
4-30
Global Environmental Facility to partner with it to foster global industrial energy efficiency. High Priority Initiative: Maximizing Use of Combined Heat and Power
Goal
PCAST recommends that the United States work with other industrial, transition, and developing country partners to encourage the maximum use, where appropriate, of combined heat and power (CHP) for new power supply. In particular, for developing countries the goal of this initiative is to develop 20 percent of new power generating capacity from CHP. This initiative should be funded at $10 million per year in FY2001, increasing to $20 million per year in FY2005.
U.S. Actions
(1) The United States public and private sectors would work with developing, transition, and industrial country partners on CHP information and education programs, including regional workshops, for public- and private-sector participants.
(2) The international CHP program would support ongoing assessments of potential CHP sites to
determine power and heat loads and output ratios in order to identify favorable conditions for CHP, and identify and address potential regulatory and market barriers, help attract funding for demonstrations of CHP, and help secure financing for deployment.
(3) As part of energy sector reform and restructuring (Chapter 3), U.S. experts from DOE, USAID,
and EPA would provide technical and policy assistance to other countries to develop and implement policies that “level the playing field” for CHP systems and for U.S. CHP equipment, including provisions for power sales to the grid at market rates, nondiscriminatory power buy-back rates, interconnection and emissions standards, and nondiscriminatory international standards for CHP equipment. Elaboration
Combined Heat and Power generates electrical or mechanical and thermal energy or cooling
together at the point of use. It is an attractive, cost-effective option where on-site generation of power and process steam or space conditioning can be built (or in some cases retrofit) into district or industrial complexes. New CHP systems can provide high power-generation efficiencies—roughly comparable to new central-station power plants even at smaller scales—reduce transmission and distribution (T&D) losses compared to transmitting power from a central station plant if the power is used on or near the site, and at the same time make use of a substantial fraction of the waste heat. Technology opportunities include advanced gas turbines, micro turbines90, and various advanced fuel cells for use in generating power, heat, chilling, and many other applications. (See also Chapter 5 for a discussion of the complementary co/trigeneration initiative, and Box 2.2.)
With rapid growth in demand for electric power-generation capacity in developing countries expected in the future, there is a large opportunity to place these CHP technologies at the point of use and to produce simultaneously the heat energy needed for apartments, commercial buildings, and manufacturing complexes. Careful analysis of the thermal demand during the year is needed in order to properly identify and optimize CHP applications.
90 Note that micro turbines operate at lower efficiency than standard-size advanced gas turbines.

CHAPTER 4: Efficient End-Use Technologies
4-31
A key element of tapping the CHP potential is to provide appropriate regulatory and structural
support, including energy-sector reform and restructuring that allows sales of power to the grid at market rates (Chapter 3). Lessons learned from U.S. and from international experiences in CHP can be developed and applied to a broad range of countries.
The aim in each country would be to leverage the implementation of CHP to the point where its
further development could be self-sufficient. This initiative would therefore help assess the CHP market potential, evaluate market barriers, develop appropriate human capacity, and design applications, as appropriate. It would also examine biomass, fuel-cell, and advanced-turbine hybrid-system opportunities. Management might best be provided by a steering committee composed of DOE, USAID, the World Bank, the International Cogeneration Alliance, and selected developing country representatives. The U.S. government would also work to shift priority for power-sector lending by U.S. Agencies such as the Export-Import Bank and by Multilateral Development Banks such as the World Bank Group, from conventional central-station supply to CHP projects where appropriate (Chapter 3).
The United States is the leading manufacturer of energy-efficient CHP systems, and this initiative would help keep U.S. industry competitive globally. Congressional, state, NGO, and industry representatives have demonstrated strong support for government-industry cooperation to deploy CHP systems. For example, DOE in 1998 announced a goal of doubling the CHP installed domestically by 2010. Market interest in CHP has gained strength in many European countries. At the same time, it is important that U.S. firms have a “level playing field” on which to compete for market share. This will require attention to developing performance-based standards—rather than prescriptive standards that could potentially lock out U.S. equipment—so that customers get the best equipment and price, and U.S. firms have a fair chance to compete. Ongoing international workshops are a good forum for such a dialogue. CLOSE
The energy efficiency initiatives identified in this chapter can effectively extend and complement those proposed in PCAST 97 and will provide substantial leverage to address the energy-linked challenges described in Chapter 1. Table 4.7 arrays these initiatives against sectoral energy consumption.
In closing, it is useful to examine the potential leverage some of the initiatives proposed in this chapter have on particular problems, such as local air pollution. Rural and urban air pollution is a serious problem for developing and transition countries. For example, Total Suspended Particulate (TSP) levels are much higher in developing than in industrial countries and roughly 90 percent of global exposure to TSPs is in developing countries (Table 4.8). This can lead to significant health impacts (see Box 1-2). In China, for example, indoor air pollution primarily from burning coal and biomass for cooking and heating has been estimated to cause over 100,000 premature deaths annually; air pollution in major cities has been estimated to cause about 180,000 premature deaths91; in India, premature deaths due to indoor air pollution have been estimated at 400,000.92 In rural areas, TSPs are primarily driven by exposure to smoke from open fires used for cooking. The cookstove initiative addresses this problem. For urban air pollution, typically three-quarters or more of carbon monoxide, half or more of hydrocarbons and NOx, and one-quarter to one-half of TSP is due to motor vehicles.93 In developing countries such as India, two- 91 World Bank (1997). 92 Smith (1999). 93 Faiz (1993).
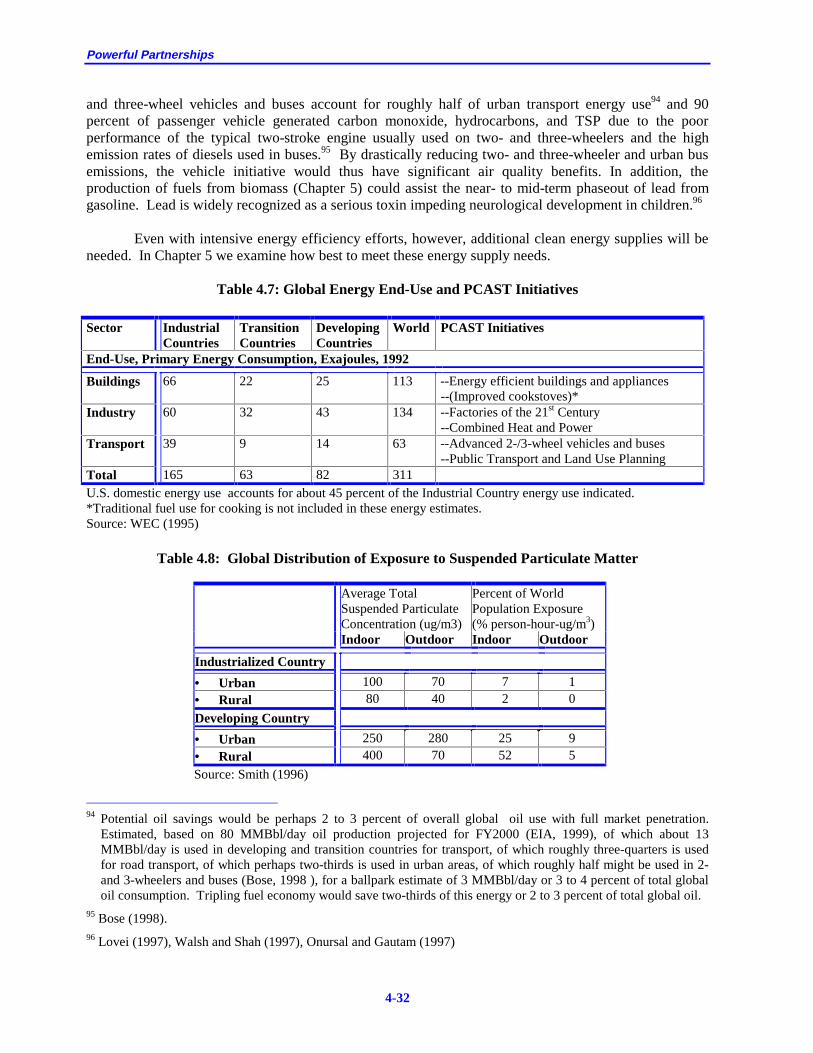
Powerful Partnerships
4-32
and three-wheel vehicles and buses account for roughly half of urban transport energy use94 and 90 percent of passenger vehicle generated carbon monoxide, hydrocarbons, and TSP due to the poor performance of the typical two-stroke engine usually used on two- and three-wheelers and the high emission rates of diesels used in buses.95 By drastically reducing two- and three-wheeler and urban bus emissions, the vehicle initiative would thus have significant air quality benefits. In addition, the production of fuels from biomass (Chapter 5) could assist the near- to mid-term phaseout of lead from gasoline. Lead is widely recognized as a serious toxin impeding neurological development in children.96
Even with intensive energy efficiency efforts, however, additional clean energy supplies will be needed. In Chapter 5 we examine how best to meet these energy supply needs.
Table 4.7: Global Energy End-Use and PCAST Initiatives
Sector Industrial
Countries Transition Countries
Developing Countries
World PCAST Initiatives
End-Use, Primary Energy Consumption, Exajoules, 1992
Buildings 66 22 25 113 --Energy efficient buildings and appliances --(Improved cookstoves)*
Industry 60 32 43 134 --Factories of the 21st Century --Combined Heat and Power
Transport 39 9 14 63 --Advanced 2-/3-wheel vehicles and buses --Public Transport and Land Use Planning
Total 165 63 82 311 U.S. domestic energy use accounts for about 45 percent of the Industrial Country energy use indicated. *Traditional fuel use for cooking is not included in these energy estimates. Source: WEC (1995)
Table 4.8: Global Distribution of Exposure to Suspended Particulate Matter
Average Total Suspended Particulate Concentration (ug/m3)
Percent of World Population Exposure (% person-hour-ug/m3)
Indoor Outdoor Indoor Outdoor
Industrialized Country
• Urban 100 70 7 1 • Rural 80 40 2 0
Developing Country
• Urban 250 280 25 9 • Rural 400 70 52 5
Source: Smith (1996)
94 Potential oil savings would be perhaps 2 to 3 percent of overall global oil use with full market penetration.
Estimated, based on 80 MMBbl/day oil production projected for FY2000 (EIA, 1999), of which about 13 MMBbl/day is used in developing and transition countries for transport, of which roughly three-quarters is used for road transport, of which perhaps two-thirds is used in urban areas, of which roughly half might be used in 2- and 3-wheelers and buses (Bose, 1998 ), for a ballpark estimate of 3 MMBbl/day or 3 to 4 percent of total global oil consumption. Tripling fuel economy would save two-thirds of this energy or 2 to 3 percent of total global oil.
95 Bose (1998). 96 Lovei (1997), Walsh and Shah (1997), Onursal and Gautam (1997)
CHAPTER 4: Efficient End-Use Technologies
4-33
REFERENCES Abdul-Khalek et al. 1998: I.S. Abdul-Khalek, D.B. Kittelson, B.R. Graskow, and Q. Wei, Diesel Exhaust Particle Size: Issues and Trends, Paper 980525, SAE Technical Paper Series, SAE International Congress and Exposition (23-26 February 1998). Ayres 1989: R.U. Ayres, Energy Efficiency in the U.S. Economy: A New Case for Conservation, RR-89-12 (Laxenburg, Austria: International Institute for Applied Systems Analysis 1989). Baldwin 1986: Samuel F. Baldwin, Biomass Stoves: Engineering Design, Development, and Dissemination (Rosslyn, VA and Princeton, NJ: Volunteers in Technical Assistance and Center for Energy and Environmental Studies, Princeton University, 1986). Barnes et al. 1994: D.F. Barnes, K. Openshaw, K.R. Smith, and R. van der Plas, What Makes People Cook with Improved Biomass Stoves: A Comparative International Review of Stove Programs, World Bank Technical Paper Number 242, Energy Series (Washington DC: The World Bank, 1994). Bashmakov 1998: Igor Bashmakov, “Russian Energy Picture”, (Moscow: CENEf, January-April, 1998). Birk and Zegras 1993: M.L. Birk and P.C. Zegras, Moving Toward Integrated Transport Planning: Energy, Environment, and Mobility in Four Asian Cities (Washington, DC: International Institute for Energy Conservation, March 1993). Bose 1998: R.K. Bose 1998, “Automotive Energy Use and Emissions Control: A Simulation Model to Analyze Transport Strategies for Indian Metropolises,” Energy Policy, Vol. 26, No. 13 (1998), pp. 1001-1016. Brohard et al. 1998: G. Brohard et al., Proceedings of the 1998 Summer Study, (Washington, DC: American Council for an Energy Efficient Economy, 1988). Bronowski 1974: Jacob Bronowski, The Ascent of Man, (Little Brown & Company, 1974) Chandler et al. 1990: William Chandler, Alexei Makarov, and Zhou Dadi, “Energy for the Soviet Union, Eastern Europe, and China,” Scientific American (September 1990). Chandler 1998: William Chandler “Assessing Carbon Emissions Control Strategies: The Case of China, Climatic Change, Vol. 13 (1988), pp. 241-265. Chandler 1999: William Chandler, Between Cold War and Global Warming: Energy and Environment in the Transition Economies, forthcoming. China 1996: Department of Resource Conservation and Comprehensive Utilization, State Economic and Trade Commission, Peoples Republic of China, China Energy: Annual Review, 1996. China Daily 1999: China Daily, “China Sees Increase in Car Owners,” (24 February 1999). Chinese Energy Development Report 1997: Chinese Energy Development Report, “Energy Efficient Opportunities in China: Industrial Equipment and Small Cogeneration”, (Beijing: Economic Management Press, 1997).
Powerful Partnerships
4-34
De Beer et al. 1998: Jeroen de Beer, Ernst Worrell, Kornelis Blok, “Future Technologies for Energy-Efficient Iron and Steel Making,” Annual Review of Energy and Environment, Vol.23 (1998), pp.123-205. Dengqing et al. 1996: L. Dengqing, Z. Aling, and J. Xuefeng, “Urban Transport, Energy and Environment Analysis in Beijing,” Energy for Sustainable Development, Vol.111, No.3 (1996), pp.25-30. Donaldson et al. 1996: K. Donaldson, P.H. Beswich, and P.S. Gilmour, “Free Radical Activity Associated With The Surface Of Particles:A Unifying Factor In Determining Biological Activity,” Toxicology Letters, Vol. 88 (1996), pp. 293-298. Dowall and Clark 1996: David E. Dowall and Giles Clark, A Framework for Reforming Urban Land Policies in Developing Countries (Washington, DC: World Bank, 1996). Dowd and Boyd 1998: J. Dowd and G. Boyd, A Typology of Voluntary Agreements Used in Energy and Environmental Policy (Washington, DC: U.S. Department of Energy, Office of Policy and International Affairs, 1998). Duffy 1996: J. Duffy, Energy Labeling, Standards and Building Codes: A Global Survey and Assessment for Selected Developing Countries (Washington, DC: International Institute for Energy Conservation, 1996). Eckert 1995: Jan B. Eckert, The Super Efficient Refrigerator Program: Case Study of a Golden Carrot Program (Golden, CO: National Renewable Energy Laboratory, NREL/TP-461-7281, July 1995). Edmonds 1985: Jae Edmonds, Global Energy (New York: Oxford University Press, 1985). Egan and du Pont 1998: K. Egan and P. du Pont, Asia’s New Standard for Success: Energy Efficiency Standards and Labeling Programs in 12 Asian Countries (Washington, DC: International Institute for Energy Conservation, 1998). Eley et al. 1998: Charles Eley et al., “Contracting for New Building Energy Efficiency,” Proceedings of the 1998 ACEEE Summer Study, Vol. 3, (Washington, DC: American Council for an Energy Efficient Economy, 1998), p. 131. Elliott and Spurr 1999: R.N. Elliott and M. Spurr, Combined Heat and Power: Capturing Wasted Energy (Washington, DC: American Council for an Energy-Efficient Economy, 1999). EIA 1996: Energy Information Administration, Annual Energy Outlook 1997, (Washington, DC: U.S. Department of Energy, 1996) EIA 1998: Energy Information Administration, International Energy Annual 1996, (Washington, DC: U.S. Department of Energy, February 1998), DOE/EIA-0219(98). EIA 1999: Energy Information Administration, International Energy Outlook, (Washington, DC: U.S. Department of Energy, March 1999), DOE/EIA-0484(99). European Cogeneration Review 1997: European Cogeneration Review, Cogen Europe 1997 Faiz 1993: A. Faiz, “Automotive Emissions in Developing Countries: Relative Implications for Global Warming, Acidification, and Urban Air Quality,” Transportation Research-A, Vol. 27A, No. 3 (1993),

CHAPTER 4: Efficient End-Use Technologies
4-35
pp. 167-186. Ferin and Penney 1992: G.O. Ferin and D.P. Penney, “Pulmonary Retention of Ultrafine and Fine Particles in Rats,” Am. J Respir. Cell Mol Biol., Vol. 6 (1992), pp. 534-542. Friedmann 1998: R. Friedmann. “Activities and Lessons Learned Saving Electricity in Mexican Households,” Proceedings of the 1998 ACEEE Summer Study on Energy Efficiency in Buildings, Vol. 5 (Washington, DC: American Council for an Energy-Efficient Economy, 1998), pp. 119-130. Geller and Nadel 1994: H. Geller and S. Nadel, “Market Transformation Strategies to Promote End-Use Efficiency,” Annual Review of Energy and Environment, Vol. 19 (1994), pp. 301-346. Geller and Goldstein 1998: H. Geller and D. Goldstein, Equipment Efficiency Standards: Mitigating Global Climate Change at a Profit (Washington DC: American Council for an Energy-Efficient Economy; and San Francisco, CA: Natural Resources Defense Council, April 1998). Geller et al. 1998: H. Geller, G.M. Jannuzzi, R. Schaeffer, and M.T. Tolmasquim, “The Efficient Use of Electricity in Brazil: Progress and Opportunities,” Energy Policy, Vol. 26, No. 11 (1998), pp. 859-872. Geller et al. 1999: H. Geller, G. Pimentel, J.A. Medeiros, and A. Pinhel. Update on Brazil’s National Electricity Conservation Program (PROCEL) (Washington, DC: American Council for an Energy-Efficient Economy, 1999). Gibbons and Chandler 1981: John H. Gibbons and William U. Chandler, Energy: The Conservation Revolution (New York: Plenum Press, 1981). Gray 1995: Dale Gray, “Reforming the Energy Sector in Transition Economies: Selected Experience and Lessons,” Europe and Central Asia Region, World Bank, (World Bank Discussion Paper, 7 July 1995). Hamburger 1995: Jessica Hamburger, China’s Energy and Environment in the Roaring Nineties, A Policy Primer (Washington, DC: Pacific Northwest Laboratory, June 1995). Herbst 1992: Kris Herbst, “Brazil’s Model City: Is Curitiba Too Good to be True?” Planning (September 1992), pp. 24-27. Hilling 1996: D. Hilling, Transport and Developing Countries (New York: Routledge, 1996). Hirst and Brown 1990: E. Hirst and M. Brown. “Closing the efficiency gap: barriers to the efficient use of energy,” Resources, Conservation and Recycling, Vol. 3 (1990), pp. 267-281. Hu et al.: Hu Xiulan, Jian Kejun, and Zheng Shuang, “The Potential of Energy Efficiency Improvement in China’s Iron and Steel Industry: A Case of Technology Transfer,” Workshop on Technology Transfer, STAP (Amsterdam: January 19-20, 1998). IEA 1997: International Energy Agency, Energy Balances for Organisation for Economic Cooperation and Development (OECD) Countries, 1960-1995 (Paris: OECD, 1997). IIEC 1996: International Institute for Energy Conservation, The World Bank and Transportation (Washington, DC: 1996). IPCC 1996: Intergovernmental Panel on Climate Change, Special Report on Technology, Policy, and
Powerful Partnerships
4-36
Options for Climate Change Mitigation (Geneva: World Meteorological Organization and United Nations Environment Program, 1996). Joint Study Team 1994: Joint Study Team (National Environmental Protection Agency of China, State Planning Commission of China, United Nations Development Programme, and the World Bank), China: Issues and Options in Greenhouse Gas Emissions Control (Washington, DC: World Bank, December 1994). Kammen et al.1999. D. Kammen, G. Wahhaj, and M.Y. Yiadom, 1999. "The Annotated Bibliography on Acute Respiratory Infectiouns and Indoor Air Pollution," at http://www.crosslink.net/~ehp/aribib2.htm (1999). Karakezi and Turyareeba 1995: S. Karakezi and P. Turyareeba. “Woodstove dissemination in Eastern Africa-A Review,” Energy for Sustainable Development, Vol. 1, No. 6 (1995), pp. 12-19. Kittelson 1998: D.B. Kittelson, “Engines and Nanoparticles,” Journal of Aerosol Science (1998). Kruger et al. 1997: M. Kruger, H. Luders, B. Luers, R. Kayfmann, W. Koch, and T. Kauffeldt, “Influence of Exhaust Gas Aftertreatment on Particulate Characteristics of Vehicle Diesel Engines,” Motortechnische Zeitshrift, Vol. 58 (1997). LBNL 1996: Lawrence Berkeley National Laboratory, Center for Building Science, International Energy Efficiency Standards, (Berkeley, CA: 1996). Levine et al. 1995a: Mark D. Levine, Jonathan G. Koomey, Lynn Price, Howard Geller, and Steven Nadel, “Electricity End-Use Efficiency: Experience with Technologies, Markets, and Policies Throughout the World,” Energy, Vol. 20, No.1 (1995), pp. 37-61. Levine et al. 1995b: Levine, M.D., N. Martin, Lynn Price, and Ernst Worrell, Efficient Use of Energy Utilizing High Technology: An Assessment of Energy Use in Industry and Buildings (September 1995). Levine 1999a: Mark D. Levine, Lawrence Berkeley National Laboratory. Presentations on Industry for PCAST Task Force on Energy Demand (San Francisco: January 1999). Levine 1999b: Mark D. Levine, Opportunities for Partnerships Between the United States and China in Energy Efficiency Research, Development, Demonstration, and Deployment, Paper prepared for the PCAST Panel on International Cooperation in Energy RD3 (February 1999). Lewan 1994: Todd Lewan, “Curitiba, Brazil: Model Metropolis Greens and it Grows,” Safety and Health (April 1994), pp. 44-48. Lovei 1997: Magda Lovei, Phasing Out Lead from Gasoline in Central and Eastern Europe, (Washington, DC: World Bank, 1997). Martinot 1997: E. Martinot, Investments to Improve the Energy Efficiency of Existing Residential Buildings in Countries of the Former Soviet Union (Washington, DC: The World Bank, 1997). Martinot 1998: E. Martinot, “Energy Efficiency and Renewable Energy in Russia: Transaction Barriers, Market Intermediation, and Capacity Building,” Energy Policy, Vol. 26, No. 11 (1998), pp. 905-915. Mark and Davis 1998: J. Mark and L.R. Davis, Shifting Gears: Advanced Technologies and Cleaner

CHAPTER 4: Efficient End-Use Technologies
4-37
Fuels for Transit Buses (Cambridge, MA: Union of Concerned Scientists, April 1998). Matrosov et al. (1998): Yuri Matrosov, David Goldstein, and Mark Chao, “Implementation of Regional Energy Building Codes in Russia: Prospects for Impacts and Indigenous Production of Advanced Technologies,” Energy Efficiency, No. 18 (Moscow: CENEf, January-March, 1998), pp. 2-6. Mayer et al. 1995: A. Mayer, H. Egli, H. Burtscher, J. Czerwinski, and H. Gehrig, “Particle Size Distribution Downstream Traps Of Different Design”, SAE Paper 950373 (1995). Mills 1995: E. Mills 1995. “From the Lab to the Marketplace: Making America’ s Buildings More Energy Efficient.” (Berkeley, CA: Lawrence Berkeley National Laboratory, 1995). Nadel 1995: S. Nadel, Chinese Appliance Market: Current Status, Future Directions (Washington, DC: American Council for an Energy-Efficient Economy, 1995). Nadel et al. 1997: S. Nadel, G.F. Min, Yu Cong, and H. Dexia, Lighting Energy Efficiency in China: Current Status, Future Directions (Washington, DC: American Council for an Energy-Efficient Economy, 1997). 1DNLüHQRYLü�et al.��������1��1DNLüHQRYLü��$��*U�EOHU��DQG�$��0DF'RQDOG��HGV���Global Energy Perspectives (Cambridge, UK: Cambridge University Press, 1998). Onursal and Gautam 1997: Bekir Onursal and Surhid P. Gautam, Vehicular Air Pollution: Experiences from Seven Latin American Urban Centers, Technical Paper No. 373 (Washington, DC: The World Bank, 1997) OECD 1997: Organisation for Economic Cooperation and Development, Transportation Statistics 1997 Annual Report (Paris: 1997), p. 236. OTA 1992: U.S. Congress, Office of Technology Assessment, Fueling Development: Energy Technologies for Developing Countries, OTA-E-516 (Washington, DC: U.S. Government Printing Office, April 1992). OTA 1993: U.S. Congress Office of Technology Assessment, Energy Efficiency Technologies for Central and Eastern Europe (Washington, DC: U.S. Government Printing Office, July 1993). Pachauri 1999: R.K. Pachauri, 1999. “Car Emissions Norms not a Solution,” Hindustan Times (New Delhi: January 3 1999). Michalik et al. 1993: Janusz Michalik, Slawomir Pasierb, Jerzy Piwzczek, Michal Pyka, Jan Surowka, Evolution of the Feasibility and Profitability of Implementing New Energy Conservation Technologies in Poland (Katowice, Poland: Polish Foundation for Energy Efficiency, 4 May 1993). Reddy 1991: A.K.N. Reddy, “Barriers to Improvements in Energy Efficiency,” Energy Policy, Vol. 19, No. 7 (1991), pp. 953-961. Reddy et al. 1997: A.K.N. Reddy, R.H. Williams, and T.B. Johansson, Energy After Rio: Prospects and Challenges (New York: UNDP, 1997). Secrest et al. 1994: Tom Secrest et al., “Cost-Effective Energy Efficiency in the Czech Republic,” Proceedings from the ACEEE 1994 Summer Study on Energy Efficiency in Buildings, Vol. 6

Powerful Partnerships
4-38
(Washington, DC: American Council for an Energy-Efficient Economy, 1994), p. 241. SEVEn 1998: Czech Center for Energy Efficiency, “Case Studies of Technology Transfer in the Czech Republic,” (Prague: January 1998). Shu et al. 1997a: Shu, P.H. Jet, Wei-Li Chiang, Bing-Ming Lin, and Ming-Chou Cheng, Mechanical Industry Research Laboratories, Industrial Technology Research Institute, Hsinchu, Taiwan, “The Development of the Electric Propulsion System for the Zero Emission Scooter in Taiwan,” presented at the 1997 Small Engine Technology Conference (Yokohama, Japan: October 1997). Simbeck 1997: Dale Simbeck, “Options for Improving Coal Systems to Reduce Greenhouse Gas Emissions,” presented at the Workshop of Options for Improving Coal Systems to Reduce Greenhouse Gas Emissions, convened by the Scientific and Technical Advisory Panel of the Global Environment Facility, Amsterdam (The Netherlands: 16-17 June 1997). Sinton et al. 1996: Jonathan E. Sinton et al., China Energy Databook, LBL-32822 Rev. 3 (Berkeley, CA: Lawrence Berkeley National Laboratory, 1996). Sinton and Levine 1998: Jonathan E. Sinton and Mark D. Levine, “Energy Efficiency in China: Accomplishments and Challenges,” Energy Policy, Vol. 26, No. 11 (1998), pp. 813-829. Smith 1993: K. Smith, “Fuel Combustion: Air Pollution Exposures and Health in Developing Countries,” Annual Review of Energy and Environment, Vol. 18 (1993), pp. 529-566. Smith et al. 1993: K.R. Smith, G. Shuhua, J. Kun, and Q. Daxiong 1993. “One Hundred Million Improved Cookstoves in China: How Was It Done?,” World Development Vol. 21, No. 6 (1993), pp. 941-961. Smith 1996: Kirk R, Smith, “Indoor Air Pollution in Developing Countries: Growing Evidence of its Role in the Global Disease Burden,” K. Ikeda and T. Iwata, eds. “Indoor Air ’96: The 7th International Conference on indoor Air Quality and Climate,” Institute of Public Health, Tokyo, Japan, vol. 3, 33-44, 1996. Smith, et al. (1999): Kirk Smith, et al. "Overview of the Indian National Burden of Disease from Indoor Air Pollution," http://www.ikweb.com/enuff/public_html/Stoves.html and look under Kirk Smith. Thigpen et al. 1998: S. Thigpen, P. Bertoldi, and T. Takigawa 1998. “Market Transformation Through International Cooperation: The Energy Star Office Equipment Example,” Proceedings of the ACEEE 1998 Summer Study in Buildings (Washington, DC: American Council for an Energy-Efficient Economy, 1998), pp. 5.315-326. Walsh and Shah 1997: Michael Walsh and Jitendra J. Shah, “Clean Fuels for Asia: Technical Options for Moving Toward Unleaded Gasoline and Low-Sulfur Diesel,” Technical Paper No. 377 (Washington, DC: The World Bank, 1997). Warheit et al. 1990: D.B. Warheit, W.C. Seidel, M.C. Carakostas, and M.A. Hartsky, “Attenuation of Perfluoropolymer Fume Pulmonary Toxicity: Effects of Filters, Combustion Method, and Aerosol Age,” Pulmonary Toxicity of Perfluoropolymer Fumes (Academic Press, 1990) pp. 309-329. Wiel et al. 1998: S. Wiel, J. Busch, C. Sanchez, J. Deringer, E. Fernandez, and M. Companano, “Implementing Energy Standards for Motors and Buildings in the Philippines,” Proceedings of the 1998

CHAPTER 4: Efficient End-Use Technologies
4-39
ACEEE Summer Study on Energy Efficiency in Buildings, Vol. 5 (Washington, DC: American Council for an Energy-Efficient Economy, 1998), pp. 339-350. Witcher 1999: Daniel Witcher (Júnior), The Experience of the U.S. ESCO Industry in the International Market, Paper prepared for the PCAST Panel on International Cooperation in Energy RD3 (February 1999). World Bank 1996a: The World Bank, China: Energy Efficient Boilers Project, 1996. See http://www.worldbank.org/htmi/gef/text/meetings/council7/wp/china-br.htm. World Bank 1993: The World Bank, Chinese Energy Conservation Study, Report No. 10813-CHA, (February 1993). World Bank 1996: The World Bank, From Plan to Market: World Development Report 1996 (New York: Oxford University Press, 1996). World Bank 1997: World Bank, Clear Water, Blue Skies (Washington, DC: World Bank, 1997). WEC 1995: World Energy Council, “Energy Efficiency Improvement Utilising High Technology: An Assessment of Energy Use in Industry and Buildings,” Report and Case Studies 1995 (London, United Kingdom: 1995). Worrell 1995: E. Worrell, “Advanced Technologies and Energy Efficiency in the Iron and Steel Industry in China,” Energy for Sustainable Development, Vol. 11 No. 4 (November 1995), pp. 27-40. Worrell et al. 1997a: Ernst Worrell, Mark Levine, Lynn Price, Nathan Martin, Richard van den Broek, and Kornelis Blok, “Potentials and Policy Implications of Energy and Material Efficiency Improvement”, (New York, NY: United Nations, Department of Policy Coordination and Sustainable Development, 1997) Worrell et al. 1997b: Ernst Worrell, Lynn Price, Nathan Martin, Jacco Farla, and Roberto Schaeffer, “Energy Intensity in the Iron and Steel Industry: A Comparison of Physical and Economic Indicators,” Energy Policy, Vol.25 (1997), pp. 272-744. Worrell 1998: E. Worrell, “Energy-Efficient Technologies in the Cement and Steel Industry-Experiences in the 9 Developing Countries,” Workshop on Technology Transfer, convened by the Scientific and Technical Advisory Panel (STAP) of the Global Environment Facility (GEF) (Amsterdam: 19-20 January 1998). Zegras et al. 1995: C. Zegras, D. Guruswamy, A. Tomazinis, and E. Miller, Modeling Urban Transportation Emissions and Energy Use: Lessons for the Developing World (Washington, DC: International Institute for Energy Conservation, 1995). Zhang 1995: Jin Zhang, “Scope of Central Planning Fast Shrinking,” China Economic News, No. 48 (11 December 1995). Zhou 1995: Zhou Dadi, Energy Efficiency Opportunities in China: Industrial Equipment and Small Cogeneration (Pacific Northwest National Laboratory, 1995).
5-1
CHAPTER 5
ENERGY SUPPLY TECHNOLOGIES
The arguments for marginal, incremental change are not convincing—not in this day and age. The future, after all, is not linear. History is full of sparks that set the status quo ablaze.
Peter Bijur, CEO and Chairman, Texaco1
conomic development and quality of life improvements for most of the world’s population will require major expansion in the provision of energy services in the decades ahead. Most of the expected growth will take place offshore, especially in developing countries, and these offshore
markets represent some of the most significant growth opportunities for U.S. energy firms in the coming decades.
• According to the baseline forecast of the U.S. Energy Information Administration (EIA), global energy and electricity demand are expected to increase between 1996 and 2020 by 78 percent and 92 percent, respectively, but U.S. markets are expected to account for, respectively, only 9 percent and 12 percent of these global increments.2
• According to the scenarios developed in the 1998 IIASA/WEC world energy study (see Chapter
1), the required global capital investment in energy-supply technologies (including replacement of retiring equipment) will average $400 billion to $600 billion per year between 1990 and 2020.3
• These investments will continue to take place across a diverse portfolio of energy-supply
technologies—fossil, renewable, nuclear. The ability of U.S. firms to participate in the large overseas components of all of these markets will depend both on the adequacy of U.S. domestic R&D programs in these fields and on the investments made in international ERD3 cooperation.
• Over three quarters of global energy supply—commercial and traditional fuels combined—is
from fossil fuels, and a dominant fossil fuel position will continue for some time to come.
• The EIA projects that more than 90 percent of the net global increment in coal demand between 1996 and 2020 will be in developing countries, most of this in China. Meeting this demand without extremely high environmental and social costs will require improvements in and adoption of advanced coal technologies, and the United States has strong economic and environmental interests in helping to bring this about.
1 Bijur (1998) 2 EIA (1998). 3 1DNLüHQRYLü�et al. (1998).

Powerful Partnerships
5-2
• Although U.S. domestic oil production is projected to decline 0.9 million barrels per day, 1996 to 2020, production at the global level will, under the EIA’s baseline forecast, increase from 72 to 116 million barrels per day.4 This will lead to growing dependence on oil from the Persian Gulf, where most low-cost supplies are concentrated. The growing oil-supply security risks associated with this dependence, together with increasing concerns about air-pollution impacts of oil-product use are stimulating interest in alternative supplies such as clean liquid fuels derived from natural gas or biomass feedstocks.
• Natural gas is the cleanest burning and least carbon-intensive fossil fuel, offering greater potential
for production capacity expansion than oil. Known conventional natural gas resources are unevenly distributed, so that increased natural gas use will require greatly increased transport of this fuel. This in turn will require substantial investments in infrastructure—above all, pipelines—and substantial efforts in creating the regulatory and institutional environments in which these investments and investments in new gas-liquids technology will be forthcoming. Developing more widely distributed unconventional natural gas resources will require new technologies. On all of these fronts—infrastructure for transmission and distribution of conventional natural gas, gas liquids production, and technology for exploiting unconventional gas resources—the United States has much to contribute and much reason to want to do so.
• Renewable energy sources could supply an increasing share of world energy demand with
appropriate investments in technology and infrastructure. Sales of renewable energy technologies have been primarily offshore for some time. Over 80 percent of the photovoltaics market and over 90 percent of the wind turbine market have been outside the United States in recent years and this trend is likely to continue under business-as-usual conditions.5 In future years, the international biomass, photovoltaic, and wind energy markets are likely to be particularly promising for U.S. firms.
• Nuclear power plants are only being built offshore, particularly in Asia; no new plants are under
construction, planned, or even anticipated in the United States. Thus, not only do U.S. nuclear firms rely entirely on offshore markets for growth, but meeting U.S. interests in energy-linked safety and proliferation concerns also dictates continued involvement in the development and dissemination of improved nuclear technologies.
Most currently commercial energy technologies are environmentally damaging with, for instance, serious local health impacts from particulates, regional crop and forest impacts from acids of sulfur and nitrogen, and global impacts from greenhouse gas emissions; or are insecure with, for instance, increasing dependence on oil from the Middle East or growing concerns about nuclear proliferation. Yet there are many advanced clean energy technologies (CETs) that offer promise in dealing with these multiple challenges posed by conventional energy-supply technologies. Many of these same CETs are disadvantaged in the marketplace because of the barriers and market failures discussed in Chapters 1, 3, and 4, and thus government involvement in reducing these barriers and addressing these market failures is warranted.
In this Chapter, the technological and economic prospects for advanced renewable, fossil, and nuclear technologies are briefly reviewed, building on the findings of the previous PCAST Energy R&D Panel (1997). Following these reviews, initiatives for international collaboration on ERD3 are proposed for advancing promising clusters of CETs in ways that would enhance the prospects that: (a) future global 4 EIA (1998). 5 Siegel and Rackstraw (1999).

Chapter 5: Energy Supply Technologies
5-3
energy needs might be met while simultaneously addressing effectively the challenges posed by conventional energy; (b) U.S. economic, environmental, and security interests would be advanced, including by engaging developing countries in a range of efforts to address global energy-linked economic, security, and environmental challenges; and (c) U.S. firms would acquire information helping them tailor their products to improve their competitiveness in global markets.
Energy-supply initiatives would be carried out with industrialized, developing, and transition country partners in host countries where adequate energy market reforms are in place, complemented by measures that promote ERD3 activity as a public benefit (see Chapter 3). Initiatives would have elements spanning the entire ERD3 value chain—involving capacity-building, collaborative R&D, demonstrations, buy-down, and widespread deployment aspects. The mix of these activities would vary from one technology to another, but there would be some common elements to these activities across technologies. For all collaborative ERD3 activities host country interests could be advanced by partial support from a PBF. Both collaborative R&D and demonstrations are needed for developing and transition country applications of CETs heretofore developed with mainly U.S. markets in mind, because such technologies must often be modified to conform to local needs. In addition, some technologies (such as small-scale, labor-intensive biomass power-generating systems) might warrant high priority for developing country applications, but would have insignificant market prospects in the United States, where labor costs are high. Such collaborations might best be carried out by U.S. teams partnering with local groups. The most effective strategies are likely to be those in which private-sector firms that would eventually be involved in deployment also play major roles in both R&D and in demonstration (see Chapter 3). The United States can also benefit from partnerships with other industrialized countries in the pursuit of generic or pre-competitive research relating to CETs. For some energy-supply initiative activities Global Environment Facility (GEF) resources would help pay for incremental costs that reflect global climate change benefits—in demonstrations, buy-downs, and widespread deployment, as appropriate, leveraging inputs of additional financial resources from the World Bank (WB) and International Finance Corporation (IFC) to help finance base-cost components for such activities. For demonstration projects, private-sector partners would be responsible for much of the investment cost (see Chapter 3). The U.S. government might also make contributions—e.g., in the form of tax credits that could be provided for demonstrations carried out under a DSF organized in accordance with U.S. Treasury specifications for qualifying activity (see Chapter 3). The national laboratories could provide technical support (e.g., for studies, and ancillary collaborative R&D) as needed to facilitate demonstration projects. RENEWABLE ENERGY Background Renewable energy technologies (RETs) can provide electricity, heat or combined heat and power (CHP) for buildings and industry, and fuels for transport, while addressing global challenges. Properly managed, RETs generally have very few adverse health or environmental impacts, because greenhouse gas (GHG) and air-pollutant emissions, water contaminants, and solid wastes are minimal. By using RETs, the risk of global warming and dependence on oil imports can be reduced, many of the regulatory controls on air emissions that are in place today become irrelevant, decommissioning costs are minimal, and long-term liability for possible environmental or health damages is virtually eliminated.
Powerful Partnerships
5-4
The global potential for renewables is large. Estimates of the wind-electric potential that is practical to exploit range from two to five times the current global electricity generation rate.6 There are good prospects that it will become economically feasible to deploy flat-plate photovoltaic (PV) systems near users, even in areas of modest insolation, on residential and commercial building rooftops, or in small arrays near buildings. With the thin-film PV technology projected for 2030 (13 to 14 percent system efficiency—see Table 5.1), a modest 50m2 (500ft2) array could provide present U.S. per capita electricity generation rates in areas of average U.S. insolation (1,800 kWh/m2 per year). Because of the low efficiency of photosynthesis, the potential for biomass energy will eventually be constrained by competition for land. If biomass-derived energy is used in energy-efficient end-use devices, however, the role of biomass in the global energy economy could be substantial. For example, if biomass is converted to hydrogen for use in 100 mpg (gasoline-equivalent) fuel-cell cars, estimated recoverable forest-product and grain-crop residues worldwide in 2025 would be adequate to support 1.4 billion automobiles, more than two-and-a-half times the present global number.7 Developing countries are attractive markets for RETs. The modest scales typical of most RETs make them good fits for the energy systems there. The inherent cleanliness of RETs makes them attractive options for helping to meet environmental goals, without the need for complicated regulatory measures, which are difficult to enforce in countries with weak infrastructures for environmental regulation. Moreover, as pointed out in Chapter 3, many developing-country energy markets would be attractive theaters for early deployment and accelerated cost reductions for RETs and other CETs. RETs based on commercially-available technologies, or improved technologies that could be developed in the near term, often make it feasible to bring modern energy services to rural areas much more quickly and at lower cost than would be feasible by extending electricity grids. Furthermore, the energy provided would be suitable for more services and be far cleaner than that provided by the traditional, non-commercial energy supplies currently used. There has been substantial progress in cost reduction for RETs. New RETs can often provide electricity today at competitive prices in various remote markets and in some grid-connected applications. Examples for areas of developing countries remote from electricity grids include PV, which is competitive in markets such as household lighting, and small wind turbines and reciprocating engine-generator sets powered by gasified biomass, which are often competitive as alternatives to diesel power in village minigrids or small industrial installations. Moreover, for grid-connected applications, wind power is often competitive where high-quality wind resources are available near major electricity markets. If technological progress continues through R&D, and if the technological gains can be translated into viable commercial products, the prospects for bringing RETs to broad market competitiveness are good. Future economic prospects for wind, thin-film photovoltaic, and the “power-tower” variant of solar thermal-electric power are indicated in Table 5.1. These projections imply that it might be feasible over the next five years to establish industries for some intermittent renewable electric technologies in markets large enough to begin rapid “virtuous cycles” of scaling up production, thereby driving down costs and broadening the market base, making possible further increases in production volumes and still lower costs, as a result of both learning-by-doing and continuing technological improvement.
6 The former estimate is from WEC (1994) and the latter from Grubb and Meyer (1993). 7 Recoverable residues are assumed to be ¾ of total mill residues, ½ of total logging residues, and ¼ of total grain-
crop residues—the energy content of which is comparable to 3/5 of current Persian Gulf oil output. Williams (1995).
Chapter 5: Energy Supply Technologies
5-5
If, as projected in Table 5.1, the cost of wind power will soon fall below 3¢ per kWh, it might be feasible to design cost-competitive “baseload” wind-power systems by coupling wind farms to suitable electrical-storage systems.8 For the levels of storage required (typically a day or more of storage capacity), compressed-air energy storage (CAES), a commercially-ready technology, is especially promising (see Table 5.2). The commercial availability of such baseload wind-power systems would make it practical to exploit, and bring to major electricity markets via long-distance transmission lines, good wind resources that are remote from such markets, such as the wind resources of the Great Plains in the United States (see Table 5.1, footnote b) and of Inner Mongolia in China (see Box 5.1). At present, PV systems are mainly competitive in remote telecommunications, rural applications in developing countries (e.g., for residential light and medicine refrigeration), and other niche markets. But this may soon change. Some PV vendors are projecting that over the next 5 years costs for grid-connected PV systems will fall to about $3,000/kW from their current level of about $6,000 per kilowatt for the least-costly rooftop PV systems on the market today, an outlook that is shared by EPRI/DOE analysts (see Table 5.1).9 At this projected system price the Utility Photovoltaic Group has estimated that the U.S. market for grid-connected, distributed PV systems would be 3,300 to 4,300MW, which is 25 to 35 times the annual global PV-module production rate at the present time.10 A recent report prepared for the Environmental Projects Unit of the International Finance Corporation (IFC) concluded that if the world PV industry could be given assurances (e.g., by the IFC) that there would be a sustained global market of several hundred MW of grid-connected PV systems per year, the prospects would be moderate to high that PV system costs of $3,000 per kW could be reached in 3 to 5 years, a price at which there may be substantial developing-country markets where grid-connected PV systems would be competitive.11
Biomass from either agricultural or forest product industry residues, or new crops dedicated to energy production or optimized for the co-production of energy and other products, can provide both electricity and clean fluid fuels for transportation, cooking, and other uses. Especially promising are strategies that involve co-production of fluid fuels and other products (e.g., electricity, process heat, chemicals, fiber products, and food products), employing either thermochemical or biological processes for biomass conversion.
For thermochemical processes that begin with gasification, progress can be rapid, exploiting
advances already made for fossil-fuel applications. For example, recently developed liquid-phase reactors for the production of Fischer-Tropsch liquids from fossil fuels used in “once-through” processes might be applied to the co-manufacture of clean synthetic LPG cooking fuels plus electricity from crop residues in countries such as China (see Box 5.3).12 DOE has a major ERD3 program for making ethanol from woody feedstocks using enzymatic hydrolysis—a technology that offers promise for transport applications.13 A target of opportunity in Brazil and other developing countries is co-production of ethanol and CHP from cane residues in the sugar-cane industries—using the cellulose and hemicellulose in the residues for ethanol production and the lignin for CHP. 8 Cavallo (1995). 9 Forest and Braun (1997), Lawry (1996). 10 UPVG (1993). 11 RECS (1999). 12 Bechtel (1990), Jager (1997), Choi et al. (1997). 13 PCAST (1997).

5-6
Table 5.1: Project Levelized Cost of Alternative Central Station Renewable-Electric Technologiesa
1997 2005 2010 2020 2030
Wind Wind farm capacity (MW) 25 50 50 50 50 Wind power classb 4 6 4 6 4 6 4 6 4 6 Electricity costc (¢ per kWh) 6.3 4.9 3.4 2.8 3.1 2.5 3.0 2.4 2.8 2.4
PV (thin-film) Plant capacity (MW) 0.02 10 20 20 20 System efficiency (percent) 4.8 8.8 11.2 12.8 13.6 Total installed system cost ($/W) 9.3 2.9 1.5 1.11 0.88 Insolation (kWh per sq. m) 1800 2300 1800 2300 1800 2300 1800 2300 1800 2300 Electricity costc (¢ per kWh) 61.3 48.1 18.7 14.6 9.7 7.7 7.1 5.6 5.6 4.5
Solar thermal (power tower) Plant capacity (MW) - 100 200 200 200 Insolation [kWh per sq. m (direct normal)] - 2700 2700 2700 2700 Electricity costc (¢ per kWh) - 7.6 5.8 4.7 4.7 a Source: EPRI and DOE (1997). b Classes 6 and 4 represent “high-quality” (6.4 to 7.0 m/s average wind speed at 10 m) and “moderate-quality” (5.6 to 6.0 m/s average wind speed at 10 m) wind resources, respectively. In the United States, the practically recoverable wind-electric potential (excluding all wilderness and urban areas, 50 percent of forest lands, 30 percent of farm lands, and 10 percent of barren and range lands) is about 3 times the current U.S. electricity generation rate for Classes 4-6. About 80 percent of the exploitable Class 4 wind resources and over 90 percent of the exploitable resources in Classes 4-6 are located in the 12 States of the Great Plains (Elliott et al., 1991). c Capital charges in each case are calculated assuming a 10 percent cost of capital, a 25-year plant life, and an insurance charge of 0.5 percent per year. Corporate income and property taxes are neglected. Thus, the annual capital charge rate is 0.12

Chapter 5: Energy Supply Technologies
5-7
Table 5.2: Capital Costs for Electricity Storage (1997 Dollars)
Technology Component Capital Cost Total Capital Cost ($/kW)
Discharge capacity ($/kW)
Storage ($/kWh)
2 hour storage
20 hour storage
Compressed air Large (350 MW) 350 1 350 370 Small (50 MW) 450 2 450 490 Above ground (16 MW) 500 20 540 900 Conventional pumped hydro 900 10 920 1,100 Battery (Target, 10 MW) Lead acid 120 170 460 3,500 Advanced 120 100 320 2,100 Flywheel (Target, 100 MW) 150 300 750 6,200 Superconducting magnetic storage (Target, 100 MW)
120 300 720 6,100
Supercapacitors (Target) 120 3,600 7,300 72,000 a Source: Schainker (1997).
Box 5.1: “Baseload” Inner Mongolian Wind Power for Distant Chinese Markets China has some of the best wind-energy resources in the world. For example, good wind resources are
available over about 80,000 km2 of Inner Mongolia (0.9 percent of the total land area of China). Wind farms based on the use of modern wind turbines in this region could provide about 1800 TWh/year of electricity,a which is 1.7 times the total rate of electricity generated from all sources in China in 1996. But the population density in Inner Mongolia is so low that a tiny fraction of the wind resource would be adequate to serve future local electricity needs. Thus these wind resources cannot play a significant role in China’s energy economy unless cost-effective ways can be found to bring this wind energy to distant urban centers, where rapidly growing electricity demand is concentrated.
Fortunately, this is feasible, without technological breakthroughs, by pursuing a strategy first proposed for exploiting the wind resources in the U.S. Great Plains,a and recently applied in an assessment of prospects for exploiting wind energy resources in Inner Mongolia.b The basic idea is to couple a large (over 1 GW) transmission line to a system consisting of a several-gigawatt wind farm plus electrical storage in such a way as to deliver “baseload wind power” to the transmission line.
There are reasonably good prospects that electricity produced via multi-gigawatt-scale baseload wind-energy projects in Inner Mongolia using modern wind turbines mass-produced in China and deployed in conjunction with compressed-air energy storage (CAES) could be competitive, without subsidy, with electricity from coal in northern China (produced in plants equipped with flue-gas desulfurization), when delivered to distant markets in large northern cities such as Beijing (500 km away) or Harbin (1,400 km away), once industrial activity is well established.a A key enabling technology is CAES, a commercially-ready storage technology that would provide storage for a day or more at lower cost than for any other technology (see Table 5.2). One possible institutional mechanism for launching this technology in the market is the wind energy resource development concession (see Box 5.2).
a Cavallo (1995). b Lew et al. (1998).
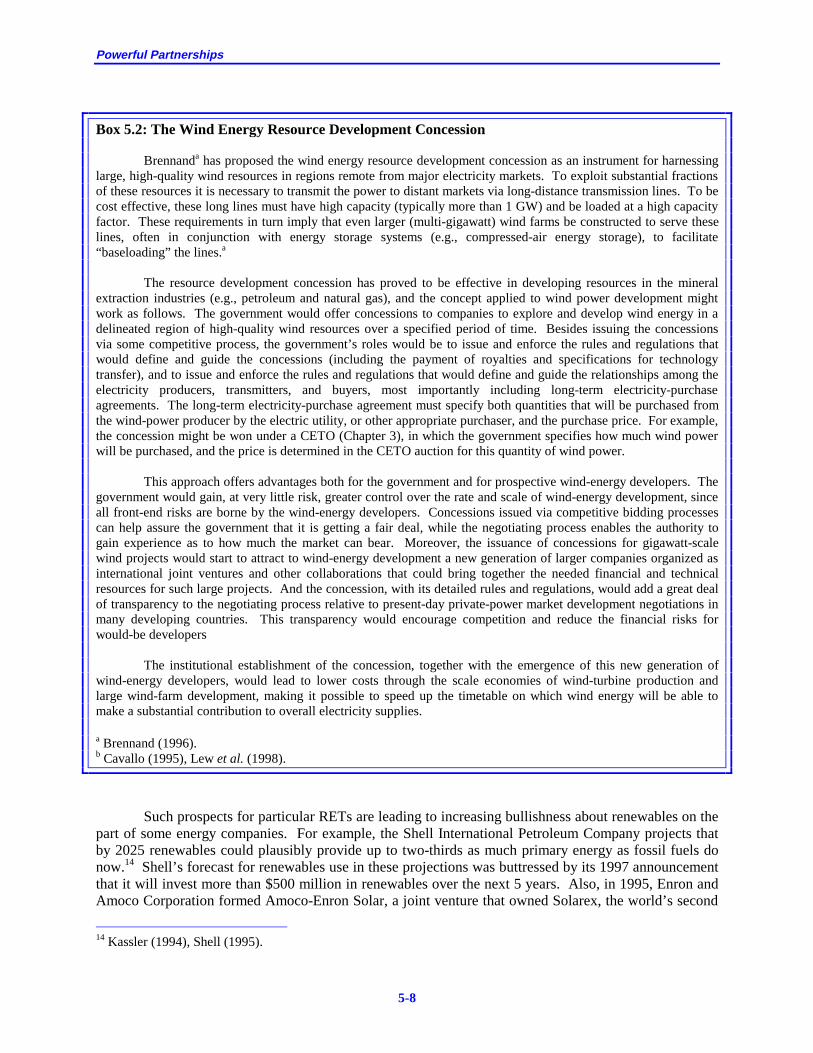
Powerful Partnerships
5-8
Box 5.2: The Wind Energy Resource Development Concession Brennanda has proposed the wind energy resource development concession as an instrument for harnessing
large, high-quality wind resources in regions remote from major electricity markets. To exploit substantial fractions of these resources it is necessary to transmit the power to distant markets via long-distance transmission lines. To be cost effective, these long lines must have high capacity (typically more than 1 GW) and be loaded at a high capacity factor. These requirements in turn imply that even larger (multi-gigawatt) wind farms be constructed to serve these lines, often in conjunction with energy storage systems (e.g., compressed-air energy storage), to facilitate “baseloading” the lines.a
The resource development concession has proved to be effective in developing resources in the mineral
extraction industries (e.g., petroleum and natural gas), and the concept applied to wind power development might work as follows. The government would offer concessions to companies to explore and develop wind energy in a delineated region of high-quality wind resources over a specified period of time. Besides issuing the concessions via some competitive process, the government’s roles would be to issue and enforce the rules and regulations that would define and guide the concessions (including the payment of royalties and specifications for technology transfer), and to issue and enforce the rules and regulations that would define and guide the relationships among the electricity producers, transmitters, and buyers, most importantly including long-term electricity-purchase agreements. The long-term electricity-purchase agreement must specify both quantities that will be purchased from the wind-power producer by the electric utility, or other appropriate purchaser, and the purchase price. For example, the concession might be won under a CETO (Chapter 3), in which the government specifies how much wind power will be purchased, and the price is determined in the CETO auction for this quantity of wind power.
This approach offers advantages both for the government and for prospective wind-energy developers. The government would gain, at very little risk, greater control over the rate and scale of wind-energy development, since all front-end risks are borne by the wind-energy developers. Concessions issued via competitive bidding processes can help assure the government that it is getting a fair deal, while the negotiating process enables the authority to gain experience as to how much the market can bear. Moreover, the issuance of concessions for gigawatt-scale wind projects would start to attract to wind-energy development a new generation of larger companies organized as international joint ventures and other collaborations that could bring together the needed financial and technical resources for such large projects. And the concession, with its detailed rules and regulations, would add a great deal of transparency to the negotiating process relative to present-day private-power market development negotiations in many developing countries. This transparency would encourage competition and reduce the financial risks for would-be developers
The institutional establishment of the concession, together with the emergence of this new generation of
wind-energy developers, would lead to lower costs through the scale economies of wind-turbine production and large wind-farm development, making it possible to speed up the timetable on which wind energy will be able to make a substantial contribution to overall electricity supplies. a Brennand (1996). b Cavallo (1995), Lew et al. (1998).
Such prospects for particular RETs are leading to increasing bullishness about renewables on the part of some energy companies. For example, the Shell International Petroleum Company projects that by 2025 renewables could plausibly provide up to two-thirds as much primary energy as fossil fuels do now.14 Shell’s forecast for renewables use in these projections was buttressed by its 1997 announcement that it will invest more than $500 million in renewables over the next 5 years. Also, in 1995, Enron and Amoco Corporation formed Amoco-Enron Solar, a joint venture that owned Solarex, the world’s second
14 Kassler (1994), Shell (1995).

Chapter 5: Energy Supply Technologies
5-9
largest PV company, until BPs merger with Amoco earlier this year and subsequent buyout of Enron’s interest in Solarex. Enron’s involvement in renewables was expanded in 1997 with its acquisition of Zond Corporation, an American wind-powerplant developer, and Tacke Windtechnik, a German wind-turbine manufacturer. Moreover, in 1997 British Petroleum announced plants to increase solar-power sales to $1.1 billion per year within the next decade.
Box 5.3: Co-production of Synthetic LPG and Electricity from Grain Crop Residues in China The use of solid fuels (mainly biomass and coal) for cooking and heating gives rise to health-damaging
indoor air pollution, which is perhaps the world’s most serious air pollution problem, accounting for about 80 percent of worldwide human exposure to particulate air pollution.a
In rural areas of China, where crop residues have historically been a major source of fuel for cooking and heating, there is a growing trend away from their use. As rural incomes rise, farmers have been shifting from crop residues—which must be gathered from the field and stored throughout the year—to coal briquettes—which can be purchased on an as-needed basis from itinerant merchants. Although this shift provides the farmer with a more convenient fuel, it often aggravates the indoor air-pollution problem as a result of the sulfur emissions from coal (biomass contains very little sulfur). Moreover, this ongoing shift is creating an entirely new problem. In many areas the residues dry out in the field quickly, which inhibits their decay and re-incorporation into the soil. Thus, in order to prevent insect infestation of the accumulating residues, the excess residues are increasingly being burned off in the fields. The air pollution problem at burn-off is so severe as to cause airport closings in some cases. Because the problem is so serious, officials are aggressively exploring new opportunities for using crop residues that would obviate the need for burn-off in the field.
One possibility for solving the field burn-off and cooking air pollution problems simultaneously, while also making a contribution to electricity supplies, would be to use residues for the co-production of electricity and synthetic liquid petroleum gas (LPG), a mixture of propane and butane, via use of a “once-through” Fischer-Tropsch liquids plant coupled to a biomass integrated gasifier combined cycle (IGCC) plant. A preliminary design of such a plant has been carried out at plant scales appropriate for use in Jilin Province, “the corn belt” of China, which produced 15 million tonnes of corn in 1995 (13 percent of China’s total). There, 10MW biomass IGCC plants producing synthetic liquids as a co-product (250 barrels of crude-oil-equivalent per day) would be fueled with residues gathered from corn fields within a 11 km radius. Such plants could convert 15 percent of the biomass feedstock to electricity and 28 percent to LPG. Preliminary estimates are that the LPG produced this way might be competitive with conventional LPG, once biomass IGCC technology is established in the market.b
A major studyc carried out jointly by the Energy Research Institute (ERI) of the State Development Planning Commission of China and the National Renewable Energy Laboratory (NREL) of the United States provides a basis for understanding the potential implications for China of successfully developing this technology for co-producing synthetic LPG and electricity from crop residues. This ERI/NREL study estimated on a region-by-region basis biomass residues available in China for energy purposes. The study projected that for 2010 some 376 million tonnes (170 million tonnes of coal equivalent) of residues (out of the total residue generation rate of 726 million tonnes) would be available for energy production (the rest would be used for paper making, forage, or returned to the fields to sustain soil quality). If all these available residues were used for the co-production of synthetic LPG and electricity, some 1.4 EJ per year of LPG would be produced, along with 210 TWh per year of electricity. This much LPG could provide in the form of a superclean fuel the cooking needs for 560 million people in China (about 70 percent of the rural population projected for 2010) while generating electricity at a rate equivalent to the output of two-and-a-half Three Gorges power plants. And whereas the electricity from the 18 GW Three Gorges plant would have to be transmitted long distances to most of its customers, this grain crop residue-generated electricity would be produced in 3,400 power plants (each 10MW), which would typically be located close to the consumers they serve.
a Smith (1993); see also Chapter 4. b Larson and Jin (1999). c Li et al. (1998).

Powerful Partnerships
5-10
Policy Issues Visions such as Shell’s of renewables-intensive energy futures will not come about under current market conditions because of a variety of market and institutional barriers that inhibit CET innovation generally, RET innovation in particular, and applications of RETs in developing countries, where much of the RET market growth is expected.
In addition to generic barriers that keep private firms from using their own resources to buy-down the costs of advanced CET technologies (by forward pricing or other means), thereby accelerating deployment (see Chapter 3), the deployment of RETs in particular is often inhibited by barriers that arise from RETs’ characteristics. For example, the small scales of many RETs typically imply high transaction costs per project. Moreover, existing energy-industrial structures might be inadequate for implementing some RET strategies. For example, the strategy outlined in Box 5.1 for harnessing remote wind resources would require the construction of wind farms far larger than those with which the existing wind-energy industry has had experience, so new ways must be found to involve developers with the financial and technological resources needed to carry out such large projects. The wind energy resource development concession (Box 5.2) is one possible mechanism that should be considered for accelerating RET deployment. Whatever mechanism is used, key factors for successful development include fair terms in the underlying power purchase agreement; the availability of transmission capacity; equitable tax treatment; "right prices" including externalities; contractual, regulatory, and political stability, and others.
Although developing countries offer large RET market opportunities, exploiting these opportunities poses logistical challenges, as these areas often lack much of the necessary market infrastructure of effective financing mechanisms (e.g. banks, credit windows), distribution companies, and maintenance support. Also, U.S. companies’ efforts to participate in developing-country markets have been undercut by aggressive export promotion by European governments (“tied aid”) aimed at capturing and locking in those markets for their own firms.15 For example, 9 of 13 wind farms in China received grants or concessionary government loans from European countries, typically covering half of the installed costs without interest for a decade or more. U.S. policy is to oppose tied aid (because it inhibits making maximum use of market forces in choosing the most promising options in the technology-transfer process), and to match tied aid where it cannot be stopped. This policy is extraordinarily difficult to administer for RETs, because RET industrial activity is made up of a very large number of small projects all around the world. The engagement of the WB/IFC/GEF in deployment activities, as proposed by the Panel (see Chapter 3), would be a good generic approach to dealing with the “tied aid” challenge, because these agencies do not allow tied aid contributions to their projects. In addition, European and Japanese governments are providing strong support for domestic RET deployment programs (see Boxes 5.4 and 5.5) that are helping build domestic industrial capability—a result of which is that their domestic firms are becoming strong competitors in developing country markets, where U.S. firms, without strong domestic support, are finding it difficult to compete.
15 PERI (1995).

Chapter 5: Energy Supply Technologies
5-11
Box 5.4: The Global Wind-Energy Market The wind-energy market is booming. Worldwide, 1,560MW of capacity was added in 1997, a further
2,100MW (worth $2 billion) was added in 1998, and the installed global capacity has passed 10,000 MW. Although the modern wind-energy industry began in California, the center for market growth has shifted to Europe, which accounted for more than 80 percent of added capacity in 1998.a Within Europe, the leader has been Germany in recent years, where additions have been spurred by the Electricity Feed Law, under which utilities must buy wind power produced by independent power producers at a price equal to 90% of the average tariff (currently about $0.10/kWh).
Although U.S. entrepreneurs pioneered modern wind-turbine designs, they have found it difficult to
participate in the global boom. Wind markets in Europe have proven difficult to penetrate for entrepreneurial U.S. firms (U.S. market share has historically been limited to less than 1 percent), with their limited resources and the presence of numerous European wind companies that have the backing of European government R&D support at a level of some $150 million per year (compared to about $30 million in the United States). The U.S. market has been largely stagnant, because of low-cost natural gas, ongoing deregulation of the electricity sector, and public-policy changes that no longer provide much incentive to expand wind capacity. a Siegel and Rackshaw (1999).
Box 5.5: The Global PV Market
The global PV market has been growing at an average rate of 15 percent per year since 1983, reaching 115 MW and worth over $1 billion per year in 1997, with 65 percent and 35 percent of the sales for off-grid and grid-connected applications, respectively. Over the last few years, growth has been more rapid, largely as a result of German and Japanese domestic programs aggressively promoting the deployment of grid-connected rooftop PV systems. The German government has announced a five-year, 100,000 rooftop (300MW) PV program, supported by 1 billion DM ($0.6 billion) of public funds and incentives including loans with terms up to 10 years that require no repayment for the first two years and have zero percent initial interest. Japan’s New Sunshine Project, a $69 million investment from the City of Tokyo, and a $103 million investment to install private solar roof arrays, are expected to help the country install 400MW of PV capacity by 2000, and 4,600 MW by 2010. In the United States, the Clinton Administration announced a “Million Roofs Initiative” in 1997, with the goal of installing some 3,000 MW of
systems on rooftops in 325 cities by 2010, although the Federal government has so far provided few incentives for reaching this goal.
Japan, which will soon have more PV-production capacity than the United States, has already replaced the United States as the largest market in the world, and Germany is second to Japan in market size for grid-connected PV applications. Total Japanese support for PV RD3 activity is expected to be $400 million in 1999.a
a Siegel and Rackstraw (1999).
High-Priority Widespread-Renewables Initiative Goals
The widespread renewables initiative is aimed at accelerating the development and deployment of biomass, wind, photovoltaic, solar thermal, or other renewable energy technologies (RETs), including tailoring and deploying these to support rural development in developing countries, such that in the second quarter of the 21st century renewables could make contributions to world energy-supply comparable to the contributions from fossil fuels today. Recommended funding for this initiative,
Powerful Partnerships
5-12
together with the other important renewable energy initiatives, is $40 million per year in FY2001, increasing to $80 million in FY2005. U.S. Actions The most important U.S. actions under this initiative are the following:
(1) Promote collaborative IERD3 on industrial-scale biomass energy conversion technologies, emphasizing those that provide both electricity and one or more co-products (heat, fluid fuels, chemicals, as well as food/feed/fiber), and also collaborative research on the restoration of degraded lands and their use for growing crops optimized to provide the feedstocks needed for such multiple product strategies;
(2) Expand existing programs with selected developing- and transition-country partners to develop
integrated systems involving renewable energy technologies and their hybrids with fossil energy to provide complete energy services for agricultural, residential, and village-scale commercial and industrial applications in rural areas;
(3) Collaborate in measures to accelerate the deployment of grid-connected intermittent renewable
electric technologies and their hybrids with fossil energy using competitive instruments (such as CETO competitions for accelerating RET price buy-down and concessions for market aggregation), including measures that could facilitate the leveraging of large, high-quality, but remote wind resources and delivering the electricity to major electricity markets and facilitate participation of U.S. firms in this process; and
(4) Develop, in collaboration with appropriate partners, assessments of renewable energy resources
on a region-by-region basis. Elaboration
(1) Industrial-scale Bioenergy. The United States would work with selected industrialized, developing, and transition country partners in developing industrial-scale biomass energy-conversion strategies. Initial activities would include R&D collaborations with European and other partners in areas such as gasification, and demonstration projects led by private-sector firms that are seeking to deploy the technology. Successful demonstration projects would be followed by CETO-like deployment programs for accelerating technology-cost buy down in host countries. U.S. companies working with their counterparts in these countries would prepare candidate projects for these CETO competitions and concessions, and possibly also for demonstrations under a DSF (if needed). DOE would take the lead for collaborative bioenergy conversion R&D.
Although bioenergy conversion technologies will initially use primarily agricultural or forest-product-industry residues as feedstocks, new biomass-energy crops will ultimately be needed. A promising approach would be to grow such crops on lands that are now degraded and relatively unproductive—globally there are several hundred million hectares of such lands that could potentially be restored to much more productive use. Field research would be carried out on strategies for the restoration of such degraded lands, with the goal of using such lands for biomass production for energy and other purposes. Broad multinational collaboration would be sought for field R&D on restoration of degraded lands, with USDA and USAID jointly leading the effort for the United States. The multinational activity might be coordinated by the GEF, which is planning
Chapter 5: Energy Supply Technologies
5-13
to support degraded land restoration under a new operational program relating to carbon sequestration.16
(2) Rural Energy Systems for Rural Development. This activity would focus on the development of
integrated renewable energy systems for rural areas where modern energy supplies are scarce, unreliable, and/or costly. It would include small-scale biomass power, heat, and fuels production; PV, wind, and geothermal systems; solar systems for providing low-to-medium-temperature heat, and hybrids among these and with fossil energy technologies, where appropriate. Associated integrated system development would be carried out using such technologies in remote stand-alone applications, village minigrids, village industry systems, and distributed grid-connected systems. Systems development would give attention to control systems, dispatch, grid layout optimization, etc., as well as integration with communications, lighting, refrigeration, motor drive, and other elements necessary to provide the full range of energy services to unserved or poorly served rural areas. Once technologies are ready to be deployed, they would be introduced into the market using rural energy concessions (such as those being pioneered in Argentina—see Box 3.3) and other mechanisms. Technical assistance would be provided by DOE and its national laboratories working with USAID.
(3) Accelerated Deployment of Grid-Connected Intermittent Renewable Electric Technologies. For
accelerated deployment of grid-connected intermittent renewable electric technologies and their hybrids, the United States would work with the WB/IFC/GEF and selected host developing and transition countries to develop competitive instruments such as CETO and rural concessions to promote cost buy-down, market aggregation, and deployment in grid-connected applications (including distributed grid-connected applications) of intermittent RETs (wind, PV, solar thermal-electric). Deployment activities would be organized as in the case of industrial-scale bioenergy.
Included in this category are wind/thermal power hybrid configurations and wind/hydro and wind/CAES combinations for providing the baseload electricity needed to make long-distance transmission cost effective as a means for exploiting remote wind energy resources. Because large-scale (typically multi-gigawatt) wind farms made up of thousands of turbines would be involved, innovative market-aggregation strategies, such as wind energy resource development concessions (see Box 5.2), would be employed to facilitate deployment. CAES demonstration projects would be carried out, and systems would be deployed where CAES would make wind energy projects more competitive. The World Bank and IFC would be appropriate agents for working with host developing country governments to put into place concession frameworks or other mechanisms for mobilizing remote wind energy resources.
(4) Renewable Energy Resource Assessments. Renewable energy resource assessment information
is a public good that would provide the basis for identifying targets of opportunity for private-sector RET investors. What is needed are “broad-brush” assessments (analogous to U.S. Geological Survey inventories for oil and gas resources) that are sufficiently detailed to attract private-sector developers, who would follow-up by making their own, much more detailed “investment-justifying” renewable energy surveys. Included in these assessments should be the production on a regional basis of insolation and wind maps, inventories of available biomass residues, inventories of degraded lands and their current usages, and inventories of energy storage capacity that might be used for backing up intermittent renewable sources—including both
16 In moving such a program forward, particular attention must be given to those people who currently depend on these degraded lands for their livelihoods and survival.

Powerful Partnerships
5-14
hydroelectric reservoirs that might be reconfigured to play greater storage roles and geological reservoirs that might be suitable for CAES systems. Because the information developed would be a public good, broad multinational support should be sought for developing regional assessments of renewable energy resources. The U.S. effort would be led by DOE. The GEF might be asked to coordinate these activities, to assure that the information is developed according to appropriate standardized norms.
Other Important Renewable Energy Initiatives Goals These initiatives would further promote the development and deployment of renewable energy technologies. U.S. Actions
(1) Promote R&D collaborations with leading research groups in other countries on advanced solar
thermal-electric (STE) technologies. (2) Support international efforts with strong domestic RET RD3 programs, including deployment
efforts—e.g., a national Renewable Portfolio Standard (see Box 3.4)—that are coordinated with robust and sustained R&D programs for RETs.
Elaboration
(1) Collaborative R&D on Advanced Solar Thermal Electric Concepts. R&D groups in Israel and
several European countries have strong programs on advanced receivers for high-temperature Solar Thermal Electric (STE) cycles suitable for direct use of Brayton (gas turbine) cycles, and the United States has the most advanced Brayton cycle technology for heat conversion. These complementary strengths provide a sound basis for collaborative R&D on advanced STE cycles. Such collaborations could provide the basis for STE technologies that might be developed over the longer term that would have higher conversion efficiencies and lower electricity costs than might be achieved with STE technologies the DOE is now pursuing. DOE would have the lead responsibility for pursuing collaborative R&D on advanced STE concepts with selected leading STE R&D groups in other countries as partners. Participation in this long-term R&D activity by private firms engaged in near-term commercialization activities for parabolic-trough technology would be encouraged.
(2) Strengthened Domestic ERD3 Programs for RETs. A strong domestic RD3 program is needed to enable U.S. RET firms to be strong competitors in developing and transition country markets. Although federal government support for RET R&D is increasing again, as recommended by the PCAST Energy R&D Panel, DOE’s RET R&D program has experienced substantial swings in funding that have weakened strategic planning. Moreover, in contrast to activities in Europe and Japan (see Boxes 5.4 and 5.5), RET deployment initiatives in the United States are weak.
Further Thoughts on Deployment Activities Under the Renewables Initiatives In the above initiatives, considerable emphasis is given to deployment measures—especially market aggregation and technology-cost buy-down. The need for market aggregation measures relates to the small scales that are characteristic of most RETs. The concession is a potentially powerful instrument
Chapter 5: Energy Supply Technologies
5-15
for aggregating the market for small-scale RET systems, which could both facilitate realization of economies of mass production and make possible substantial reductions in transaction costs per customer by granting exclusive market-development rights in a delineated region over a specified period of time to a single supplier. Argentina is conducting an ongoing experiment with concessions as a cost-effective approach to rural electrification as part of its electricity-industry restructuring activity (see Box 3.3). Concessions can also be used to attract private capital to large-scale RET projects. Brennand (1996) has proposed the wind-energy resource development concession (see Box 5.2) as an instrument that is especially promising for harnessing high-quality wind energy resources concentrated in regions that are remote from major electricity markets (see Box 5.1). The Panel recommends that the United States promote the concession concept wherever this instrument offers the potential for facilitating efficient RET development, by providing advice on the institutional issues involved and by helping support, as appropriate, demonstrations of the concept. Where introduction of concessions proves difficult or slow, attention should be given to implementing some of the key elements of the concession concept that might be more quickly implemented—giving particular attention to establishing reasonable terms in power purchase agreements—so as to minimize delays in RET deployment. Because initial prices will typically be higher than market-clearing prices for commercially-ready RETs, the CETO as an instrument for buying down RET prices would have large roles in advancing RETs under the ERD3 strategy recommended by this Panel. Under CETO, maximum target RET prices would be set and markets would be guaranteed at levels sufficiently high that RET manufacturers would seek to expand production capacity to levels where economies of scale can be realized. Market size guarantees would be provided only if bid prices are not greater than maximum target prices and only on a competitive basis. Markets offering high value for RET-generated electricity would be identified (e.g., PV or wind systems coupled to existing hydroelectric or other facilities or STE systems in hybrid configurations with fossil energy backup, in remote areas where lower cost energy is not readily available) so as to minimize the subsidies needed for RET cost buy-downs. DOE would provide technical support—e.g., for studies, and ancillary collaborative R&D—as needed to facilitate CETO activities. Even after buy-down, many RETs that are cost-competitive on a lifecycle cost basis will face market barriers as a result of their higher first costs compared to conventional technologies, even though fuel costs will be lower or even zero. Thus, as in the case of many energy-efficient end-use technologies (see Chapter 4), financial measures that promote consumer decision-making on the basis of lifecycle cost comparisons will be needed (see Chapter 3). The intensive reliance on CETO in this initiative prompts the question: How much will RET cost buy-down total for a diversified portfolio of RET options? More experience with deployment is needed to answer this question with confidence, but several considerations indicate that buy-down costs are likely to be affordable. The inherent cleanliness of RETs implies that expenditures on clean-up strategies will be modest for R&D and during deployment. Moreover, the small scales and modularity of most RETs imply that, after the research phase, costs for scaling up the technologies from laboratory to commercial scales are typically also modest. Finally, their inherent cleanliness, small scales, and modularity make most RETs good candidates for cost-reductions from learning and experience. Using a competitive instrument, such as the proposed CETO for buying down RET costs, would also tend to constrain costs, because in each qualifying technology category, the buy-down would involve only the most competitive technology—not the “average” technology—for that category. Although in this study comprehensive estimates have not been made of the aggregate expenditures needed to launch RETs in the market worldwide with temporary incentives, estimates made by the World Energy Council (WEC) for a range of solar energy technologies (a subset of all renewable energy technologies) suggest that these costs would be relatively modest: WEC estimated that over a 20-year period some $7 to 12 billion would be needed to support initial deployment until manufacturing

Powerful Partnerships
5-16
economies of scale are achieved to enable these technologies to compete with conventional options (this is in addition to the WEC’s estimated $8 billion that would be needed in this period for R&D on these technologies).17 For comparison, the global rate of investment in energy supply in 1990 was about $400 billion—some 2 percent of world GDP. Over time, as RETs become more established in the market, there will be a shift in the mix of needed public-sector ERD3 support, including international ERD3 support, toward longer term R&D, as is typical for public-sector support for the innovation process in established industries. Several other important renewable energy technologies are not described in detail here, including geothermal and hydro technologies. Domestic ERD3 in these areas as recommended by PCAST 97, and increased collaborative ERD3 such as for hot dry rock geothermal with Europe, and accelerated deployment activities such as geothermal in the Pacific rim or various hydro technologies are also important and should be pursued, as appropriate. FOSSIL FUELS Background In 1996 fossil fuels provided 86 percent of global commercial energy and under business-as-usual conditions this fraction is not expected to decline over the next two decades.18 Concerns about fossil fuels under business-as-usual conditions include:
• growing world dependence on the politically unstable Persian Gulf, whose share of world oil production is projected to grow from 26 percent in 1996 to 41 percent by 2020.
• growing public health and environmental impacts of fossil-energy-derived air pollution,
including growing concerns about chronic mortality impacts of small-particle air pollution (see Box 1.2).
• climate-change implications of increasing CO2 emissions from fossil fuel burning, which are
projected under business-as-usual conditions to increase from 6.0 GtC per year to 10.4 GtC per year between 1996 and 2020.
Despite such concerns, fossil energy technologies have been advancing rapidly in response to competitive challenges and tightening environmental norms, making fossil fuels both environmentally more acceptable and the energy services they provide less costly, making them moving targets against which non-fossil energy options must eventually compete.19 Natural gas Natural gas is the cleanest and least carbon-intensive fossil fuel. Shifting from coal to natural gas would greatly mitigate air pollution and climate change concerns; shifting from oil to natural gas would help mitigate concerns about over-dependence on Persian Gulf oil.
17 WEC (1994). 18 EIA (1998). 19 The discussion of fossil energy in this chapter benefited from Siegel (1999).

Chapter 5: Energy Supply Technologies
5-17
Despite the attractions of natural gas, its use is in an early stage in developing countries, which account for 75 percent of world population but only 20 percent of gas use. Putting in place regulatory reforms relating to natural-gas infrastructure (see Chapter 3) would help accelerate the transition to this cleaner fossil fuel in the developing world. Because conventional gas resources are unevenly distributed around the world (e.g., 36 percent and 12 percent of estimated remaining recoverable conventional resources are concentrated in the republics of the former Soviet Union (mostly in Russia) and Iran, respectively, compared to 2.5 percent and 0.4 percent for China and India, respectively20), the wide use of gas will depend increasingly on trade in liquefied natural gas (mainly for serving coastal markets in regions with little natural gas) and especially pipelines, including various transcontinental pipelines—e.g., for transporting gas from Siberia, the Middle East, and the Central Asian Republics to the Far East, the Indian subcontinent, Europe, and ultimately Africa. The natural gas-fired gas turbine/steam turbine combined cycle has become the technology of choice for thermal power generation wherever natural gas is available, providing electricity at efficiencies approaching 60 percent at generation costs of typically 3 ¢/kWh, with 60 percent lower CO2 emissions and far lower air pollutant emissions per kWh than new coal plants. Next-generation natural gas power generation technologies will include high-temperature fuel cells combined with gas turbines, offering efficiencies of 75 percent or more, and even lower pollutant emission levels.21 The world will soon see gas liquids competing with liquid fuels from crude oil. These gas liquids will be derived from synthesis gas or “syngas,” a gaseous mixture consisting primarily of carbon monoxide and hydrogen. Syngas is produced from natural gas via steam reforming and other commercial processes. The synthetic liquids that can be produced from natural gas via syngas will serve transportation and other liquid fuel markets, thereby making it possible to reduce global dependence on Persian Gulf oil, help limit oil-price increases, and simultaneously provide significant air-quality benefits. For example, synthetic middle-distillate fuel derived from natural gas can be used effectively in diesel engines. This synthetic fuel has near zero sulfur and aromatic content, and leads to significantly lower pollutant emission levels than conventional diesel fuel.22 Although life-cycle CO2 emissions are about the same as for crude oil-derived transport fuels, they are much less than for coal-derived synthetic fuels. Initially, gas liquids will be derived mainly from remote and otherwise unusable gas supplies, but use of new liquid-phase reactors in conjunction with “once-through” processes—in which gas liquids would be co-produced with electricity or electricity plus process heat (e.g., via “cogeneration” of fluid fuels plus electricity, or “tri-generation” of fluid fuels plus electricity plus process heat)—could greatly expand opportunities for gas liquids production.23 These processes, which would typically be deployed at plants that produce various industrial chemicals, allow gas liquids to be made economically at smaller scales and/or from more costly gas feedstocks than is feasible for plants that produce only gas liquids.24 Although conventional natural gas resources are limited (e.g., less than a 30-year supply in the United States by some estimates25) and unevenly distributed throughout the world, unconventional natural
20 Masters et al. (1994). 21 Bakker et al. (1996). 22 Norton et al. (1998). 23 Bechtel (1990), Jager (1997). 24 Choi et al. (1997). 25 Masters et al. (1994).

Powerful Partnerships
5-18
gas resources are vast. Especially large (but uncertain) are the methane resources trapped in clathrate hydrates (a solid material containing molecules of methane trapped in a crystal lattice of water molecules) in Arctic regions and in ocean sediments. The carbon content of deep-ocean clathrate hydrates might be as much as 4 million GtC, while that for hydrates on the continental shelves (which are more accessible resources) might be as much as 18,000 GtC—the energy value of which is equivalent to about 3,000 times current global energy use, or 100 times remaining conventional gas resources.26 Because of their wide geographical distribution, the clathrate hydrates might eventually make it possible to provide natural gas for some otherwise gas-poor regions, as well as to extend the natural gas economy well beyond what can be supported by conventional natural gas resources. Considerable R&D is needed to see if ways can be found to recover the contained energy cost-effectively and safely, addressing not only economic goals but also climate concerns. If much of this methane could one day be recovered economically and burned for its energy without sequestering the CO2, the cumulative impact on climate could be disastrous. Ways of getting the energy out while leaving the carbon behind should be investigated—e.g., energy recovery in the form of hydrogen, with sequestration of the separated CO2 (see “Fuels Decarbonization and CO2 Sequestration,” below). Coal Coal is an abundant, but dirty, fossil fuel. In the coming decades most of the expansion in coal use is expected to be in developing countries—especially China (see Table 5.3), resulting, under business-as-usual conditions, in increasingly severe local and regional air pollution problems, and major increases in CO2 emissions.
The point of departure for the Panel’s analysis is the recommendation of the PCAST Energy R&D Panel that U.S. ERD3 activity relating to coal should be oriented to serving the market needs of developing countries, in ways that build on activities in Vision 21, DOE’s new Fossil Energy initiative.27 One long-term goal is to produce electricity from coal, with near-zero greenhouse gas and air pollutant emissions, at a cost that is less than that for today’s state-of-the art pulverized coal power plant. These plants might also co-produce electricity and hydrogen with near-zero emissions, and they might use a variety of carbonaceous feedstocks in addition to coal—e.g., natural gas, petroleum residuals, biomass, and/or municipal solid waste. Bringing these technologies to market would require considerable innovation, but the PCAST Energy R&D Panel projected that such technologies might capture 50 percent of the U.S. coal power market between 2011 and 2015 if they were pursued with an aggressive ERD3 program. A common feature of fossil energy plants that would ultimately have zero, or near-zero, CO2 emissions is that the processing of the primary carbonaceous feedstock would begin with syngas production. In coal processing, the key enabling technology that leads to syngas production is oxygen-blown gasification, which makes it possible to extract much of coal’s energy as hydrogen, while producing a by-product stream of relatively pure CO2 that can be sequestered, for example, in geological reservoirs. Moreover, air pollution emissions would also be reduced to near-zero levels if hydrogen were to come into wide use. Advanced technologies for making hydrogen from coal via gasification might prove to be attractive ways to produce hydrogen if there were major energy markets for hydrogen—which would be the case, for example, if fuel cells could be developed and commercialized for both transportation and stationary power markets. At present, however, there are no energy markets for hydrogen, so, for the near
26 Max et al. (1997). 27 DOE (1999).

Chapter 5: Energy Supply Technologies
5-19
term, oxygen-blown gasification technology could be used to provide energy from coal with extremely low levels of local and regional air pollutants, along with modest reductions in CO2 emissions from efficiency improvements. Near-term “clean-coal” technologies based on oxygen-blown gasification are consistent with a transition to zero-emission fossil fuel conversion technologies.
Table 5.3. Projection of Coal Use and CO2 Emissions from Coal
1996 2020
Region
Coal use (EJ/y)
Coal CO2 emissions (Gt C/y)
Coal CO2 emissions as % of global CO2 emissions
Coal use (EJ/y)
Coal CO2 emissions (Gt C/y)
Coal CO2 emissions as % of global CO2 emissions
Coal use growth rate (%/y)
United States 22.0 0.52 9 27.0 0.66 6 0.9 Other Industrial 16.4 0.40 7 18.3 0.42 4 0.4 EE/FSU 13.7 0.33 6 12.7 0.30 3 - 0.3 China 29.6 0.68 11 82.7 1.93 19 4.4 India 6.3 0.16 3 11.3 0.29 3 2.5 Other Developing
9.8 0.25 4 13.2 0.35 3 1.2
World 97.9 2.34 39 165.0 3.95 38 2.2 Source: EIA reference projection (EIA 1998). One near-term application is coal integrated gasification/combined cycle (IGCC) power generation, which could provide electricity with air pollutant emissions nearly as low as from natural gas combined cycle plants. Although coal IGCC technology is commercially ready, it is not yet cost-competitive with conventional coal steam-electric technology in China and other developing countries. One promising approach for buying down the cost of oxygen-blown gasification technologies is to promote applications in energy systems that co-produce electricity and industrial process heat (CHP), or fluid fuels and electricity, or fluid fuels, electricity, and industrial-process heat (e.g., using liquid phase reactors to produce these fluid fuels from synthesis gas via once-through processes—in cogeneration or tri-generation configurations similar to those described above using natural gas as feedstock). Such energy co-production systems offer as benefits low levels of air pollution, and significant cost reductions, energy savings, and reduced CO2 emissions relative to systems that produce these products separately. These systems might often be cost-competitive where coal IGCC technology producing only electricity is not. Another promising approach would be to employ oxygen-blown gasifiers with low- or negative-cost feedstocks (e.g., petroleum coke rather than coal) as a near-term strategy for expanding market applications of gasification technology and thereby helping buy down technology costs. Such co-production strategies or strategies based on gasification of low-quality feedstocks might be evolved from ongoing activities in the petroleum refining and chemical industries. In China, for example, modern oxygen-blown gasifiers are already being deployed in the chemical industry for the production of ammonia and other chemicals. Fuels Decarbonization and CO2 Sequestration If hydrogen were to come into wide use it might be feasible for fossil fuels to continue to have a large role in the global energy economy, even in a greenhouse gas emissions-constrained world. This is because the least costly way to make hydrogen is from fossil fuels, and the CO2 separated out in hydrogen manufacture can be sequestered in isolation from the atmosphere. Extracting the fossil energy in the form

Powerful Partnerships
5-20
of hydrogen makes it feasible to dispose of the CO2 at relatively low incremental cost (in contrast to the relatively high cost of disposing of CO2 recovered from the stack gases of conventional fossil fuel power plants).28 Even taking into account the added cost of CO2 sequestration, the cost of making hydrogen this way would typically be much less than the cost of hydrogen produced electrolytically.29 The key elements in a fuels decarbonization/CO2 sequestration strategy are: (a) technologies that put a high market price on hydrogen (e.g., fuel cells for automobile use30); (b) technologies that reduce the cost of hydrogen production from fossil fuels (e.g., by using advanced membranes for separating hydrogen from other gases and for separating oxygen from air), so that hydrogen could be broadly used for stationary power generation and CHP, as well as in transportation applications; and (c) large, secure storage reservoirs for the byproduct CO2, e.g., geological reservoirs (depleted oil or gas fields, deep beds of unminable coal, or deep saline aquifers) and possibly also the deep ocean. Although there are still many uncertainties regarding the prospects for CO2 sequestration that must be resolved, there is a growing confidence in the scientific community that secure geological reservoirs might be adequate to store up to the equivalent of hundreds of years of global CO2 emissions, with the sequestration potential likely to be especially large for deep saline aquifers, which are widely available around the world in sedimentary basins on land and offshore under sediments.31 Initially, there will be some opportunities for economic gain associated with CO2 sequestration. The use of enhanced oil recovery (EOR) via CO2 injection is established technology, which might be modified to meet the dual objectives of EOR and CO2 sequestration. An emerging enhanced resource recovery technology involves injection of CO2 into deep beds of unminable coal to recover methane.32 Coal beds are often both source rocks and reservoir rocks for methane that was produced throughout the coal burial history as a result of biogenic and thermogenic processes whereby plant material is converted into coal. Because coal is a microporous solid with large internal surface areas (tens to hundreds of square meters per gram of coal), large quantities of methane can remain trapped in the coal bed, adsorbed on coal surfaces. Because CO2 molecules are typically twice as adsorbing on coal as are methane molecules, CO2 injected into the coal bed tends to displace the methane, leaving behind, on average, about two molecules of CO2 in the coal for each molecule of recovered methane; experiments have shown that little CO2 shows up in the production wells until essentially all the methane has been recovered.33 The technology might make it economically feasible to recover some of the large quantities of methane trapped in deep beds of unminable coal, which account for most coal in the ground. This technology might prove to be important for many coal-rich countries (e.g., China) that also have large coal bed methane resources.34 Key to success is a low-cost source of CO2, for example from plants located near coal bed methane reservoirs producing hydrogen from fossil fuel. In China, some of the planned factories for making ammonia from coal using modern coal gasification technology could provide such low-cost byproduct CO2.
35 28 Socolow (1997), Williams (1998a). 29 Williams (1998b). 30 Steinbugler and Williams (1998). 31 Holloway (1996), Socolow (1997). 32 Gunter et al. (1997). 33 Gunter et al. (1997). 34 Rice et al. (1993). 35 Williams (1998c).
Chapter 5: Energy Supply Technologies
5-21
High-Priority Fuels Decarbonization and CO2 Sequestration Initiative Goals
The fossil-fuel decarbonization and CO2 sequestration initiative is designed to develop, via a
broad multinational collaborative effort, fuels decarbonization and carbon-sequestration technologies that would eventually make possible the economic use of fossil fuels with near-zero lifecycle CO2 emissions and near-zero pollutant emissions, as well as to advance, in developing and transition countries in the near term, syngas-based technologies that would facilitate the transition toward near-zero lifecycle CO2
emissions. This initiative would build on activities under DOE’s “Vision 21”. Recommended funding for this initiative together with the “Other Important Initiative” for fossil energy described below is $20 million per year in FY2001, increasing to $40 million per year in FY2005. U.S. Actions (1) Cooperate to promote energy-sector and environmental reforms in developing and transition
countries, making it more advantageous to produce multiple clean products from syngas derived from natural gas, coal, and other carbonaceous feedstocks;
(2) Collaborate in R&D and demonstrations of technologies designed to reduce the cost of making
hydrogen from carbonaceous feedstocks while facilitating the recovery of byproduct CO2 for ultimate disposal; and identify, develop, and demonstrate, via multinational efforts, promising integrated systems for hydrogen production and use, with sequestration of the separated CO2; and
(3) Through broad-based collaborative efforts on CO2 sequestration, develop standards for security of
CO2 storage, conduct environmental impact studies, carry out both region-by-region assessments of sequestration potential and detailed reservoir-by-reservoir analyses of storage capacity and other characteristics, and carry out demonstrations with monitoring of storage security.
Elaboration
(1) Overcoming Institutional Barriers to Syngas-Based Multiple Product Strategies. For natural gas these strategies would involve the coproduction of gas liquids plus electricity or gas liquids, electricity, and process heat. Overcoming barriers to widespread deployment of gas-liquids technology in multiple product strategies would lessen world dependence on Persian Gulf oil; forestall development of much more carbon-intensive synthetic liquid fuels from coal, with attendant climate change mitigation benefits; and provide greater market opportunities for those U.S. firms that are at the forefront of gas-liquids technology development.
For coal and other low-quality feedstocks, similar groups of products could be produced from syngas derived via oxygen-blown gasification. For coal these multiproduct strategies would typically lead to less costly electricity than could be produced in IGCC plants that provide only electricity. Moreover, giving initial emphasis to gasification of very low-cost feedstocks (such as petroleum coke) would be helpful in buying down the cost of gasification technologies that would be very similar to coal gasification technologies.
Although the private sector is fully capable of carrying out the needed R&D for these technologies, without additional public-sector support, there are significant institutional barriers in many countries to the deployment of these multiproduct strategies. Because these technologies cannot compete with conventional “dirty” coal technologies when the environmental and other social costs are not adequately reflected in the price, the United States should promote, as part of
Powerful Partnerships
5-22
this activity, environmental policy reforms that would protect public health and welfare. Overcoming the institutional barriers to multiple-product strategies based on coal gasification would enable the United States to take better advantage of its position as world leader in coal-gasification technology. (For example, IGCC technology was demonstrated with the Coolwater Project in California, 1984-1989.) Stagnation in the domestic coal market means that initial deployment activities be focused on developing countries, and the pressing local and regional air pollution problems of coal-intensive energy economies imply large potential markets for U.S. companies offering oxygen-blown gasification technologies, if ways can be found to make these technologies cost-competitive.
As noted, these coproduct strategies will involve the generation of electricity as a coproduct at industrial plants. The prospective favorable economics of these processes will often depend on the ability of the industrial firms to sell byproduct electricity at prices that reflect true market values. The United States would advance the commercialization of such technologies by encouraging either competition in power generation (the best solution) or enactment of a PURPA-like regulation to facilitate electricity sales to electric grids (see Chapter 3). This activity would be part of the CHP Initiative advanced in Chapter 4. Projects developed to meet near-term goals would be carried out largely by industrial joint ventures. USAID would be the lead agency for encouraging the needed environmental and energy-sector reforms, and DOE would have the lead responsibility: (a) for providing cost/performance/environmental and other information for alternative syngas-based technologies and competing technologies; and (b) for collaborative R&D, targeted to support demonstration projects. Partial financing provided by the World Bank would also be helpful in launching these new technologies in the market, because the World Bank’s financing costs are typically less than those for commercial banks.
(2) Advanced Hydrogen Production Technology and Hydrogen Systems Development. For advanced
hydrogen production technology, activities would include both pre-competitive R&D (e.g., fundamental science relating to advanced gas separation technologies, catalysis, and hot gas cleanup, as discussed in PCAST 1997) and demonstration projects, with initial focus on industrial applications (e.g., in the ammonia industry). DOE would take the lead responsibility for this collaborative RD3. When advanced technologies are ready for demonstration, the private sector should be willing to make the needed investments, in light of substantial near-term market opportunities for hydrogen use.
Hydrogen-use activities that should be considered for integrated systems development would include central station power generation, distributed CHP, and fuel-cell vehicle applications. Support should be provided by DOE to build capacity for fuels decarbonization and CO2 sequestration systems analysis in those developing and transition countries that would be partners for the United States in this initiative. Multinational participation would be encouraged for private-sector-led “hydrogen-based economy” demonstration projects, such as the recently announced plan by Icelandic Hydrogen and Fuel Cell Company Ltd (a joint venture involving Daimler/Chrysler, Norsk Hydro, Shell International, and Ecoenergy of Iceland), which seeks to convert the public and private transportation systems of Iceland to hydrogen. DOE would provide technical support for such demonstration projects. These activities would be closely coordinated with the Improving Vehicles Initiative proposed in Chapter 4, which includes measures to advance fuel-cell vehicles. The U.S. is seeking to engage developing countries in the pursuit of major climate change mitigation activities. Encouraging fossil fuel-rich developing countries via energy RD3

Chapter 5: Energy Supply Technologies
5-23
collaborations to evolve toward energy systems in which hydrogen plays major roles, with sequestration of the separated CO2, would be an effective way to do this. The evolutionary strategy set forth in this initiative would advance these long-term goals while providing near-term benefits to developing countries in the forms of reduced air pollution and reduced dependence on oil imports.
(3) Carbon Sequestration. Near-term demonstration projects would be focused on opportunities for using available low-cost CO2 sources (e.g., from industrial sources) and should include projects where economic returns would be associated with CO2 sequestration (e.g., enhanced oil recovery and enhanced recovery of methane from deep coal beds), as well as projects involving deep aquifer and possibly deep ocean disposal. EPA, working with its counterpart in a partner country, might have the lead responsibility for international standards setting, environmental impact studies, and monitoring of demonstration projects. DOE could have lead responsibility for reservoir assessments and monitoring, with technical support provided by the U.S. Geological Survey. Private companies could have lead responsibilities for demonstration projects, with DOE providing technical support. Detailed reservoir-by-reservoir assessments should be carried out in conjunction with, but prior to, demonstration projects as joint private-public undertakings.
The United States has much to gain by collaborating with other countries in the pursuit of CO2 sequestration technologies and strategies. Norway is leading global activity in experience with aquifer disposal of CO2, Japan is aggressively investigating deep ocean disposal strategies, and the United States can bring considerable expertise on enhanced resource recovery via CO2 injection. Most commercial activity and expertise for EOR using CO2 is in the United States, so that activities emphasizing the dual objectives of EOR and CO2 sequestration could provide significant opportunities for U.S. industry. Likewise the technology for enhanced methane recovery from deep coal beds via CO2 injection was pioneered in the United States, so that if the technology can be established as a fully viable commercial activity, there would again be significant opportunities for industry. This element of the initiative would seek to understand better the prospects and advance the technologies for CO2 sequestration.
Another Important Fossil Energy Initiative: Methane Clathrate Hydrate Development Goals This initiative would seek to exploit the energy potential of the methane clathrate hydrates in climate-friendly ways. U.S. Actions
Pursue collaborative R&D with other countries, aimed at reducing the cost of recovering energy from methane clathrate hydrates without exacerbating the climate-change problem. Elaboration
Collaborative R&D on methane clathrate hydrates is worthwhile in part because of the generic benefits of collaborative R&D on pre-competitive science and technology. Moreover, collaborative R&D in this area would give the United States better access to the fruits of R&D in this area being conducted abroad. Already, Japan is spending $56 million over five years, and India $50 million over five years on methane clathrate hydrate development; there has been little activity in the United States in comparison with FY99 funding of DOE and USGS combined at about $1.1 million and the FY2000 combined budget

Powerful Partnerships
5-24
request of a little less than $3 million (PCAST 97 recommended $5 million per year as an R&D budget in this area). The goal of reducing costs of energy recovery without aggravating the climate change problem might be pursued by exploring ways to produce hydrogen from the methane near where the methane clathrate hydrate is recovered—e.g., potentially leaving CO2 behind as a CO2 clathrate hydrate, exploiting the fact that CO2 clathrate hydrates form under pressure/temperature conditions very similar to those for methane clathrate hydrates. DOE would have the lead responsibility for this U.S. action, and the involvement of oil and gas companies (foreign as well as domestic) should be encouraged. Although these companies have little, or no, near-term interest in developing this resource for energy (because there are abundant near-term investment opportunities for conventional gas recovery), many have ongoing R&D programs focused on drilling-hazard mitigation relating to clathrate hydrates, and there are common fundamental science and engineering research needs for energy development and hazard mitigation.
NUCLEAR ENERGY Background
Although nuclear fission dominates electricity generation in a few countries, its initial promise has not been realized. Under business-as-usual conditions, nuclear power’s contribution to global energy will not grow, and may well decline significantly, in the decades immediately ahead, with expected capacity additions (mainly in Asia) more than offset by capacity reductions in industrialized countries.36 Nuclear power is in decline in part because the technology is much more costly than was originally projected, a problem that is being exacerbated by increasingly competitive market conditions arising from the ongoing worldwide restructuring of the electric power industry.37 In addition, the prospects for continuing and expanding the contribution of nuclear power to world energy supply have been clouded by concerns relating to safety, radioactive-waste management, and proliferation of nuclear-weapons capabilities. All of these problems have led to a loss of public confidence in nuclear technology. However, nuclear power can deliver large quantities of energy without emissions of conventional air pollutants and greenhouse gases. Its potential for mitigating climate change concerns is illustrated by a comparison of the carbon intensities of primary energy among countries that have made varying commitments to nuclear power (see Figure 5.1)—for France, where nuclear power provided 75 percent of total electricity in 1990, the carbon intensity was two thirds of that in the United States, where 20 percent of electricity was provided by nuclear power. This potential and the uncertainties associated with the prospects of other energy-supply options that could offer these advantages led the 1997 PCAST energy R&D study to recommend a modest DOE-funded research effort aimed at exploring the potential of innovative approaches to address the indicated concerns—the Nuclear Energy Research Initiative (NERI). This recommendation was subsequently embraced by the Administration and approved by Congress, albeit with somewhat lower funding than PCAST recommended. As the 1997 PCAST study also noted, nuclear energy’s global prospects would be severely undermined if another major nuclear accident were to occur anywhere in the world. Avoiding such an accident is therefore of paramount concern for the future of nuclear of energy, as well as for the more important purpose of avoiding the impacts on health and property that a large accident would cause. This situation motivates ongoing efforts by the United States and other industrialized countries to improve the safety of Soviet-built nuclear power plants, as well as private-sector efforts under the auspices of the
36 EIA (1998). 37 The discussion of nuclear fission in this section benefited from Taylor (1999).
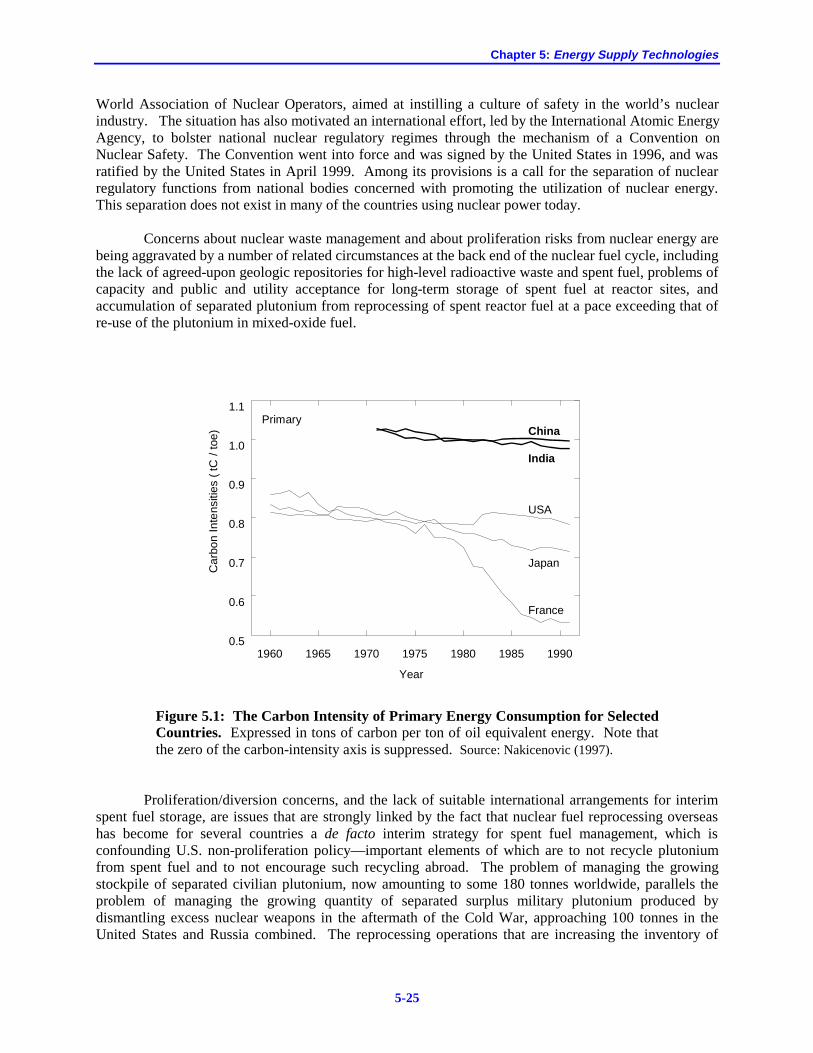
Chapter 5: Energy Supply Technologies
5-25
World Association of Nuclear Operators, aimed at instilling a culture of safety in the world’s nuclear industry. The situation has also motivated an international effort, led by the International Atomic Energy Agency, to bolster national nuclear regulatory regimes through the mechanism of a Convention on Nuclear Safety. The Convention went into force and was signed by the United States in 1996, and was ratified by the United States in April 1999. Among its provisions is a call for the separation of nuclear regulatory functions from national bodies concerned with promoting the utilization of nuclear energy. This separation does not exist in many of the countries using nuclear power today. Concerns about nuclear waste management and about proliferation risks from nuclear energy are being aggravated by a number of related circumstances at the back end of the nuclear fuel cycle, including the lack of agreed-upon geologic repositories for high-level radioactive waste and spent fuel, problems of capacity and public and utility acceptance for long-term storage of spent fuel at reactor sites, and accumulation of separated plutonium from reprocessing of spent reactor fuel at a pace exceeding that of re-use of the plutonium in mixed-oxide fuel.
1960 1965 1970 1975 1980 1985 19900.5
0.6
0.7
0.8
0.9
1.0
1.1
China
India
France
USA
Japan
Year
Car
bon
Inte
nsiti
es (
tC /
toe)
Primary
Figure 5.1: The Carbon Intensity of Primary Energy Consumption for Selected Countries. Expressed in tons of carbon per ton of oil equivalent energy. Note that the zero of the carbon-intensity axis is suppressed. Source: Nakicenovic (1997).
Proliferation/diversion concerns, and the lack of suitable international arrangements for interim spent fuel storage, are issues that are strongly linked by the fact that nuclear fuel reprocessing overseas has become for several countries a de facto interim strategy for spent fuel management, which is confounding U.S. non-proliferation policy—important elements of which are to not recycle plutonium from spent fuel and to not encourage such recycling abroad. The problem of managing the growing stockpile of separated civilian plutonium, now amounting to some 180 tonnes worldwide, parallels the problem of managing the growing quantity of separated surplus military plutonium produced by dismantling excess nuclear weapons in the aftermath of the Cold War, approaching 100 tonnes in the United States and Russia combined. The reprocessing operations that are increasing the inventory of
Powerful Partnerships
5-26
separated civilian plutonium do not appear to be economic compared to once-through use of low-enriched uranium fuel, but they continue because of a combination of factors: sunk capital costs, government subsidies, long-term contracts signed when uranium seemed scarcer and costlier than it does today, reluctance to throw away the energy content of unrecycled plutonium and uranium, perceptions by some that reprocessed wastes are easier to manage in the long run than spent fuel, and lack of alternatives to reprocessing as a means of removing spent fuel from reactor sites in the short term. The prospects for the liquid-metal fast breeder reactor (FBR), the historical choice for the next generation of nuclear fission technology, are rapidly fading around the world, even in countries such as France and Japan, which have dynamic nuclear power industries. A major attraction of the FBR is that it could make uranium in effect an “inexhaustible” energy resource via fuel reprocessing and plutonium recycling. The FBR would make it possible to recover about half of the energy contained in uranium, instead of the less than 1 percent characteristic of light water reactors (LWRs) operated on once-through fuel cycles. A major drawback of the FBR is the exacerbation of proliferation-diversion risks that would result for fuel reprocessing and plutonium recycle. Declining interest in the FBR has resulted from poor economic prospects as well as proliferation and diversion concerns. However, despite the demise of the FBR, there is still interest in various countries in pursuing alternative advanced nuclear reactor concepts. All of these issues have dimensions that require international cooperation. Besides the need for global cooperation in promoting a culture of safety for today’s nuclear technology, there is a growing need to deal with the near-term spent-fuel storage issue. There is great merit in having a consistent international regulatory framework and international consensus on repository security and non-proliferation standards.38 Furthermore, the cost of developing new nuclear technology that might be effective in simultaneously addressing the multiple challenges facing current nuclear technology would be beyond the capacity of any single country—including the most advanced countries.39 Unlike the situation with light water reactor (LWR) technology—the advancement of which benefited enormously from spillovers to the civilian sector of military RD3 (e.g., the LWR was originally developed for submarine use)—the next generation of nuclear technology will get no boost from military RD3 activity, and will evolve in a far more fiscally austere governmental spending environment than that which existed when first-generation nuclear technology was introduced. If the United States were to become involved in collaborative efforts, it could have direct access to the fruits of ongoing RD3 abroad and be well positioned to play important roles in a nuclear power renaissance, should these RD3 efforts lead to new reactor designs that can address satisfactorily cost, safety, proliferation/diversion, and waste disposal concerns. In addition, the United States should be involved in collaborative RD3 activity on fuel cycles in order to have a strong voice in advancing U.S. policies relating to proliferation and diversion. Part of such collaborative RD3 activity should be directed to exploring fuel cycles that would make it feasible to maintain the nuclear power option for the long term without fuel reprocessing and plutonium recycle, in light of the proliferation- and diversion-resistance attractions of once-through fuel cycles. One possibility for maintaining fission as a major option without reprocessing is low-cost extraction of uranium from seawater. The uranium concentration of sea water is low (approximately 3 ppb) but the quantity of contained uranium is vast—some 4 billion tonnes (about 700 times more than known terrestrial resources recoverable at a price of up to $130 per kg). If half of this resource could ultimately be recovered, it could support for 6,500 years 3,000 GW of nuclear capacity (75 percent capacity factor) based on next-generation reactors (e.g., high-temperature gas-cooled reactors) operated on once-through fuel cycles. Research on a process being developed in Japan suggests that it might be
38 Taylor (1999). 39 Taylor (1999).

Chapter 5: Energy Supply Technologies
5-27
feasible to recover uranium from seawater at a cost of $120 per lb of U3O8.40 Although this is more than
10 times the current uranium price, it would contribute just 0.5¢ per kWh to the cost of electricity for a next-generation reactor operated on a once-through fuel cycle—equivalent to the fuel cost for an oil-fired power plant burning $3-a-barrel oil. Nuclear fusion offers a more distant possibility of abundant energy free of greenhouse gases and conventional air pollutants.41 Even under favorable assumptions about fusion R&D investments and outcomes, it is not likely to be able to deliver a significant contribution to world electricity supply much before the middle of the 21st century. But uncertainties about the ultimate tractability of the problems of fission, combined with the possibility that fusion will offer significant advantages in safety, waste characteristics, and proliferation resistance, make it prudent to pursue the R&D needed to determine whether fusion’s promise can be realized. Fusion R&D has embodied a steadily growing international collaborative component since 1958, lending itself to such collaboration in part by being so far from commercialization as to suppress any competitive instincts, and in part by being so costly as to make cooperation almost a necessity. But (notwithstanding the recommendations of PCAST studies in 1995 and 1997 and other high-level reviews) the U.S. Congress in the last few years has been unwilling to allocate to fusion R&D the sums that would be needed to maintain both a solid domestic program and significant U.S. participation in the flagship international fusion effort—the International Thermonuclear Experimental Reactor (ITER). The FY 1999 budget appropriation essentially dictated the termination of U.S. participation in ITER, a major blow both to progress in fusion and to the credibility of the United States as a participant in large-scale international energy R&D collaborations. High-Priority Nuclear Initiatives Goals To preserve and enhance the possibility that nuclear power could play an expanding role in addressing climate change and other energy-related challenges in the next century. These initiatives, together with the other important nuclear initiatives listed below, are recommended for funding at $10 million per year in FY2001, increasing to $20 million per year in FY2005. U.S. Actions (1) Add an explicit international component to the DOE’s new Nuclear Energy Research Initiative
(NERI), promoting bilateral and multilateral research focused on advanced technologies for improving the cost, safety, waste management, and proliferation resistance of nuclear fission energy systems;
(2) Expand and strengthen international cooperative efforts in studies and information exchange on
geologic disposal of spent fuel and high-level wastes, to include expanded participation, studies of international interim-storage facilities, and development of a consistent and rigorous international regulatory framework for both interim storage and geologic disposal of these materials;
(3) Pursue a new international agreement on fusion R&D that commits the parties to a broad range of
collaborations on all aspects of fusion energy development, while selectively enhancing U.S.
40 Nobukawa (1994). 41 Dean (1999).

Powerful Partnerships
5-28
participation in existing fusion experiments abroad and inviting increased foreign participation in new and continuing smaller fusion experiments in the United States.
Elaboration
(1) International Nuclear Energy Research Initiative. The costs of exploring new technological approaches that might deal effectively with the multiple challenges posed by conventional nuclear power are too great for the United States or any other single country to bear, so that a pooling of international resources is needed. This program would include increased information sharing about, and joint assessments and feasibility studies of, advanced reactor types, proliferation-resistant fuel cycles, and waste-management technologies, and would help increase the leverage and reduce the duplication associated with fragmented national efforts on these issues in an era of scarce research funds for fission. Projects under the international NERI, as under the domestic one, would be more research-oriented than development-oriented, hence relatively inexpensive and less likely to encounter resistance on competitive grounds. Research efforts underway in Russia, Germany, Japan, South Africa, and South Korea on a variety of advanced reactor types and proliferation-resistant fuel cycles are potentially suitable foci for U.S. participation, as is the Japanese research on extraction of uranium from sea water. Increased cooperation with Russia—in particular on nuclear-energy research—has, of course, the important side benefit of providing productive employment for scientists and technologists in the Russian nuclear-weapons community whose talents it is strongly in the U.S. and world interest to retain in Russia, focused on civilian pursuits.
(2) Managing Spent Fuel and High-Level Wastes. International collaboration relating to spent fuel management and non-proliferation aspects of civilian nuclear power generally would help strengthen U.S. non-proliferation policy. The DOE’s existing international cooperation on these issues, being carried out in part in collaboration with the U.S. National Research Council, the German-American Academic Council, and Japanese government agencies and industry, are ripe for expansion—particularly regarding the role of Russia in these efforts. The United States should also promote providing the IAEA with the authority and funding to monitor the safety of all spent-fuel shipments to any location.
(3) Nuclear Fusion. Because fusion is a long-term energy option for which R&D costs are large,
international collaborative R&D is an attractive approach for sustaining the fusion option. Any new agreement should not be restricted to construction of a single device, although U.S. participation in construction of a scaled-down ITER along the lines now being explored by the parties to the ITER agreement would not be ruled out. Increased U.S. participation in selected existing fusion experiments abroad was recommended in the 1997 PCAST report. The DOE should continue to make a vigorous case to Congress for restoration of recent fusion budget cuts to a degree sufficient to pay for the U.S. share in these international collaborations while protecting a robust domestic program in fusion science.
Other Important Nuclear Initiatives Goals These initiatives would help improve the safety and security of nuclear facilities worldwide.

Chapter 5: Energy Supply Technologies
5-29
U.S. Actions
(1) Strengthen the program of cooperation with the republics of the former Soviet Union and Eastern Europe to improve the safety of Soviet-built reactors in those countries, aiming to speed up activities and increase the number of scientists involved in joint work, and further support the Convention on Nuclear Safety to increase the effectiveness of U.S. efforts to promote nuclear regulatory reform.
(2) Promote an international review, under International Atomic Energy Agency (IAEA) auspices, of
the adequacy of physical protection at the world’s civilian nuclear energy facilities (and in transport links among them) to prevent diversion of nuclear materials to weapons purposes, and seek adoption of binding standards and measures to bring all facilities and transport modes into compliance with these standards.
Elaboration
(1) Nuclear Safety. Strengthening the existing cooperative program—which is funded at about $50 million per year and overseen by an interagency task force coordinated in the State Department, led by the DOE and its Pacific Northwest National Laboratory, and including an International Nuclear Safety Center established by the Argonne National Laboratory where Russian and U.S. scientists collaborate on safety R&D—is likely to require some increase in budget as well as better coordination of U.S. efforts with those being managed by the IAEA and the OECD Nuclear Energy Agency. Further U.S. support of the Nuclear Safety Convention could increase the effectiveness of U.S. efforts to promote regulatory reforms called for in the Convention, including separating regulatory and promotional activities and increasing transparency in reporting procedures.
(2) Improving Proliferation/Diversion Resistance of Existing Nuclear Energy Operations. The
international cooperative effort to provide assurance that nuclear materials have not been diverted from civilian nuclear energy operations to weapons purposes—namely, the safeguards regime operated by the IAEA—is chronically under-funded in relation to the difficulty and importance of its task. The United States should increase its contributions in support of IAEA safeguards and seek increased support for these from other member states. (These activities are partly R&D to improve capabilities to safeguard particularly problematic kinds of facilities, such as those handling large quantities of separated plutonium, and partly implementation.) The actual physical protection of separated plutonium and highly enriched uranium at nuclear energy facilities (an activity different from safeguards, which deter diversion by the risk of detection but do not physically prevent either diversion or theft) is currently considered a national rather than an international responsibility, for which there are guidelines but no binding standards, except for material in international transport.
CLOSE It is now useful to indicate, in a very rough manner, where the initiatives identified in this chapter fit vis-à-vis global energy supplies today. Table 5.4 identifies global energy supplies for 1995 for the major supply sectors—oil, coal, gas, nuclear, and renewables (primarily hydro and biomass). Arrayed against this table of supplies are some of the initiatives and initiative components identified in this Chapter, as well as combined heat and power from Chapter 4. Although no initiatives specifically on oil supply were developed in the course of this study—the private sector in oil already being strongly internationalized and well capitalized—there are several initiatives that would produce liquid fuel

Powerful Partnerships
5-30
complements to oil and oil products. Similarly, there are initiative elements in gas and coal directly involving that sector, and also from the renewables and nuclear sectors that could provide many of the same energy supplies—principally electricity or liquid or gaseous fuels. The initiatives identified in this chapter provide reasonable coverage of the energy-supply sector, taking into account the strengths of the private sector and the appropriate role of the Federal government to highly leverage public resources in pursuit of key public benefits.
Together, the development of an innovation pipeline, energy-efficient technologies, and clean energy-supply technologies can provide the basis for addressing global energy-linked challenges. We turn in the next chapter to the critical issues of how to establish, manage, and fund these cooperative activities.
Table 5.4: Global Energy Supply and PCAST Initiatives Energy Supply = Primary Energy consumption, 1995, Exajoules
Sector Industrial
Countries Transition Countries
Developing Countries
World PCAST Initiatives
Oil 88 13 49 150 --Fossil: coal and gas multiple products, hydrogen --Renewables: biomass multiple products
Gas 44 23 16 83 --Fossil: hydrogen, methane clathrates --Energy-sector reform
Coal 27 15 45 87 --Fossil: coal multiple products --Renewables --Sequestration
Nuclear 20 2.5 1.5 24 --Nuclear: NERI; safety; spent fuel; proliferation resistance; fusion
Renewables and other
18 3 11 32 --Renewables: grid connected, remote, bioenergy, solar thermal, resource assessment
Total 197 57 122 376 Electricity (TkWhrs)*
7.0 1.6 3.2 11.8 --Fossil: coal gasification/trigeneration --Nuclear: NERI, safety, spent fuel, fusion --Renewables: grid-connected, rural systems --Combined heat and power
*Tera kiloWattHours (see appendix B for units) Source: EIA (1998)
Chapter 5: Energy Supply Technologies
5-31
REFERENCES Bakker et al. 1996: W. Bakker, A. Cohn, and R. Goldstein, “Advances in Solid Oxide Fuel Cells,” EPRI Journal, Vol. 21 (September/October 1996), No. 5, pp. 42-25. Bechtel 1990: Bechtel Group, Inc., Slurry vs. Fixed Bed Reactors for Fischer-Tropsch and Methanol: Final Report, U.S. Dept. of Energy Project No. DE-AC22-89PC89867 (Pittsburgh, PA: Pittsburgh Energy Center, 1990). Bijur 1998: Peter Bijur, Keynote Speech to the World Energy Council 17th Congress, Houston, 14 September 1998. Brennand 1996: T.P. Brennand, Concessions for Wind Farms: A New Approach to Wind Energy Development, Report prepared for the Energy Strategies and Technologies Working Group of the China Council for International Cooperation on Environment and Development (Beijing: September 1996). Cavallo 1995: A. Cavallo, “High Capacity Factor Wind Energy Systems,” Journal of Solar Engineering, Vol. 117 (1995), pp. 137-143. Choi et al. 1997: G.N. Choi, S.J. Kramer, S.S. Tam, J.M. Fox, N.L. Carr, and G.R. Wilson, Design/Economics of a Once-Through Fischer-Tropsch Plant with Power Co-Production, paper presented at the 1997 Coal Liquefaction and Solid Fuels Contractors Review Conference (Pittsburgh, PA: 3-4 September, 1997). Dean, 1999: Steven O. Dean, Lessons Drawn from ITER and Other Fusion International Collaborations, Fusion Power Associates, Paper prepared for the PCAST International Energy RD3 Panel, February 1999. DOE 1998: DOE Office of Fossil Energy and Federal Energy Technology Center, Vision 21 Workshop: Summary of Breakout Sessions and Presentations (Pittsburgh, PA: 15-16 December, 1998). EIA 1998: Energy Information Administration, U.S. Department of Energy, International Energy Outlook 1998 with Projections Through 2020, DOE/EIA-0484(98) (Washington, DC: U.S. Government Printing Office, April 1998). EIA 1999: Energy Information Administration, International Energy Outlook, 1999, DOE/EIA-0484(99) (Washington, DC: Department of Energy, March 1999). Elliott et al. 1991: D.L. Elliott, L.L. Wendell, and G.L. Gower, An Assessment of the Available Windy Land Area and Wind Energy Potential in the Contiguous United States, Report PNL-7789 (Richland, WA: Pacific Northwest Laboratories, 1991). EPRI and DOE 1997: Electric Power Research Institute and Office of Utility Technologies, U.S. Department of Energy, Renewable Energy Technology Characterizations, EPRI TR- 1 09496 (December 1997). Forest and Braun 1997: H. Forest and G. Braun, Renewable Energies: Are We on Track?, paper presented at the 1997 Environment Northern Seas Conference, Stavanger, Norway, 28 August, 1997.

Powerful Partnerships
5-32
Grubb and Meyer 1993: M.J. Grubb and N.I. Meyer, “Wind Energy: Resources, Systems, and Regional Strategies,” in T. B. Johansson, H. Kelly, A.K.N. Reddy, and R.H. Williams (eds.), Renewable Energy: Sources for Fuels and Electricity (Washington, DC: Island Press, 1993), pp. 157-212. Gunter et al. 1997: W. Gunter, T. Gentzix, B. Rottenfusser, and R. Richardson, “Deep Coal Bed Methane in Alberta, Canada: A Fuel Resource with the Potential of Zero Greenhouse Emissions,” Energy Convers. Mgmt., Vol. 38 (Suppl.) (1997), pp. S217-S222. Holloway 1996: S. Holloway (ed.), The Underground Storage of Carbon Dioxide, Report prepared for the Joule 11 Programme (DG XII) of the Commission of the European Communities, Contract No. JOU2 CT92-0031 (Brussels: February 1996). Jager 1997: B. Jager, SASOL’s Advanced Commercial Fischer-Tropsch Processes, paper presented at the Spring Meeting of the American Institute of Engineers, Houston, Texas, 10- 13 March, 1997. Kassler 1994: P. Kassler, Energy for Development, Shell Selected Paper (London: Shell International Petroleum Company, November 1994). Larson and Jin 1999: E.D. Larson and Jin Halming, “A Preliminary Assessment of Biomass Conversion to Fischer-Tropsch Cooking Fuels for Rural China,” in Proceedings of the Fourth Biomass Conference of the Americas, Oakland, CA, 29 August - 2 September (forthcoming). Lawry 1996: P.J. Lawry, Photovoltaics: A Quantum Jump, paper presented at the 3rd Renewable Energy Technologies & Remote Area Power Supplies Conference, Cairns, Australia, 5-7 August, 1996. Lew et al. 1998: D.J. Lew, R.H. Williams, S. Xie, and S. Zhang, “Large-Scale Baseload Wind Power in China,” Natural Resources Forum, Vol. 22, No. 3 (1998), pp. 165-184. Li et al. 1998: Li Jingjing, Bal Jinming, and Ralph Overend, Assessment of Biomass Resource Availability in China, Report prepared by Energy Research Institute of the State Development Planning Commission of China and the National Renewable Energy Laboratory of the United States (Beijing: China Environmental Science Press, 1998). Masters et al. 1994: C.D. Masters, E.D. Attanasi, and D.H. Root, “World Petroleum Assessment and Analysis,” in Proceedings of the 14th World Petroleum Congress (Stavanger, Norway: 1994). Max et al. 1997: M.D. Max, R.E. Pellanbarg, and B.G. Hurdle, Methane Hydrate, a Special Clathrate: Its Attributes and Potential, Naval Research Laboratory Report NRL/MR/6101-97-7926, (Washington, DC: Naval Research Laboratory, 28 February, 1997). 1DNLüHQRYLü��������1��1DNLüHQRYLü��³)UHHLQJ�(QHUJ\�IURP�&DUERQ�´�LQ�-�+��$XVXEHO�DQG�+�'��/DQJIRUG�(eds.), Technology Trajectories and the Human Environment (Washington, DC: National Academy of Sciences Press, 1997). Nobukawa 1994: H. Nobukawa “Development of a Floating Type System for Uranium Extraction from Sea Water Using Sea Current and Wave Power,” in Proceedings of the 4 International Offshore and Polar Engineering Conference (Osaka, Japan: 10-15 April 1994), pp. 294-300. Norton et al. 1998: P. Norton, K. Vertin, and B. Bailey (NREL), N.N. Clark and D.W. Lyons (W. Virginia Univ.), and S. Goguen and J. Eberhardt (U.S. DOE), Emissions from Trucks Using Fischer-Tropsch Diesel Fuel, SAE Paper 982526 (Society of Automotive Engineers, 1998).
Chapter 5: Energy Supply Technologies
5-33
PCAST 1997: The President’s Committee of Advisors on Science and Technology, Federal Energy Research and Development for the Challenges of the Twenty-First Century (Washington, DC: Office of Science and Technology Policy, November 1997). PERI 1995: Princeton Economic Research, Inc., Government Export Assistance Available to European Wind Turbine Manufacturers, report prepared for the National Renewable Energy Laboratory (24 March 1995). RECS 1999: Renewable Energy Consulting Services, The Present and Future Prospects of PV-Based Network Generation: Can an Assured Large Market Bring PV System Costs Down to $3,000 per Installed Kilowatt? Evaluation carried out for the Environmental Projects Unit, International Finance Corporation (1 March 1999). Rice et al. 1993: D.D. Rice, B.E. Law, and J.L. Clayton, “Coal-Bed Gas—an Undeveloped Resource,” in U.S. Geological Survey, The Future of Energy Gases, Professional Paper No. 1570 (Washington, DC: U.S. Government Printing Office, 1993), p. 389-404. Schainker 1997: Robert B. Schainker, Electric Power Research Institute, presentation to the PCAST Energy R&D Panel, 14 July 1997. Shell 1995: Shell International Petroleum Company, The Evolution of the World’s Energy System 1860-2060 (London: Shell Centre, December 1995). Siegel, 1999: Jack S. Siegel, International Collaborations in Fossil Energy Research, Development, Demonstration, and Deployment, Energy Resources International, Inc., Paper prepared for the PCAST International Energy RD3 Panel (February 1999). Siegal and Rackstraw 1999: J.M. Siegal and K. Rackstraw, U.S. Renewable Energy Experience in the International Marketplace, Paper prepared for the PCAST International Energy RD3 Panel (February 1999). Smith 1993: K. Smith, “Fuel Combustion: Air Pollution Exposures and Health in Developing Countries,” Annual Review of Energy and Environment, Vol. 18 (1993), pp. 529-566. Socolow 1997: R. Socolow (ed.), Fuels Decarbonization and Carbon Sequestration: Report of a Workshop, PU/CEES Report No. 302, September 1997. Steinbugler and Williams 1998: M.M. Steinbugler and R.H. Williams, “Beyond Combustion: Fuel Cell Cars for the 21st Century,” Forum for Applied Research and Public Policy (Winter, 1998), pp. 102-107. Taylor 1999: J. Taylor, International Cooperation on Energy Research, Development, Demonstration, and Deployment for Nuclear Power, Paper prepared for the PCAST International Energy RD3 Panel (February 1999). UPVG 1993: Utility Photovoltaic Group, TEAM-UP (Building Technology Experience to Accelerate Markets in Utility Photovoltaics). Proposal to the Office of Solar Energy conversion, Conservation and Renewable Energy, U.S. Department of Energy (27 September, 1993). WEC 1994: World Energy Council, New Renewable Energy Resources—A Guide to the Future (London, UK: Kogan Page).

Powerful Partnerships
5-34
Williams 1995: R.H. Williams, “Variants of a Low CO2-Emitting Energy Supply System (LESS) for the World,” Report No. PNL-10851, prepared for the IPCC Second Assessment Report, Pacific Northwest National Laboratory, Richland, Washington (October 1995). Williams 1998a: R.H. Williams, “A Technological Strategy for Making Fossil Fuels Environment- and Climate-Friendly,” World Energy Council Journal (July 1998). Williams 1998b: R.H. Williams, “Fuel Decarbonization for Fuel Cell Applications and Sequestration of the Separated CO2,” in R. Ayres (ed.), Eco-Restructuring: Implications for Sustainable Development (Tokyo: United Nations University Press, Tokyo), pp. 180-222. Williams 1998c: R.H. Williams, “Hydrogen Production from Coal and Coal Bed Methane, Using By-Product CO2 for Enhanced Methane Recovery and Sequestering the CO2 in the Coal Bed,” Proceedings of the 4h International Conference on GHG Control Technologies, Interlaken, Switzerland, 30 August - 2 September 1998 (in press).

6-1
CHAPTER 6 PORTFOLIO ASSESSMENT, PARTNERING
AND PROGRAM MANAGEMENT
Nine-tenths of wisdom is being wise in time.
Theodore Roosevelt1
revious chapters described the serious and interconnected energy-related challenges faced by the United States and the world, the insufficiency of current national and international efforts in energy-technology innovation in the face of those challenges, and the consequent necessity, for
purposes of filling the gap, of strengthening the energy-innovation pipeline and enhancing international RD3 cooperation on advanced energy end-use and energy-supply technologies. This chapter concludes the Panel’s analysis with a brief overall assessment of the augmented international ERD3 portfolio developed in Chapters 3 to 5, a discussion of cross-cutting issues in the selection of and cooperation with international partners, and recommendations relating to the institutions, management mechanisms, and budgets employed by the U.S. government in implementing its international cooperative activities in energy-technology innovation. The chapter concludes with the reasons for believing that the current window of opportunity for addressing these issues with high leverage is unique and destined to be brief. PORTFOLIO ASSESSMENT
The initiatives described in previous chapters form, in their totality, a coherent strategic portfolio organized around high-leverage mechanisms to strengthen the global energy-innovation pipeline and specific opportunities for cooperating internationally to accelerate the progress through that pipeline of advanced energy technologies offering large public benefits. Predicting accurately the leverage of these initiatives against the energy-linked environmental, economic, and national-security challenges described in Chapter 1 is difficult if not impossible, because the initiatives are designed to leverage the activities of the private sector, multilateral institutions, and foreign governments in cooperative, market-based ventures whose ultimate impacts are difficult to quantify. The whole may be expected to be greater than the sum of the parts. We do, however, offer here a qualitative assessment of how these initiatives—when taken as a group—address the strategic and diversity criteria proposed for portfolio evaluation in the 1997 PCAST study of U.S. energy R&D strategy. Portfolio Structure
Chapter 3 defined a set of initiatives for strengthening the innovation pipeline for the research, development, demonstration, buy-down, and accelerated deployment of advanced clean energy technologies. Chapters 4 and 5 identified a series of RD3 initiatives for improving specific technologies and moving them along the pipeline. The mechanisms focused on the pipeline itself were portrayed 1 Roosevelt (1917)

Powerful Partnerships
6-2
schematically in Figure 3.7 and are summarized in Table 6.1. Several aspects of this structure deserve emphasis here: • Mechanisms within the innovation pipeline focus on high-leverage competition-driven performance.
These include the competitive Clean Energy Technology Obligation for buying down the costs of advanced technologies and rural concessions and other approaches for widespread market deployment, but also R&D and demonstrations through competitive solicitations.
• The roles of other countries include reforming their energy sectors toward market-driven systems
while ensuring that public benefits are built in, including mechanisms for: Public Benefits Funds (PBFs); R&D; demonstrations (Demonstration Support Facility—DSF); technology cost buy-down (Clean Energy Technology Obligation—CETO); deployment; costing of externalities; Integrated Resource Planning (IRP) and Demand Side Management (DSM); rural concessions; and others. Mechanisms such as the DSF and CETO may be implemented through the Global Environment Facility (GEF), the preferred option, or in direct partnership with the United States. Details are described in Chapter 3 and summarized in Table 6.1.
• U.S. roles in the above activities include encouraging establishment of GEF-based DSF and CETO,
supporting capacity building, partnering to conduct R&D, and support for demonstrations, cost buy-down, and widespread deployment. Such support would also enhance prospects that industrial teams with U.S. partners would successfully compete in other countries’ ERD3 processes and play roles in widespread deployment of advanced clean energy technologies in those countries.
• The roles of the GEF would include targeted research support, the establishment within GEF of the
DSF and CETO mechanisms (preferred approach), incremental cost contributions to support demonstrations under the DSF and to help buy down new technology costs under CETO, and incremental cost support aimed at overcoming market barriers.
• Other multilateral organizations also have important roles. The UNDP plays a valuable role through
support of capacity building. The World Bank and other MDBs can help finance the base costs of innovative clean energy technologies. As energy restructuring increasingly displaces these MDBs from the financing of conventional energy technologies, MDBs should evolve towards supporting technologies offering significant public benefits and helping provide retail finance through to end-users.
• The U.S. private sector plays a key role throughout in creating partnerships with host-country firms,
the U.S. and foreign public sectors, national laboratories, and universities for activities at each stage of the research, development, demonstration, buy-down, and deployment pipeline.
Undoubtedly a variety of adjustments to the framework presented here will be needed as the indicated efforts to strengthen the innovation pipeline proceed. But we believe the architecture we have presented outlines a fundamentally sound approach for enhancing energy-technology innovation—on a competitive and performance-driven basis—using a private sector-led but public sector-facilitated process. We turn now to evaluating the portfolio against the criteria developed for portfolio analysis of the U.S. domestic energy R&D program in the 1997 PCAST study.

6-3
Table 6.1: Financial Support Strategies for IERD3 Partnerships for Clean Energy Technologies Partner→
Host Country Industrial Partnerships U.S. Government GEF UNDP World Bank Group
Examples from this Report’s Initiatives
Value Chain ↓
Host Country
U.S.
Capacity Building
Support from a Public Benefits Fund (PBF)*
In-company and public-private partnerships
In-company and public-private partnerships
Support through Agencies (e.g., USAID)
Direct support Direct support
--Capacity Building
Research and Development
Support R&D through PBF or other mechanisms
In-company and public-private partnerships
In-company and public-private partnerships
Agency support will enhance prospects that US industry/partner teams will “win” CETO competition that could follow R&D and demonstration projects
Targeted R&D to support GEF Operational Programs
--Factories of the 21st --Innovative Vehicles --Efficient Buildings --Fossil --Nuclear: NERI --Renewables
Demonstration [Demonstration Support Facility (DSF)]
Contribute to incremental cost of demonstrations to advance host country interests
Contribute to base and incremental cost of DSF-sponsored demon-strations
Contribute to base and incremental cost of DSF-sponsored demon-strations
Encourage creation of GEF-based DSF (preferred); energy production tax credits for US companies in qualifying demonstrations; agency technical support; will enhance prospects that US industry/partner teams will win CETO competitions.
Establish GEF-based DSF (preferred) and contribute to incremental cost of demonstrations
Can help finance base costs of GEF-sponsored demonstrations
--DSF --Vehicles --Buildings and
Appliances --CO2 Sequestration
Technology Cost Buy-down [Clean Energy Technology Obligation (CETO)]
Contribute to incremental cost of buy-downs to advance host country interest
Contribute to base and incremental cost of buy-downs under CETO
Contribute to base and incremental cost of buy-downs under CETO
Encourage creation of GEF-based CETO (preferred), with increased US contribution to GEF to enable larger GEF-organized CETO or else direct support to host-country-organized CETO
Establish GEF-based CETO (preferred) and contribute to incremental cost of buy-downs
Can help finance base costs for GEF-sponsored buy-down projects
--CETO --Vehicles --Buildings and
Appliances --Renewables
Widespread deployment
Work to overcome barriers to deploy-ment of commercial clean energy tech-nologies. Establish rural concessions
Lead role Lead role. Possible Joint Imple- mentation, CDM, or other credit
Technical support to World Bank Group and others to help them design strategies to overcome various barriers, including high transaction costs; loan guarantees to facilitate retail financing
Contribute to incremental cost arising from barriers
Transition to clean energy technolo-gies and retail finance. Evolve mechanisms to overcome barriers
--Finance Initiative --Combined Heat &
Power --Nuclear Safety
*A Public Benefits Funds (PBF) is a fund established to advance energy-related public benefits and could be supported through a nonbypassable wires/pipes charge, or through other mechanisms. PBFs might be established with initial assistance from debt for PBF swaps.

Powerful Partnerships
6-4
Strategic Criteria
As defined in the PCAST 1997 study, strategic criteria relate to the prospective leverage of the RD3 portfolio to address the principal energy-linked economic, national security, and environmental challenges. The technology-specific initiatives proposed in this report are tabulated against global sectoral energy demand and energy supply in Tables 4.5 and 5.4.2 Many of the initiatives extend U.S. domestic energy activities into the international arena, particularly to developing and transition countries. Elements of the leverage of the portfolio against the specific challenges outlined in Chapter 1 include the following.
Economic Challenges
Consumer costs and economic development. The portfolio of energy-efficient technologies in the buildings, industry, and transport sectors will reduce lifecycle costs of energy services, benefiting firms and individual consumers directly and, in developing countries in particular, saving capital for other pressing needs. The portfolio of advanced energy-supply technologies will likewise lower consumer costs for clean energy below what they would otherwise be and will provide modern energy services to rural areas, encourage rural economic development, slow rural-to-urban migration, and provide such collateral benefits as assisting in the restoration of degraded lands to become productive for the economy and the environment (Chapter 5).
Markets. As indicated in Table 1.4, global annual investment in energy-supply technologies is projected, depending on the scenario, to be in the range of roughly $400 billion to $600 billion per year out to 2020 and $600 to $1200 billion per year between 2020 and 2050. Investments of similar magnitudes will be made in high-energy-use industrial equipment (e.g., energy-intensive industrial processes, motors, pumps, fans, control systems) and consumer products (e.g., lights, refrigerators, air conditioning, cars). As noted in Chapters 4 and 5, growth in world markets for products ranging from energy-intensive materials for building infrastructure, consumer products, and energy-supply technologies such as coal, nuclear, or renewable power will increasingly be in developing countries. Already, most of the coal, nuclear, and renewable energy markets are outside the United States. The survival of many U.S. companies will depend on their ability to penetrate these markets, a challenge magnified by tied aid and other trade supports by foreign competitors.
Environmental Challenges
Local and Regional Air Pollution. This is the set of energy-linked environmental problems having the greatest current ecological and health impact—and corresponding political salience—in most parts of the world, as the discussion in Chapter 1 emphasizes. The relevant emissions of particulates, hydrocarbons, SOx, and NOx come from the wide spectrum of fossil-fuel-burning and biomass-fuel-burning technologies—from wood stoves and motorbikes to jumbo jets and coal-burning power stations—that among them account for about 90 percent of world primary energy supply. Virtually all of the initiatives proposed in this report would bring significant leverage against one or another of the contributors to these pervasive air-pollution problems.
Greenhouse Gas (GHG) Emissions. The initiatives identified in this report could significantly
reduce global GHG emissions and therefore mitigate the negative consequences of anthropogenically induced global and regional climate change. Factories of the 21st Century would reduce emissions of
2 For comparison, the U.S. domestic energy R&D initiatives proposed in the 1997 PCAST energy R&D study are
summarized in Appendix C.

Chapter 6: Portfolio Assessment, Partnering, and Program Management
6-5
energy-intensive processing, which account for about half of industrial energy use (and industrial energy use currently accounts for about half of total transition and developing country energy use, as indicated in Table 4.2). The Buildings initiative would cut that sector’s energy use roughly in half (and buildings account for about one-third of current total transition and developing country energy use). On the energy-supply side, the renewables, fossil, and nuclear initiatives would contribute substantially to reducing GHG emissions from the power and fuels sectors.
National Security Challenges
Oil Security. The United States and other nations of the world are dependent on oil and gas supplies that are frequently located in politically volatile regions. As discussed in Chapter 1, increased global demand for these products could increase the probability of conflicts over their acquisition. The buildings, industry, and transport efficiency initiatives proposed in this report would each contribute to savings in oil use. Parts of the fossil-fuel and renewables initiatives promoting production of liquid fuels from natural gas, coal, or biomass would also tend to dampen growth of world oil demand.
Proliferation. Nuclear-proliferation concerns are an important component of the nuclear-energy initiatives described in Chapter 5, which address these concerns both through short-term measures to improve proliferation resistance of existing nuclear-energy operations and through long-term research to explore possibilities for substantially more proliferation-resistant fuel-cycle options. Diversity Criteria The previous PCAST report acknowledged the desirability of pursuing a portfolio that spanned different time frames, technology pathways, and degrees of technical risk. That report was focused mainly on domestic R&D; the “diversity criteria” for international cooperative portfolios that include heavy emphasis on demonstration and deployment include additional dimensions.
With respect to diversity across time scales, the initiatives proposed by this Panel can be divided into three categories: • near-term initiatives (< 5 years), where energy-sector personnel and policymakers can receive energy-
related training; “off the shelf” technologies can be deployed to meet national energy demands in an environmentally benign and economically efficient manner; and markets can be restructured to allow privatization and foreign investments while preserving public benefits;
• medium-term initiatives (5-20 years), in which existing but costly technologies are made more
affordable or adapted to changing global and national conditions; emerging or advanced technologies are demonstrated; and significant penetration of more efficient processes or energy-supply technologies can occur in those sectors of the economy with long technology lifetimes and thus low turnover; and
• long-term initiatives (20 years and beyond), in which investments in R&D for advanced or new
technologies will begin to yield results. The portfolio of initiatives presented here obviously embodies, as well, diversity across the sectors of energy demand and supply—the industrial, transportation, and building sectors of energy demand and the renewable, fossil, and nuclear sectors of energy supply—and diversity in the actors who would participate in bringing these innovations about—local and national governments; the private sector;

Powerful Partnerships
6-6
local, national, and international NGOs; and Multilateral Development Banks and other international institutions (see Table 6.1). Finally, the portfolio of initiatives described in this report acknowledges the need for diversity on another level—a diversity of approaches including not only research and development but investments in building the human and institutional capacity underpinning R&D and investments in bringing the fruits of R&D into the marketplace and accelerating their competitive success. IDENTIFYING AND DEVELOPING EFFECTIVE PARTNERSHIPS
The need for international partnerships in energy RD3 is clear and compelling, but with whom should the United States partner and what form should the partnerships take? No matter how promising the initiatives, success or failure is significantly determined by the effectiveness of the partners, managers, and program staff in carrying out the work.
The choice of partner is very important to the success of international, cooperative ERD3 initiatives
and broader strategic goals. There is a large body of literature that distills the characteristics that can lead to successful selection of partners, and successful program development and implementation.3 These include: • Mutual interests, which need to be clearly evident to the participants in any project being pursued. • Mutual investments, which demonstrate mutual commitment to the cooperative venture, help
maintain continuity, and give common standing to participants. • Agreement on goals and milestones, timetables, responsibilities, sharing of intellectual property
rights, etc., which is critical in assuring a cost-effective venture, and permits continued progress as the project advances or evolves with respect to its original design.
• Streamlined management, which is essential for minimizing bureaucratic and transaction costs, and
maintaining clear lines of communication. • Continuity of support, which must be matched to the projected time to complete milestones and
achieve goals, enabling the research to be carried out in an efficient way. • Periodic, independent oversight, which is critical for keeping the project focused and responsive. • Structural readiness, which provides an essential foundation for all other components of the
cooperative venture.
3 We have benefited greatly in developing the ideas in this chapter, as well as elsewhere in our report, from a set of
expert papers commissioned by the panel on the lessons learned from past and ongoing efforts at international cooperation on energy and similar issues, and from invited oral and written communications to the panel from an even wider array of experts from the United States and abroad. The paper titles and authors are listed, together with the names and affiliations of the other invited commenters, in Appendix A. Of particular value here are Alston and Pardey (1999), Dean (1999), Goldemberg (1999), Siegel (1999), and Taylor (1999).
Chapter 6: Portfolio Assessment, Partnering, and Program Management
6-7
In addition, the Administration might want to include further considerations: • Geopolitics. Is the country important geopolitically? Is the country a regional leader with potential
regional leverage? • Market size. Is there a large potential market within the country? Is it sufficiently large to quickly
generate economies of scale and learning in producing, using, and maintaining the technology? What is the willingness and ability of the population to pay for the energy technology/service?
These are only indicative criteria, and there will be many exceptions. Most important will be partnering with countries to encourage them to move towards market mechanisms, while advancing public benefits and the forms of innovation that enhance capabilities to provide such benefits in cost-effective ways. PROGRAM MANAGEMENT In the preceding sections, we have surveyed the ingredients and leverage of the portfolio approach developed in Chapters 3 to 5 for enhancing international cooperation in energy-technology innovation, and we have discussed a variety of issues that arise in forming and implementing the international partnerships that such cooperation requires. We turn now to the mechanisms and institutions through which the U.S. government manages and coordinates its portfolio of international ERD3 programs and the associated partnerships: what characteristics are desirable in these management mechanisms and institutions; how the existing management efforts stack up against these desiderata; and what initiatives we propose in pursuit of needed improvements. Management Desiderata The reviews of past and current experience provided in the preceding chapters and in the expert papers commissioned by the panel make clear that the elements of a successful system for managing the U.S. government’s international ERD3 cooperation efforts must include the following. • Strategic vision. The management of these activities needs to be informed by an over-arching vision
of what the programs are trying to achieve, how these programmatic goals relate to U.S. national interests and values, and how they relate to the interests and values of partner countries. There must be mechanisms for developing and agreeing upon this strategic vision, for propagating it into the line agencies responsible for implementing the programs, and for evaluating the agency programs for completeness and effectiveness against it (about which we present more below).
• Program definition. The management system must be able to ensure that the programs and the
projects within them are clearly defined and delineated, with goals, schedules, budgets, and responsibilities specified for all of the participants, and with clear articulation of the relation of projects to program, the relation of programs to one another, and the relation of all of it to the strategic vision.
• Terms of partnership. The management system must develop and propagate a systematic approach to
the “partnering” issues discussed above, including (a) means of reaching agreement, before projects are launched, on equitable sharing of intellectual property and other fruits of the collaboration, and on local content, labor, and other inputs, and (b) mechanisms for consultation, feedback, and dispute resolution among the partners once the project is underway. Resolving the issues in both of these
Powerful Partnerships
6-8
categories before commitments are made helps avoid squabbles later and greatly increases the chances of achieving project goals.
• Management responsibility. Each agency with a role in international ERD3 cooperation should have
clear lines of authority and accountability for the international part of the agency’s ERD3 work. Similarly, field-program management should have clear lines of authority and accountability to drive the program forward to a successful conclusion. Protections against political interference with the appropriate execution of these management functions should be built into the larger agency and interagency structure.
• Coordination across agencies. In addition to coordination within agencies, good coordination across
agencies is also required. This can minimize duplication of effort and take advantage of the synergies between agencies whose foci are on different parts of the innovation pipeline: energy technology R&D (DOE), environment (EPA), development assistance (USAID), and trade assistance (DOC, Ex-Im Bank, OPIC, TDA). The needed coordination must be organized in a way that avoids the pitfall of consuming so many human resources in coordination that none are left to execute the programs. More difficult still is coordination between ERD3 cooperation policy and other government policies that interact with (or interfere with) such cooperation, but mechanisms for this are essential.
• Coordination with the private sector. Programs and projects need to be closely linked with related
efforts and expertise in the private sector in order to ensure that the private sector’s relevant insights are utilized in the research and development phases, as well as to ensure that demonstration and deployment support are conducted in ways that maximize the probability of successful commercialization. Mechanisms must exist for “hand-off” of government programs and projects to the private sector, and for withdrawal of the government from joint projects at the point where government involvement is no longer needed or appropriate.
• Review and evaluation. Program and project review and evaluation are crucial management
functions, necessary to keep efforts focused, responsive, on schedule, on budget, and appropriately coordinated across projects, programs, agencies, and sectors. The processes of review and evaluation should avoid excessive inside-agency micro-management while maximizing the use of outside-expert peer review and interagency and private-sector/NGO/academic-sector advisory bodies. Mechanisms must exist for terminating projects and programs that review and evaluation consistently show to be unpromising.
• Long-term commitment. Notwithstanding the need to be able to terminate unpromising programs, the
U.S. government’s overall commitment to build and maintain strong international cooperation in ERD3 must have staying power. The innovation pipeline—from capacity building, to conduct of R&D, to demonstration, to lowering barriers to deployment—is long and time-consuming, and traversing it successfully requires a long-term commitment of personnel and other resources by the United States with as much continuity across personnel, programs, and priorities as possible. Similarly, a strong commitment by the foreign-country partner(s) is necessary, and judgments of capacity to make and sustain such commitments will properly enter the determination of what partnerships to undertake.
Management Status Quo To what extent do the management mechanisms and institutions already in place in the U.S. government meet these requirements? Our review of existing programs and the management of these has necessarily been incomplete because of constraints on the time and resources available for this task. The

Chapter 6: Portfolio Assessment, Partnering, and Program Management
6-9
information we have reviewed has been sufficient, however, to strongly suggest that, although groups of knowledgeable and dedicated individuals in all of the agencies involved have succeeded in developing and operating a variety of quite effective activities in international ERD3 cooperation, these achievements have been in spite of—even as many shortcomings and failures have been caused by—major deficiencies in the existing management mechanisms and institutions on the criteria just enumerated. The shortfalls are particularly problematic in relation to strategic vision, coordination within and across agencies, review and evaluation, and long-term commitment, which topics we therefore treat in what follows in some detail. Strategic Vision The several Federal agencies presiding over significant parts of the existing international ERD3 portfolio have a variety of missions and, correspondingly, varying and somewhat piecemeal visions of what is to be achieved. DOE, in its energy responsibilities (as opposed to its responsibilities in nuclear weaponry, environmental remediation, nuclear waste management, and basic science), is mainly engaged with research and development. USAID is an economic-development assistance agency. EPA promotes programs that improve environmental quality. The Export-Import Bank, the Trade and Development Agency, and the Overseas Private Insurance Corporation are trade-assistance agencies. The Department of Commerce, insofar as its activities relate to international cooperation in ERD3, is a trade promotion agency. The Department of Energy periodically issues “National Energy Strategy” documents containing quite comprehensive and compelling goals and including a degree of emphasis on the potential contributions of international cooperation in achieving them;4 but detailed prescriptions for what is required of international cooperation and how it could be achieved in adequate measure are absent, and the mechanisms for propagating and reflecting the National Energy Strategy’s goals even within DOE—never mind beyond that agency—are inadequate.5 USAID’s “Climate Change Initiative 1998-2002" embodies a shorter-term vision of what this agency’s deployment-oriented efforts might achieve—and how they will achieve it—against the goal of moderating greenhouse-gas-induced climate change;6 but by its agency-centered nature the document is not the comprehensive vision statement that international ERD3 cooperation requires. The Executive Office of the President (EOP)—wherein reside the Office of Science and Technology Policy, PCAST, the National Science and Technology Council, the Council of Economic Advisors, the National Security Council, the Council on Environmental Quality, and the Office of Management and Budget—is the locus within the Executive Branch best equipped to develop and promulgate a strategic vision of the role of international ERD3 cooperation in addressing the country’s economic, environmental, and security interests. However, until the President’s July 1998 request to OSTP Director Neal Lane (which led to the formation of this panel), no part of the EOP had been given this mandate. Neither has strategic vision on this issue been provided by Congress. Quite the contrary, Congressional consideration of international technological cooperation in general and ERD3 cooperation in particular has often been substantially shaped by an orientation toward thinking of international economic and technological interactions in terms of competition and solely U.S. interests rather than cooperation and mutual self-interests, lack of interest in energy issues while energy prices are low, the Congress’s fragmented committee structure, and a special mistrust of several of the lead Executive
4 See, for example, DOE (1998). 5 See the concluding chapter of the previous PCAST energy R&D study (PCAST 1997, Chapter 7). 6 USAID (1998).

Powerful Partnerships
6-10
Branch agencies in the energy-cooperation area, namely DOE, EPA, and USAID. (Table 6.2 summarizes a number of often-expressed Congressional concerns about international ERD3 cooperation together with this panel’s findings on these topics.) The general Congressional lack of interest in and sometimes outright opposition to international cooperation on ERD3 not only has constrained the funding for such activities but also has caused the agencies to downplay their activities in this category and to refrain from even thinking about articulating an overarching strategy.
Perhaps not surprisingly, then, much of the current U.S. international ERD3 portfolio has been developed in an ad hoc manner. Countries, regions, and projects have become priorities based not on any overarching vision but for more prosaic reasons. Many projects have originated under the pressure of providing “deliverables” for high-ranking U.S. officials on international travel, in response to visiting dignitaries, or to pay a debt or return a favor to a leader or locale involved in unrelated international issues. (At the same time, program staff in some agencies find that such high-level agreements are often the only means—given predictable opposition to more systematic efforts from some parts of Congress—to gather sufficient internal support to maintain an international presence and, within that, to conduct useful work.) A certain amount of linkage to international politics is to be expected, but such factors should not be the major driver and shaper of the overall international ERD3 portfolio.
Coordination Within and Across Agencies A principal “management” finding of the previous PCAST energy R&D study was that there is insufficient communication and coordination across the major energy-related divisions of DOE—Basic Energy Sciences, Fossil Fuels, Nuclear Energy, and Renewable Energy and Efficiency. (Meetings take place across these boundaries, but lack of clear lines of authority and accountability for coordination tend to minimize the results.) This management shortcoming adversely affects international cooperation as well as domestic energy R&D programs, and it is mirrored to some extent within most of the other agencies with significant activities related to international ERD3 cooperation. Relatively little effort is being made to develop or adapt technologies for emerging markets or to link activities together in a systematic process that moves high-potential technologies through the innovation pipeline. While DOE has developed and is promoting many sophisticated energy technologies in the United States that could be of great value elsewhere in the world, too little effort is being made to extend their potential application to the vast developing-country and reforming-economy markets for energy end-use and supply technologies. Research, development, and cost buy-down efforts are often not linked, moreover, with agencies focused individually on specific parts of the innovation pipeline, and little consideration is given by anyone to how these segments need to link together. One problem in interagency coordination is the inadequate connection between R&D-focused DOE and development-assistance-oriented USAID. In many cases, USAID has resisted being overly involved in early demonstration and deployment of advanced energy technologies on the grounds that problems with the technology could risk developing country clients’ financial resources as well as the credibility of USAID. Where USAID has been involved with technology deployment, it has usually focused on existing commercial technologies or relatively straightforward adaptations of existing technologies that can benefit developing countries but are being impeded by market barriers of various kinds (Table 4.1). These are, of course, critical issues to address, particularly the problems of avoiding excessive risk to clients, facilitating end-user finance (especially for high capital-cost systems), assisting equipment distribution, operations and maintenance, and minimizing transaction costs. In these cases, the challenge is not deploying innovative technologies but those that are commercially available and appropriate. In other cases, the paucity of technologies developed for the conditions of developing countries and the ineffectiveness of retrofits in many instances have limited the availability of viable technologies. Closer collaboration between USAID-supported projects in the field, DOE’s national labs,

Chapter 6: Portfolio Assessment, Partnering, and Program Management
6-11
and other technology developers could be helpful to both agencies as well as in advancing and diffusing energy-technology innovation. Efforts internal to USAID, DOE, and the national laboratories are being made to increase these collaborations and these efforts should be strongly encouraged at the highest levels in these agencies.
Table 6.2: Congressional Concerns and Panel Findings Congressional Concern: International Energy RD3 is...
This Panel’s Findings …
poorly managed by Executive Branch agencies, wasting taxpayer dollars;
We identified a number of well-managed programs and some that were less well managed. In general, the biggest management problems are lack of an overarching strategic vision and insufficient coordination of programs within and across agencies to meet that vision (although there is substantial agency effort to coordinate). The responsibility for these shortcomings is shared by the Executive Branch, which has not tried to implement an overarching vision, and the Congress, whose opposition to cooperation has helped deter the Executive Branch from articulating one. In any case, the high rates of return to R&D and the substantial economic benefits of cooperating on it make it unlikely that these programs have been money wasters.
a giveaway to other countries;
Most international cooperation on ERD3 serves U.S. economic, environmental, and security interests. In economic terms, it provides the United States with access to sources of innovation elsewhere as well as access for U.S. technologies to overseas markets that are often larger than our own.
corporate welfare;
The possibility of inappropriately subsidizing corporate activity is a risk that must be monitored. In general, however, Federal support for international energy RD3 augments private investments in the innovation pipeline appropriately in order to gain public benefits in excess of private returns. Assistance to U.S. companies in overcoming barriers to successful deployment of innovative technologies in foreign markets may bring environmental and security benefits to U.S. citizens as well as benefiting the U.S. economy.
undercutting U.S. companies with loss of intellectual property;
Intellectual property issues are always a concern and require ongoing attention. Partners in U.S. international ERD3 cooperation should be signatories to international protocols on copyright and patent rights, and the U.S. Government should ensure that broad umbrella agreements are in place and specific intellectual property rights are defined in all programs and projects.
a source of junkets for government bureaucrats;
Those who do this kind of work, particularly in developing countries, can attest to the long hours, difficult working and living conditions, frequent illness, and long periods away from home and family. These activities are rarely junkets.
back-door implementation of the Kyoto protocol.
International ERD3 cooperation brings many benefits to the United States besides reducing the risks of climate change. In relation to climate, moreover, the Kyoto Protocol is about targets and timetables for reductions in greenhouse-gas emissions out to 2012, while ERD3 cooperation commits no one to any specific targets or timetables but positions everyone to reduce emissions more cost effectively to any targets/timetables eventually agreed upon.
Another shortcoming in coordination is between USAID and the trade-promotion agencies. USAID emphasizes institutional and human capacity building first, then programs, and finally projects. Trade-promotion agencies emphasize projects and moving hardware into the field—often one U.S. export sale at a time. There has frequently been a gulf between these two perspectives. USAID officials have seen many “airdrops” of hardware into the field, particularly by foreign donors, that have not been backed by the human or institutional capacity needed to make effective use of or maintain that hardware. They

Powerful Partnerships
6-12
see project-based funding that promotes the technology preferences of the donor, which in turn promotes boom-bust cycles as industries and donor politics shift. Industry, for its part, sees USAID-supported development of infrastructure and institutional/human capacity being used by foreign competitors who have further advantage of concessionary financing provided by their governments. There is truth in both perspectives. Needed are larger and longer-term resource availability plus improved coordination for effective institutional and human capacity building underpinning the development and installation of real energy infrastructure and the growth of energy-technology markets to a sustainable scale. Review and Evaluation As noted about DOE’s domestic R&D program’s in the 1997 PCAST study, the problem with program and project evaluation is most often not that it is absent but that it consists of too much internal process-oriented review and too little external substance-oriented peer review. Greater use of the kinds of independent expertise that can be brought to bear by the National Research Council (as used to good effect in annual reviews of the Partnership for a New Generation of Vehicles) or through the technical advisory bodies to the individual agencies would be desirable. We note also that the purpose of review and evaluation in both national and international ERD3 is not to prevent failure altogether, but to terminate unpromising projects once their lack of promise has become clear to perceptive and independent observers and to provide guidance on how to improve programs. If there are no failures, this is an indication that the ERD3 agenda is insufficiently ambitious. In practice, the oversight process that has existed for ERD3 activities—and above all for international ones—has been so focused on attacking failure that it has created a risk-avoiding program-management culture. This does not serve the national interest in innovation. Long-Term Commitment The long time scales often associated with energy R&D—compounded by the time requirements of capacity building, technology demonstrations, and lowering barriers to deployment of advanced technologies—require that commitments to ERD3 cooperation be sustainable over long periods; but inability to achieve this has been a frequent shortcoming of U.S. government efforts. The causes have included the short budget cycles and changing interests and priorities of the Congress; rapid turnover in the middle-level positions as well as leadership positions in the Executive Branch agencies (a problem aggravated by the penetration of political appointments down in the management chain); and the vulnerability of long-running projects to budgetary attack in times of fiscal constraint. In any case, the United States has developed something of a reputation as an unreliable partner in large-scale, long-range R&D collaborations, with the cancellation of the Superconducting Supercollider and termination of U.S. participation in the International Thermonuclear Experimental Reactor as conspicuous recent examples outside and inside the energy domain. If this syndrome is not to imperil the capacity of this country to promote effectively the program of international ERD3 cooperation we have argued here is strongly in the U.S. national interest, steps will need to be taken to improve the capacity of the U.S. government to sustain commitments in this area over the long periods required to move advanced technologies through the innovation pipeline. Such steps will have to include, at the least, the development of a degree of bipartisan consensus in the Congress about the benefits of ERD3 cooperation in terms of U.S. interests and values; a commitment by the Executive Branch to continue to make and defend the budget requests that these efforts require; and the implementation of measures to reduce turnover and increase institutional memory in the relevant Executive Branch agencies. There must also be more systematic efforts to increase public awareness of the immense benefits of ERD3 cooperation in relation to its modest costs, for such awareness will be the most durable foundation for the various forms of sustained policy-maker commitment that will be required.

Chapter 6: Portfolio Assessment, Partnering, and Program Management
6-13
MANAGEMENT INITIATIVES Based on this analysis, our management initiatives address mechanisms and institutions through which the U.S. government, in cooperation with the private sector, can more effectively develop, manage, and coordinate a portfolio of governmental activities in support of international ERD3 cooperation consistent with an overarching vision of what this portfolio is to accomplish. Three high-priority initiatives address these issues: High-Priority Initiative: Interagency Working Group Goals The goals of this initiative are to improve the comprehensiveness and effectiveness, enhance the visibility, and increase the accountability of U.S. activities in support of international ERD3 cooperation by providing White House-level interagency coordination and leadership of these efforts. U.S. Actions The President should establish a new interagency working group within the National Science and Technology Council (NSTC) to further develop and promote a strategic vision of the role of U.S. contributions to international ERD3 cooperation in support of this country’s national interests and values. This NSTC working group would:
(1) have an interagency secretariat and an advisory board drawn from the private, academic, and NGO sectors;
(2) be responsible for assessment of the government’s full portfolio of activities in international
ERD3 cooperation—in consideration of the overarching strategy of the effort, the needed components of the innovation “pipeline” and links between these, and appropriate diversity and public-private interface criteria—and for using the results of such portfolio assessment to help guide and coordinate the evolution of the relevant agency programs; and
(3) assist the agencies to strengthen their internal and external mechanisms for monitoring and
reviewing projects, for terminating unsuccessful ones, and for handing off successful ones to the private sector at the appropriate time.
Elaboration The NSTC working group would identify key performance goals for U.S. efforts in international ERD3 cooperation, linked to U.S. economic, environmental, and security objectives over 5-, 10-, 25-, and 50- year timeframes. It would work with Congress in the development of these goals and corresponding portfolios, plans, budgets, and mechanisms to provide continuity and long-term commitment to the associated international collaborations. It would ensure coordination of relevant activities across agencies to maximize their value, avoid duplication of effort, and reduce destructive competition. It would oversee and review partnerships created by the Executive Branch agencies, alone and in combination, with other governments, multilateral organizations, NGOs, and firms. The interagency secretariat that would staff and support the operations of the NSTC working group would be composed largely of agency detailees, who would be committed full time to the international ERD3 duties assigned by the NSTC working group. This approach would serve international

Powerful Partnerships
6-14
energy cooperation by utilizing the technical capabilities spread throughout the government, as opposed to assigning leadership based on the outdated notion that some agencies are international while others are domestic. High-Priority Initiative: Improve International ERD3 Management Within Agencies Goals The goals of this initiative are to increase the role of competitive solicitations in project development, to improve coordination of and accountability for international ERD3 activities within individual agencies, and to strengthen the capabilities of the agencies for conducting these international efforts. U.S. Actions
(1) Agencies should initiate the use of competitive solicitations, in cooperation with foreign counterparts, to identify the most promising approaches to achieving portfolio and program goals. A well developed business plan for moving a technology through the RD3 pipeline and deploying it on a significant scale should be a prerequisite for winning a competition.
(2) Cabinet secretaries or administrators of the key agencies implementing the international ERD3
cooperation portfolio should identify appropriate accountable management chains with authority and budgets for implementing these programs.
(3) Agencies should strengthen their international capabilities through training, targeted hiring, and
rotating national laboratory staff and outside academic and industrial technical experts through the agencies on a systematic basis, giving these persons senior professional status with significant responsibility for guiding program planning and policy.
Elaboration Implementation of individual programs and projects would be managed at the agency level. We found that the principal agencies now involved in international ERD3 cooperation have complementary capabilities and that no one of them is designed or equipped to manage and implement all aspects of the international ERD3 effort that is required. USAID has strong international capabilities; DOE has strong technical capabilities; EPA is an environmental leader; the trade agencies offer substantial financial and export assistance capability. An NSTC working group can solve the key management problem of utilizing all of these agencies, along with the multilateral development organizations to which the United States contributes, to their full capacities without undermining initiative or creating bureaucratic impediments. Leadership comes from the NSTC working group within the White House, but implementation is decentralized. High-Priority Initiative: Strategic Energy Cooperation Fund Goals This initiative would provide additional funding for Federal activities in support of international ERD3 cooperation, beyond the currently funded activities, reflecting the over-arching strategy of the government’s international ERD3 activities.
Chapter 6: Portfolio Assessment, Partnering, and Program Management
6-15
U.S. Actions The President should create a new Strategic Energy Cooperation Fund, supplementing existing budgets for international ERD3 activities and the budgets proposed in the 1997 PCAST study for U.S. domestic energy R&D programs. The amounts estimated for the four “foundation”, four “end-use-efficiency”, and three “energy-supply” initiative clusters we have recommended sum to $250 million per year in FY2001 and $500 million per year in FY2005 (as-spent dollars). The money from the Strategic Energy Cooperation Fund would be
(1) allocated to the relevant agencies in the President’s budget request as the outcome of a process engaging the agencies, the Office of Management and Budget, and the Interagency Task Force on Strategic Energy Cooperation and its Advisory Board;
(2) multi-year in duration in most instances, to diminish the influence of annual funding cycles on
project selection and continuation and to promote the continuity of commitment that has often been lacking in U.S. international-cooperation efforts.
Elaboration The Strategic Energy Cooperation Fund at the level proposed here would add, in FY2001, an amount of new money for these types of activities—$250 million—approximately equal to the total that was spent on them in FY1997. The ramp-up of a further $250 million between FY2001 and FY2005 would bring the total for international ERD3 cooperation in the latter year to about $750 million. The breakdown of these totals at the level of the initiative clusters is shown in Table 6.3; these sums are intended to cover both the “high priority” and “other important” elements of these initiative clusters as elaborated in Chapters 3 to 5. Money made available, within the program’s indicated FY2001 to 2005 trajectory, by phasing out support for projects that either fail or that succeed and get taken over by the private sector could be used for further high-leverage projects identified through the continuing interactions of agencies, the Interagency Task Force and its Advisory Board, foreign partners, and other energy-technology users.
The process of project development based on competitive solicitations would begin with broad top-down NSTC working group guidance to the Agencies on the overall portfolio to ensure public benefits and effective program performance, coordination, and accountability. Agencies would establish, in cooperation with foreign counterparts, sector-level competitive solicitations to identify the most effective approaches to the international ERD3 cooperation goals identified within this broad portfolio, ensure that the activities appropriately meet the project criteria identified above, and have the champions needed to carry the project through to successful completion. Such an approach is consistent with a central theme of this report of moving toward a competitive- and performance-driven environment and recognizes the power of encouraging those who are directly involved in these efforts to design projects that work effectively in the field, meeting the needs of those for whom the work is intended. It also incorporates the need for streamlined management while maintaining careful program monitoring and evaluation with external peer review. This would allow senior officials to establish needed cooperative agreements with foreign counterparts by identifying areas of interest and appropriate levels of funding support, and then initiate competition to identify how best to meet goals rather than attempting to specify as well project and implementation specifics.

Powerful Partnerships
6-16
Table 6.3. Breakdown of Strategic Energy Cooperation Fund by Initiative Cluster
FY 2001 $ Million
FY 2005 $ Million
Capacity building 20 40 Sector reform 20 40 Demo/buy-down 40 80 Finance 40 80 Buildings 20 40 Transportation 20 40 Industries of the 21st century 10 20 Cogeneration 10 20 Renewables 40 80 Fossil 20 40 Nuclear 10 20 Total 250 500
Management Architecture for the Government’s International ERD 3 Activities
These international cooperative ERD3 activities require a long-term commitment and continuity; a strong public component to ensure public benefits; recognized technical leadership; and cross-technology capability to ensure that needs are met at the lowest cost. They require the ability to move the clean technologies into demonstration and large-scale deployment. And they require capacity building and independent analysis. Repeating a frequent refrain from PCAST 97, these requirements can best be met through national laboratory/industry/university partnerships in cooperation with their foreign counterparts. National labs are essential for providing long-term commitment and institutional memory, technical leadership, cross-technology capability, and an emphasis on public benefits; these critical needs have not adequately been provided by agency staff and are unlikely to be given the many other conflicting demands on their time. These factors and the public-linked, not-for-profit status of the labs provide them credibility with foreign institutions and enable them to play a unique and central role in facilitating these international cooperative ERD3 efforts.7 The private sector obviously plays the lead role in large-scale demonstration and deployment; as do universities in capacity building, fundamental research, and independent analysis. The structure and function of the proposed arrangement is depicted schematically in Figure 6.1. Beyond the details of this arrangement, we believe it is also vitally important that the President and Vice President should speak more often and more forcefully to the American people on the importance of this array of activities—that is, on the ways in which the global energy future and international cooperation to shape it are linked to the economic, environmental, and security interests of the United States and to the fulfillment of fundamental American values.
7 It should be noted that the national labs are not allowed to compete in public competitive solicitations.
Appropriate mechanisms must then be found to ensure their unique strengths and roles, noted here, are effectively employed in these international cooperative energy RD3 efforts.

Chapter 6: Portfolio Assessment, Partnering, and Program Management
6-17
Statement of US StrategicICERD3
What Would They Do on ICERD 3
•Develop U.S. strategic vision and goals•Develop overall portfolio•Identify agency budgets and cross-cuts•Develop central data base for programs•Support external peer review of programs•Coordinate all U.S. activity: RD3, trade, financing, international negotiations, etc.
•Ensure handoff to private sector
NSTC InterAgency WorkingGroup on ICERD 3
Capacity Building•Support regional centers•Training•Interdisciplinary research
R&D Activities•Buildings•Industry•Transport•Fossil•Nuclear•Renewables
Financing•World Bank --Trust funds•GEF•OPIC-based Fund•Tax credits•Feasibility studies
Energy Sector Reform with Public Benefits•Public Benefits Fund•Get “prices right” including externalities•Demonstration Support Facility•Clean Energy Technology Obligation•Portfolio Diversity•Integrated Resource Planning•Demand Side Management•Rural Energy Concessions•Debt for Public Benefit Fund Swap
Possible Members•OMB•Treasury•USTR•State•DOE•USAID•EPA•DOC•Trade Agencies•Other Agencies•Private sector advisory group
Figure 6.1: A Strategic Framework for International Cooperation on Energy RD3. THE WINDOW OF OPPORTUNITY The United States and the world stand before a narrow window of opportunity for using cooperation on energy-technology innovation to reshape the global energy future to the benefit of all. That the window is open now but will not remain so for long is the result of a convergence of time-dependent factors. Specifically: • Processes of energy-sector restructuring and regulatory reform that will be completed largely over the
next decade are going to “lock in” the mechanisms that will determine success or failure in the dual aims of attracting the private capital needed to meet energy needs for economic development while addressing the huge public-goods and externality issues that the energy sector presents.
• Continuing processes of rapid urbanization in the developing countries mean that decisions made in
those countries in the next few decades about the interaction of urban energy supply, transportation networks, information infrastructure, land-use planning, and building characteristics will likewise substantially “lock in”, for the next century and even beyond, important aspects of the energy requirements and quality of life of the large majority of the world’s inhabitants living in these urban agglomerations.
• The time requirements for moving new technologies through the innovation pipeline mean that much
of the research intended to affect deployments in the 2020s, 2030s, and 2040s needs to be underway in the next decade. And the long service lifetimes of most energy-supply technologies and much of the equipment and infrastructure governing energy end-use efficiency means that much of what is deployed in the 2020s, 2030s, and 2040s will still be in place toward the end of the next century.

Powerful Partnerships
6-18
Thus the energy technologies and related infrastructures that are developed and deployed over the next few decades—supporting rapid energy growth in developing and reforming economies and replacing existing capital stock in industrialized ones—will strongly influence the trajectories of energy costs and end-use efficiencies, greenhouse-gas emissions, public-health impacts of air pollution, oil-import dependence, nuclear-energy-system safety and proliferation resistance…and much else of importance about the world energy system…for most of the next century. In recent years, moreover, the globalization of innovation capacities, together with tightening constraints on domestic R&D spending, have sharply increased the attractiveness of cooperation to the United States for purposes of developing the energy technologies this country will require for domestic use. Simultaneously, the globalization of energy markets has increased the necessity of cooperation to gain access for U.S. energy companies to many of the largest markets for new technologies; and the globalization of environmental and security risks from inadequacies in the global portfolio of deployed energy options is sharply increasing the benefits to the United States of cooperation to improve that portfolio.
It is also becoming clear that strengthening North-South cooperation on advanced energy technologies that can lower greenhouse-gas emissions while fueling sustainable economic development is by far the most promising available approach to securing developing-country participation in a larger collaborative framework for addressing the global energy-climate-development challenge. The needs and opportunities for enhanced international cooperation on energy-technology innovation supportive of U.S. interests and values are thus both large and urgent. The costs and risks are modest in relation to the potential gains. The mechanisms that have been described in these pages offer a fundamental new direction for addressing these global energy-linked challenges through mechanisms designed to provide all the benefits of competition while protecting and nurturing the public good. Now is the time for the United States to take the sensible and affordable steps outlined here to address the international dimensions of the energy challenges the 21st century will present.

Chapter 6: Portfolio Assessment, Partnering, and Program Management
6-19
REFERENCES Alston and Pardey 1999: Julian M. Alston and Philip G. Pardey, International Approaches to Agricultural R&D: The CGIAR, Paper prepared for the PCAST Panel on International Cooperation in Energy RD3 (February 1993). Dean 1999: Steven O. Dean, Lessons Drawn from ITER and Other Fusion International Collaborations, Paper prepared for the PCAST Panel on International Cooperation in Energy RD3 (February 1993). DOE 1998: U.S. Department of Energy, Comprehensive National Energy Strategy (Washington, DC: DOE, 1998). Goldemberg 1999: José Goldemberg, A Perspective from the South on ERD3, Paper prepared for the PCAST Panel on International Cooperation in Energy RD3 (February 1993). PCAST 1997: The President’s Committee of Advisors on Science and Technology, Federal Energy Research and Development for the Challenges of the Twenty-First Century (Washington, DC: Office of Science and Technology Policy, November 1997). Roosevelt (1917): Theodore Roosevelt, Speech, Lincoln Nebraska, 14 June 1917. Siegel 1999: Jack S. Siegel, International Collaborations in Fossil Energy Research, Development, Demonstration and Deployment, Paper prepared for the PCAST Panel on International Cooperation in Energy RD3 (February 1993). Taylor 1999: John Taylor, International Cooperation On Energy Research, Development, Demonstration, And Deployment (RD3) For Nuclear Power, Paper prepared for the PCAST Panel on International Cooperation in Energy RD3 (February 1993). USAID 1998: U.S. Agency for International Development, Climate Change Initiative 1998-2002 (Washington, DC: USAID, 1998).
A-1
APPENDIX A ACKNOWLEDGMENTS
COMMISSIONED PAPERS* Alston, Julian M. and Philip G. Pardey, International Approaches to Agricultural R&D: The CGIAR
Julian Alston, University of California at Davis and visiting fellow at University of Melbourne Philip G. Pardey, Environment and Production Technology Division, International Food Policy
Research Institute, and University of Minnesota Dean, Steven O. Lessons Drawn from ITER and Other Fusion International Collaborations
Fusion Power Associates. Dooley, James J., and Paul J. Runci, Adopting a Long View to Energy R&D and Global Climate Change
Pacific Northwest National Laboratory, Battelle Memorial Institute Adcock, Rick, Financing Renewable Energy and Energy Efficiency Projects in International Markets Econergy International Corporation Edmonds, Jae, S.H. Kim, and H. Pitcher, The Long-Term Shape of Global Energy Systems
Pacific Northwest National Laboratory, Battelle Memorial Institute Fulkerson, William., Mark D. Levine, Robert N.Schock, and Thomas J. Wilbanks, Developing Country
Partnerships for Environmental Energy Technology Research, Development, Demonstration and Deployment (RD3)
William Fulkerson, Joint Institute for Energy and Environment, University of Tennessee, Tennessee Valley Authority and Oak Ridge National Laboratory
Mark D. Levine, Environmental Energy Technology Division, Lawrence Berkeley National Laboratory
Robert N. Schock, Center for Global Security Research, Lawrence Livermore National Laboratory
Thomas J. Wilbanks, Energy Division, Oak Ridge National Laboratory Goldemberg, José, A Perspective from the South on ERD3
Universidade de São Paulo, Brasil Kammen, Daniel M, Building Institutional Capacity for Small-Scale and Decentralized Energy
Research, Development, Demonstration, and Deployment (ERD3)in the South Energy and Resources Group, University of California at Berkeley
Levine, Mark D., Opportunities for Partnerships between the United States and China in Energy
Efficiency Research, Development, Demonstration and Deployment Environmental Energy Technology Division, Lawrence Berkeley National Laboratory

Powerful Partnerships
A-2
Siegel, Jack S., International Collaborations in Fossil Energy Research, Development, Demonstration and Deployment
Energy Resources International, Inc. Siegel, Judith M. and Kevin Rackstraw,U.S. Renewable Energy Experience In The International
Marketplace Judith M. Siegel, Consultant Kevin Rackstraw, Consultant
Taylor, John, International Cooperation on Energy Research, Development, Demonstration, And
Deployment (RD3) For Nuclear Power Electric Power Research Institute (retired) Witcher, Daniel (Júnior), The Experience of the U.S. ESCO Industry in The International Market Consultant *PCAST thanks the John D. and Catherine T. MacArthur Foundation for a grant that supported the preparation of the commissioned papers.

Appendix A: Acknowledgments
A-3
CONTRIBUTORS, PRESENTERS, AND REVIEWERS Dan Adamson Department of Energy Dilip Ahuja Global Environmental Facility Rolf Anderson U.S. Agency for International Development Susan Bachtel National Academy of Sciences Jonathan Baker U.S. Federal Trade Commission Peter Ballinger Overseas Private Investment Corporation Julie Belaga Export-Import Bank Mike Bergey Bergey Windpower Linden Blue General Atomics James Bond World Bank Daniel Bouille Fundacion Bariloche Argentina Andrew Bowen Office of the United States Trade Representative Ronald Bowes Department of Energy Hap Boyd Enron-Wind Richard Bradley Department of Energy
Raymond J. Braitsch Department of Energy Flynn Bucy Proven Alternatives Robert Budnitz Future Resource Associates Jeff Burnham Office of Senator Lugar Pat Cronin Johnson Controls Dennis Cunningham Environmental Protection Agency James F. Decker Department of Energy Q. Todd Dickinson U.S. Department of Commerce Martin Dieu Environmental Protection Agency Jim Dooley Pacific Northwest National Laboratory Ray Dracher Bechtel E. Linn Draper American Electric Power Lee Elder GE Nuclear Jade Eaton Department of Justice Anton Eberhard University of Capetown South Africa Jae Edmonds Pacific Northwest National Laboratory
Powerful Partnerships
A-4
Don Eiss Office of U.S. Trade Representative Richard E. Feigel Hartford Steam Boiler Inspectors and Insurers Charles Feinstein World Bank Marvin S. Fertel Nuclear Energy Institute David Festa Department of Commerce Harvey Forest Solarex Dirk Forrister White House Climate Change Task Force Les Garden Department of Commerce Ray Geddes Unique Mobility Daniel Giessing Department of Energy Jeff Glueck Export-Import Bank J. Joseph Grandmaison Trade & Development Agency Dick Greenwalt Bechtel Tom Gross Department of Energy H. Jackson Hale Department of Energy David Heyman Department of Energy David J. Hill Argonne National Laboratory
Burkhard Holder International Solar Energy Society and Fraunhofer Institute Germany Neville Holt Electric Power Research Institute John Houghton Department of Energy Jeffrey Hunker Department of Commerce Karl Jechoutek World Bank David Jhirad Department of Energy Li Jingjing Energy Research Institute State Development Planning Commission Beijing, China Donald Juckett Department of Energy Andrew Kadak American Nuclear Society Fritz Kalhammer Electric Power Research Institute Mark Kasman Environmental Protection Agency Walter Kato American Nuclear Society Mark Kirk House Committee on International Relations John Kopecky Enron Oil and Gas International Robert A. Kost Department of Energy

Appendix A: Acknowledgments
A-5
Robert Kripowicz Department of Energy Terry Lash Department of Energy Tjaarda P. Storm Leeuwen The World Bank Maurice LeFranc Environmental Protection Agency Jane Leggett Environmental Protection Agency Eva Lerner-Lam Palisades Consulting Group Mark Levine Lawrence Berkeley National Lab Joachim Luther EUREC and Fraunhofer Institute Germany Mark Mazur Department of Energy Jane Metcalfe Environmental Protection Agency Nelson Milder American Society of Mechanical Engineers John Millhone Department of Energy Alan Miller Global Environment Facility Hudson Milner Department of Treasury Ernie Moniz Department of Energy Mark Murray US Agency for International Development Tracy Narel Environmental Protection Agency
Steve Neal Gas Research Institute Jin-gyu Oh Korean Energy Economics Institute Korea Neil Otto Ballard Automotive Robert Price Department of Energy Frank Princiotta Environmental Protection Agency Bill Randolph Department of Treasury Richard Reister Department of Energy Nelson Reyneri Overseas Private Investment Corporation Michael Roberts Department of Energy Dong-Seok Roh Korea Energy Economics Institute Korea Henry M. Roth Department of Energy Paul Runci Pacific Northwest National Laboratory John Dynes Ryan Department of Energy John Ryan. US Agency for International Development Rafe Pomerance Department of State Robert Suter Price Jr. Department of Energy

Powerful Partnerships
A-6
Peter H. Salmon-Cox Department of Energy Robert L. San Martin Department of Energy Roberto Schaeffer Federal University of Rio de Janeiro Brazil Jeff Seabright U.S. Agency for International Development Paul Schwengels Environmental Protection Agency Yingyi Shi Beijing Energy Efficiency Center China P.R. Shukla Indian Institute of Management India Bob Simon Office of Senator Bingaman Walt Simon General Atomics Scott Smouse Federal Energy Technology Center Charles S. Stark U.S. Department of Justice Jim Sullivan US Agency for International Development
Raymond A. Sutula Department of Energy John Taylor Electric Power Research Institute Susan Thornloe Environmental Protection Agency Meredith Tirpak Harvard University Willard K. Tom Federal Trade Commission James Van Dyke Oak Ridge National Laboratory Gordon Waynan US Agency for International Development Bill White Environmental Protection Agency Tom Wilbanks Oak Ridge National Laboratory Nick Woodward Department of Energy Wang Yanjia Tsinghua University Beijing, China Mr. Kurt Yeager Electric Power Research Institute

B-1
APPENDIX B UNITS AND CONVERSION FACTORS
Length
1 centimeter (cm) = 0.3937 inches 1 meter (m) = 3.281 feet 1 kilometer (km) = 0.6214 miles
1 inch (in) = 2.540 centimeters 1 foot (ft) = 12 inches = 0.3048 meters 1 mile = 5280 feet = 1.609 kilometers
Area 1 square centimeter (cm2) = 0.1550 square inches 1 square meter (m2) = 10.76 square feet 1 hectare (ha) = 10,000 square meters = 2.471 acres 1 square kilometer (km2)= 100 hectares = 0.3861 square miles
1 square inch (in2) = 6.452 square centimeters 1 square foot (ft2) = 0.09290 square meters 1 acre = 43,560 square feet = 0.4047 hectares 1 square mile = 640 acres = 2.590 square kilometers
Volume 1 cubic centimeter (cm3) = 1 milliliter (ml) = 0.06102 cubic inches 1 liter (l) = 1,000 cubic centimeters = 0.2642 gallons (liquid, U.S.) 1 cubic meter (m3)= 1,000 liters = 35.31 cubic feet
1 cubic inch (in3) = 16.39 cubic centimeters 1 gallon (liquid, U.S.) =231.0 cubic inches = 3.785 liters 1 cubic foot (ft3) = 7.481 gallons (liquid, U.S.) = 0.02832 cubic meters 1 barrel (bbl) (oil, US) = 42 gallons (liquid, US) = 159.0 liters

Powerful Partnerships
B-2
Weight
1 gram (g) = 0.03527 ounces 1 kilogram (kg) = 2.205 pounds 1 metric tonne (t) = 1,000 kilograms = 1.1023 short tons (U.S.)
1 ounce (oz) = 28.35 grams 1 pound (lb) = 16 ounces = 0.4536 kilograms 1 short ton (U.S.) = 2,000 pounds = 0.9072 metric tonnes
Energy
1 joule (J) = 0.2388 calories (International Table) 1000 joules (J) = 0.9479 Btu
1 kilowatthour (kWh) = 3.600 x 10⁶ joules
= 3,412 British thermal units
1 calorie (International Table) = 4.187 joules 1 British thermal unit (Btu) = 252.0 calories = 1055 joules
1 quad = 1 x 10¹⁵
British thermal units
= 2.931 x 10¹¹
kilowatthours
Power 1 watt (W) = 1 joule per second = 3.412 British thermal units per hour 1 kilowatt (kW) = 0.9478 British thermal units per second = 1.341 horsepower (imperial)
1 British thermal unit per hour (Btu/h) = 0.2931 watts 1 British thermal unit per second (Btu/s) = 1.055 kilowatts 1 horsepower (hp) (imperial) = 0.7068 British thermal units per second = 0.7457 kilowatts
Temperature
From Centigrade(oC) to Fahrenheit(oF):
(oC x 9/5) + 32 = oF
From Fahrenheit(oF) to Centigrade(oC):
(oF - 32) x 5/9 = oC

Appendix B: Units and Conversion Factors
B-3
Prefixes in the International System of Units
Multiplier Symbol Prefix 1018 E exa 1015 P peta 1012 T tera 109 G giga 106 M mega 103 k kilo 102 h hecto 101 da deca 10-1 d deci 10-2 c centi 10-3 m milli 10-6 µ micro 10-9 n nano
Approximate Carbon and Thermal Conversion Factors
Fuel Density (kg/liter)
Carbon a (kg C/GJ)
Energy
Coal (bituminous) 24.4 20.5 MMBtu/ton 23.8MJ/kg
Oil (crude) 0.744 18.9 5.8 MMBtu/Bbl Natural Gas 1000 cubic feet =
19.18 kg 13.6 1025 Btu/cf
Ethanol 0.792 17.8 26.8 MJ/kg Wood 0.7-0.8 NA 18-20 MJ/kg
a 1 kilogram of carbon is equivalent to 3.667 kgs. of carbon dioxide measured at full molecular weight

C-1
APPENDIX C: PCAST 1997 Recommended DOE Applied Energy-Technology R&D Initiatives and Budget Authority (in millions of as-spent dollars) PROGRAMa R&D Activities, Initiatives, and Budget Changes FY
1997 FY 1998
FY 1999
FY 2000
FY 2001
FY 2002
FY 2003
Efficiency: Buildings
Building System Design and Operation: advanced sensors; smart controls; automated diagnostics; and whole-building optimization and design tools.
Building Equipment and Materials: advanced materials; advanced energy-efficient HVAC, lighting, windows, appliances, office equipment, etc.; and insulation initiative.
Codes and Standards: for efficient appliances and buildings; technical assistance. Crosscutting Activities: technology roadmapping and partnership development with industry
following the model of the DOE Industries of the Future program. Other: management and planning, and other activities. Subtotal
24 27 12 -- 19 81
33 37 21 -- 20 111
38 57 25 20 20 160
48 72 25 25 20 190
60 85 25 30 20 220
72 98 25 35 20 250
84 111 25 35 20 275
Efficiency: Industry
Industries of the Future: advanced technologies for energy intensive industries—aluminum, cement, chemicals, forest products, glass, metal casting, refining, steel, agriculture—and for emerging energy-intensive industries following technology roadmaps.
Crosscutting Activities: advanced microturbines (40-200 kW), sensors, motor drive systems, and materials; work with DOE/OUT on biomass Integrated Gasification Combined Cycle.
Technology Access: innovation grants; industrial assessments, “Climate Wise”, and motors. Other: management and planning, and other activities Subtotal
46 38 25 7 116
56 38 37 8 139
65 70 40 10 185
75 80 40 10 205
85 90 45 10 230
95 95 45 10 245
110 100 50 10 270
Efficiency: Transport
PNGV: better emissions controls for light diesels; hybrid vehicles; and system integration. PNGV II: fuel cells, microturbines, advanced energy storage, system integration. Advanced Heavy Vehicles: efficient diesels, diesel pollution reduction, and hybrids. Advanced Materials: high-temperature/high-strength materials to reduce weight 25%. Technology Deployment: clean cities program, alternative fuel vehicles, and other activities. Other: management and planning, and other activities Subtotal
105 -- 20 33 11 7 176
129 -- 18 31 17 9 204
100 75 30 35 20 10 270
100 85 40 40 20 10 295
100 100 50 40 20 10 320
100 100 55 40 20 10 325
75 125 60 45 20 10 335
Fossil Energy Coal Power: end Low Emission Boiler System, phase out near-term clean coal activities, accelerate R&D on advanced power systems.
Coal Fuels: end direct liquefaction and solid fuels and feedstocks R&D; develop science-based hazardous air emissions program.
Gas Power: strengthen solid-oxide fuel-cell R&D and other advanced research. Oil and Gas Production and Processing: maintain oil programs for marginal resources; strengthen
gas production and processing R&D; and increase advanced research. Carbon Sequestration: strengthen science-based carbon sequestration program. Methane Hydrates: develop science-based program with industry, Federal agencies, and the Navy
to understand the potential of methane hydrates worldwide Hydrogen Manufacture/Infrastructure: conduct R&D on hydrogen production from fossil fuels Technology/Oil Price Elasticities: analyze technologies to reduce cost of oil shocks. Developing-Country Technologies: conduct collaborative R&D with other countries. Other: management and planning; environmental restoration; cooperative R&D, etc. Subtotal
86 16 97 70 1 0 0 0 0 95 365
84 16 78 77 2 0 0 0 0 89 346
79 9 92 86 10 5 1 1 1 95 379
90 12 92 94 11 5 2 1 2 97 406
87 15 83 107 17 11 6 1 6 100 433
88 16 74 110 23 11 6 1 6 102 437
82 16 70 113 22 12 7 0 6 105 433

C-2
Nuclear Fission Operating Reactors: R&D to address problems that may prevent continued operation of existing reactors.
Nuclear Energy Research Initiative: competitively select among proposals by researchers from universities, national laboratories, and industry that address issues including proliferation-resistant reactors or fuel cycles, new reactor designs with higher efficiency, lower cost, and improved safety; low-power reactors; and new techniques for on-site and surface storage and for permanent disposal of nuclear waste
Education: university research reactors and other support Other: advanced light water reactor and reactor concepts Subtotal
4 0 4 34 42
25 0 6 15 46
10 50 6 0 66
10 70 6 0 86
10 85 6 0 101
10 100 6 0 116
10 103 6 0 119
Nuclear Fusion Plasma Science: conduct research on fundamental plasma science; develop fusion science and technology and plasma confinement innovations; and pursue fusion energy science and technology as a partner in international efforts.
Subtotal
232
225
250
270
290
320
328
Renewable Energy Biomass Fuels: strengthen feedstock development; advance enzymatic hydrolysis and other conversion technologies in integrated power and fuel systems.
Biomass Power: develop biomass materials handling equipment; integrated gasification combined cycles; biogasification-fuel cell systems; and small gasification-engine systems.
Geothermal: strengthen hydrothermal research; reactivate R&D on advanced resources; expand advanced drilling R&D; and increase R&D on reservoir testing and modeling.
Hydrogen: reorient near-term demonstrations and launch initiative with DOE Fossil Energy on innovative hydrogen production from fossil fuels with sequestration.
Hydropower: develop “fish-friendly” turbines and low-head run-of-river turbines; analyze coupling of hydropower to intermittent renewables.
Photovoltaics: accelerate basic PV science; develop laboratory scaleup to first-time manufacturing; and support engineering science for large-volume, low-cost production.
Solar-Thermal: strengthen power tower and dish-stirling, esp. optical materials and solar manufacturing initiative; launch initiative on advanced high-temperature receivers.
Wind: accelerate R&D on lightweight adaptive systems, direct-drive variable speed generators, hybrid systems, system integration—including with storage; wind technology manufacturing initiative; fundamental work on materials, and computational aerodynamics.
Systems and Storage: energy storage, esp.. for system integration with intermittents. Solar Buildings: R&D in efficient and passive whole building design and design tools; building
integrated PVs and thermal systems; and initiative on low cost solar water heaters and others. International: applications-specific systems integration and development, and field studies;
collaborative R&D and training; technical assistance; technical/policy analysis. Resource Assessment: integrated assessments across all resources; further development of
geographic information systems; and collaborative R&D with developing nations. Analysis: systematic analyses of technologies, system integration, markets, and policies. Other: management and planning; renewable energy production incentive, other. Subtotal
28 28 30 15 1 60 22 29 32 3 1 0 0 21 270
38 38 30 15 1 77 20 43 46 4 7 0 0 26 345
58 63 42 16 4 105 32 53 51 6 11 5 4 25 475
76 86 49 16 8 130 43 65 54 9 13 5 5 26 585
94 89 50 17 11 133 44 66 55 9 13 6 6 27 620
97 91 51 17 11 137 46 68 57 9 14 6 6 26 636
99 93 52 17 12 140 47 70 58 9 14 6 6 29 652
SUBTOTAL 1282 1416 1785 2037 2214 2329 2412 aActivities should be done through various partnerships between industry, national laboratories, universities, and Federal/state agencies, as appropriate. President’s Committee of Advisors on Science and Technology, “Federal Energy Research and Development for the Challenges of the Twenty-First Century”, November 1997.
D-1
APPENDIX D ACRONYMS
ADB: Asian Development Bank AFDB: African Development Bank Group APEC: Asia-Pacific Economic Cooperation BAU: Business-As-Usual CAES: Compressed-Air Energy Storage CDM: Clean Development Mechanism CENEf: Russian Center for Energy Efficiency CET: Clean Energy Technology CETO: Clean Energy Technology Obligation CHP: Combined Heat and Power CNG: Compressed Natural Gas CO2: Carbon Dioxide CoC: Council on Competitiveness COEECT: Committee on Energy Efficiency
Commerce and Trade COP: Conference of the Parties CTI: Climate Technology Initiative DCs: Developing Countries DOC: Department of Commerce DOE: Department of Energy DSF: Demonstration Support Facilities DSM: Demand-Side Management EBRD: European Bank for Reconstruction and
Development ECCJ: Energy Conservation Center, Japan EE/FSU: Eastern Europe/Former Soviet Union EE: Energy Efficiency EFL: Energy Feed Law EIA: Energy Information Administration EJ: Exajoules EnEffect: Bulgarian Center for Energy Efficiency EOP: Executive Office of the President EOR: Enhanced Oil Recovery EPA: Environmental Protection Agency EPRI: Electric Power Research Institute ERD3: Energy Research, Development,
Demonstration, and Deployment ERI: Energy Research Institute ESCOs: Energy Service Companies EU: European Union Ex-Im Bank: Export-Import Bank of the United
States FBR: Fast Breeder Reactor FEWE: Polish Foundation for Energy
Efficiency FSU: Former Soviet Union FY: Fiscal Year GAO: Government Accounting Office GATT: General Agreement on Tariffs and
Trade
GDP: Gross Domestic Product GEF: Global Environment Facility GHG: Greenhouse Gas GNP: Gross National Product GPO: Government Printing Office GRI: Gas Research Institute GtC: Giga-tonnes Carbon HIPC: Heavily Indebted Poor Countries HVAC: Heating, Ventilation and Air
Conditioning IAEA: International Atomic Energy Agency ICERD3: International Cooperation in Energy
Research, Development, Demonstration, and Deployment
ICSU: International Council for Science IDB: Inter-American Development Bank IEA: International Energy Agency IERE: International Electric Research
Exchange IFC: International Finance Corporation IGCC: Integrated Gasification Combined Cycle IIASA: International Institute for Applied
Systems Analysis IPCC: Intergovernmental Panel on Climate
Change IRP: Integrated Resource Planning ITER: International Thermonuclear
Experimental Reactor kWh: Kilowatt-hours LDC: Less Developed Countries LPG: Liquid Petroleum Gas LWR: Light Water Reactor MDB: Multilateral Development Banks MTIs: Market Transformation Initiatives NERI: Nuclear Energy Research Initiative NFFO: Non-Fossil Fuel Obligation NGOs: Non-Governmental Organizations NPV: Net Present Value NREL: National Renewable Energy Laboratory NSB: National Science Board NSF: National Science Foundation NSTC: National Science and Technology
Council OECD: Organization for Economic Cooperation
and Development OPEC: Organization of Petroleum Exporting
Companies OPIC: Overseas Private Investment
Corporation OPs: Operational Programs

Powerful Partnerships
D-2
PBF: Public Benefits Fund PCAST: The President’s Committee of Advisors
on Science and Technology PM-10: Particular Matter of diameter greater
than 10 microns. PNGV: Partnership for the Next Generation of
Vehicles PNNL: Pacific Northwest National Laboratory PPP: Purchasing Power Parity PROCEL: Brazil’s National Electricity
Conservation Program PV: Photovoltaic R&D: Research and Development RD&D: Research, Development, and
Demonstration RD3: Research, Development,
Demonstration, and Deployment REEF: Renewable Energy and Energy
Efficiency Fund REFs: Reforming Economies (EE/FSU) RET: Renewable Energy Technologies RPS: Renewable Portfolio Standard SDC: Solar Development Corporation SEVEn: Czech Energy Efficiency Center STE: Solar Thermal Electric T&D: Transmission and Distribution TC: Transition Countries, e.g. Eastern
Europe and Former Soviet Union TDA: Trade and Development Agency TERI: Tata Energy Research Institute TSP: Total Suspended Particulate UNDP: United Nations Development Program UNEP: United Nations Environment Program UNFCCC: United Nations Framework Convention
on Climate Change USAID: United States Agency for International
Development USGS: United States Geological Survey USTDA: United States Trade and Development
Agency WANO: World Association of Nuclear
Operators WEC: World Energy Council

E-1
APPENDIX E GLOSSARY
As-spent dollars: expenditures or outlays made in a given fiscal year, before adjustment for inflation. Business-as-usual (BAU): the projected future state of energy and economic variables in the event that current technological, economic, political, and social trends persist. Capacity building: Developing skills and capabilities for energy-technology innovation in the relevant government, private-sector, academic, and NGO institutions. Carbon sequestration: the capture and secure storage of carbon that would otherwise be emitted or remain in the atmosphere, either by (1) diverting carbon from reaching the atmosphere; or (2) removing carbon already in the atmosphere. Examples of the first type are the trapping of CO2 in power plant flue gases, and capturing CO2 during the production of decarbonized fuels. The common approach to the second type is to enhance the ability of soils to absorb CO2 naturally. Clean Energy Technologies (CET): energy supply and end-use technologies that simultaneously: (a) emit substantially lower levels of pollutants and greenhouse gases, and (b) generate substantially smaller and less toxic volumes of solid and liquid waste over their lifecycle. Clean Energy Technology Obligation (CETO): competitive instrument used to bridge the gap between the demonstration phase and widespread deployment of an energy technology. CETO would use auctions (or other instrument) to buy-down the cost of the energy technology to a level that is competitive with market proven technologies. Concessionary financing: a loan offered at below market rates. Cost buy-down: the process of paying the difference in unit cost (price) between an innovative energy technology and a conventional energy technology in order to increase sales volume, thus stimulating cost reductions through manufacturing scaleup and economies of learning throughout the production, distribution, deployment, use, and maintenance cycle. Demonstration Support Facility (DSF): financial mechanism which funds private sector projects designed to show the feasibility of clean energy and energy-efficient technologies in cases where these technologies are not yet commercially viable. Debt swap: a situation in which the lender country or institution erases the debt owed by a borrower country provided that the latter creates social programs, environmental programs (such as “debt for nature” swaps), or other programs and policies. Energy Research, Development, Demonstration and Deployment (ERD3): the linked process by which an energy-supply or energy-end-use technology moves from its conception in theory and in the laboratory to its feasibility testing, its small-scale implementation, and finally its large-scale deployment with long-term market viability.
Powerful Partnerships
E-2
Energy-sector restructuring and reform: encouraging privatization (transfer of ownership from the public- to the private-sector) and market competition in energy supply, while removing subsidies and other distortions in energy pricing and preserving public benefits. Financial mechanism: a mechanism intended to assist the supply of capital available for undertaking an energy technology project, frequently for projects having a specialized purpose (such as the climate change projects targeted by the GEF). Global Environment Facility (GEF): A financial institution that provides grants and concessionary financing to developing countries and economies-in-transition for projects and activities that provide global benefits in four topical areas: climate change; biological diversity; international waters; and stratospheric ozone. The GEF was established for the purpose of implementing agreements stemming from the 1992 U.N. Conference on Environment and Development, including the Framework Convention on Climate Change. The World Bank Group is one of the three implementing agencies for the GEF, together with the United Nations Development Program and the United Nations Environment Program. Greenhouse gases (GHGs): heat-trapping gases in the atmosphere that warm the earth’s surface by absorbing outgoing infrared radiation and re-radiating part of it downward. Water vapor is the most important naturally occurring greenhouse gas, but the principal greenhouse gases whose atmospheric concentrations are being augmented by emissions from human activities are carbon dioxide, methane, nitrous oxide, and halocarbons. Infrastructure: the physical structures and delivery systems necessary to supply energy to end-users. In the case of power plants, the infrastructure is the high-tension wires needed to carry the electricity to consumers; in the case of natural gas, it is the pipeline network; in the case of liquid fuels, it is the fueling stations. InterGovernmental Panel on Climate Change (IPCC): a multilateral scientific organization established by the United Nations Environment Programme (UNEP) and the World Meteorological Organization to assess the available scientific, technical, and socio-economic information in the field of climate change and to assess technical and policy options for reducing climate change and its impacts. OECD (Organization for Economic Cooperation and Development): A multilateral organization of 29 industrialized nations, producing among them two-thirds of the world’s goods and services. The objective of the OECD is the development of social and economic policies and the coordination of domestic and international activities. Public Benefits Fund (PBF): a financial mechanism created to serve the greater public interest by funding programs for environment and public health, services to the poor and disenfranchised, energy technology innovation through the ERD3 pipeline, or other public good that is not accounted for by a restructured energy sector. Tied aid: a method of trade distortion in which one government offers attractive financing (grants, soft loans, etc.) to a second government provided that the aid is used to purchase goods from companies in the originating country. Tied aid can have a leveraging effect such that the recipient country will continue to purchase goods from manufacturers in the originating country even after the financial aid package is exhausted. Since 1992 within the OECD, the use of tied-aid for capital goods is subject to formal challenge when the project in question is commercially viable.

Appendix E: Glossary
E-3
World Bank Group: A multilateral United-Nations-affiliated lending institution, which annually makes available roughly $20 billion in loans to developing countries, mainly but not exclusively for large scale infrastructure projects. The World Bank Group comprises five agencies: the International Bank for Reconstruction and Development, the International Development Association, the International Finance Corporation (IFC), the Multilateral Investment Guarantee Agency (MIGA), and the International Centre for Settlement of Investment Disputes (ICSID). The World Bank Group raises capital from both public sources and financial markets.
INDEX
Index-1
A Acid Rain, ES-2, ES-3, 1-10, 1-21, 2-16, 5-2 Africa, ES-6, 1-6, 1-8, 2-17, 2-18, 2-24, 3-14,
3-15, 3-20, 3-25, 4-6, 4-14, 4-15, 4-25, 5-17 African Development Bank, 2-24, 3-37 Agency for International Development, ES-5,
ES-7 to ES-9, 2-2, 2-5, 2-8 to 2-14, 2-16, 2-19 to 2-21, 2-26, 3-8, 3-11 to 3-13, 3-21, 3-23, 3-26, 3-29, 3-35 to 3-39, 4-10 to 4-12, 4-15, 4-20 to 4-23, 4-29 to 4-31, 5-12, 5-13, 5-22, 6-3, 6-8 to 6-11, 6-14
Agriculture and/or Forestry, 1-13, 1-23, 3-3, 5-2, 5-5, 5-6
Air Pollution, ES-2, ES-13, 1-4, 1-14, 1-25, 2-4, 2-23, 2-25, 3-5, 3-13, 3-17, 4-13, 4-16 to 4-22, 4-25, 4-31, 5-9, 5-16, 5-18, 5-19, 5-22, 5-23, 6-4, 6-18 Haze, ES-3, 1-21 Transboundary, 1-21 Urban, 4-16, 4-31,
Air Quality, 2-27, 4-18, 4-19, 4-21, 4-23, 4-32 Indoor, 4-14 Urban, 2-19, 4-21, 4-23
Anti-trust Policy, 1-2, 1-27, 1-29 Appliances, See End-use Technologies Argentina, 1-15, 2-12, 3-11, 3-23, 5-13, 5-15 Argonne National Laboratory, 5-29 Asia, ES-6, 1-8, 1-10, 1-23, 2-14, 2-17, 2-18,
2-24, 2-25, 3-15, 3-19, 3-20, 3-36, 4-15 to 4-17, 4-22, 5-2, 5-24 Asia Alternative Energy Program, 2-25, 3-36 Asia Pacific Economic Cooperation, 3-41 Asia Sustainable Energy Initiative, 2-14
Asian Development Bank, 2-20, 2-24 Australia, 2-7, 2-17, 4-29 Automobile, See Vehicles: Automobile
B Bangladesh, 3-8, 4-15 Basic Energy Sciences, 1-4, 1-26, 2-9 Battelle, 1-31, 4-5 Battery, 4-17, 4-22, 5-7 Beijing Energy Efficiency Center, 1-15, 3-13,
4-25 Bicycles, 4-17, 4-19, 4-22 Biomass, ES-10, ES-15, 1-5 to 1-7, 1-10, 1-
11, 1-14, 1-24, 2-12, 2-20, 2-21, 3-28, 4-13 to 4-15, 4-31, 5-2 to 5-5, 5-9 to 5-13, 5-18, 5-29, 5-30, 6-5 Biomass Integrated Gasification/Combined
Cycle, See Integrated Gasification/Combined Cycle
Boilers, 4-23 to 4-26, 3-24 Brayton Cycle, 4-26, 4-27, 5-14
Brazil, ES-6, 1-5, 1-6, 1-15, 2-9, 2-18, 2-19, 3-11, 3-12, 3-15, 3-17, 3-22, 3-23, 3-26, 3-28, 4-4, 4-6, 4-8, 4-10, 4-13, 4-16, 4-18, 4-19, 4-24, 5-5 Curitiba, 4-19, 4-23 PROCEL, ES-6, 2-19, 3-12, 3-15
Buildings, ES-1, ES-8, ES-14, 3-13, 3-19, 4-2, 4-5 to 4-13, 4-18, 4-23, 4-26 to 4-30, 4-32, 5-3, 5-4, 6-3 to 6-5, 6-16 Design & Energy Codes, ES-8, 4-10 to 4-13
Bulgaria, 2-13, 3-13 Bulgarian Center for Energy Efficiency, 3-13 Buses, See Vehicles: Buses Business As Usual, ES-9, 1-9 to 1-14, 1-18, 1-
20, 4-29 Buy-down, See Demonstration & Cost Buy-
down
C Canada, 1-18, 2-12, 2-17 Capacity Building, ES-1, ES-4, ES-6, ES-9,
ES-14, 2-2, 2-22, 2-26, 3-11 to 3-17, 3-22, 3-33, 3-42, 4-11, 4-15, 4-28, 6-2, 6-6, 6-8, 6-11, 6-12, 6-16
Capital Investment, 1-13, 3-2, 3-24, 3-33, 3-37, 4-4, 4-19, 5-1
Carbon Dioxide, ES-3, ES-10, ES-11, 1-7, 1-9, 1-11, 1-15, 1-17, 1-18, 1-21, 1-32, 2-12, 2-17, 4-26, 5-16 to 5-24 Intensity, 1-8 to 1-11, 1-30 to 1-32, 5-24
Caribbean, 1-21, 2-8, 2-24, 3-3 Central & South America, ES-6, 1-8, 2-7, 2-8,
2-12, 2-14, 2-17, 2-18, 2-24, 3-3, 3-15, 3-19 to 3-21, 4-18
Central Asian Republics, 3-19, 5-17 Charcoal, 1-5, 4-7, 4-13, 4-14 Chemicals, See Industry: Chemicals Chernobyl, 1-21 Chile, 2-9, 4-18 China, 1-5 to 1-7, 1-15, 1-21, 1-30, 1-31, 2-2,
2-4, 2-7, 2-9, 2-12, 2-13, 2-16, 2-18 to 2-20, 2-24, 3-11, 3-13, 3-14, 3-23, 3-25, 3-27, 3-40, 4-1 to 4-10, 4-14 to 4-26, 4-31, 5-1, 5-5, 5-7, 5-9, 5-10, 5-17, 5-18, 5-19, 5-20
Clathrate Hydrates, ES-15, 5-18, 5-23, 5-30 Clean Coal Technologies, See Coal: Clean
Coal Technologies Clean Development Mechanism, 3-34, 3-37,
6-3 Clean Energy Fund, 2-15 Clean Energy Technology, ES-7, ES-14, 2-16,
3-14, 3-18, 3-22 to 3-29, 3-31 to 3-39, 5-10, 6-2, 6-3

Powerful Partnerships
Index-2
Clean Energy Technology Obligation, ES-7, ES-10, ES-14, 3-18, 3-22, 3-26, 3-29 to 3-32, 3-38 to 3-40, 5-8, 5-12 to 5-15, 6-2, 6-3
Climate Change, ES-2, ES-11, 1-10, 1-14, 1-15 to 1-25, 1-32, 3-28, 3-30, 3-32, 3-37, 5-3, 5-16, 5-21 to 5-24, 5-27, 6-4, 6-9, 6-11
Climate Change Initiative, 6-9 Climate Change Technology Initiative, 2-17 Coal, ES-3, ES-10, 1-6 to 1-14, 2-4, 2-12, 2-
15, 2-18 to 2-20, 2-24, 3-13, 3-29, 4-2, 4-5, 4-25, 4-26, 4-31, 5-1, 5-7, 5-9, 5-16 to 5-23, 5-29, 5-30, 6-4, 6-5 Clean Coal Technologies, 2-12, 2-16, 2-19,
3-35, 5-18 to 5-23 Coal Bed, 5-20, 5-23 Coal Bed Methane, 2-20, 5-17 to 5-23
Codes, Labels, Ratings & Standards, ES-8, ES-14, 2-13, 2-26, 2-27, 3-12, 3-13, 3-18, 3-41, 4-5, 4-9 to 4-13 International Standards, 3-41 Performance Standards, 1-26
Cogeneration, see Combined Heat and Power Colombia, 4-24 Combined Cycle Turbine, See Turbines:
Combined Cycle Combined Heat and Power, ES-1, ES-8, ES-9,
ES-14, 2-12, 2-21, 3-29, 4-26 to 4-31, 5-3, 5-5, 5-17 to 5-22, 6-16
Commercial Fuels, 5-1 Commercialization, ES-4, 1-3, 1-15, 2-2, 2-8,
2-14, 2-25, 3-1, 3-4, 3-5, 3-9, 3-16, 3-30, 4-20, 5-14, 5-22, 5-27, 6-8
Committee on Energy Efficiency Commerce and Trade, 2-12, 2-16, 2-26
Committee on Renewable Energy Commerce and Trade, 2-16, 2-26
Compressed Air Energy Storage, 5-5 to 5-8, 5-13, 5-14
Compressed Natural Gas, 4-17, 4-18, 4-20 Concession, 3-23, 5-8, 5-15 Congress, 2-12, 3-13, 3-17, 3-30, 3-40, 4-28,
4-31, 5-24, 5-27, 5-28, 6-9 to 6-13 Convention on Nuclear Safety, 5-25, 5-29 Cooperative Research and Development
Agreements, 3-5 Cost Buy-down, See Demonstration & Cost Buy-
down Cost Sharing, 1-20 Council on Competitiveness, 2-2, 2-3 Czech Energy Efficiency Center, 3-13, 4-16 Czech Republic, 2-9, 2-13, 3-13, 4-8, 4-16
D Debt Swaps & Debt Relief, 3-17, 3-22 to 3-25
Decarbonization, ES-10, 5-18, 5-19, 5-20 to 5-22
Defense Policy, 1-2, 1-27 Degraded Lands, ES-10, 5-12, 5-13, 6-4 Demand Side Management, 2-13, 3-16, 3-18,
3-22, 4-4, 4-11, 6-2 Demonstration & Cost Buy-down, ES-1, ES-
6, ES-7, ES-14, 2-15, 3-1, 3-4 to 3-10, 3-16, 3-18, 3-20 to 3-23, 3-26 to 3-33, 3-39, 5-3, 5-10 to 5-15, 6-1 to 6-3, 6-10, 6-16
Demonstration Support Facility, ES-7, ES-14, 3-26 to 3-28, 3-39, 3-40, 5-3, 5-12, 6-2, 6-3
Denmark, 3-40, 4-26 Department of Commerce, 2-10, 2-15, 2-26,
3-8, 3-39, 6-8, 6-9 Department of Defense, 2-9 Department of Energy, ES-5 to ES-11, 1-3, 1-
4, 1-18, 1-26, 1-31, 2-9 to 2-14, 2-18, 2-19, 2-26, 3-5, 3-8, 3-12, 3-13, 3-26 to 3-29, 3-35 to 3-39, 4-9 to 4-15, 4-20, 4-21, 4-25, 4-28 to 4-31, 5-5, 5-6, 5-12 to 5-15, 5-18, 5-21 to 5-23, 5-27 to 5-29, 6-8 to 6-12, 6-14
Deployment, Executive Summary (all), 1-2 to 1-4, 1-13 to 1-20, 1-25, 1-26, 2-1, 2-2, 2-5, 2-7, 2-16, 2-20 to 2-27, 3-1 to 3-16, 3-23, 3-27 to 3-29, 3-34 to 3-40, 4-2, 4-3, 4-15, 4-20, 4-30, 5-3, 5-4, 5-10 to 5-16, 5-21, 6-1 to 6-5, 6-8 to 6-12, 6-16
Deregulation, ES-4, 1-27, 3-2, 5-11 Developing Countries, ES-9, ES-10, ES-13, 1-
6, 1-9 to 1-17, 1-20, 1-21, 1-25, 1-26, 1-32, 2-2 to, 2-3, 2-5, 2-7, 2-8, 2-13 to 2-16, 2-19, 2-23 to 2-25, 3-1 to 3-8, 3-15, 3-19, 3-20 to 3-23, 3-26, 3-37, 3-40, 3-41, 4-2 to 4-32, 5-1, 5-3 to 5-11, 5-17 to 5-19, 5-22, 5-30, 6-4, 6-10, 6-11, 6-17
Diesel, See Engines: Diesel Diffusion, 1-17, 2-4, 2-7, 2-17, 3-9, 3-37 Dominican Republic, 2-8
E Eastern Europe, ES-6, 1-10, 1-11, 2-9, 2-12,
2-16 to 2-18, 2-23, 2-24, 3-11, 3-13, 3-15, 4-8, 4-18, 4-26, 5-29
Economies in Transition, 1-20, 4-32, 5-30, 6-18
Efficiency, See Energy Efficiency or Codes, Labels, Ratings & Standards
Efficient End-use Technologies, ES-5, ES-13, 1-3, 2-21, 2-23, 2-24, 3-9, 3-22, Chapter 4 (all), 5-15, 5-30, 6-4, 6-17 Appliances, ES-8, 4-3 to 4-13, 4-32 Refrigerators, See Refrigerators
Electric Power Research Institute, 2-9, 5-5
INDEX
Index-3
Electricity & Power Generation, ES-10, 1-4 to 1-7, 1-13, 1-22, 1-23, 1-31, 2-2 to 2-7, 2-10, 2-12, 2-15, 2-17, 2-19 to 2-24, 2-28, 3-2 to 3-4, 3-12, 3-16 to 3-19, 3-22 to 3-26, 3-30, 4-1, 4-3, 4-8 to 4-10, 4-13, 4-22 to 4-27, 4-30, 5-1, 5-3 to 5-24, 5-27, 5-30
Energy and Environment Training Program, 2-14, 3-11
Energy Conservation Center, Japan, 2-17 Energy Demand, ES-2, 1-9, 2-1, 3-19, 3-31, 4-
1, 4-2, 4-5, 4-6, 4-16, 4-24, 5-2, 6-4, 6-5 Energy Efficiency, ES-6, ES-8, 1-20, 2-2, 2-8,
2-11 to 2-18, 2-20, 2-22, 2-25, 2-26, 3-2, 3-11 to 3-15, 3-18, 3-25 to 3-29, 3-33, 3-36 to 3-41, Chapter 4 (all)
Energy Efficiency Centers, ES-6, 2-13, 3-13, 3-15
Energy Information Administration, 1-5, 1-18, 2-4, 2-19, 2-20, 4-6, 4-27, 4-32, 5-1, 5-2, 5-16, 5-19, 5-24, 5-30
Energy Intensity, ES-3, ES-9, 1-5 to 1-13, 1-18, 1-30 to 1-32, 2-4, 4-5, 4-6, 4-28, 4-29
Energy Partnership Program, 2-14, 3-11, 3-22 Energy Policy Act of 1992, 2-16 Energy Prices, 1-10, 1-25, 1-31, 2-2, 2-3, 3-3,
3-17, 3-22, 3-29, 4-3, 6-9 Energy Sector Management Assistance
Program, 2-25, 3-20 Energy Sector Reform, ES-1, ES-6, ES-7,
Chapter 3 (all), 4-2, 4-6, 4-11, 4-31, 5-22 Energy Sector Reform Initiative, 3-20, ES-14 Energy Service Companies, 2-14, 4-9 Energy Star, ES-8, 4-9, 4-12 Energy Supply Technologies, ES-5, ES-10,
ES-13, 1-1, 1-4, 1-14, 1-20, 3-2, 3-36, Chapter 5 (all), 6-1, 6-4, 6-5, 6-17
Engines Diesel, 4-21, 5-17 Four-stroke, 4-16, 4-17 Two-stroke, 4-16, 4-17, 4-21, 4-32
Enhanced Oil Recovery, 5-20, 5-23 Environmental Costs, See Externalities & Market
Distortions: Environmental Costs Environmental Enterprise Assistance Fund, 3-
11 Environmental Exports Program, 2-15 Environmental Policy & Regulation, 1-2, 1-
27, 2-27, 3-23, 5-4, 5-22 Environmental Protection Agency, ES-5 to
ES-9, 2-13, 2-19, 2-27, 3-5, 3-8, 3-12, 3-13, 3-23, 3-27, 3-35 to 3-39, 4-9 to 4-12, 4-15, 4-20, 4-25, 4-30, 5-23, 6-8 to 6-10, 6-14
Environmental Protection Agency of Taiwan, 4-17
Ethanol, 2-19, 5-5
Europe, 1-19, 2-7, 2-12, 2-16, 2-18, 2-24, 3-31, 4-12, 4-18, 5-11, 5-14, 5-16, 5-17
European Bank for Reconstruction and Development, 2-24, 3-37
European Development Fund, 2-17 European Investment Bank, 2-17 European Union, 2-9, 2-16 to 2-18, 4-29 Evergreen Funds, 3-37 Export Council for Energy Efficiency, 2-9 Export-Import Bank, ES-5, 2-10, 2-15, 2-20,
2-27, 3-8, 3-39, 3-40, 4-31, 6-8, 6-9 Externalities & Market Distortions, ES-6, ES-
14, 1-25, 1-26, 3-2, 3-5, 3-8, 3-9, 3-16, 3-17 to 3-23, 3-35, 4-2 to 4-4, 4-28, 5-10, 6-2 Environmental Costs, ES-7, 1-25, 1-27, 3-
20, 3-22 Price Controls, ES-7, 1-27, 3-20, 3-22 Price Guarantees, 1-26 Subsidies, ES-7, 1-27, 2-21, 2-22, 3-3, 3-10,
3-13, 3-16, 3-18, 3-20, 3-22, 3-23, 3-29, 3-30, 4-2 to 4-4, 4-14, 5-15, 5-26
Unpriced Benefits, 4-3
F Financing, ES-14, 2-5, 2-26, 2-27, 3-28, 3-34,
3-37, 6-16 Finland, 2-17 First-cost, 4-3, 4-9 Fission, ES-1, ES-5, ES-10, ES-11, 1-3, 2-10,
2-12, 2-18, 5-24 to 5-28 Foreign Policy, ES-4, 1-2, 1-27, 1-30 Forestry, See Agriculture and Forestry Former Soviet Union, 1-11, 2-12, 2-16 to 2-
18, 3-13, 4-26, 5-17, 5-19, 5-29 Fossil Fuels, ES-10, 1-3 to 1-18, 1-27, 2-3, 2-
15, 2-17, 2-19, 2-23, 2-24, 3-10, 3-19, 5-1, 5-2, 5-5, 5-8, 5-11, 5-16 to 5-22, 6-5, 6-10
Framework Convention on Climate Change, 1-15 to 1-18, 1-21, 2-22, 3-13, 3-32
Fuel Cells, 2-7, 2-12, 3-2, 4-17, 4-21, 4-30, 5-17, 5-18, 5-20
Fuel Economy, 4-2, 4-16 to 4-18, 4-21, 4-32 Fusion, ES-1, ES-5, ES-10, ES-11, ES-15, 1-
3, 1-4, 2-9 to 2-12, 2-18, 2-23, 5-27 to 5-30
G Gas Research Institute, 2-7 Gasification, 4-14, 5-5, 5-12, 5-18 to 5-22
Oxygen-blown, 5-18, 5-19 to 5-22 Gasoline, 1-5, 2-2, 2-3, 4-16, 4-32 General Agreement on Tariffs and Trade, 1-
28, 3-41 Germany, 1-15, 2-3, 2-9, 2-12, 2-16, 2-17, 2-
18, 4-4, 4-25, 4-29, 5-11, 5-28
Powerful Partnerships
Index-4
Global Environment Facility, ES-7, ES-8, ES-14, 2-20 to 2-25, 3-8, 3-12, 3-13, 3-16, 3-22 to 3-35, 3-40, 4-12, 4-15, 4-20 to 4-23, 4-29, 5-3, 5-10, 5-12 to 5-14, 6-2, 6-3
Global Environment Program, 2-18 Grameen Bank, 3-8, 4-15 Green Lights, 2-13 Greenhouse Gas, See also Carbon Dioxide, 1-
14 to 1-18, 1-21, 2-22, 3-28, 3-32, 5-3, 6-4 GTZ, 4-15 Guatemala, 2-12
H Heavily Indebted Poor Countries, 3-24, 3-25 Hong Kong, 4-19 Human and Institutional Capacity Building,
see Capacity Building Hydrocarbon Emissions, 4-16 Hydroelectric, 1-5, 1-6, 1-11, 2-19, 2-24, 4-
17, 4-22, 4-31, 5-7, 5-13 to 5-16, 5-29, 6-4 Hydrogen, ES-11, ES-15, 1-4, 1-13, 4-21, 5-4,
5-17 to 5-24, 5-30
I Iceland, 5-22 Independent Power Producer, 3-34 India, 1-5 to 1-7, 1-15, 1-30, 2-2, 2-4, 2-7, 2-
9, 2-12 to 2-15, 2-18, 2-20, 2-21, 2-24, 3-11, 3-25, 3-26, 3-35, 3-40, 4-4, 4-6, 4-13, 4-17 to 4-25, 4-31, 5-17, 5-19, 5-23
Indonesia, 2-14, 2-24, 3-25, 4-13, 4-22, 4-24 Industries of the Future, ES-9, 4-28 Industry, ES-9, ES-14, 3-30, 4-4, 4-6, 4-23, 4-
24, 4-28, 4-32, 6-12, 6-16 Chemicals, ES-9, ES-10, 4-23, 4-24, 4-28,
5-5, 5-12, 5-17, 5-19 Iron and Steel, ES-9, 4-4, 4-23 to 4-25, 4-28 Paper, ES-9, 3-8, 4-23 to 4-28, 5-9, 6-6
Institutional Barriers, See Market & Institutional Barriers
Institutional Capacity Building, see Capacity Building
Insurance, 2-15, 2-27, 2-28, 5-6 Integrated Gasification/Combined Cycle, 3-
29, 5-9, 5-19 to 5-22 Biomass, 3-28, 5-19
Integrated Resource Planning, 3-16, 3-18, 3-22 to 3-26, 4-4, 4-11, 6-2
Intellectual Property Rights, ES-4, 1-2, 1-27, 1-28, 6-6, 6-11
Interagency Working Group on Strategic Energy Cooperation, ES-1, ES-6, ES-11, ES-12, 2-16, 6-13, 6-15
Inter-American Development Bank, 2-8, 2-24, 3-37
Interdisciplinary Research, 3-14, 3-15 Intergovernmental Panel on Climate Change,
1-11, 1-14 to 1-19, 1-31, 1-32, 4-4, 4-16 International Atomic Energy Agency, 2-22, 2-
24, 5-25, 5-28, 5-29 International Cogeneration Alliance, 4-31 International Council for Science Unions, 2-
23 International Energy Agency, 1-23, 1-30, 2-3,
2-18, 2-21 to 2-23, 3-25, 4-6 International Finance Corporation, ES-8, 2-9,
2-25, 3-28 to 3-38, 4-13, 4-20, 4-22, 4-29, 5-3, 5-5, 5-10, 5-13
International Geosphere-Biosphere Program, 2-23
International Institute for Applied Systems Analysis, 1-5, 1-9, 1-11, 1-20, 1-30, 1-31, 2-23, 2-27, 3-33, 5-1
International Monetary Fund, 2-20, 3-24 International Nuclear Safety Center, 5-29 International Thermonuclear Experimental
Reactor, 2-9, 2-12, 2-18, 5-27, 5-28, 6-12 International Trade Administration, 2-15 Iron and Steel, See Industry: Iron and Steel Israel, 5-14 Italy, 2-6, 4-18
J Japan, 1-5, 1-6, 1-21, 2-9, 2-12, 2-16 to 2-20,
3-41, 4-4, 4-12, 4-24, 5-11, 5-14, 5-23, 5-26, 5-28
Japan Development Bank, 2-18 Japanese Environment Agency, 2-18
K Kenya, 3-14, 3-35, 4-14, 4-15, 4-19 Kerosene, 4-3, 4-13 Kyoto Protocol, 3-34, 6-11
L Labels, See Codes, Labels, Ratings & Standards Land-use Planning, ES-13, 4-18, 4-19, 4-22,
4-23, 4-32, 6-17 Latin America, See Central & South America Life-cycle Cost, 3-8, 3-36, 4-3, 4-4, 4-8, 5-15,
6-4 Lighting, 2-13, 2-23, 2-25, 3-12, 3-13, 4-1, 4-
6, 4-8, 4-9, 4-11, 4-13, 4-26, 5-4, 5-13, 6-4 Fluorescent, 3-12, 4-26 Incandescent, 4-8
Liquid Fuels, 3-19, 4-14, 5-2, 5-17, 5-21, 6-5 Liquid Petroleum Gas, 4-13, 5-5, 5-9
INDEX
Index-5
Loans & Loan Guarantees, 1-26, 2-9, 2-12, 2-15, 2-20 to 2-28, 3-8, 3-12, 3-18, 3-28, 3-33 to 3-40, 4-3, 4-4, 4-23, 5-10, 5-11, 6-3 Loan Guarantees, 1-26, 2-9, 2-20, 2-26 to 2-
28, 3-39, 6-3
M Malaysia, 3-25, 4-10 Market & Institutional Barriers, ES-9, ES-14,
2-22, 3-8, 3-22, 3-26, 3-31, 3-35, 3-36, 3-41, 4-2 to 4-4, 4-30, 4-31, 5-15, 5-21, 6-2, 6-10
Market Pull, 2-3, 3-11, 4-9 Market Transformation Initiatives, 3-30 Megacities, 4-18 Methane, ES-15, 5-18, 5-20, 5-23, 5-30 Methane Hydrates, See Clathrate Hydrates Mexico, 1-21, 2-12, 2-15, 3-21, 4-9, 4-13, 4-
18, 4-19, 4-24 Micro-credit, 3-4, 3-8, 3-11, 3-39, 4-4, 4-15,
6-2, 6-3 Micro-turbines, See Turbines: Micro-turbines Microenterprise, 2-8 Middle East, 1-6, 1-8, 2-17, 3-19, 5-2, 5-17 Million Solar Roofs Initiative, 5-11 Mongolia, 2-17, 3-14, 5-5, 5-7 Morocco, 3-35 Motorcycle, See Vehicles: Two- and Three-
wheel Multilateral Development Banks, ES-7, ES-8,
ES-14, 2-12, 2-13, 3-3, 3-35 to 3-40, 4-23, 4-31, 6-2, 6-6
N National Energy Strategy, 2-10, 6-9 National Laboratories, ES-12, 1-26, 2-10, 3-
36, 4-11, 4-12, 5-3, 5-13, 6-2, 6-10, 6-14, 6-16
National Renewable Energy Laboratory, 5-9 National Research Council, 1-29, 5-28, 6-12 National Science and Technology Council,
ES-1, ES-11, ES-15, 6-9, 6-13 to 6-15 National Science Board, 1-29, 2-2 National Science Foundation, 2-27 National Security, 1-2, 1-25, 3-17, 3-22, 3-27,
3-41, 4-7, 6-4, 6-5, 6-9 National Security Council, 6-9 Natural Gas, ES-7, ES-10, 1-6 to 1-8, 1-11, 1-
30, 2-7, 2-12, 2-19, 2-20, 2-24, 3-2, 3-19, 3-20, 3-23, 3-33, 4-26, 4-30, 5-2, 5-8, 5-11, 5-14, 5-16 to 5-19, 5-21, 6-5 Grids, ES-7, 3-20 Turbines, See Turbines: Natural Gas-fired
Netherlands, 2-6, 2-17, 4-29 New Sunshine Project, 5-11
Nigeria, 2-18 Non-Fossil Fuel Obligation, 3-29 to 3-31 Non-Governmental Organizations, ES-6, ES-
11, 2-16, 2-21, 2-23, 3-14, 3-15, 3-37, 4-15, 4-31, 6-6, 6-8, 6-13
Non-proliferation, See Nuclear Fuel & Materials: Non-proliferation
North-South, ES-3, ES-13, 1-21, 1-28, 6-18 Norway, 2-3, 2-12, 2-17, 5-23 NOx, See Oxides of Nitrogen Nuclear Energy Agency, 5-29 Nuclear Energy Research Initiative, ES-11,
ES-15, 5-24, 5-27, 5-28, 5-30, 6-3 Nuclear Fuel & Materials, ES-11, ES-15, 2-
12, 5-25 to 5-30 Non-proliferation, ES-2, ES-3, ES-11, ES-
13, 1-2, 1-22, 1-23, 1-30, 2-8, 3-27, 5-2, 5-24 to 5-30, 6-5, 6-18
Nuclear Power, ES-3, ES-11, ES-15, 1-3, 1-5, 1-7 to 1-13, 1-22, 1-23, 1-30, 1-31, 2-12, 2-17, 2-22, 2-24, 5-2, 5-24 to 5-29, 6-10
Nuclear Regulatory Commission, ES-5 Nuclear Safety, 1-21, 2-16, 5-24, 5-29 Nuclear Weapons, ES-2, 1-22, 1-23, 1-30, 5-
24, 5-25, 5-28
O Oceans & Sea-level, ES-2, 1-21, 1-23 Office of Building Technologies, 2-11 Office of Industrial Technologies, 2-12 Office of Management and Budget, ES-12, 6-
9, 6-15 Office of Science and Technology Policy, 6-9 Office of Technology Assessment, 3-13, 3-22,
4-1, 4-8, 4-12, 4-13, 4-16, 4-17, 4-24 Oil & Petroleum, ES-1, ES-2, ES-13, 1-6, 1-
16, 1-18, 1-22, 1-32, 2-4, 2-8, 2-12, 2-15, 2-19, 5-8, 5-18, 5-19, 5-21, 5-30, 6-5, 6-18
Oil & Gas Environmental Forums, 2-12 Organization for Economic Cooperation and
Development, 1-9 to 1-13, 1-20, 1-21, 2-5, 2-16 to 2-19, 2-22, 3-3, 3-15, 3-40, 4-8, 4-12, 4-16, 4-18, 4-24, 4-29, 5-29
Organization of Petroleum Exporting Countries, 1-25
Overseas Private Investment Corporation, ES-5, ES-8, ES-14, 2-10, 2-15, 2-20, 3-8, 3-35, 3-37 to 3-39, 4-3, 6-8
Oxides of Nitrogen, ES-3, 1-14, 4-21, 4-31, 6-4
Oxides of Sulfur ES-3, 1-10, 3-23, 6-4,
P Pacific Northwest National Laboratory, 4-5,
5-29
Powerful Partnerships
Index-6
Pakistan, 1-30, 2-24, 4-22 Paper, See Industry: Paper Particulate Matter, ES-3, 1-10, 1-20, 1-21, 4-
15, 4-17, 4-21, 4-22, 4-31, 4-32, 5-2, 5-9, 6-4
Partnership for a New Generation of Vehicles, 4-17, 6-12
Pay-as-you-drive Insurance, 4-18 Persian Gulf, 1-16, 5-2, 5-4, 5-16, 5-17, 5-21 Peru, 2-12 Petroleum, See Oil & Petroleum Philippines, 2-12, 2-14, 2-15, 2-24, 3-25, 4-
10, 4-13, 4-23 Photovoltaics, 2-6, 2-8, 2-12, 2-20, 3-8, 3-14,
3-23, 3-33, 3-35, 5-2, 5-4 to 5-6, 5-9, 5-11, 5-13, 5-15
Pipelines, ES-7, ES-11 to ES-13, 2-4, 2-12, 3-1, 3-4, 3-5, 3-8, 3-10, 3-19, 3-20, 3-23, 3-29, 3-34, 3-36, 3-39, 3-40, 3-42, 4-14, 5-2, 5-17, 5-30, 6-1, 6-2, 6-8, 6-10 to 6-14, 6-17
Poland, 2-13, 2-25, 3-13, 4-4, 4-6, 4-8, 4-18, 4-26
Policy Assistance, See Technical & Policy Assistance
Polish Foundation for Energy Efficiency, 3-13 Pollution-control Technologies, 2-18, 2-19 Pollution Costs, See Externalities & Market
Distortions: Environmental Costs Population, 1-5, 1-7, 1-9, 1-11, 1-14, 3-24, 4-
1, 4-7, 4-16 to 4-19, 5-1, 5-7, 5-9, 5-17, 6-7 Portfolio Standards, 1-26, 3-9, 3-17, 3-22, 3-
36, 6-1 Power Generation, See Electricity & Power
Generation Pre-competitive, ES-9, 2-9, 2-23, 4-28, 4-29,
5-3, 5-22, 5-23 Research & Development, ES-9, 4-28
Price Controls, See Externalities & Market Distortions
Price Guarantees, See Externalities & Market Distortions
Primary Energy, 1-5 to 1-8, 1-11, 1-12, 1-31, 2-3, 4-7, 4-23, 4-32, 5-8, 5-24, 5-25, 5-30, 6-4
Private-sector, ES-1, ES-3 to ES-12, 1-2 to 1-4, 1-24 to 1-27, 2-1 to 2-6, 2-9, 2-13, 2-18 to 2-27, 3-1 to 3-9, 3-12 to 3-14, 3-19, 3-26 to 3-28, 3-30, 3-33 to 3-38, 4-9, 4-17, 4-20, 4-28 to 4-30, 5-3, 5-12, 5-13, 5-21, 5-22, 5-24, 5-29, 6-1, 6-2, 6-5, 6-8, 6-13, 6-15, 6-16
Privatization, ES-4, 1-27, 2-4, 2-6, 2-7, 2-20, 2-21, 3-2, 3-3, 3-16, 3-19, 3-22, 3-26, 6-5
PROCEL, See Brazil: PROCEL Production tax credits, ES-14, 1-26, 3-22, 3-
27, 3-28, 6-3
Public Benefits Fund, ES-7, 3-16 to 3-20, 3-22 to 3-25, 3-28, 3-30, 5-3, 6-2, 6-3
Public Goods, ES-6, ES-13, 1-25, 1-27, 3-8, 3-20, 6-17
Public Transportation, See also Transportation, 4-18, 4-19, 4-22, 4-23 Mass Transit, 4-16, 4-18, 4-19
R Radioactive Waste Management, ES-11, 5-24,
5-27 RAND, ES-5, 2-9, 2-10, 2-11 Rankine Cycle, 4-26, 4-27 Ratings, See Codes, Labels, Ratings & Standards Refrigerators, 1-31, 2-13, 3-12, 3-27, 4-6 to 4-
10, 6-4 Regional Development Banks, 2-23, 3-15, 3-
21, 3-26, 4-12, 4-15 Renewable Energy, 2-8, 2-12, 2-14, 2-22, 2-
25, 3-35, 5-13, 5-14, 6-10 Renewable Energy and Energy Efficiency
Fund, 2-25, 3-35 Renewable Energy Project Support Offices, 2-
14 Renewable Energy Resource Assessments, 5-
13 Renewable Energy Technologies, ES-10, ES-
15, 1-3, 2-8, 2-12, 2-17, 2-18, 2-23, 2-26, 3-2, 3-7, 3-29, 3-30, 3-35, 5-2 to 5-16, 6-16 Hybrid Systems, ES-8, ES-15, 4-20, 4-21,
5-13, 5-15 Renewable Portfolio Standard, 3-26, 3-29, 3-
30, 5-14 Restructuring, ES-4, ES-6, ES-12, 1-3, 1-27,
2-4 to 2-7, 2-21, Chapter 3 (all), 4-2, 4-23, 4-28, 4-30, 4-31, 5-15, 5-24, 6-2, 6-17
Rural Development, ES-10, 5-11, 5-13 Rural Energy, 3-18, 3-22, 3-23, 5-13 Russian Center for Energy Efficiency, 3-13 Russian Federation, 2-9, 2-12, 2-21, 3-13, 4-
10, 4-24, 5-28, 5-29
S Sequestration, ES-10, ES-11, ES-15, 1-7, 1-9,
1-11, 2-17, 2-22, 3-37, 5-13, 5-18, 5-19, 5-20 to 5-23, 6-3
Siberia, 3-19, 4-4, 5-17 Solar Development Corporation, 2-8, 3-35 Solar-thermal Electric, ES-10, ES-15, 2-18, 5-
4, 5-11 to 5-15, 5-30 Soluz Dominicana, 2-8 South Africa, 1-5, 4-25, 5-28 South America, See Central & South America South Korea, 1-15, 2-4, 2-9, 2-12, 2-13, 2-24,
4-6, 4-9, 4-25, 5-28

INDEX
Index-7
South-South, 4-15 SOx, See Oxides of Sulfur Sri Lanka, 3-26 Standards, See Codes, Labels, Ratings &
Standards State Department, 5-29 Stove, ES-14, 1-14, 3-14, 4-11 to 4-15, 4-32
Biomass, 4-13, 4-14 Wood, 4-14, 6-4
Strategic Energy Cooperation Fund, ES-1, ES-12, ES-15, 6-14 to 6-16
Subsidies, See Externalities & Market Distortions
Sustainable Development, ES-2, 1-1, 1-30, 2-16, 3-37
Sustainable Energy Centers, 3-14, 3-15 Sustainable Transport, 2-22, 4-20 Synthesis Gas, ES-10, 5-17 to 5-21
T Taiwan, 3-41, 4-10, 4-17, 4-18 Tata Energy Research Institute, 2-20 Taxes, Incentives, Credits, & Tax Policy, 1-2,
1-26 to 1-29, 2-3, 3-17, 3-22, 4-3, 4-9, 4-18, 5-6 Production Tax Credits, See Production Tax
Credits Technical & Policy Assistance, ES-7, ES-8, 2-
12, 2-15, 2-17, 2-21, 2-24 to 2-26, 3-17, 3-18, 3-20 to 3-22, 3-28, 3-34 to 3-39, 4-4, 4-11, 4-12, 4-28, 4-30
Technology Cooperation Agreement Pilot Project, 2-13, 3-11
Technology Push, 3-11, 4-9 Technology Roadmaps, ES-9, ES-14, 4-28 Thailand, 2-9, 2-13, 2-24, 3-11, 4-17, 4-18, 4-
22 Tied Aid, ES-7, 2-12, 2-27, 3-26 to 3-28, 3-
32, 3-40, 5-10, 6-4 Capital Projects Fund, 3-40 Consultations Group, 3-40
Trade and Development Agency, ES-5, ES-7, 2-10, 2-12, 2-15, 2-16, 3-8, 3-23, 3-24, 3-35 to 3-39, 6-8, 6-9
Trade Barriers, 1-28, 3-41 Trade Policy, 1-2, 1-27, 1-29, 2-28, ES-4 Trade Promotion Coordinating Council, 2-16 Traditional Fuels, 1-5, 4-6, 5-1 Traffic Congestion, 4-18, 4-19, 4-23 Training, ES-6, ES-8, ES-12 to ES-15, 1-26,
2-8, 2-10, 2-12, 2-13, 2-16, 2-17, 2-21, 2-23, 2-26 to 2-28, 3-6, 3-11 to 3-17, 3-21, 3-35, 4-9 to 4-12, 4-23, 4-28, 4-29, 6-5, 6-14
Transaction Costs, 2-22, 3-3, 3-5, 3-8, 3-18, 3-28, 3-33 to 3-39, 4-3, 5-10, 5-15, 6-3, 6-6, 6-10
Transmission and Distribution, 2-16, 2-20, 3-2, 3-12, 4-30, 5-2
Transportation, See also Public Transportation, ES-14, 4-6, 4-16, 4-20, 4-22, 4-32, 6-16 Urban, See also Mass Transit, 2-24, 4-18, 4-
19, 4-32 Turbines, 3-33, 4-26, 4-27
Combined Cycle, 3-19, 4-27, 5-17, 5-19 Micro-turbines, 2-7, 3-23 Natural Gas-fired, 2-7, 2-12, 3-2, 3-33, 4-
26, 4-27, 4-30, 5-14, 5-17 Steam, 4-26, 5-17 Wind, See Wind: Turbines
Two- and Three-wheel Vehicles, See Vehicles: Two- and Three-wheel
U Uganda, 3-24 Ukraine, 2-13, 3-13, 4-8 Unbundling, 3-16, 3-22 United Kingdom, 3-26, 3-29, 3-30, 3-31, 4-29 United Nations, 1-3, 1-11, 1-17, 2-1, 2-20, 2-
22 to 2-24 Conference on Environment and Development (UNCED), 2-22, 2-23 Development Program (UNDP), 2-20, 2-22,
2-24, 2-25, 6-2, 6-3 Environment Program (UNEP), 1-17, 2-22,
2-24 Universities, 2-6, 2-21, 3-37, 4-15, 6-2, 6-16 Urban Sprawl, 4-18, 4-19 Urbanization, ES-13, 4-11, 6-17 US-Asia Environmental Partnership, 3-11 US-Japan Initiative on Deregulation and
Competition, 3-41 US & Foreign Commercial Service, 2-15, 2-
26 US Energy Association, 2-9, 2-14 US Geological Survey, 5-13, 5-23 US Trade Representative, 2-28
V Vehicles, 4-20, 5-22, 6-3
Automobile, 4-16, 5-20 Buses, 4-21 Clean, Hybrid, and Alternative-fuels, ES-8,
ES-14, ES-15, 4-20, 4-21, 5-13, 5-15 Two- and Three-wheel, 4-16 to 4-21, 4-32
Venezuela, 2-12 Vision 21, ES-10, 5-18, 5-21
Powerful Partnerships
Index-8
W Western Hemisphere, 2-14 Wind, ES-10, 1-5, 1-11, 1-19, 2-8, 2-9, 2-12,
2-15, 2-18, 2-20, 3-14, 3-23, 3-33, 3-40, 5-2 to 5-15 Turbines, 1-19, 2-15, 3-14, 3-40, 5-2 to 5-7
World Bank, ES-7, ES-8, 1-5, 1-8, 2-1, 2-4, 2-8, 2-9, 2-12, 2-18, 2-20 to 2-25, 3-8, 3-12, 3-13, 3-20 to 3-38, 4-4, 4-6, 4-12, 4-15, 4-20, 4-22, 4-23, 4-29, 4-31, 5-3, 5-13, 5-22, 6-2, 6-3
World Energy Council, 1-5, 1-8, 1-9, 1-11, 1-12, 1-20, 1-30, 1-31, 2-14, 2-27, 3-1, 3-33, 4-32, 5-1, 5-4, 5-15, 5-16
World Meteorological Organization, 1-17