powerhouse panel: using data to improve offers, product lines & partnerships
TRANSCRIPT


POWERHOUSE PANEL:
Using Data to Improve Offers, Product Lines, and Partnerships
WHO WE ARE …• Joe Devanny Vice President, US Database
Marketing/Operations, Readers Digest• Kevin Sacher President, North America,
American Mint• Steve Schlumpf, Vice President, Marketing,
Haband, an Orchard Brands Company• Rob Reger, SVP, Epsilon Targeting

WHAT WILL YOU LEARN?BEYOND BRAINSTORMING
How Haband, American Mint and Reader’s Digestsought to boost their ROI on new, customer-targetedoffers, products and partnerships.

WHAT WILL YOU LEARN?BEYOND RFM
• How did they determine RELEVANCY?• How did they determine ANALYSIS TOOLS?• How did they determine ACTIONABILITY?
• How can YOU employ the same methodology?

3 PROBLEMS TO SOLVE1. What new, customer-targeted offers, products and
partnerships should we explore?2. How do we employ ROI-driven customer
segmentation practices to get the appropriate offer, at the right time, with the right product, to the most receptive customer?
3. Future focus – how do we identify and develop the best new opportunities for overall business growth and profitability.
STEP 1: NEEDS ASSESSMENTCommon to all 3 companies• “We need to expand growth BEYOND our ‘traditional’
and historical business model.”• Why?
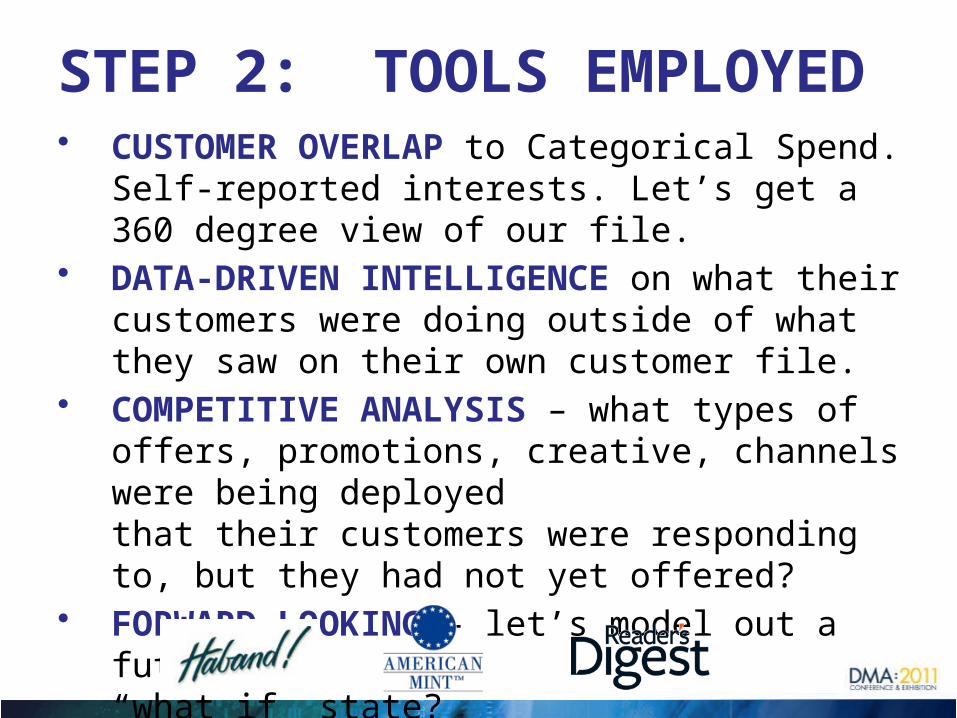
STEP 2: TOOLS EMPLOYED• CUSTOMER OVERLAP to Categorical Spend. Self-reported
interests. Let’s get a 360 degree view of our file.• DATA-DRIVEN INTELLIGENCE on what their customers
were doing outside of what they saw on their own customer file.
• COMPETITIVE ANALYSIS – what types of offers, promotions, creative, channels were being deployed that their customers were responding to, but they had not yet offered?
• FORWARD LOOKING – let’s model out a future “what if” state?

STEP 3: ANALYSISWhat do we now know about our customersthat we did not before? How do we determineif it is ACTIONABLE?
SweepstakesHealthShoes/HardgoodsFundraisingYounger Audience Focus
SupplementsPetsFundraisingPublishingCoffee Continuity
JewelryCollectiblesSweep-No’s Buying PatternsHealth/Insurance

HABAND CUSTOMER TOP CATEGORY PENETRATION /SPEND
HOUSEHOLD PENETRATION DOLLAR SPENDING ALLOCATION
% Client % Alliance %
Client % Alliance
HH Buying HH Buying INDEX HH $$ Spent HH $$ Spent INDEX
Haband Female App Mailer - 0 to 24 mo 10.0% N/A N/A2 Low-Ticket Female Apparel 90.6% 7.1% 1,285 68 Discount Domestic Merchandise 6.7% 0.9% 75168 Discount Domestic Merchandise 51.1% 5.0% 1,021 69 Senior Health Hardgoods 2.6% 0.4% 72543 Low-Ticket Gifts & Merchandise 47.7% 12.3% 388 2 Low-Ticket Female Apparel 14.6% 2.2% 66677 Magazines 30.2% 8.2% 368 15 Low- Mid-Ticket Jewelry 0.5% 0.1% 529
8Low- Mid-Ticket Male & Female Apparel 24.4% 3.7% 665 52 Books 2.7% 0.6% 482
69 Senior Health Hardgoods 23.6% 1.4% 1,650 70 Vitamins & Supplements 3.9% 0.9% 4265 Low-Ticket Male Apparel 21.2% 4.2% 507 74 Collectibles – Metal 0.5% 0.1% 38452 Books 20.3% 3.1% 646 53 Music 0.6% 0.2% 33479 FD Medical Research 19.0% 3.7% 514 1 Large-Size Female Apparel 4.8% 1.6% 3091 Large-Size Female Apparel 16.5% 2.6% 628 76 Men's Supplements 0.1% 0.0% 30485 B2B Office Supplies/Equipment 15.0% 22.5% 67 67 Collectibles 1.2% 0.4% 30361 Specialty Foods & Spices 13.3% 3.1% 424 26 Country Home Decor & Gifts 0.7% 0.2% 29613 Intimate Apparel & Undergarments 12.8% 3.1% 418 5 Low-Ticket Male Apparel 2.3% 0.9% 2653 Mid-Ticket Female Apparel 12.6% 8.2% 153 43 Low-Ticket Gifts & Merchandise 7.0% 2.7% 26170 Vitamins & Supplements 11.0% 1.6% 705 77 Magazines 1.7% 0.7% 24634 Low- Mid-Ticket Beauty & Spa 10.1% 3.3% 303 54 Video 0.6% 0.2% 23972 FD Misc Non-Profit/Fundraising 8.6% 1.8% 469 38 Home Organization & Gadgets 0.3% 0.2% 21267 Collectibles 8.4% 1.5% 554 61 Specialty Foods & Spices 2.2% 1.1% 21030 Kitchen Accessories & Decor 8.2% 3.7% 222 79 FD Medical Research 1.1% 0.6% 18880 FD Environmental 8.2% 2.2% 371 48 Seeds, Bulbs, & Live Plants 0.3% 0.2% 177

HOUSEHOLD PENETRATION DOLLAR SPENDING ALLOCATION
% Client % Alliance %
Client % Alliance
HH Buying HH Buying INDEX HH $$ Spent HH $$ Spent INDEX
Haband Female App Mailer - 0 to 24 mo 10.0% N/A N/A92 B2B Tools & Agriculture 0.5% 0.8% 71 92 B2B Tools & Agriculture 0.2% 1.1% 1749 Woodworking Supplies 0.5% 0.5% 92 9 High-Ticket Male & Female Apparel 0.5% 3.0% 1690 B2B Uniforms 0.4% 0.5% 87 89 B2B Ad Specialty 0.2% 1.3% 1617 Teen Apparel & Shoes 0.3% 1.3% 23 35 Recreational & Outdoor 0.6% 3.9% 15
83 B2B High Tech 0.3% 0.6% 42 7 High-Ticket Male Apparel 0.3% 2.1% 1546 Female Activewear 0.3% 0.9% 29 24 High-Ticket Home Decor & Gifts 0.2% 1.2% 1455 Wine & Wine Accessories 0.2% 0.2% 135 17 Teen Apparel & Shoes 0.0% 0.3% 1284 B2B Commercial/Industry/Safety 0.2% 0.9% 23 88 B2B Cards/Stationery 0.0% 0.2% 1162 Professional Business Merchandise 0.2% 0.2% 83 4 High-Ticket Female Apparel 0.3% 3.0% 1187 B2B Food Gifts 0.2% 0.2% 76 46 Female Activewear 0.0% 0.5% 931 High-Ticket Bed, Bath, & Linens 0.2% 0.3% 57 18 Children's Apparel & Shoes 0.1% 1.4% 940 Audio/Visual Electronics 0.1% 0.2% 70 83 B2B High Tech 0.1% 0.9% 788 B2B Cards/Stationery 0.1% 0.2% 44 94 B2B HR/Training 0.0% 0.3% 594 B2B HR/Training 0.1% 0.5% 15 25 Modern/Contemporary Decor & Gifts 0.2% 4.9% 582 B2B Miscellaneous 0.0% 0.1% 24 84 B2B Commercial/Industry/Safety 0.1% 2.0% 395 Insurance/Warranty/Finance 0.0% 0.0% 55 82 B2B Miscellaneous 0.0% 0.3% 386 B2B Seminars 0.0% 0.5% 4 86 B2B Seminars 0.0% 0.4% 2
HABAND CUSTOMER BOTTOM CATEGORY PENETRATION /SPEND
HOUSEHOLD PENETRATION DOLLAR SPENDING ALLOCATION
% Client % Alliance %
Client % Alliance
HH Buying HH Buying INDEX HH $$ Spent HH $$ Spent INDEX
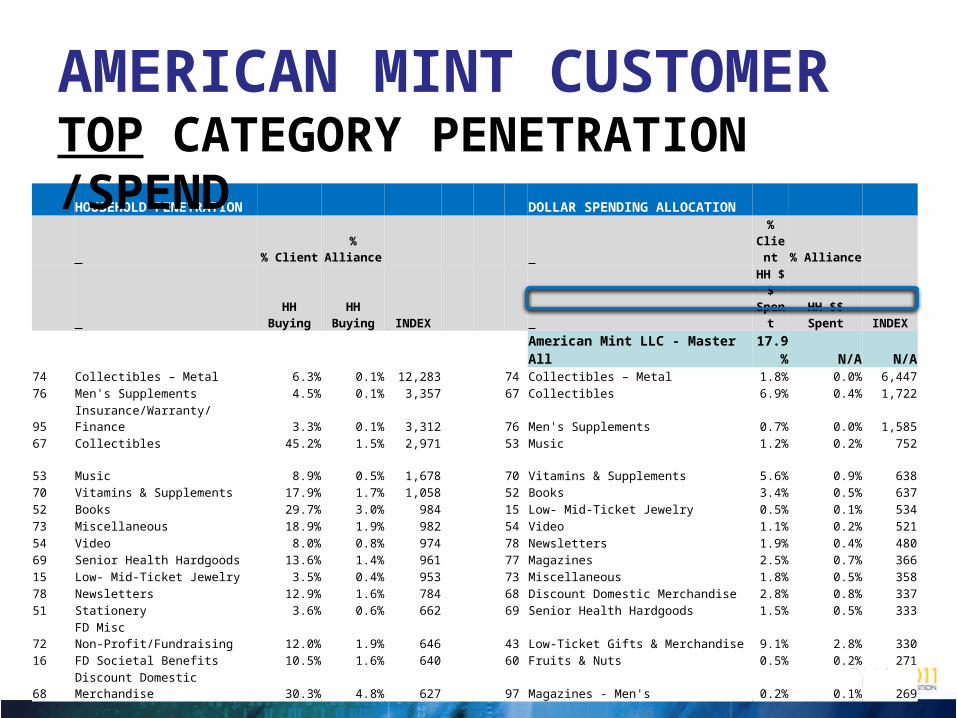
American Mint LLC - Master All 17.9% N/A N/A74 Collectibles – Metal 6.3% 0.1% 12,283 74 Collectibles – Metal 1.8% 0.0% 6,44776 Men's Supplements 4.5% 0.1% 3,357 67 Collectibles 6.9% 0.4% 1,72295 Insurance/Warranty/Finance 3.3% 0.1% 3,312 76 Men's Supplements 0.7% 0.0% 1,58567 Collectibles 45.2% 1.5% 2,971 53 Music 1.2% 0.2% 752
53 Music 8.9% 0.5% 1,678 70 Vitamins & Supplements 5.6% 0.9% 63870 Vitamins & Supplements 17.9% 1.7% 1,058 52 Books 3.4% 0.5% 63752 Books 29.7% 3.0% 984 15 Low- Mid-Ticket Jewelry 0.5% 0.1% 53473 Miscellaneous 18.9% 1.9% 982 54 Video 1.1% 0.2% 52154 Video 8.0% 0.8% 974 78 Newsletters 1.9% 0.4% 48069 Senior Health Hardgoods 13.6% 1.4% 961 77 Magazines 2.5% 0.7% 36615 Low- Mid-Ticket Jewelry 3.5% 0.4% 953 73 Miscellaneous 1.8% 0.5% 35878 Newsletters 12.9% 1.6% 784 68 Discount Domestic Merchandise 2.8% 0.8% 33751 Stationery 3.6% 0.6% 662 69 Senior Health Hardgoods 1.5% 0.5% 33372 FD Misc Non-Profit/Fundraising 12.0% 1.9% 646 43 Low-Ticket Gifts & Merchandise 9.1% 2.8% 33016 FD Societal Benefits 10.5% 1.6% 640 60 Fruits & Nuts 0.5% 0.2% 27168 Discount Domestic Merchandise 30.3% 4.8% 627 97 Magazines - Men's 0.2% 0.1% 269
AMERICAN MINT CUSTOMER TOP CATEGORY PENETRATION /SPEND

HOUSEHOLD PENETRATION DOLLAR SPENDING ALLOCATION
% Client % Alliance %
Client % Alliance
HH Buying HH Buying INDEX HH $$ Spent HH $$ Spent INDEX
American Mint LLC - Master All 17.9% N/A N/A24 High-Ticket Home Decor & Gifts 0.8% 1.3% 64 92 B2B Tools & Agriculture 0.2% 1.2% 207 High-Ticket Male Apparel 1.5% 2.4% 63 24 High-Ticket Home Decor & Gifts 0.2% 1.2% 1920 Children's Merchandise-Ages 0-6 1.6% 2.5% 63 29 Fine Furnishings 0.3% 1.7% 1921 Children's Merchandise-Ages 7+ 1.4% 2.4% 59 21 Children's Merchandise-Ages 7+ 0.2% 1.0% 18
31 High-Ticket Bed, Bath, & Linens 0.2% 0.3% 58 91 B2B Furniture 0.1% 0.5% 1783 B2B High Tech 0.3% 0.6% 55 31 High-Ticket Bed, Bath, & Linens 0.0% 0.2% 1729 Fine Furnishings 0.6% 1.1% 55 17 Teen Apparel & Shoes 0.1% 0.4% 139 High-Ticket Male & Female Apparel 2.5% 5.0% 51 9 High-Ticket Male & Female Apparel 0.4% 3.3% 1335 Recreational & Outdoor 3.2% 6.7% 48 35 Recreational & Outdoor 0.4% 3.8% 1084 B2B Commercial/Industry/Safety 0.3% 0.9% 33 88 B2B Cards/Stationery 0.1% 0.9% 1088 B2B Cards/Stationery 0.5% 1.7% 31 4 High-Ticket Female Apparel 0.4% 4.0% 1017 Teen Apparel & Shoes 0.4% 1.4% 31 46 Female Activewear 0.0% 0.5% 94 High-Ticket Female Apparel 1.1% 3.7% 31 18 Children's Apparel & Shoes 0.1% 1.4% 846 Female Activewear 0.3% 1.0% 27 83 B2B High Tech 0.1% 0.8% 618 Children's Apparel & Shoes 0.8% 2.9% 27 94 B2B HR/Training 0.0% 0.3% 594 B2B HR/Training 0.1% 0.5% 23 25 Modern/Contemporary Decor & Gifts 0.2% 5.2% 425 Modern/Contemporary Decor & Gifts 0.8% 3.8% 20 84 B2B Commercial/Industry/Safety 0.1% 2.0% 482 B2B Miscellaneous 0.0% 0.1% 12 86 B2B Seminars 0.0% 0.3% 286 B2B Seminars 0.0% 0.4% 4 82 B2B Miscellaneous 0.0% 0.2% 1
AMERICAN MINT CUSTOMER BOTTOM CATEGORY PENETRATION /SPEND
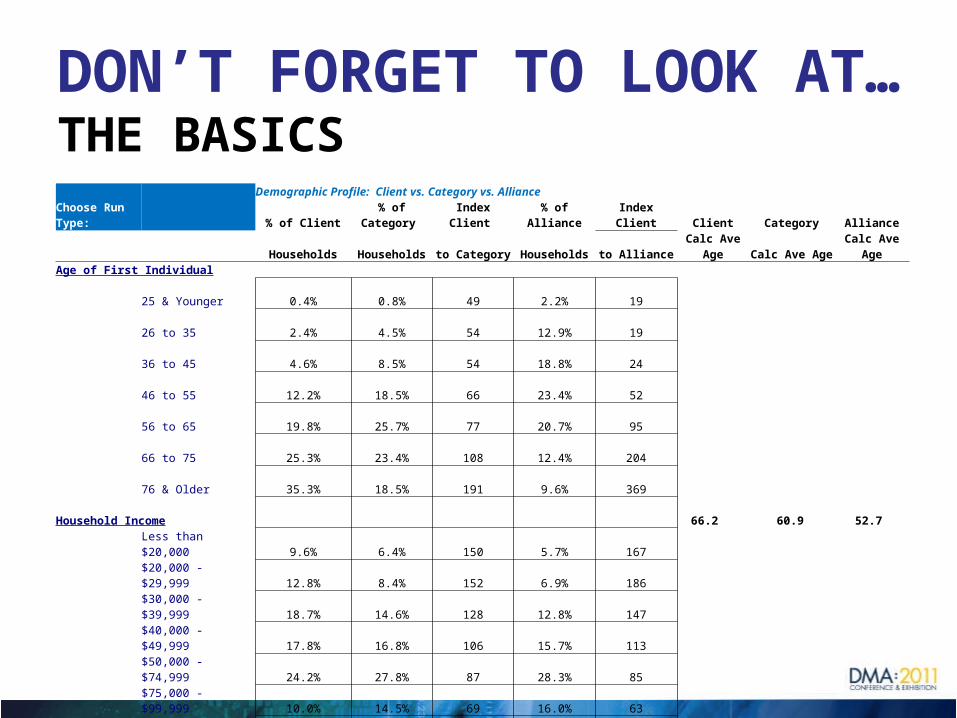
DON’T FORGET TO LOOK AT…THE BASICS
Demographic Profile: Client vs. Category vs. AllianceChoose Run Type: % of Client % of Category Index Client % of Alliance Index Client Client Category Alliance
Households Households to Category Households to Alliance Calc Ave Age Calc Ave Age Calc Ave AgeAge of First Individual
25 & Younger 0.4% 0.8% 49 2.2% 19 0.1 0.2 0.5 26 to 35 2.4% 4.5% 54 12.9% 19 0.7 1.4 3.9 36 to 45 4.6% 8.5% 54 18.8% 24 1.9 3.4 7.6 46 to 55 12.2% 18.5% 66 23.4% 52 6.1 9.3 11.8 56 to 65 19.8% 25.7% 77 20.7% 95 12.0 15.6 12.5 66 to 75 25.3% 23.4% 108 12.4% 204 17.9 16.5 8.7 76 & Older 35.3% 18.5% 191 9.6% 369 27.5 14.4 7.5
Household Income 66.2 60.9 52.7 Less than $20,000 9.6% 6.4% 150 5.7% 167$20,000 - $29,999 12.8% 8.4% 152 6.9% 186$30,000 - $39,999 18.7% 14.6% 128 12.8% 147$40,000 - $49,999 17.8% 16.8% 106 15.7% 113$50,000 - $74,999 24.2% 27.8% 87 28.3% 85$75,000 - $99,999 10.0% 14.5% 69 16.0% 63$100,000 - $124,999 4.4% 7.0% 63 8.5% 51$125,000 and Greater 2.6% 4.5% 57 6.0% 43
Gender* Male 78.2% 77.3% 101 42.3% 185Female 21.8% 22.7% 96 57.7% 38
Home Value Less than $50,000 3.6% 2.4% 150 2.4% 152$50,000 - $99,999 25.2% 18.8% 134 16.0% 157$100,000 - $149,999 26.8% 23.7% 113 21.2% 127$150,000 - $199,999 15.7% 16.3% 96 15.8% 99$200,000 - $249,999 9.0% 10.8% 84 11.0% 82$250,000 - $299,999 5.7% 7.2% 78 7.8% 72$300,000 - $399,999 6.8% 9.6% 71 10.8% 63$400,000 - $499,999 3.2% 4.9% 66 5.7% 56$500,000 and Greater 4.0% 6.3% 64 9.4% 43

DON’T FORGET TO LOOK AT…THE BASICS
Demographic Profile: Client vs. Category vs. AllianceChoose Run Type: % of Client % of Category Index Client % of Alliance Index Client Client Category Alliance
Households Households to Category Households to Alliance Calc Ave Age Calc Ave Age Calc Ave AgeLength at Residence
Less than 2 years 9.7% 9.9% 98 16.2% 602 to 5 years 21.2% 21.1% 100 26.6% 806 to 14 years 31.3% 33.0% 95 33.3% 9415 plus years 37.8% 36.0% 105 23.9% 158
Marital Status Married 78.1% 83.2% 94 85.3% 92Single 21.9% 16.8% 130 14.7% 149
First Individual Occupation Professional / Technical 5.3% 12.1% 44 20.4% 26Managerial 7.9% 11.2% 71 12.5% 63Sales / Service 5.9% 6.8% 88 8.7% 68White Collar 1.7% 2.9% 57 4.1% 40Craftsman / Blue Collar 12.8% 15.5% 83 14.3% 90Student 3.9% 5.6% 70 8.1% 48Home Maker 34.1% 23.2% 147 18.8% 182Retired 26.2% 19.9% 131 9.7% 270Business Owner 2.2% 2.8% 79 3.5% 63
Presence of Children Known to have Children 25.8% 27.2% 95 25.0% 103
1 Child 67.9% 65.1% 104 57.6% 1182 Children 17.0% 17.2% 99 18.8% 903+ Children 15.1% 17.7% 86 23.6% 64
Age of Children Present Age 0 - 2 17.4% 18.3% 95 18.9% 92Age 3 - 5 18.3% 18.1% 101 19.5% 94Age 6 - 10 22.6% 23.4% 97 26.2% 86Age 11 - 15 26.3% 25.7% 102 23.1% 114Age 16 - 17 15.4% 14.5% 107 12.4% 125
Computer Owners Known to have computer 50.0% 43.0% 116 27.3% 183
Pet Owners Known to have a dog 29.9% 21.1% 142 10.8% 278Known to have a cat 23.2% 16.2% 144 7.9% 295

RDA – PROMOTE NEW PRODUCTS TO EXISTING RDA CUSTOMERS LEVERAGING NON-RDA PURCHASE ACTIVITY
RDA Customer Group - RANK OF CATEGORY BY FILE
ABACUS CATEGORIESMag Only
BHE NeversMag Only BHE Evers
Age 35-54
BHE Payers < 12 mo
BHE Payers > 12 mo
Online Sweeps Players
TL - Ab Circle Pro
TL - Paid L1Y
TL - Paid 13-24M
TOTAL FILE SIZE (HH) 1,901,551 2,060,863 15,885,200 687,500 11,562,982 1,032,217 453,355 997,170 1,507,146Men's Supplements 30 1 85 3 1 10 1 3 6Music 3 3 52 1 3 5 38 2 2Collectibles - Metal 26 9 69 2 12 6 2 1 1FD Societal Benefits 10 5 79 10 4 32 68 5 7Home Organization & Gadgets 7 12 44 12 9 14 6 8 8Newsletters 11 4 73 7 5 2 17 9 15Books 16 10 56 5 2 4 20 16 16Magazines 2 2 32 4 11 1 41 31 20Senior Health Hardgoods 20 7 84 8 6 51 27 10 17Discount Domestic Merchandise 4 8 64 13 7 15 26 12 12Stationery 9 6 70 15 8 26 69 17 11Video 29 17 22 6 14 12 29 4 3Vitamins & Supplements 42 11 81 9 10 17 4 30 33Country Home Décor & Gifts 5 18 27 19 15 18 14 13 9Health & Wellness 22 14 38 11 13 7 5 19 14Collectibles 18 19 37 14 24 22 21 6 4Large-Size Female Apparel 13 28 14 28 25 3 31 11 10Arts & Crafts 6 23 23 18 16 9 53 38 27Theme Gifts & Merchandise 12 25 41 24 21 24 40 7 5Horse Enthusiast & Westernwear 34 43 7 53 44 63 3 49 42Low-Ticket Female Apparel 21 15 55 17 18 30 7 20 19Low-Ticket Home Décor & Gifts 8 22 20 26 23 11 19 15 13Specialty Foods & Spices 32 26 24 20 26 8 55 40 30Teen Apparel & Shoes 79 82 10 85 80 74 11 69 70Art Gallery & Museum Merchandise 1 57 62 52 56 72 64 47 54Children's Apparel & Shoes 54 75 2 78 75 62 61 73 68Children's Merchandise-Ages 0-6 52 65 5 69 67 34 47 76 69Children's Merchandise-Ages 7+ 23 53 1 66 55 42 24 64 53Children's Merchandise-All Ages 61 70 8 58 69 59 50 70 66Female Activewear 70 79 3 83 78 70 23 74 73High-Ticket Beauty & Spa 80 77 66 60 68 75 8 61 63High-Ticket Gifts & Merchandise 76 76 35 54 65 60 10 44 43Hunting & Fishing 40 48 4 56 43 45 35 48 34Low- Mid-Ticket Beauty & Spa 62 46 57 36 48 53 9 52 51Low- Mid-Ticket Male & Female Apparel 41 49 9 59 49 38 57 59 56
Sports Merchandise & Apparel 55 63 6 72 58 55 37 65 65
• The buying behavior of all RDA-supplied files was evaluated for a recent 12-month period.
• Top categories were identified as those where the % of RDA customers buying is significantly greater than the average Cooperative household.
• The top 10 product categories for each file are noted in blue, the next 10 are noted in yellow. Values above indicate ranking of each category by RDA file. The above list is ranked by categories most often in top 10, then top 20 listing

SCOPE OF CATEGORIES FOR EXPANSION
• For prospecting opportunities, Abacus can profile RDA buyers with specific category purchases on the Cooperative, despite that this product has not been purchased from RDA.
• For Housefile opportunities, Abacus can identify which RDA customers are shopping across various product categories with the Cooperative L12 mo.
• These counts contain overlap between product categories as household purchase across categories.
RDA Customer Group - COUNT OF RDA HH's BY CATEGORY
ABACUS CATEGORIESTotal
Cooperative
Mag Only BHE
Nevers
Mag Only BHE
Evers Age 35-54
BHE Payers < 12 mo
BHE Payers > 12 mo
Online Sweeps Players
TL - Ab Circle
ProTL - Paid
L1YTL - Paid 13-24M
TOTAL FILE SIZE (HH) 12 mo HH's 1,901,551 2,060,86315,885,20
0 687,50011,562,98
2 1,032,217 453,355 997,170 1,507,146Men's Supplements 194,094 5,116 13,101 16,781 11,859 59,381 3,753 3,150 7,095 8,139Music 581,971 10,606 21,989 30,776 15,808 92,699 4,796 1,229 12,329 15,106Collectibles - Metal 176,607 6,250 15,047 35,732 16,552 59,818 5,601 2,315 10,909 14,690FD Societal Benefits 349,232 3,807 7,478 13,773 4,731 34,685 1,935 588 3,622 4,469Home Organization & Gadgets 1,414,907 45,946 74,468 216,000 39,848 375,693 26,899 10,722 38,826 50,794Newsletters 1,644,507 65,692 122,727 285,751 83,730 505,535 42,831 12,610 46,586 60,518Books 3,125,632 72,520 126,412 408,629 114,809 683,443 57,683 19,540 57,446 76,951Magazines 20,450,847 671,233 938,984 3,370,277 445,635 3,818,045 382,630 88,348 291,250 424,930Senior Health Hardgoods 2,216,586 64,550 133,443 159,999 79,318 627,410 26,659 13,051 51,217 64,643Discount Domestic Merchandise 7,294,764 240,706 399,676 1,046,600 185,651 1,847,991 130,965 43,738 153,026 216,803Stationery 504,132 17,223 35,625 59,618 18,049 150,086 8,173 2,184 11,761 17,713Video 1,152,627 27,368 39,769 215,906 26,113 211,293 17,958 7,138 26,529 38,724Vitamins & Supplements 3,339,220 66,915 115,169 429,719 71,975 587,104 47,144 27,986 52,567 73,409Country Home Décor & Gifts 1,897,694 50,908 75,652 253,567 34,728 343,297 28,874 9,126 30,817 46,774Health & Wellness 4,716,595 30,112 52,085 130,417 29,147 245,358 17,565 8,344 25,527 34,002Collectibles 2,248,020 46,765 67,044 313,752 40,303 343,108 29,972 12,187 44,099 64,504Large-Size Female Apparel 3,399,494 94,530 118,556 645,360 50,549 677,875 75,506 19,574 65,873 97,282Arts & Crafts 1,754,398 53,459 63,116 361,597 27,101 346,910 33,751 8,649 27,289 40,589Theme Gifts & Merchandise 511,505 15,552 20,573 94,146 9,413 113,985 9,320 3,084 12,949 20,035Horse Enthusiast & Westernwear 560,263 14,267 14,889 132,857 4,785 85,401 6,470 5,455 9,346 14,161Low-Ticket Female Apparel 3,094,477 138,369 220,871 779,109 104,291 1,064,147 71,216 34,339 91,704 128,085Low-Ticket Home Décor & Gifts 1,345,879 47,061 60,044 298,855 24,488 319,515 32,031 9,815 32,577 46,132Specialty Foods & Spices 4,244,001 106,456 155,647 789,612 76,260 811,568 87,439 21,713 70,968 105,405Teen Apparel & Shoes 1,615,379 27,594 18,235 411,575 3,707 135,355 16,283 11,642 14,591 24,829Art Gallery & Museum Merchandise 676,293 28,067 15,330 114,930 5,945 92,248 7,702 3,142 10,707 14,416Children's Apparel & Shoes 2,299,175 48,103 33,346 586,421 7,964 207,908 25,940 10,427 21,001 35,834Children's Merchandise-Ages 0-6 3,798,614 85,236 63,998 972,897 17,283 379,873 58,904 22,304 36,247 66,912Children's Merchandise-Ages 7+ 2,398,444 69,167 54,713 776,398 12,812 317,013 35,635 13,236 27,719 49,004Children's Merchandise-All Ages 4,141,872 93,798 75,764 1,066,634 23,154 454,410 57,499 25,103 46,287 78,085Female Activewear 1,189,292 20,966 13,993 306,153 3,059 100,831 11,785 9,536 12,085 19,582High-Ticket Beauty & Spa 782,160 11,164 9,311 115,978 4,521 73,053 6,872 5,230 9,806 13,399High-Ticket Gifts & Merchandise 1,960,604 28,096 23,734 335,302 13,546 184,120 19,604 15,208 31,382 44,451Hunting & Fishing 6,792,476 147,902 143,684 1,470,200 42,475 900,880 81,844 36,169 88,695 139,434Low- Mid-Ticket Beauty & Spa 5,624,120 61,405 74,728 535,792 35,513 436,832 39,456 27,100 47,142 68,204Low- Mid-Ticket Male & Female Apparel 4,656,173 123,258 131,491 1,021,517 34,902 746,815 68,895 21,756 67,870 96,865
Sports Merchandise & Apparel 1,633,676 32,703 29,117 354,351 8,583 179,636 20,071 7,838 17,506 26,734

READERS DIGEST CONSIDERED NEW PRODUCTS AND PARTNERSHIPS BASED ON CUSTOMER LIFESTYLES AND BEHAVIORS• The RDA file as it exists at Abacus (Magazine and BHE) was compared to ICOM
data to identify the most highly correlated data attributes within our survey and compiled files.
• Consider known customer behavior to develop new products, partnerships, etc.– For example, consider partnering to create an insurance offering
• Incorporate above findings into upcoming promotions and creative strategies
Survey or Compiled Data AttributeMail Order Responder Insurance Grandchildren (any)Prime Occ Homemaker Mail Order Plus Size Women's ClothingRetired Donor/Social Concerns - Political ConservativeHome Improvement Reading: HistoryOwn Burial Insurance Music Preferences: ClassicalVeteran in HH Length of Residence > 11 yearsTravel Music Preferences: Christian or GospelHighest Level of Education HS Collectibles - PlatesSocial Concerns: Active Military Donor/Social Concerns - VeteransOwns Medicare Coverage Hobby Bird WatchingHobby Bird Feeding Donor/Social Concerns - Other ReligiousCollectibles - Stamps

READER’S DIGEST EXPLORED A CONVERSION STRATEGY OF OFFLINE & ONLINE SWEEP NO’S• The RDA-supplied files were compared to a small group of Sweep No’s housed within
Abacus.• Match rates ranged from 10%-40%, with BHE Payers <12 month’s matching at the
highest rates.• Just because they haven’t purchased from you yet, doesn’t mean they aren’t actively
buying through Sweeps.• Customize language to incent Sweep No’s.• Can you rent other merchants Sweep No files? Will other merchants rent yours?
Analyzed Groups Supplied by RDA File Qty
% Match to Sweep No's (non-RDA,
sub-set) Qty MatchMag Only BHE Nevers 1,901,551 10% 196,620Mag Only BHE Evers 2,060,863 21% 423,920Age 35-54, all promotable 15,885,200 11% 1,807,736BHE Payers < 12 mo's 687,500 40% 272,525BHE Payers > 12 mo's 11,562,982 16% 1,808,450Online Sweeps Players 1,032,217 22% 222,856Time Life - Ab Circle Pro Buyers 453,355 15% 70,179Time Life - Customers paid L1Y 997,170 18% 175,701Time Life - Customers paid 13-24 mo (not L1Y) 1,507,146 18% 265,559

SO WHAT HAPPENED?• What new, customer-targeted offers, products and
partnerships we’ve explored? What worked and what didn’t?
• How were ROI-driven customer segmentation practices to get the appropriate offer, at the right time, with the right product, to the most receptive customer employed? Were they better than “brainstorm and test”?
• Future focus – how did each company identify and develop the best new opportunities for overall business growth and profitability?
HOW CAN YOU EMPLOY THIS METHODOLOGY TO USE DATA TO
IMPROVE OFFERS, PRODUCT LINES, AND PARTNERSHIPS?

QUESTIONS?

THANK YOU FOR YOUR ATTENDANCE!
Joe Devanny, Reader’s Digest Steve Schlumpf, Haband
Kevin Sacher, American Mint Rob Reger, Epsilon Targeting
All will be available for additional questions following this presentation.