powerlog client user manual - p...
TRANSCRIPT

Powerlog Client User Manual
28/01/2003

2
Table Of Contents Introduction ........................................................................................ 6 Installation.......................................................................................... 7
Before you start................................................................................ 7 Installing Powerlog Client ................................................................ 7
Installing from CD..........................Error! Bookmark not defined. Installing from a network drive...................................................... 8
Configuring Powerlog Client The first time it runs................................ 9 Powerlog Client .................................................................................10
Powerlog Client layout ....................................................................11 File menu...........................................................................................12
Open hour.......................................................................................12 Save day.........................................................................................13 Next / previous day .........................................................................13 Select log........................................................................................13 Refresh log list................................................................................14 Search DAB....................................................................................14 Exit ................................................................................................15
Settings menu.....................................................................................16 Colours...........................................................................................16 Display Marks.................................................................................18 Audio setup ....................................................................................19
Forward / Rewind settings ............................................................19 Advanced ....................................................................................19
Daylight saving...............................................................................20 Log location....................................................................................22
Audio menu .......................................................................................22 View menu.........................................................................................23
Jump to now ...................................................................................24 Expand info window .......................................................................24 Zoom..............................................................................................25 Tracer line ......................................................................................25 Tracking options .............................................................................25
Help menu .........................................................................................26 Create P2 support file ......................................................................26
Creating your first P2 support file .................................................26 Using dupport codes to generate files............................................27 Using manual information to generate support files .......................29
3
Update information .........................................................................30 About.................................................................................................31
Opening your first log.........................................................................12 Opening a log using the File menu...................................................32 Opening a log by double-clicking on the clock .................................33 Opening the previous or next days from within the log .....................34
Using Powerlog Client to access multiple logs.....................................34
Selecting the log you want to review................................................34 Listening to a log................................................................................36
The Info tab ....................................................................................36 Current play point and the log progress bar ......................................37 Parts of the day when no logs are available.......................................38 Using the transport controls .............................................................39
Play.............................................................................................39 Stop.............................................................................................40 Forward / Rewind ........................................................................40 Fast-forward / Fast-rewind ...........................................................41
Changing what you are listening to by clicking on the log.................42 Using the log progress bar to move around the log............................43 Moving the area of the log that you are looking at ............................44
Moving around in the log using the Time Scrub bar............................ 46
Changing the scale of the viewed section of log................................47 Changing the volume of the log while you listen ..............................49 Changing the audio channel you want to hear (left / right).................49 The track button................................................................................................. 50
Hardware Marks.................................................................................51 The Hardware Marks area................................................................52 Using Hardware Marks....................................................................52
Listening to a Hardware Mark ......................................................53 Dragging several Hardware Marks to the Compilation Window to make a single .WAV file ...............................................................54
The ‘Mic Live’ tab ..........................................................................55 Changing the Hardware Marks that are visible in the Hardware Marks area....................................................................................55 Using the Hardware Marks list to listen to a Hardware Mark .........56 Dragging Hardware Marks from the Mic Live tab to the Compilation Window to make .WAV Files .......................................................58
User Marks ........................................................................................59
The User Marks area .......................................................................59
4
Creating and using User Marks ........................................................60 Creating, editing and deleting User Marks.....................................60 Saving the changes to a day..........................................................62 Listening to User Marks ...............................................................63 Making .WAV files from User Marks ...........................................63
The User Marks tab.........................................................................64 Listening to User Marks using the User Marks Tab .......................65 Creating, editing and deleting User Marks.....................................65 Saving the changes to a Day............Error! Bookmark not defined.
Silences .............................................................................................67
Listening to Silence Marks ..............................................................68 Turning Silence Marks into .WAV files ........................................70
The Silences tab ..............................................................................70 Playing a Silent Mark from the Silences tab ..................................70 Left and right filtering of Silence Marks........................................71 Changing the amount of log you hear either side of a Silence Mark71
DAB Text ..........................................................................................73
The DAB tab...................................................................................74 Using the DAB list to listen to the log...........................................74 Searching DAB text .....................................................................76 Basic search.................................................................................76 Advanced searches.......................................................................77 Using the search results................................................................78
The Log Tab ......................................................................................80 The Notes Tab....................................................................................81
Adding Notes to a log......................................................................82 Grabbing a section of the log as a .WAV file .......................................83 Using the Start and end marks to create a .WAV file............................84
Changing the Marked section...........................................................86 Dragging a Marked area tnto the Compilation Window.....................88
The Compilation Window...................................................................90
Opening the Compilation Window...................................................90 Un-pinning the Compilation Window...............................................90 Dragging Marks into the Compilation Window ................................92 Adding specific times and dates to the Compilation Window ............94 Adding multiple Marks from one or more shows ..............................96
Search Date range........................................................................97

5
Search Time range .......................................................................98 Search pattern ..............................................................................99 Hardware Lines ...........................................................................99 Starting the search......................................................................100 Example: Grabbing every vocal link from last week’s breakfast shows.........................................................................................101
Changing the order of items in the Compilation Window................105 Removing items from the Compilation Window.............................106 Listening to the items listed in the Compilation Window ................107
Fast-forward & Rewind..............................................................109 Stopping playback of the items in the Compilation Window ........109
Compiling the list in to a .WAV file...............................................110 Starting the process ....................................................................110 Setting the file name and location ...............................................110 Set the file type and format.........................................................111 Generating the finished .WAV file..............................................112
Loading, saving and clearing compilations .....................................113

6
Introduction Powerlog Client offers instant access to the audio and data logs stored on one or more Powerlog Server systems. Powerlog Client can be installed on any number of PCs within your organisation, as long as they run Windows™ 9x, NT, 2000 or XP operating system, have a network connection to your Powerlog Server system, and are fitted with a standard Windows™ sound card. Powerlog Client is an extremely useful and versatile addition to the tools used in the day to day running of your station, with applications ranging from program review to promotional material production. It also offers an unprecedented level of access into the way your station sounds, as well as providing visual markers for hardware events (such as when the mic is live) and any periods of silence that your station may endure. The diagram below shows where Powerlog Client fits into a typical overall Powerlog system:
Powerlog Client can be installed at any level of your station - wherever you want to have access to the audio and data logs that are recorded by your Powerlog Server systems, whether they’re at your station or other connected radio stations.

7
Installation This section of the Powerlog Client documentation will guide you through the process of installing Powerlog Client and configuring it to ‘look at’ your station’s Powerlog Servers. The installation process can be run from a CD or a network location. Powerlog is regularly updated to include new features and facilities so you should check with P Squared periodically to ensure that you are getting the most from your Powerlog system.
Before You Start Before you start to install Powerlog Client onto a PC, you will need to make sure that you have made a note of the location of the Powerlog Server Directory file. This is the file that you want the Powerlog Client to use for accessing audio and data logs, and will be stored on one or more Powerlog Servers. The Directory file allows you to ‘map’ the logs stored on several Powerlog Server boxes so that the client can seamlessly switch between them without the user having to worry about the network locations of boxes that may not even be in the same building. The Directory file is usually located in the Powerlog folder of the main Powerlog Server for your station. The Directory file contains information on all the individual logs that are available and where they are physically located on your network. A typical location for a directory path might be: \\plserver\powerlog\default.dir In this example, the Powerlog Server that we are trying to connect to is called Plserve r, the Directory file is called default.dir and it is located in the Powerlog folder. If you are not sure of the location of the Directory file that you want to use, you should clarify this before installing Powerlog Client. Although you can change it later, you will still need to give a valid Directory file as part of the installation process.
Installing Powerlog Client Your Powerlog Server will have been supplied with an installation CD that includes both Powerlog Server and Powerlog Client. If you purchased a complete system from P Squared, or if we installed and configured your Powerlog Server using existing hardware, then your Powerlog Server will include an installation image of Powerlog Client that you can use to begin the process. We are constantly working to improve the functionality of all our products and as such, the version of Powerlog CD that was originally supplied with your system may not be the latest release. You should check with P Squared regularly to ensure that you always have the latest features.

8
Installing From CD To install Powerlog Client from CD, insert the Powerlog CD in to the CD ROM drive. After a few seconds, the Powerlog Install screen will appear.
Click on the Install Powerlog Client button to begin the installation process.
Installing From A Network Drive To install Powerlog Client from a network location, use My Computer to locate the folder you want to install from and double click on the Setup.exe icon to start the installation process. Next, for both installation from CD and installation from a Network Drive, follow the onscreen instructions selecting Complete Install when prompted. The installation process will take a few minutes to complete; you will then be asked if you want to run Powerlog Client as soon as the install process has been completed. If you are ready to configure Powerlog Client and run it for the first time then tick the option and click on the Finish button. If you wish to do this at a later time just click the Finish button and restart Powerlog Client from the Start menu when you are ready.

9
Configuring Powerlog Client The First Time It Runs After completing the installation process, the first time you run Powerlog Client you will be asked to set a few configuration options to allow you to start using Powerlog Client to access audio and data logs. The first thing you will see is the Powerlog Client ‘splash screen’ which tells you information about the version of the product being loaded, and where in the loading process the system is. This screen will usually only appear for a few seconds. However, the first time you run Powerlog Client it will appear for a little longer as it generates the configuration files. You will then be asked to enter the location of the Directory file (as explained in the Before You Start section of this document).
You must enter the UNC path to the Directory file that contains the information for all the audio and data logs that you want the Powerlog Client to have access to. This file is usually located in the Powerlog folder of the Powerlog Server box but could be stored anywhere (you set this up when you set up your Powerlog Server). In this example, the Powerlog Server that we want to use is called Plserver and the director file is called Default.dir and is located in the Powerlog folder. In this case, we would type in the following: (or use the Browse button to locate the file on the network)

10
If you have entered the Directory file location correctly then Powerlog Client will start up for the first time. If the Directory file location is not correct, you will get the following message:
If you see this message then the Directory file was not found at the specified location. You can amend the location by clicking on the OK button. Once Powerlog Client has been configured and is running, you can change the location of the Directory file at any time by selecting the Settings menu and choosing the Log Location option to select a new file.
Powerlog Client Powerlog Client offers visual access to the audio and data logs stored by one or more Powerlog Servers and provides the end user with a way of navigating through the logs, listening to any portions they want to and even ‘grabbing’ sections from the logs for review purposes or for editing in a standard Windows™ audio editor. As well as providing access to the audio logs, Powerlog Client also displays hardware inputs to the Powerlog Server. These are displayed as coloured blocks alongside the audio logs. These coloured hardware marks’ can be used to indicate anything that you feel is relevant to the log, but are typically used to indicate when the mic is live. This is done by hooking up the fader start on the mic channel of a mixing desk to a hardware input on the Powerlog Server. Periods of silence are also logged by the Powerlog Server and are displayed as coloured blocks on a smaller line. The Powerlog Server can also be used to log DLS text for Digital Radio services. If you are logging DLS then this is also displayed on the Powerlog Client along with the audio logs.

11
Powerlog Client Layout The diagram below shows the general layout of the Powerlog Client and a quick overview of what each section does.
Please Note: When asked to “Click” (or “left click”) on a part of the screen, you must press the left mouse button once. When asked to “double-click”, you must press the mouse button twice in quick succession. When asked to “right-click”, press the right-hand mouse key once .

12
File Menu The File menu performs a range of functions in Powerlog Client, but its primary use is to open a specific time and date in the selected log or to switch to any alternative logs that may be available.
Open Hour This option allows you to select the time and date of the current log that you want to start viewing with the Powerlog Client. Selecting this option opens the Hour Selection window.

13
Use the calendar on the left hand side to select a date and the clock on the right hand side to select the time (to the nearest hour) that you want to start the log from. Once you are happy, click on the OK button to open the log.
Save Day The Save Day option only becomes available if you have added a User Mark to the day. User Marks are visual markers that can be added to the log, by users, to signify an area of the log of interest. A User Mark can be added using the Powerlog Client but are not available to other Powerlog Client machines until the User Mark is saved to the Powerlog Server along with the description notes attached to it. The Save button allows you to save any User Marks that have been added. N.B. If you add User Marks to a log, then try to quit Powerlog Client or switch to another log or day without saving it, you will be asked if you want to save the marks before continuing.
Next / Previous Day As the name would suggest, the Next Day and Previous Day options on the File Menu move to either the previous or next day on the log that is currently selected. The same effect can be achieved by clicking on the Previous and Next Day buttons located to the left and right of the Hardware Marks Display Area and marked with a double arrow in the appropriate direction.
Select Log The Select Log option allows you to select which log you want to listen to in Powerlog Client. Clicking on the option will expand the sub-menu that offers all of the logs that are available.

14
The Directory file that is set-up as part of the Powerlog Server installation determines the logs available in this list. To select a log from this list, to click on the one you want to listen to.
Refresh Log List Powerlog Client allows access to multiple logs over several different Powerlog Servers. These different Powerlog Servers could be located in different physical locations or sites. All that is needed is a network path to the all the available logs. The location of all the Powerlog Servers that a Powerlog Client can access is stored in a file called the directory file, which is stored on a nominated Powerlog Server. This directory file can be updated on the Powerlog Server at any time but the Powerlog Client only checks it when it first starts up, which in turn means that extra logs added to the directory file will not appear in Powerlog Client until it is restarted. The Refresh Log List option on the File menu removes this restriction by forcing the Powerlog Client to look at the directory file again, even although it is running.
Search DAB Powerlog includes the ability to log the text that is sent along with the audio to Digital Radio broadcasts, this text is know as DAB DLS text. The Search DAB option on the File menu allows you to search through all the DAB text for the selected day on the currently open log. Selecting this option opens the standard DAB Search windows.

15
For details on using the DAB text search facility, please refer to Searching DAB Text in this documentation.
Exit Exit will quit from Powerlog Client. You will be asked to save any User Marks that have not been saved, before the program ends.
16
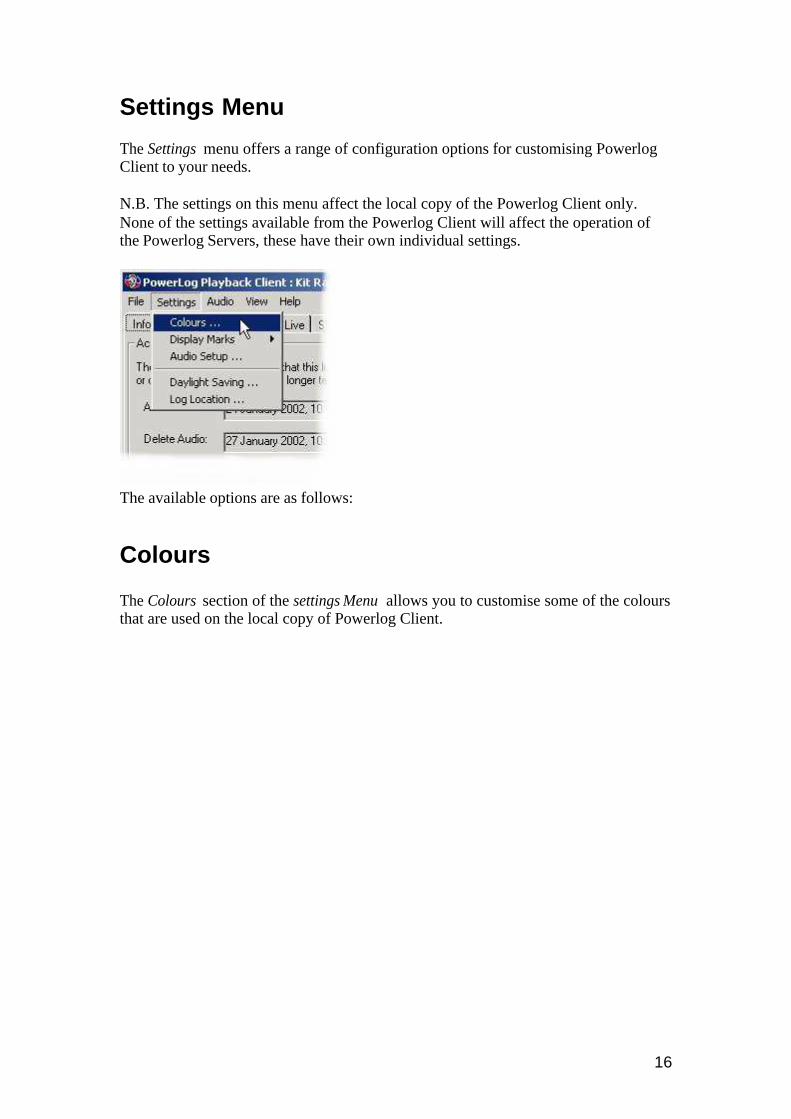
Settings Menu The Settings menu offers a range of configuration options for customising Powerlog Client to your needs. N.B. The settings on this menu affect the local copy of the Powerlog Client only. None of the settings available from the Powerlog Client will affect the operation of the Powerlog Servers, these have their own individual settings.
The available options are as follows:
Colours The Colours section of the settings Menu allows you to customise some of the colours that are used on the local copy of Powerlog Client.

17
To alter the colour for a particular section of the Powerlog Client, click on the button for the item you want to change the colour of, then select the desired colour from the colour selector window.

18
Most of the descriptions are self-explanatory but a few abbreviations have been used to allow the description to fit. These abbreviations are explained below. DLS – DAB Text BG – Background FG – Foreground Feel free to experiment with the colours to customise Powerlog Client to your needs.
Display Marks The Display Marks setting allows you to alter the way in which the various marks in Powerlog Client are displayed. Typically, there are two ways in which the marks are displayed in Powerlog Client: they are displayed as either just the marks for the hour that is currently playing, or all the marks for the entire day. In both cases, the display of marks refers to the lists found on the Tab for each appropriate type of mark.
The options all act essentially the same, although for different types of marks, and allow you to decide whether the marks listed on the Mic Live tab are displayed for the full day or just the section that is visible. The default is for Entire Day . The Current View mode should only be used for faster computers or for logs that only contain a few Hardware Marks , as the Current View mode is considerably slower than Entire Day mode.

19
Audio Setup The Audio Setup option on the Settings menu allows you to adjust a few of the settings that determine how Powerlog Client plays audio back through your computer’s sound card.
Forward / Rewind Settings This allows you to set how far, in seconds, the Fast Forward and Rewind buttons jump on the Transport Controls . There are actually two Fast Forward / Rewind buttons. The single arrow only jumps by a small increment whilst the double arrow jumps a lot further. The Small Seek Step option allows you to specify, in seconds, how far the single arrow Fast Forward / Rewind buttons jump in the log. The Large Seek Step determines how far the double arrow button will jump in the log.
Advanced The advanced section of Audio Setup allows you to specify exactly which soundcard to use by selecting the desired device from the drop down menu. You can also adjust the amount of audio the Powerlog Client buffers when playing back. In simple terms, the amount of audio that is buffered is the amount of audio that Powerlog Client ‘pulls’ from the Powerlog Server ahead of actually playing it. The

20
higher you set this number, the longer the Powerlog Client can lose contact with the Powerlog Server before audio playback will fail. The down side is that the Powerlog Client will perform more sluggishly with increased audio buffering. The default for this setting is one second and should only be altered if you are experiencing audio ‘drop out’ on playback on the Powerlog Client due to poor network performance.
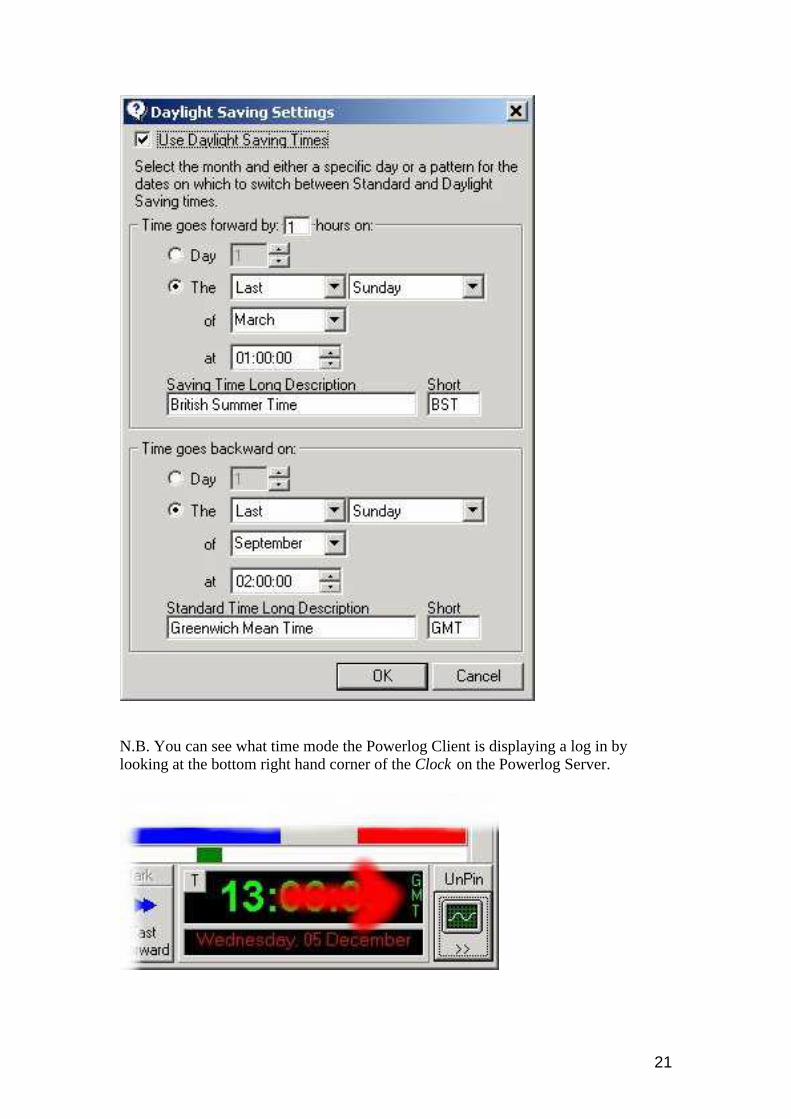
Daylight Saving In the bleak mid winter, snow falls all around … and it is bloody dark! Every September there is a very special day, a day that we all look forward to for months before hand and fondly remember for weeks after, it is a day when we get a whole extra hour in bed. Unfortunately, for every peak there is trough and in March there is the awful day of anti-pleasure where you have to get out of bed an hour earlier. This annual cycle of bliss and tragedy is caused by the UK’s daylight saving time shift, which goes from Greenwich Mean Time (GMT) to British Summer Time (BST) to make the most of the hours of sunshine. This does however cause a problem for Powerlog as once a year it has an extra hour to log and once a year a complete hour disappears. To get around this problem, Powerlog Server actually stays on GMT all year round meaning that it never experiences the time change. To make the logs appear to be correct for the users throughout the summer months, Powerlog Client automatically adjusts the time on the logs it displays to whether in GMT or BST, the user can always get to the logs they want. The time and date for the time shift along with a description are automatically included in the Powerlog Client so unless you live outside the UK, you do not have to worry about altering them, however, if you do live in a place that uses different time shifts or you want your system to remain on GMT all year round, then you can change the default settings for daylight savings time shifts using the Daylight Savings section on the Settings menu.
21
N.B. You can see what time mode the Powerlog Client is displaying a log in by looking at the bottom right hand corner of the Clock on the Powerlog Server.

22
Log Location The final option on the Settings menu is the Log Location which tells Powerlog Client where to look for the directory file that contains the location of all the various logs that can be accessed by the Powerlog Client.
The location of this directory file can be found by clicking the Browse button and searching your network.
Audio Menu The Audio menu allows you to control audio playback in the Powerlog Client and provides a convenient alternative to the Transport Controls .

23
The Options on this menu are as follows: Play (F5) – Starts playback of the log from the Current Play Point Rewind (F6) – Rewinds by a small amount Big Rewind (Shift + F6) – Rewinds by a greater amount Rewind To Start (Ctrl + F6) – Rewinds to the first hour of the current day Forward To End (Ctrl + F7) – Fast- forwards to final hour in day Big F-Forward (Shift + F7) – Fast- forward by a larger amount F-Forward (F7) – Fast-forward by a small amount Stop (F8) – Stops playback of the log Open Compilation – Opens the Compilation Window for compiling sections of the log in to .WAV files. Pin Compilation To Main Window – This option dictates whether the Compilation Window is a separate floating window or is ‘pinned’ to the right of the main Powerlog Client.
View Menu The View Menu offers a range of options that affect what you see on Powerlog Client.

24
Jump To Now Selecting this option will jump the main view area (the Hardware Marks Area etc) to the very latest point available in the log. In most cases this would be as close to the current time as possible.
Expand Info Window This option expands the information that is visible on the various Tab options that are available in Powerlog Client. Once this option is selected, the currently visible tab will expand down to cover the Hardware Marks Area, User and Silence Area . To switch back to normal view, re-select the Expand Info Window menu option.

25
Zoom The Zoom option on the View menu allows you to select exactly what visual resolution you view the log at on the Powerlog Client.
To switch the Time Scale in Powerlog Client, select the time band that you want from the options offered on the menu.
Tracer Line The Tracer Line option on the View menu allows you to change the appearance of the line that scrolls as Powerlog Client plays, from invisible to dotted or even solid.
Tracking Options The Track Options option on the View Menu allows you to turn on Active Tracking in Powerlog Client, which is where the Hardware Marks Area scrolls automatically to always show the section of the log that is currently playing.

26
Help Menu Apart from the obvious access to the Powerlog Client Help system, the Help menu also includes access the Create P2 Support File option which allows you to automatically create and upload a support file to the P Squared web site. This helps us analyse and fix any problems with your Powerlog system. You can also use this menu to view the Update Information which includes all the information about new features and fixes that have gone into the recent releases of the software. Finally, you can access the About screen. From this menu you can get information about the version of Powerlog Client you are running. This information will be needed before you contact P Squared with any enquiries regarding your Powerlog Client.
Create P2 Support File The P2 Support File is a file that Powerlog Client generates and can automatically send to P Squared to help diagnose any faults that you may have with your Powerlog system. The P2 Support File copies a specified section from the audio of the log and adds all additional information to it before ‘zipping’ it in to a single file and sending to P Squared for analysis.
Creating Your First P2 Support File Before you can start to create your first P2 Support File you must enter some personal information that is uploaded to P Squared along with your support file. You will only have to do this once because Powerlog Client will make a note of it so that any other P2 Support Files created on the same PC will automatically include your personal information.

27
Once you have entered in your personal details, you will get to the main P2 Support File generation screen. You can change this personal information at any time by clicking on the Edit Personal Details button located on the main P2 Support File generation window.
Using Support Codes To Generate Files Once you have entered your personal details once, the P2 Support File window will open whenever you request a P2 Support File using the Help menu. The P2 Support File can be generated in one of two ways. The first is to use a Support Code supplied by a P Squared technical support engineer. This code is a unique alpha-numeric number that is generated by P Squared to instruct Powerlog Client to compile and send the exact information that the P Squared support engineer is interested in. If you have been discussing your Powerlog problem with a P Squared support engineer and they request a P2 Support File, they will also provide you with a Support Code for you to enter in to the provided box.

28
Encoded in to this code is the exact time and date range of the logs that the issuing engineer is interested in looking at as well as a code that signifies who requested the logs. Once you have entered the Support Code click on the Make File button to begin to write the Support File . You will see a progress bar to show how the process is proceeding. Once it has finished, you will be asked if you wish to upload the file to P Squared.
If you select Yes, the file will automatically be uploaded to a special P Squared web site ready for retrieval by one of our engineers. This processes uses your PC’s usual route to the Internet so you can only use this option if the PC has either permanent or dial access to the web.

29
If you select No then you will be asked where you would like to save the Support File on you local PC or network. You can then send the file to P Squared by whatever method is most convenient.
Using Manua l Info To Generate Support Files If you are not given a Support Code or you wish to begin uploading a P2 Support File before talking to a P Squared engineer, you can enter the time and date range for the P2 Support File manually by selecting the Use Manua l Info option.
Set the Start and End dates by using the drop down calendars and clocks. Each P squared technical support engineer has a unique Support Engineer Reference, if you know the number of the engineer that you want to look at the file, you can enter it in the Support Engineer Reference section. Finally, you can choose to just include the non-audio data in the P2 Support File by ticking the Send Data Only box. This option is especially useful if your query is to do with Hardware, Silence, Dab or User Marks as you will not waste time uploading the unnecessary audio files. Once you have added all the details that are required, clicking on the Make File button will begin the generation process.

30
Once the process of compiling the file is completed, you will be asked whether you wish to ‘upload’ the file to P Squared. If you select yes then Powerlog Client will use the PC’s Internet connection (whatever form that takes) to transfer the P2 Support File to a special P Squared web site ready for collection by one of our engineers. If you select No then you will be asked if you wish to save the file on a local or network location for later use or sending to P Squared via an alternative method. P2 Support Files are a powerful tool in diagnosing any questions about your Powerlog system but they should only be used in response for a request for a file from a P Squared engineer. Unsolicited files will not be dealt with until the original sender contacts P Squared and files that are not backed up with contact will be automatically deleted after 5 days.
Update Information The Update Information option on the Help menu opens a text file that is maintained by the programmers at P squared and that details changes and enhancements that are made to Powerlog Client with each subsequent release of the software. To view the file, select the option for the Help menu.

31
About The About option on the Help menu shows the Powerlog Client ‘splash screen’ which includes information about the software build and licence details.
The most important information in the About box is the product version number which you will need to know (or have access to) for any technical questions that you have to contact P Squared to help with. The exact version number of the software can be located on the middle right hand side of the About box.

32
Opening Your First Log The first time you run Powerlog Client, it will automatically open the first log listed in your Directory file. From then onwards, however, Powerlog Client will always open the last log that you were viewing (at the current date and time). To open a log for a specific time and date, you have three options:
Opening A Log Using The File Menu The first option is to use the File menu. To do this, click on the File menu and select Open Hour .
You can see from the menu that you can also use the Crtl+F1 keys on the keyboard as an alternative. The Open Hour window will then appear, which allows you to select the time and date (to the nearest hour) you want to look at within the log by using the calendar on the left hand side and the clock on the right.

33
The calendar on the left hand side of the window allows you to select the date of the log that you wish to view. Logs may not necessarily be available for a specific date, but Powerlog Client will still look for you. Next, select the hour that you want to view by clicking on the circular clock to the right. The clock is divided into twelve segments with the inner (green) circle representing the AM hours and the outer (red) circle representing the PM hours. Alternatively, you can enter the time that you want in the 24 hour clock situated below the circular clock. N.B. Selecting the time and date does not restrict your access to the logs; you can freely move around within the day and even from day to day using the Powerlog Client. This just provides you with a convenient starting point.
Opening A Log By Double Clicking On The Clock Another alternative to using Ctrl + F1 or the File>Open Hour method is to simply double click on the time and date indicator located at the bottom right hand side of the main Powerlog Client window.
This will open the Open Hour window as with the File>Open Hour methods. You can then select the time and date of the log as before (see above).

34
Opening The Previous Or Next Day From Within The Log Finally, another way to open a log for a different day to the one currently displayed is to use the Previous and Next Day buttons that are located to the left and right of the Hardware M arks Area of the Powerlog Client.
These double arrowed buttons will move to either the previous or next day at the same hour within the same log. This is ideal for comparing the same part of a show over several days. The single arrow buttons located below the Previous and Next Day buttons are used for moving around with a single day’s log (for more information on these buttons see page 39: Using The Transport Controls ).
Using Powerlog Client to Access Multiple Logs The Powerlog Server is capable of logging multiple stations on a single box and ‘clusters’ of Powerlog Servers can be used to log even more services. The Powerlog Client offers access to all of the Powerlog Server logs that you have added to the Directory file (see page 7: Before You Start ) so that the end user can simply switch between them without having to know where they are physically located, or having to lose their place within the log.
Selecting The Log You Want To Review To instruct Powerlog Client to display another log, start it as normal and select the File menu option.

35
Next, choose the Select Log option to view a list of the logs that are available. The currently selected log will have a tick by it. To select an alternative log, use the mouse to select the log that you want to change to. N.B. The new log will be opened at the exact time and date that you were reviewing on the previous log. This is ideal if you want to compare what several stations are doing at the same time. To move to another time and date, select the new log then move to another time and date in the usual way (see page 32: Opening Your First Log).

36
Listening To A Log The principal function of Powerlog Server is to log the audio output of a station; the principal function of Powerlog Client is to provide a way of listening to the audio logs that Powerlog Server has recorded. Powerlog Server actually records the audio into lots of little files every hour to allow quick access to the logs, and to reduce the loading on the system as a whole. Powerlog Client ‘stitches’ all these files back together into a continuous stream of audio so that when your are listening to logs via the Powerlog Client, they will sound identical to the original broadcast (except for any audio quality changes that your Powerlog Server is set up to perform). This is only made possible by P Squared SmoothStream™ technology, which is the foundation on which all Powerlog Products are based. When you run Powerlog Client, it will automatically open the last log that you viewed with the current time and date ready to be played. You can then select a different time and date or a different log altogether (see page 32: Opening Your First Log and page 35: Selecting The Log You Want To Review ). Once you have opened the section of log that you are interested in, you can listen to it.
The Info Tab One of the first things that you will notice once a log has been selected is that the Info tab is automatically displayed above the Hardware Marks Area . The Info tab offers general information on the section of the log that is currently displayed including information on when the log will be archived and when it will eventually be deleted.
The volume controls are also included on the Info tab along with options for which audio channels (left or right) to play back when listening to the logs.

37
Current Play Point And The Log Progress Bar Before explaining how to listen to logs using Powerlog Client, it would be useful to review the Log Progress Bar and the Current Play Point , as these are fundamental concepts for understanding how to get the most from your Powerlog Client system. Powerlog Client deals with logs one day at a time. The Log Progress Bar is a timeline that runs from left to right and represents the entire 24 hour period that makes up a complete day’s log. The Progress Bar fills to show where in the log the Current Play Point (the section that you are listening to or would listen to if you clicked on the Play button) is currently located.
In the picture above, the Log Progress Bar is the blue bar that is located above the Transport Controls and below the User Marks area. The Current Play Point is the end of the Log Progress Bar and is indicated with the red circle above (for annotated diagram see page 11: Powerlog Client Layout ). As you listen to the log, the Log Progress Bar slowly fills from left to right to represent your progress through the log (see diagram above). You can click anywhere in the Log Progress Bar to move the Current Play Point to that position in the log.

38
Parts Of The Day When No Logs Are Available When you start Powerlog Client it will automatically open the last log that you were listening to, at the current date and time. This means that you will usually see something like the diagram below:
The blue bar that fills the majority of the left hand side of the Log Progress Bar shows where the Current Play Point is (in this case 14:18:47). To the right of this is a red bar that fills the rest of the Log Progress Bar area. This indicates that there are no logs available for that time period. In the example above, the reason for this is that the logs have not yet been recorded. Any hours that have been recorded and later deleted are also represented by red sections on the Log Progress Bar.

39
If you click inside the red bar to attempt to listen to logs that are not available, the Play button on the Powerlog Client Transport Controls will automatically toggle to display No Logs .
Using The Transport Controls Audio playback on the Powerlog Client is controlled via the Powerlog Client Transport Controls , which are located at the bottom of the main Powerlog Client window underneath the Hardware Marks Area .
Play Clicking the Play button will start playback of the selected log at the time displayed in the clock to the right of the Transport Controls . Once the log starts playing, the Play button toggles to a Stop button.

40
Stop
Clicking this button will stop the playback of the log and toggle the button back to a Play button.
Forward / Rewind The Forward and Rewind buttons move the current play position on by a small amount in their respective directions. The default for this jump is 5 seconds. However, you can alter this amount by selecting the Settings menu and selecting Audio Setup . This will open the Powerlog Client Audio Settings window (for more details on the Audio Settings see Audio Setup ), the Small Seek Step setting determines how many seconds the Forward and Rewind buttons jump.

41
Fast Forward / Fast Rewind Not unsurprisingly, these two buttons will move the play point by a larger amount in their respective directions. The default jump increment for these buttons is 60 seconds but again, you can adjust this by selecting the Settings menu and choosing Audio Setup . The Large Seek Step setting determines how many seconds the Fast Forward and Fast Rewind buttons jump.

42
Changing What You Are Listening To By Clicking On The Log The bottom part of the standard Powerlog Client window is known as the Viewed Log Area and incorporates a number of separate areas that are used to display different information in the log. The viewed area of the screen represents a section from the log that you have selected and includes the Hardware Marks, User Marks and Silences . It is also includes the Log Progress Ba r and which shows the Current Play Point .
Clicking anywhere in the viewable area will change the Current Play Point to the position you have clicked on.

43
Using The Log Progress Bar To Move Around The Log Whether the log is playing or not, you can use the Log Progress Bar to move the current play point around within the viewable area.
In the example above, the viewable area goes from about 16:25 through to about 17:25 (the time scale along the top shows the time span of the viewable area. You can change this scale by right clicking on it and choosing a new range but more on this feature later). The Progress Bar shows the current play point and fills from left to right as the log is played. You can use this Progress Bar to move to any point in this viewable area by clicking on the bar with the left mouse button and ‘dragging’ it to the left or right. Alternatively, clicking on a point within the Progress Bar area will move the play point to that part of the bar. Tip: If you click on the Log Progress Bar and drag it while Powerlog Client is playing, you will hear the log playing in a ‘scrub’ fashion. This is often useful for finding the end of segments of shows or songs.

44
Moving The Area Of The Log That You Are Looking At The Powerlog Client is designed to look at logs one day at a time with the user having total freedom to move around and listen / view logs within the day. Obviously, it would not be practical for the Powerlog Client to display the entire day’s worth of audio and data logs on one screen, so the day is broken down into smaller viewable areas that can range from two hours to one minute depending on how much of the log you want to view and how accurately you want to view it. The pictures below shows the same place in the log, with Powerlog Client displaying in 2-hour view and 5-minute view.
In ‘2 hour’ view, the time scale along the top of the Hardware Marks display shows a full two hours of the log.

45
In ’5 minute’ view, the same log can be seen in more detail and the scale along the top of the Hardware Marks display. There are a range of view mode options available; can change the view mode by right clicking on the Time Scale at the top of the Hardware Marks display and selecting the view that you want from the list (more on this later). Whichever view mode you select, you will probably want to move the viewed section of the log to different times of the day. You can do this in two different ways.

46
Moving Around In The Log Using The Time Scrub Bar The first way of moving around in the log for a given day is to use the Time Scrub Bar to scroll to the time period that you are interested in. The Time Scrub Bar is located directly underneath the Log Progress Bar and looks like a green horizontal scroll bar.
To move the view, click and hold the left mouse button on the green Time Scrub Bar and drag it to the left or right to move backward or forward in time respectively. Moving to the extreme left of the Time Scrub Bar will move the view to the beginning of the day (00:00) and moving to the extreme right will move the view to the end of the day (23:59). The view mode determined by the Time Scale also determines how sensitive the Time Scrub Bar is. N.B. The viewed area of the log does not necessarily have to be the same as the part of the log that is playing. This means that you can look around whilst continuing to listen to a section of the log.

47
Moving Around In the Log Using The Scroll Buttons An alternative to using the Time Scrub Bar is to use the Scroll buttons that are located to the left and right of the Hardware Marks display. These buttons, marked with single arrows that point left and right, will move the viewed area to the left or right of the currently viewed section of the log depending on which button you use. Clicking and holding the left mouse button on the Scroll buttons will cause the viewed area to scroll in the direction of the button.
The Scroll buttons should not be confused with the Day Scroll buttons located above them (and indicated with a double arrow), which are used to scroll to the preceding or following logs.
Changing The Scale Of The Viewed Section Of Log As stated previously, Powerlog Client deals with complete days at a time but it is not practical to display the complete day’s audio and data at the same time so the Powerlog Client focuses on a single area known as the ‘viewed area’ of the log. This area shows all of its Hardware, User, and Silence marks in the Hardware Marks display area. When you first start up Powerlog Client, the default display will show you two hours of the log at a time. However, you may want to ‘zoom in’ to look at a section of the log in more detail. In this case, you must change the Time Scale which is located along the top of the Hardware Marks area. To change the Time Scale of the viewed

48
area of the log, right click on the Time Scale along the top of the Hardware Marks to select the scale that you want to switch to.
The view that is currently selected has a tick beside it. To switch to another Time Scale move the mouse to the desired scale and left click on it.
Powerlog Client will then display the same point in the log but ‘zoomed in’, so that the entire viewed area of log only covers the selected time frame (5 minutes in the above example).

49
Changing The Volume Of The Log While You Listen While you are listening to any log using the Powerlog Client, you can control the volume of the audio playback through your PC by using the Volume Control, which is located on the Info tab to the right of the general log information.
Moving the ‘fader’ up and down will alter the playback volume of the log. It will not affect the logs on Powerlog Server in any way.
Changing The Audio Channel You Want To Hear (Left / Right) You can also restrict playback of a log using the Powerlog Client to just the left hand audio channel or the right hand audio channel. This is extremely useful if you are logging to different stations, one on each side of the stereo input.
N.B. If you select either Left Only or Right Only , playback will still come from both speakers on your computer but will be restricted to your audio channel of choice.

50
The Track Button The Track button is located in the top left-hand corner of the Time / Date display on the Powerlog Client.
This button toggles between the two Powerlog Client playback modes. The default mode does not update the display when the Current Play Point moves off the displayed area. If the Track button is selected (turns red) then as the log is played, the display is updated to ‘track’ its position as the log is played. This keeps the Current Play Point displayed at all times. This option is very useful if you are using Powerlog Client to listen to the log as if it were being played live. It also has the advantage of allowing you to listen to your station but pause or even rewind it if you feel the need.

51
Hardware Marks One of the things that make Powerlog such a unique logging system is its ability to log a number of hardware events alongside the audio that it is recording. In simple terms, the Powerlog Server is fitted with a special (optional) card that can take hardware inputs from a number of sources. These hardware inputs act a bit like switches, if the switch is ‘thrown’ then Powerlog Server makes a note of when it was thrown and how long it remained in that state. This information is then displayed in the Powerlog Client as coloured blocks known as Hardware Marks . You can use these Hardware Marks to monitor and log just about anything but the most common application is to wire up the ‘mic live’ output from your studio’s mixing desk into the Powerlog Server so that users of the system will be able ‘see’ whenever the presenters are doing a ‘vocal link’. Other common uses include monitoring which ‘Cart Player’ each played item comes from and when a telephone is used. You could even fit a switch in the Program Controller’s office so that they can mark events on to the log as they are happening. Typically, Powerlog has 16 hardware inputs (expandable to 48) all of which can be displayed on the Powerlog Client, however, if your Powerlog system is logging more than one service, you may want to use certain Hardware Marks with some logs and not with others. If this is the case, the Powerlog Server can be set up so that the Powerlog Client will only display the Hardware Marks that are relevant to the particular log that you are viewing (see Powerlog Server documentation for more details).

52
The Hardware Marks Area The Hardware Marks area of the Powerlog Client is where all the Hardware Marks are displayed.
In example above, the Hardware Marks area is the section with the large coloured blocks located beneath the Time Scale and the Transport Controls . Each row within the Hardware Marks area represents a hardware input to the Powerlog system and each coloured block within the row represents the times when that hardware input was activated. As you can see, the size of the each block is dependent on the time that the hardware input was ‘switched on’.
Using Hardware Marks As outlined above, the Hardware Marks are graphical representations of physical events that happened in the ‘real world’ and were logged alongside the audio logs by Powerlog Server. These Hardware Events are usually directly related to the audio itself, such as recording when the mic fader was open or when a certain piece of equipment was used. However, Hardware Marks can also be used to keep a record of

53
a completely unrelated occurrence. The Hardware Marks themselves appear a coloured blocks that sit in the Hardware Marks Display Area and their size are directly relative to the length of the mark.
Listening To A Hardware Mark The simplest way to review a specific Hardware Mark is to use the left mouse button to click on the beginning of the Hardware Mark and click on the Play button on the Powerlog Client Transport Controls . The Current Play Point will move to the beginning of the Hardware Mark in question, and clicking on Play will start playback of the log from the specified point. Alternatively, you can right click on a Hardware Mark . This opens up the Hardware Marks right click menu.
There are four main options that are available from on the right click menu of the Hardware Marks Area . A fifth option, Add To Compilation, is only available if the Compilation Window is also open in Powerlog Client (see below) Play From The Mark: will move the Current Play Point to the beginning of the Hardware Mark in question and start to play from that point. Powerlog Client will continue to play the log even after the Hardware Mark has finished. Play This Mark: will move the Current Play Point to the beginning of the selected Hardware Mark and proceed to play the mark in full, however, Powerlog Client will automatically stop playback at the end of the Hardware M ark. Jump To The Mark: Selecting this option will move the Current Play Point to the beginning of the Hardware Mark in question but will not automatically start playback of the Hardware Mark. When it plays will be determined by the status of the Play
54
button on the Powerlog Client Transport Controls . If Powerlog Client is playing before you select this option then it will automatically jump to the beginning of the Hardware Mark and continue playing it. If, however, the Powerlog Client was not playing then it will jump to the right place but not start playing until you tell it to by clicking Play . Expand Info Window: expands the Mic Live tab to cover the entire Hardware Marks Display Area so that you can see more of the Hardware Marks List at a time. This option applies to any of the tab options located along the top of the Powerlog Client, underneath the menu options. Add To Compilation: This option is only available if the Compilation Window is open. If enabled, this option adds the selected Hardware Mark to the Compilation Window ready for playback or for making in to a .WAV file for use outside of Powerlog. Double clicking on a Hardware Mark in the Hardware Mark Area will automatically open the Mic Live tab and highlight the Hardware Mark that has been double clicked.
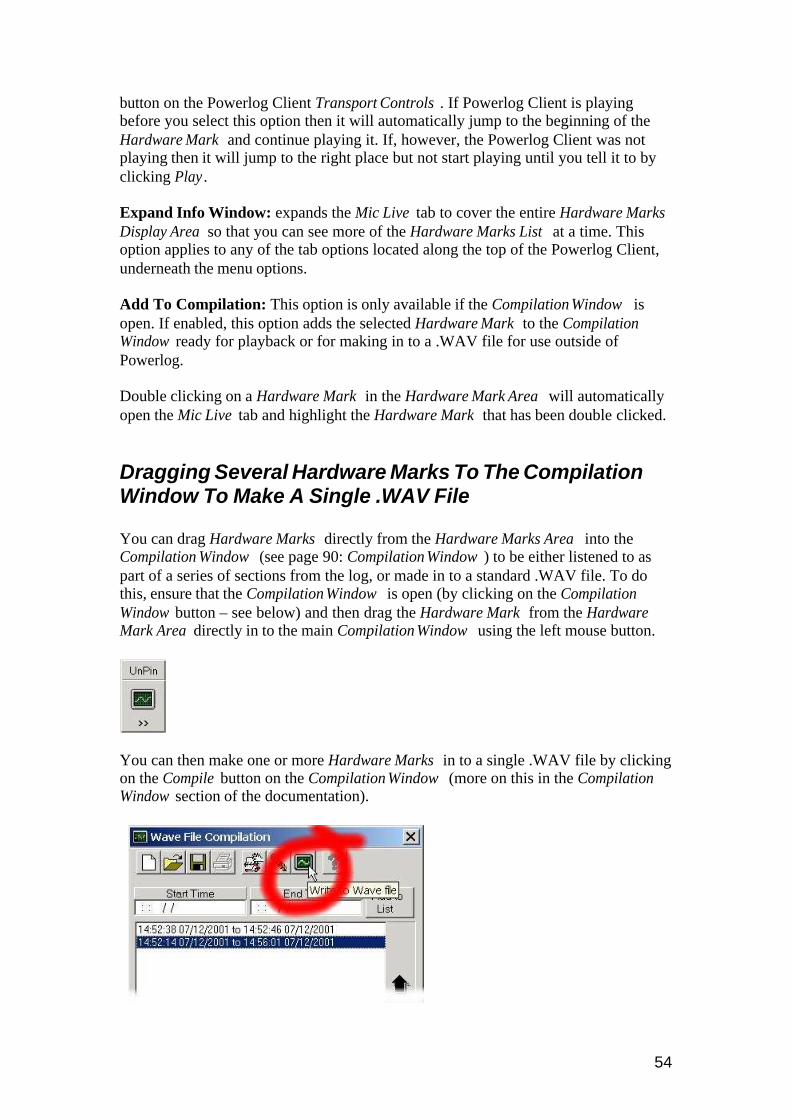
Dragging Several Hardware Marks To The Compilation Window To Make A Single .WAV File You can drag Hardware Marks directly from the Hardware Marks Area into the Compilation Window (see page 90: Compilation Window ) to be either listened to as part of a series of sections from the log, or made in to a standard .WAV file. To do this, ensure that the Compilation Window is open (by clicking on the Compilation Window button – see below) and then drag the Hardware Mark from the Hardware Mark Area directly in to the main Compilation Window using the left mouse button.
You can then make one or more Hardware Marks in to a single .WAV file by clicking on the Compile button on the Compilation Window (more on this in the Compilation Window section of the documentation).

55
As outlined above, dragging is not the only way to add a Hardware Mark to the Compilation Window . Once the Compilation Window is open, the option to Add To Compilation Window is added to the right click menu to allow you to add a Hardware Mark without having to physically drag it in yourself.
The ‘Mic Live’ Tab The Hardware Marks are also displayed in the in the form of a list that can be seen by clicking on the Mic Live tab (alternatively, double-clicking on a Hardware Mark will also switch to the Mic Live tab). The Mic Live tab is divided in to two different areas, the area on the left lists all of the Hardware Marks for the log that you are currently viewing, including the start and end times for each mark. The right hand side allows you to select the Hardware Marks that are displayed in the Powerlog Client’s main Hardware Marks Area.
Changing The Hardware Marks That Are Visible In the Hardware Marks Area The right-hand side of the Mic Live tab lists all the Hardware Marks that are available and a tick box by each type of Hardware Mark . This allows you to select which Hardware Marks are actually displayed in the Hardware Marks Area by ticking the types of Hardware Marks that you want to see.
In the above example, the Powerlog Server has been set up to record the hardware inputs for four cart players as Hardware Marks called Cart Player 1-4 respectively. In this case, only Hardware Marks for Cart Players 1-3 will be displayed in the Powerlog Client Hardware Marks Area.

56
Changing the ticks next to the Hardware Marks in the right-hand side window will alter the Hardware Marks displayed in the Hardware Marks Area and also the Hardware Marks listed in the Hardware Marks List located to the left of the Mic Live tab.
Using The H ardware Marks List To Listen To A Hardware Mark
The Mic Live tab includes a list of the Hardware Marks for the log that you are currently viewing. This list can be set to two different modes. The first displays all the Hardware Marks for the entire day and the second only displays the Hardware Marks for the hour of the log that you are currently viewing (more on changing between these modes later). The list itself includes the start and end times of each Hardware Mark as well as the description of the Hardware Mark as originally set up on the Powerlog Server.

57
The first and simplest way of using the Hardware Marks List to jump to or listen to a particular Hardware Mark is to simply double click on the Hardware Mark that you are interested in. The Powerlog Client Current Play Point will automatically jump to the start of the selected Hardware Mark and automatically start playing.

58
However, you may not want to start playback of the Hardware Mark automatically. In this case, clicking on the Hardware Ma rk with the right mouse button will open an alternative menu of options for you to select from.
There are four options that are available from on the right click menu of the Hardware Marks List on the Mic Live tab – Play from the mark, Play this mark, Jump to this mark and Expand info window. A fifth option – Add to compilation - is also available if the Compilation Window is also open in Powerlog Client. The function of these buttons is explained in “Listening to a Hardware Mark “ (page 53).
Dragging H ardware Marks From The Mic Live Tab To The Compilation Window To Make .WAV Files As with the standard Hardware Marks in the Hardware Marks Display Area you can drag Hardware Marks directly from the Hardware Marks List into the Compilation Window (see Comp ilation Window ) to be made in to a standard .WAV file. This is exactly the same as in “Dragging Several Hardware Marks to the Compilation Window to make a single .WAV file ” on page 54, except that you are dragging from the Hardware Marks List instead of the Hardware Marks Area .

59
User Marks In addition to automatically generated Hardware Marks , Powerlog also allows the average user of the system to add their own marks to the system known as User Marks . The User Marks are coloured blocks that can be added to any of the logs accessible via the Powerlog Client and once saved, can be viewed by other users of the system in the same manner as standard Hardware Marks. The User Marks have their own User Marks Area on the Powerlog Client.
The User Marks Area The User Marks Area is located directly above the Log Progress Bar and below the below the Silence Display .
N.B. The User Marks Area should not be confused with the Silence Display Area, which looks very similar and is located directly above the User Marks A rea. If you are not sure which is which, let the mouse cursor ‘hover’ over one of them for a moment and a helpful note will appear which will help you to differentiate between the to. User Marks that are displayed in the User Marks Area and will appear as thin coloured blocks (the default colour is blue but this can be changed by selecting the Colours option from the Settings menu). The size of the block represents the actual length of the User Mark and will therefore change as the Time Scale changes to view more or less of the log at a time.

60
Creating And Using User Marks User Marks can be created at any time, by any user of Powerlog Client and once created can be used in much the same way as Hardware Marks for listening to sections of the log or creating a .WAV file from the marked area.
Creating, Editing And Deleting User Marks
The simplest way to create a new User Mark is to use the mouse’s right button to right click on the User Mark Display Area on the part of the log that you want to start your User Mark from. It is not essential that you click exactly where you want to start you User Mark from because, as you will see, you will have to option to change it before you complete your User Mark.
Select the Create New User Mark option from the menu that appears. N.B. If you right clicked on an area of the User Mark Display Area that already had a User Mark on it then other options would be enabled on this menu. However, you would still need to select Create New User Mark if you wanted to add a User Mark .

61
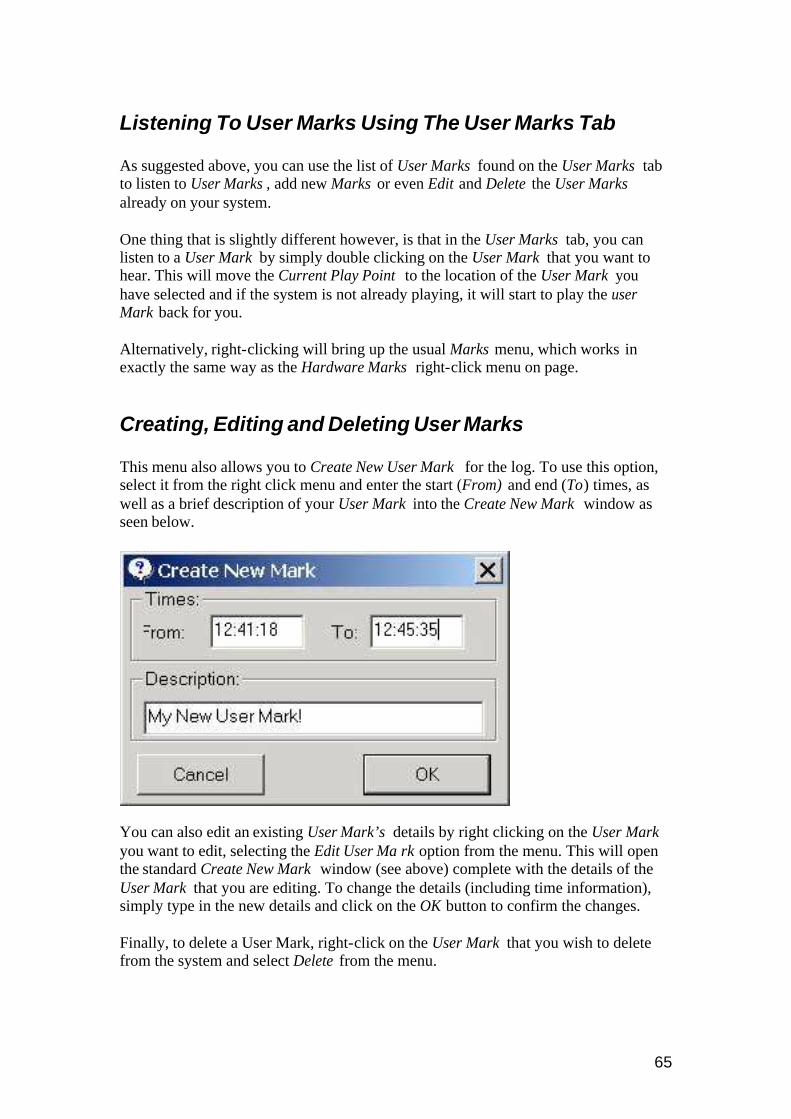
Next, enter the start and end times (To and From ), along with a description that you can use to identify your User Mark . You will notice that the position that you clicked on in the log is automatically entered in to the From section of the Create New Mark window. This is simply to save time; you can enter an alternative From time by typing it into the box. N.B. Currently, User Marks cannot span more than one day’s log. When you are done, click on the OK button to add your User Mark to the log.
As you can see from the picture above, the new User Mark has been added to the log. You can edit the details of any User Mark right-clicking on the User Mark that you want to edit and selecting Edit User Mark from the right click menu that appears. This opens the standard Create New Mark window (see picture above) with the existing User Mark’s details already entered. You can alter any of the details by simply typing in your amendments and clicking on the OK button.

62
To Delete the User Mark that we have just created, all that we have to do is right click on it and select the Delete option from the menu the appears.
Saving The Changes To A Day It is not possible to make any changes to the audio logs or Hardware Marks stored on the Powerlog Server from the Powerlog Client. However, it is possible to add additional information to be saved alongside the originally record audio and data logs. User Marks are an example of one such type of data. When you add a User Mark to a log using the Powerlog Client, the User Mark is not permanently saved to the Powerlog unless you deliberately save the changes by using the File menu option and selecting the Save Day option.
This will add the User Marks (along with any other notes you have added) to the actual log stored on the Powerlog Server box. This will also enable other users to see and use the User Marks that you have added.

63
This feature is very useful if you wish to add a load of User Marks to create .WAV files from, but do not want to leave them on the system for others to use. N.B. If you add something to the log and then try to change log or day without saving the changes that you have made, the system will prompt you to save the changes before it proceeds to load the new log or day.
Listenin g To User Marks Once you have one or more User Marks on your log, you can start to listen to them in the same way that you would listen to a standard Hardware Mark . The simplest way to listen to a User Mark is to use the left mouse button to click on the beginning of the User Mark and then clicking on the Play button on the Powerlog Client Transport Controls . Clicking on the beginning of the User Mark will move the Current Play Point to the beginning of the User Mark and hitting Play will obviously start the playback. If Powerlog Client is already playing then clicking on the beginning of a User Mark will jump the Current Play Point to the start of the User Mark and the system will continue playing from that point. Alternatively, you can also right-click on a User Mark to open a menu. The options here function in exactly the same way as the ones on the Hardware Mark right-click menu (page 53).
Making .WAV Files From User Marks You can make .WAV compilations of User Marks just as you could with Hardware Marks (see page 33, or for more detailed information, The Compilation Window on page 90). You can drag or add User Marks from either the User Marks Area or the list of User Marks located on the User Marks tab.

64
The User Marks Tab In addition to the standard User Marks Display Area there is also a User Marks tab, which is located on the tab strip that runs along the top of the Powerlog Client just underneath the menu options.
Clicking on the User Marks tab will display a list of the User Mark s for a given log. This list can be set to display either the User Marks for the hour under review or all of the User Marks for the entire day (by altering the settings found on the Display Marks sections of the Settings menu). It is used in much the same way as the User Marks in the User Marks Display Area to listen to or edit a particular User Mark.
65
Listening To User Marks Using The User Marks Tab As suggested above, you can use the list of User Marks found on the User Marks tab to listen to User Marks , add new Marks or even Edit and Delete the User Marks already on your system. One thing that is slightly different however, is that in the User Marks tab, you can listen to a User Mark by simply double clicking on the User Mark that you want to hear. This will move the Current Play Point to the location of the User Mark you have selected and if the system is not already playing, it will start to play the user Mark back for you. Alternatively, right-clicking will bring up the usual Marks menu, which works in exactly the same way as the Hardware Marks right-click menu on page.
Creating, Editing and Deleting User Marks This menu also allows you to Create New User Mark for the log. To use this option, select it from the right click menu and enter the start (From) and end (To) times, as well as a brief description of your User Mark into the Create New Mark window as seen below.
You can also edit an existing User Mark’s details by right clicking on the User Mark you want to edit, selecting the Edit User Ma rk option from the menu. This will open the standard Create New Mark window (see above) complete with the details of the User Mark that you are editing. To change the details (including time information), simply type in the new details and click on the OK button to confirm the changes. Finally, to delete a User Mark, right-click on the User Mark that you wish to delete from the system and select Delete from the menu.

66
Remember, none of the changes you make to the User Marks will be permanent until you save the day, so if you accidentally delete the wrong User Mark it’s not the end of the world! Just exit the current day and do not save the changes to the log.

67
Silences
Take a look at the screen shot above. Everything look OK to you? If you said yes than you would be wrong! look again at those two innocent little coloured blocks located above the User Marks Display Area.

68
Those two small purple (default colour) marks are very important because they are located in the Silence Display Area . This means that the Powerlog has detected that your station has gone silent during those periods and it is time for you to go and kick some ass. One of Powerlog’s interesting features is its ability to ‘listen’ to the incoming audio level of stations as it logs them and make a note of any periods where the audible level drops below a configurable threshold for more than a configurable period of time. When this happens, the system classifies it as a silence and places a Silence Mark onto the log itself. Much like the Hardware and User Marks , the Silence Marks are stored alongside of the audio on the Powerlog Server and displayed as Silence Marks whenever that section of the log is viewed using the Powerlog Client. N.B. Powerlog Server can also be set up to raise an alarm in the form of a hardware output from the system, should it detect a silent period longer than a configurable time. For more details, checkout the Powerlog Server documentation or contact P Squared.
Listening To Silent Marks Although apparently a contraction in terms, listening to the Silence Marks is actually a very useful way of determining why there was a silent period in the station’s output and what can be done to prevent it happening in future. This feature is especially useful for reviewing station output from times that would usually not get much attention (such as middle of the night) and see just how ‘sloppy’ that time of the day or night may sound. This feature is also very good at spotting problems with your ‘playout’ system that may result in momentary interruption of playback. Any Silent Marks that the system adds will be displayed in the Silence Display Area, located directly above the User Marks Display Area and the main Hardware Marks Display Area . The Silence Marks themselves appear as coloured blocks on the Silent

69
Marks Display Area and the size of the blocks represents the length of time that the silence lasted. This means that the size of the blocks will appear to change as you change the Time Scale that you are viewing the log with. To listen to a Silence Mark , use the right mouse button click on the Silence Mark that you want to listen to. This will open the right click menu, which offers a range of options for reviewing the mark in question.
Play From The Mark: will move the Current Play Point to a few seconds before the Silence Mark in question and start to play from that point. Powerlog Client will continue to play the log even after the User Mark has finished. Play This Mark: will move the Current Play Point to a few seconds before the selected Silence Mark and proceed to play the mark in full including a few seconds after it, however, Powerlog Client will then automatically stop. Jump To The Mark: Selecting this option will move the Current Play Point to a few seconds before the Silence Mark in question but will not automatically start playback of the Silence Mark. When it plays will be determined by the status of the Play button on the Powerlog Client Transport Controls . If Powerlog Client is playing before you select this option then it will automatically jump to the beginning of the Silence Mark and continue playing it. If, however, the Powerlog Client was not playing then it will jump to the right place but not start playing until you click on Play . In all cases, the time either side of the Silence Mark that Powerlog Client will play when prompted is determined by a setting that is located on the Silences tab itself. We will come to this soon. The only other option on the right click menu of the Silence Marks is the Expand Info Window option which – as ever – extends the Information Area , which includes all of the tabs located along the top of Powerlog Client, to cover the standard Hardware Marks Display Area .
70
Turning Silence Marks Into .WAV Files In the majority of cases, Silence Marks are added when the station falls silent unintentionally and as such, you may want to review a number of Silence Marks together to spot any patterns and you may also want to save the Silence Marks as a standard .WAV file for reference at a late time. Both of these can be done using the Compilation Window . This acts in exactly the same way as compiling Hardware Marks (see page 54, or for more detailed information, page 90: The Compilation Window ). You can drag or add Silence Marks from either the Silence Marks Area or the list of Silence Marks located on the Silences tab.
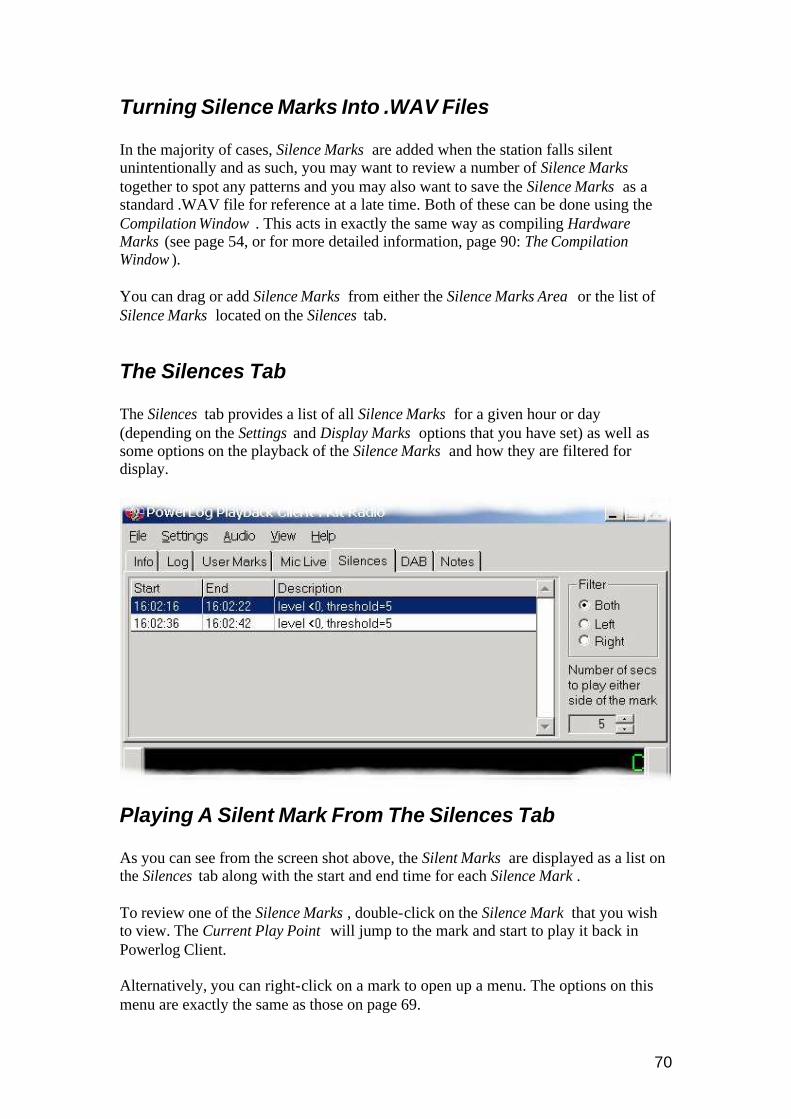
The Silences Tab The Silences tab provides a list of all Silence Marks for a given hour or day (depending on the Settings and Display Marks options that you have set) as well as some options on the playback of the Silence Marks and how they are filtered for display.
Playing A Silent Mark From The Silences Tab As you can see from the screen shot above, the Silent Marks are displayed as a list on the Silences tab along with the start and end time for each Silence Mark . To review one of the Silence Marks , double-click on the Silence Mark that you wish to view. The Current Play Point will jump to the mark and start to play it back in Powerlog Client. Alternatively, you can right-click on a mark to open up a menu. The options on this menu are exactly the same as those on page 69.

71
Left And Right Filtering Of Silence Marks The Silences tab also allows you to filter the Silence Marks displayed on screen so that only silences detected on the left- or right-hand sides of the stereo channel are displayed. This is really useful if you are using a stereo channel on your Powerlog Server to log two separate mono channels and you are only interested in one mono channel at a time (see Info tab to see how to change playback to left or right only).
The Filter section of the Silence Marks tab is located on the top right hand side of the window and allows you to select whether you want to see the Silence Marks from both channels, the left hand channel only or the right hand channel only. Use the mouse to click on the option that you want to use.
Changing The Amount Of Log You Hear Either Side Of A Silence Mark Just below the Filter for Silence Marks is a setting that allows you to set how much of the log you will hear either side of a Silence Mark when reviewing it.

72
In the example above, the number of seconds that would be heard either side of a Silence Mark would be five seconds. To change this setting, use the Up and Down buttons to the side of the number.

73
DAB Text Another unique feature of Powerlog is its ability to log your station’s DAB Text , which is produced by your Playout system for transmission on DAB networks. Digital Radio allows you to broadcast up to 128 characters alongside the audio, which can be used for artist and title information as well as any additional information that you would like to send. In addition, you can send as many 128 character strings within a song as your particular Playout system will support. Powerlog has been designed, in co-operation with the pioneers of Digital Radio to be able to log any ‘Radio Scape’ compliant DLS Text that your station broadcasts. This DAB Text is displayed in the Powerlog Client as the log is played back, with the DAB Text appearing as a scrolling list in the DAB DLS Text Area which is located directly above the Time Scale .
As you listen to the log, the DAB Text displayed in the DAB Text Display Area automatically updates to display what is being broadcast at that particular part of the log. As the song changes, the DAB Text will automatically change. However, it will only do this if your Playout system updates the DAB Text as it performs a segue, for more detail on how P Squared’s OCP technology could help you to do this, please contact P Squared. If you double click on the DAB Test Display Area , the DAB tab will automatically be displayed which contains a complete list of all the DAB Text for the log on the day in question. N.B. DAB Text and the DAB tab will only be displayed if your Powerlog Server has been configured to log DAB Text. This facility is only available with Powerlog Servers running version 3 or greater of the system. For details on DAB Text logging, consult the Powerlog Server documentation.

74
The DAB Tab The DAB tab offers a complete list of all the DAB Text that has been broadcast on a particular log for a given day. The DAB Text is displayed in chronological order and exactly as it was broadcast to DAB receivers.
Using The DAB List To List en To The Log The easiest way of listening to a section of the log associated with a particular DAB Text is to double click on the item you want to hear. This will move the Current Play Point to the moment in the log that the DAB Text first changed to the start of your selection. To listen to the log, click on the Play button on the Powerlog Client Transport Controls . N.B. If you are already listening to the log when you double click on the Dab Text on the DAB tab then the Current Play Point will jump to your selection and playback will continue from this point. Alternatively, you can also use the right mouse button to click on an item in the DAB Text list on the DAB tab. This will open a menu.
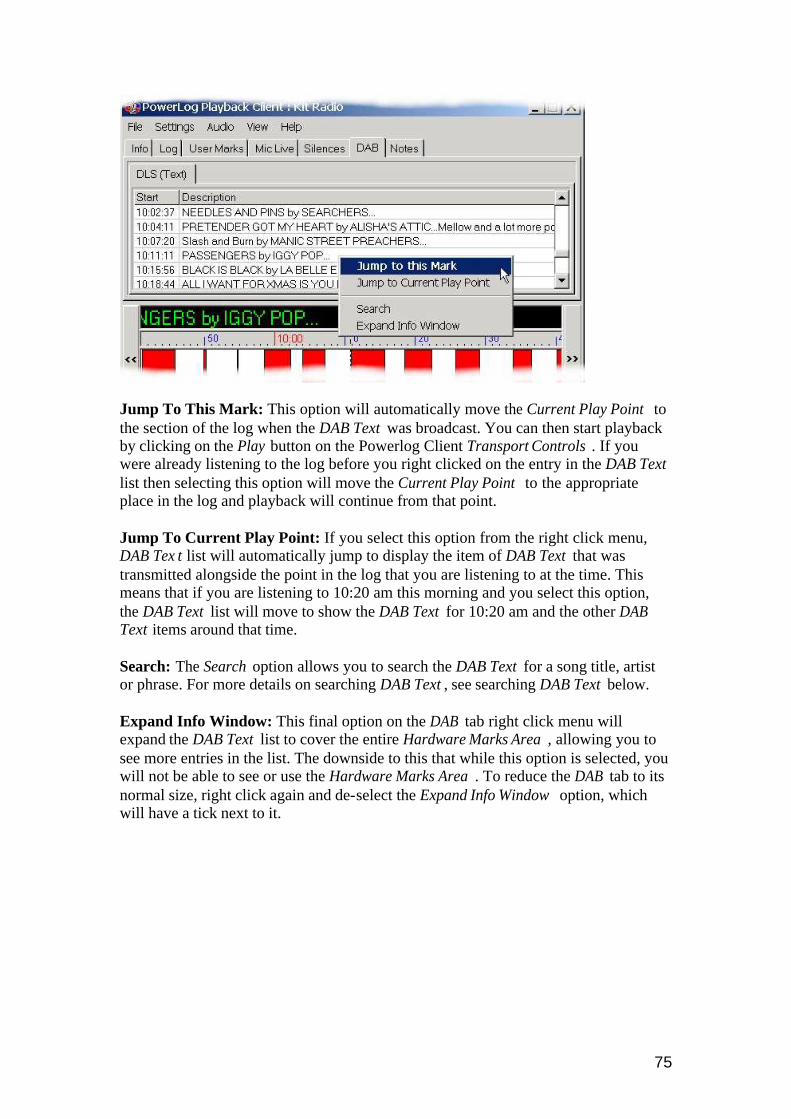
75
Jump To This Mark: This option will automatically move the Current Play Point to the section of the log when the DAB Text was broadcast. You can then start playback by clicking on the Play button on the Powerlog Client Transport Controls . If you were already listening to the log before you right clicked on the entry in the DAB Text list then selecting this option will move the Current Play Point to the appropriate place in the log and playback will continue from that point. Jump To Current Play Point: If you select this option from the right click menu, DAB Tex t list will automatically jump to display the item of DAB Text that was transmitted alongside the point in the log that you are listening to at the time. This means that if you are listening to 10:20 am this morning and you select this option, the DAB Text list will move to show the DAB Text for 10:20 am and the other DAB Text items around that time. Search: The Search option allows you to search the DAB Text for a song title, artist or phrase. For more details on searching DAB Text , see searching DAB Text below. Expand Info Window: This final option on the DAB tab right click menu will expand the DAB Text list to cover the entire Hardware Marks Area , allowing you to see more entries in the list. The downside to this that while this option is selected, you will not be able to see or use the Hardware Marks Area . To reduce the DAB tab to its normal size, right click again and de-select the Expand Info Window option, which will have a tick next to it.

76
Searching DAB Text In addition to seeing the DAB T ext that was broadcast to your DAB Receivers, Powerlog Client also offers the ability to search through DAB Text for a particular word or phrase. As you will soon discover, this offers a completely new dimension to your Powerlog system by giving you a complete textual log of the day’s events. By having your playout system send the name and artist of each song that is played to the DAB transmitter, Powerlog will log them alongside the audio log. You can then use this to see when a song or artist was played, to check when a promo was aired, or even compare it with the scheduled programme without having to listen to the entire log. The key to this extra level of usability is the search facilities that are available from the right click menu on the DAB tab and Search DAB menu option located on the File menu.
Basic Search
To open the DAB Text search facility, right-click on the DAB tab and select Search.

77
To search for a song, artist, name or phrase, type in the text that you want to search for in the Search Text box, then click on the Find button to start the search. After a couple of seconds, the results will appear as a list in the Search Results window located underneath the Search Text box. If you want to limit the search to be exactly as you have typed it, including capital and non-capital letters, click on the Case Sensitive tick box.
Advanced Searches If you need more power for defining your search criteria, you can use the Advanced Search facility to do a more specific search.

78
The Entire Phrase: The first option will only return results for DAB Text that is worded exactly as it was typed into the Search Text box. Eg: Typing in “Foxy Lady” would find you the Jimi Hendrix song of the same name. Any Of The Words In The Phrase: If you select this option, DAB Text results will be listed for any items that have one or more of the words entered in the Search Text . The words can be in any order. Eg: Typing in “Foxy Lady” might bring up not just the Jimi Hendrix song, but also Aerosmith’s “Dude looks like a Lady”. All Of The Words In The Phrase: If this option is selected, results will only be shown that contain all of the words that you have typed in the Search Text box, though they could be in any order. Eg: Typing in “Foxy Lady” would only bring up Jimi Hendrix and not Aerosmith, but it would also find any other songs with both “Foxy and “lady” in the title.
Using The Search Results Regardless of whether you do a basic or advanced search, the results are displayed as a list directly below the Search Text box.
In the example above, the word XMAS was typed in to the Search Text box and all of the DAB Text entries that contain the word XMAS are listed below along with the time of broadcast.

79
Let’s say we want to check out I Wish It Could Be Xma s Every Day . By double-clicking on it with the left mouse you button will automatically highlight the item in the main DAB Text list on the DAB tab.
You can then right click on the highlighted item to listen to the section of the log that was broadcast alongside the DAB Text . You can also drag DAB Text directly from the Search Results list in to the Compilation Window using the left mouse button. DAB Text items dragged in to the Compilation Window can be played back in order or used to generate a .WAV file of the periods of the log that were broadcast alongside the selected DAB Text .

80
The Log Tab The Log tab is used to display a copy of the ‘scheduled log’ for any given day. This ‘scheduled log’ is a list of all the music, adverts and jingles that are to be played on your station on the day in question, and is usually generated by music scheduling software such as AutoTrack by P Squared or third party scheduling systems such as Selector ™ by RCS.
The Log tab displays the entire log for the day you are currently reviewing in Powerlog Client. For details on how to import these ‘scheduled log’ files in to your Powerlog Server, please consult the Powerlog Server documentation or contact [email protected].

81
The Notes Tab The Notes tab on the Powerlog Client allows users at add their own text notes to the audio and data logs stored on the Powerlog Server.
Selecting the Notes tab will display the notes for the same hour as the Current Play Point on the same log, so if you are listening to the 9am –10am show then any notes for that hour will be automatically displayed in Notes Area when the Notes tab is selected. Powerlog actually allows you to add and save up to four different sets on Notes for each hour of log. These notes are displayed as a four ‘tabs’ along the top of the Notes Area . You can switch between the different sets of Notes by simply clicking on the desired Notes tab with the left mouse button. Each separate set of notes can be given a title and can even be protected by a password to prevent viewing or editing by unwanted users. In the example above, the Kit Radio log has had four separate sets of Notes representing different areas of the station. If you wanted to view the Station Management Notes , you would click on the Station Management tab and enter the password (assuming one had been added when the notes were set-up on the Powerlog Server). The Notes for the entire day would then be displayed although by default the hour that the Current Play Point is in would be displayed first. N.B. The name and password of each Note is set up on a per- log basis on the Powerlog Server. The User Notes are automatically saved as you add them to the log using the Powerlog Client.

82
Adding Notes To A Log To add Notes to a log, click on the Notes tab and select the type of Note that you want to add (e.g. “Presenter”). Next, scroll to the point in the log that you want to add the Note to. As far as Notes are concerned, the log is broken up into hour- long segments. For example, if you wanted to add a Note to the log between the hours of 9am and 10am, you would scroll to the appropriate section in the Notes Area and then click on the Edit Hour 9 button located to the right of the Notes Area . This will open the Edit Notes window which allows you to type in the text that you want to add as a Note to the selected hour of the log.
Once you have finished, click on the OK button to close the window and save the notes to the log. The finished Notes will then be displayed in the Notes Area to be viewed by other Powerlog Client users who have access to the that particular type of Note .

83
Grabbing A Section Of The Log As A .WAV File So far, we have examined how to use Powerlog Client to open and listen to sections of logs, and at the various additional information that Powerlog provides to make getting the section of log that you want, easier. In this section of the user guide, we will look at how you can then use the Powerlog Client to extract a section or multiple sections from a particular log for use outside of Powerlog. They will be exported in the form of standard Windows™ .WAV files that can be played on almost any computer and edited using most popular audio editing utilities. The Powerlog Client provides a number of ways of ‘grabbing’ sections from the log to be made into either linear or compressed .WAV files. This section will outline the most common methods.
Definition: .WAV The .WAV file is the standard audio file for Microsoft Windows™ and h as now become the standard for all audio files. The .WAV refers to the file extension that is used to mark the file as a standard audio file. Powerlog outputs .WAV files because they are the most common and universal of all audio data formats and can easil y be converted to other formats such as MP3.

84
Using The Start And End Marks To Create A .WAV File The first and most simple method for ‘grabbing’ a section of the log for making into a .WAV file is to use the Start, End and Save Mark buttons that are located above the Transport Controls on the Powerlog Client.
These buttons can be used to create a special User Mark on the log that can then be used to make a .WAV file. To create a .WAV file using the Start, End and Save Mark buttons, follow these simple steps.
1. Use the Transport Controls or left mouse button to move the Current Play Point to the point in the log that you want to start the mark at. N.B. You can listen to the log as you move the Current Play Point. This is helpful if you need to hear the position in the log.
2. Click on the Start Mark button to begin marking the section that you want to
‘grab’. You will notice that the End Mark button will be enabled.
3. You can use the Transport Controls or mouse to mark out the section you wish to be ‘grabbed’, or listen to the log until you reach the end of the part you need.
4. Click on the End Mark button to end the section of the log being marked.
5. A yellow coloured block will appear on the Time Scale located above the
Hardware Ma rks Area . This is the marked section of the log.
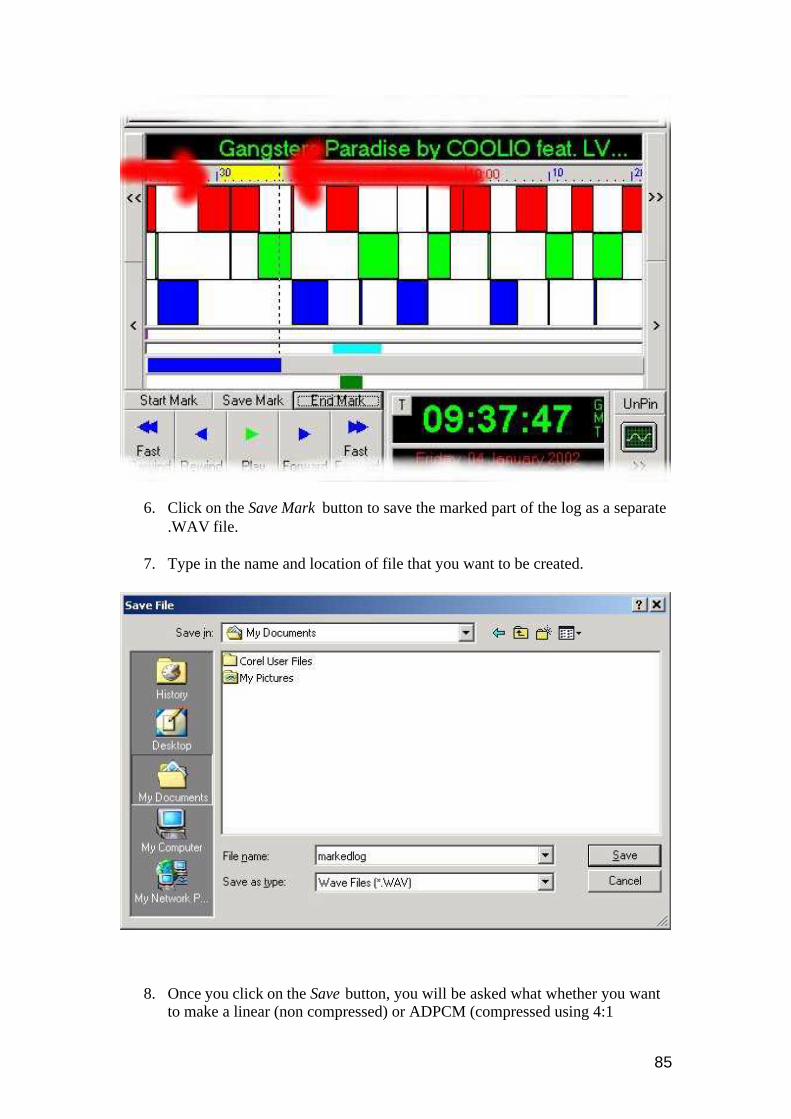
85
6. Click on the Save Mark button to save the marked part of the log as a separate .WAV file.
7. Type in the name and location of file that you want to be created.
8. Once you click on the Save button, you will be asked what whether you want to make a linear (non compressed) or ADPCM (compressed using 4:1

86
compression) format file. It will also ask whether the file should be stereo or mono and if so which side of the log to use to make the mono file. Use the drop down menus to select the options that you want.
9. Click on the OK button to start generating the .WAV file. A progress bar will appear. While Powerlog Client is generating the .WAV file, playback of the log will temporarily cease.
The section of the log that we marked will now be saved as a separate file called markedlog.wav (the file name we gave it) in the location that was specified. This file can now be played back using Windows Media Player™, edited into a promo using Cool Edit™ (or similar), emailed to a client or burnt on to a CD as either data or audio. Once the file is a standard .WAV file, you can use it for almost any purpose imaginable.
Changing The Marked Section Once you have marked a section of the log using the Start and End M ark buttons, the marked section appears as a yellow coloured block on the Time Scale . This mark gives a visual indicator of the length of the section of the log that you have marked for ‘grabbing’. But what about if you want to alter the marked are to make it bigger or smaller?

87
To change the marked area, you basically do use the same procedure as you used to create the mark in the first place. Let’s say that in our example below, we have marked an area that runs from roughly 9:30am to 09:38am.
Let’s say we actually want to change it so that it starts about 09:25 instead. All that we have to do is move the Current Play Point to about 09:25 by using either the Transport Controls or by using the left mouse button to click on the time.
Once the Curren t Play Point is at the new time, simply click on the Start Mark button to make this the new start of the marked area.

88
Similarly, if we wanted to extend the marked are beyond its current position, all that we need to do move the Current Play Point to the new place you want the mark to end and hit the End Mark button to extend the marked area. You can even use this method to mark an area to be grabbed that spans one or more days by simply starting the marked area at the time and date that you want the ‘grabbed’ file to start and ending the mark at the time and date on the log that you want it to end. You can even mark an area to be grabbed and then switch to a different log altogether (in the usual way by File>Select Log ) whilst retaining the marked area for grabbing the same time from a number of different logs.
Dragging A Marked Area Into The Compilation Window As well as using the Save Mark button to create a .WAV file from a marked area, you can also use the Compilation Window to compile several marked areas in to a single .WAV file. Click on the Compilation Window button to open the Compilation Window.
Next, use the left mouse button to ‘drag’ the yellow coloured block that defines the marked area.

89
The time and date for the marked area will then be listed in the Compilation Window . You can then mark another area and drag that into the Compilation Window to create a list of marks for playback (using the Play button located on the left hand side of the Compilation Window ) or for compilation in to a single .WAV file using the Compile button.
Once you have clicked on the Compile button, select the file name and location for the finished .WAV file and follow the onscreen instructions to start compiling the file. For more details on how to use the Compilation Window see the next section of this documentation.
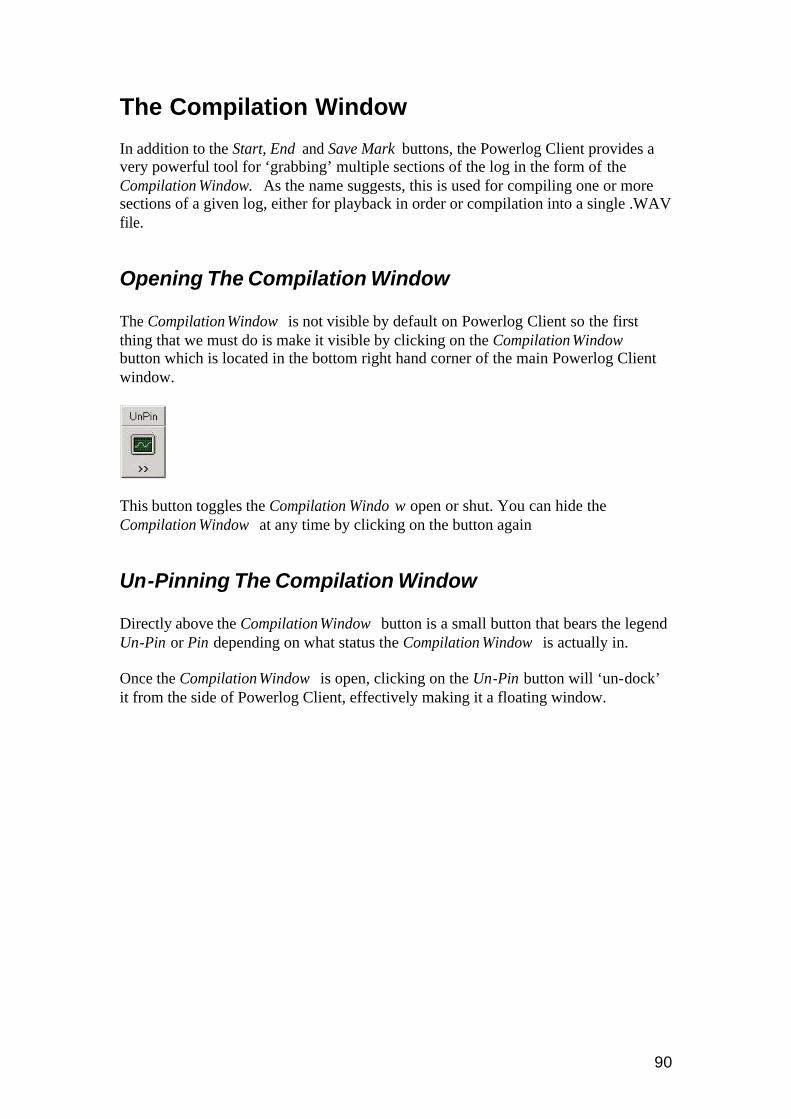
90
The Compilation Window In addition to the Start, End and Save Mark buttons, the Powerlog Client provides a very powerful tool for ‘grabbing’ multiple sections of the log in the form of the Compilation Window. As the name suggests, this is used for compiling one or more sections of a given log, either for playback in order or compilation into a single .WAV file.
Opening The Compilation Window The Compilation Window is not visible by default on Powerlog Client so the first thing that we must do is make it visible by clicking on the Compilation Window button which is located in the bottom right hand corner of the main Powerlog Client window.
This button toggles the Compilation Windo w open or shut. You can hide the Compilation Window at any time by clicking on the button again
Un-Pinning The Compilation Window Directly above the Compilation Window button is a small button that bears the legend Un-Pin or Pin depending on what status the Compilation Window is actually in. Once the Compilation Window is open, clicking on the Un-Pin button will ‘un-dock’ it from the side of Powerlog Client, effectively making it a floating window.

91
Compilation Window Pinned To Powerlog Client
Compilation Window Un-Pinned From Powerlog Client
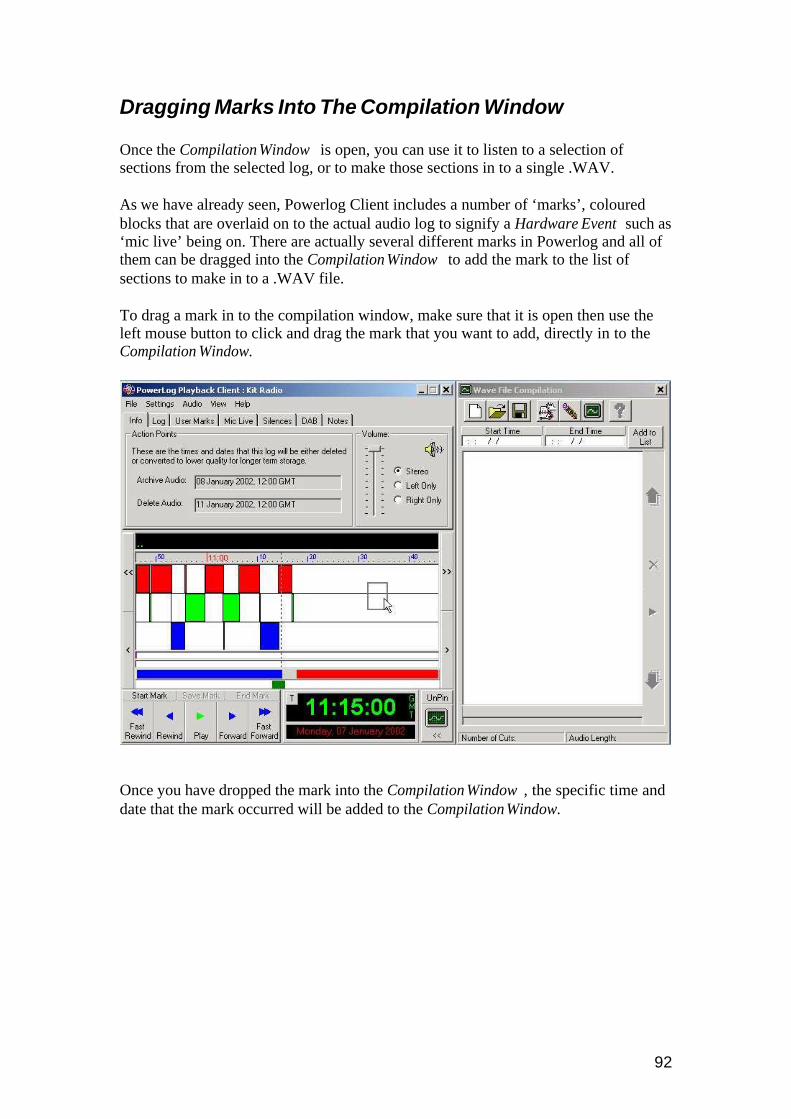
92
Dragging Marks Into The Compilation Window Once the Compilation Window is open, you can use it to listen to a selection of sections from the selected log, or to make those sections in to a single .WAV. As we have already seen, Powerlog Client includes a number of ‘marks’, coloured blocks that are overlaid on to the actual audio log to signify a Hardware Event such as ‘mic live’ being on. There are actually several different marks in Powerlog and all of them can be dragged into the Compilation Window to add the mark to the list of sections to make in to a .WAV file. To drag a mark in to the compilation window, make sure that it is open then use the left mouse button to click and drag the mark that you want to add, directly in to the Compilation Window.
Once you have dropped the mark into the Compilation Window , the specific time and date that the mark occurred will be added to the Compilation Window.

93
You can drag several marks into the Compilation Wind ow to create a list of sections from the log. You can also mix the types of marks that are added to the Compilation Window . The listed below are all the different marks that you may encounter when using the Powerlog Client, what they do and whether you can drag them in to the Compilation Window .
Mark Type Description Can Be Dragged?
Hardware Mark Hardware events such as ‘mic live’
Yes
User Mark Manually added to log to mark area
Yes
Silence Mark Marks periods of silences in the log
Yes
Start / End Mark Manually mark sections for making .WAV’s
Yes
DAB Text List of transmitted DAB Text on DAB Tab
Yes
In all of the above cases, you can also drag from the lists located on each type of mark’s corresponding tab. This means that if you click on the Silence s tab, you will see a text list of all the Silence Marks for the log on the day in question, you can use the left mouse button to drag from here directly in to the Compilation Window. For details on how to listen to the contents of the Compilation Window or to make a .WAV file, see page 90, The Compilation Window .

94
Adding Specific Times And Dates To The Compilation Window As well as dragging specific Hardware, User, Silence, DAB and Start/End Marks in to the Compilation Window , you can also specify a start and end time and date to be added to the list. To do this, make sure that the Compilation Window is open and type in the time and date for the start and end of the section of the log that you want to add to the list.
In the above example, 7 minutes will be added to the list to be compiled. The time selected is from 10:23 am to 10:30 am on the 7th January 2002. You can also click on the Start Time or End Time buttons to select a start and end time and date using the Powerlog Client calendar.

95
Once you are happy with the Start Time and End Time , click on the Add To List button to add the time and date selection into the main Compilation Window.
For details on how to listen to the sections listed in the Compilation Window or how to make them in to a .WAV file, see page 90, The Compilation Window .

96
Adding Multiple Marks From One Or More Shows In addition to dragging the various marks in Powerlog Client in to the Compilation Window , you can also use a special feature of the Client called Recurrent Segment Generation . This allows you to add all of a particular type of Hardware Mark into a log. This could be from a specific time period or even from the same time period over several days. This means that if you want to ‘grab’ all of the vocal links that your breakfast show DJ has done for the past six weeks then you can use the Recurrent Segment Generator to add in all the Hardware Marks generated by the hardware input from the presenter mic, between 6am and 9am for the past six weeks. This powerful feature is a little hard to get to grips with at first, but once mastered, it will open up a whole new level of access to the logs. To open the Recurrent Segment Generator click on the Recurrent Segment button which is located at the top of the Compilation Window next to the Save Compilation button.
This will open the standard Select Recurrent Segments window that allows you to select the time and date range that you want to select the marks from, the search pattern that you want to use to find the marks that you are looking for and the actual Hardware Marks that you want to include in your selection.

97
This window is divided into four main sections.
Search Date Range The top section is the Search Date Range , which allows you to select a start and end date between which you want to search for particular Hardware Marks within the log. The options are as follows: Start: Allows you to enter a date from which to start your search for Hardware Marks from. You can use the drop down list to select the desired date from the Calendar window.

98
No End Date: This option does not put an end date on the search for Hardware Marks so it will find all of the selected Hardware Marks from the Start date until the latest log recorded on to the system. End After X Occurrences: This option allows you to place an upper limit on the amount of Hardware Marks it finds. Say for example you select the Start date as 22nd January and the End After X Occurrences is set to 15 then it will start at the beginning of the 22nd and keep searching until 15 individual Hardware Marks of the selected type have been found, or until it runs out of log to search through. End By: The final option allows you to select and end date for searching by selecting the End date from the drop down calendar.
Search Time Range In addition to selecting the date, Search Time Range allows you to specify a particular time range to search in with the given date range. This means that instead of searching for all the occurrences of a particular Hardware Mark within a given date range, you can restrict the search to only the hours that you are interested in. The optional are as follows: Start: The Start option allows you to state a time to start searching from within the selected date range. End By: You can then set the End time for your search. End After: Alternatively you can specify a particular time period after which to stop searching using the drop down End After menu.

99
Search Pattern The Search Pattern option allows you to specify a particular search pattern to use for searching for Hardware Marks within the specified time and date parameters. The options are as follows: Daily: You can restrict the search pattern to only use Hardware Marks from every X days (using the drop down list) or only weekdays or only weekends. Weekly: By selecting the weekly option, you can restrict the search pattern to work every X weeks (using the drop down menu) or to only work on specific days of the week (by ticking the box by the desired day). Monthly: You can also restrict the search pattern to look at specific days of the month by either specifying the day of the month that you want to search (i.e. the 4th day of the month) or by using the drop down menus you can specify specific times in the month such as the second Tuesday of the month. This option has a number of possible out settings; you should take a few seconds to look at the possible configurations to see which of them are most useful to you.
Hardware Lines The final section is the Hardware Lines section that allows you to select which of the Hardware Inputs to include in your search. The Hardware Marks that are displayed on the Powerlog Server are generated by physical events in the ‘real world’ triggering hardware inputs in to the Powerlog Server. These Hardware Lines are then given a suitable description and displayed along with the log on the Powerlog Client. The Hardware Lines section allows you to select which of that Hardware Lines that you wan to include in your search. Click on the Insert button to bring up a list of all the Hardware Lines that are available and tick any that you want to be included in your search for all the specified Hardware Marks within the specified time and date range.

100
Starting The Search When you have finished selecting the time and date range and have selected the Hardware Marks that you are interested in, you can generate a list of all the Hardware Marks that meet your criteria in the Compilation Window by clicking on Generate Se gments , located on the lower right-hand corner of the window.
The results of the search are automatically displayed (after a couple of moments depending on the size of the search) in the Compilation Window although the Recurrent Segment Generator window will remain open so you can do another search if you want to.

101
Example: Grabbing Every Vocal Link From Last Week’s Breakfast Shows
To demonstrate how to use this facility in Powerlog Client, we are actually going to work through an example, which will highlight all of the basic features and show how they combine to achieve the results that you want. For this example, lets say that we want to get all the links the main DJ made on the breakfast show last week. To get started, the first thing that we must do is click on the Recurrent Segment button that is located at the top of the Compilation Window next to the Remove Item button.
Next, we want to select the start and end date for our search, so we enter the Start date of a week ago and as we are interested in the links up to this morning, we can leave the end date as No End Date. Having set the date range, we next want to add the time range that we are interested in. Lets say the breakfast show runs from 6am to 10 am, then we just enter this time range in to the Search Time Range section of the screen.
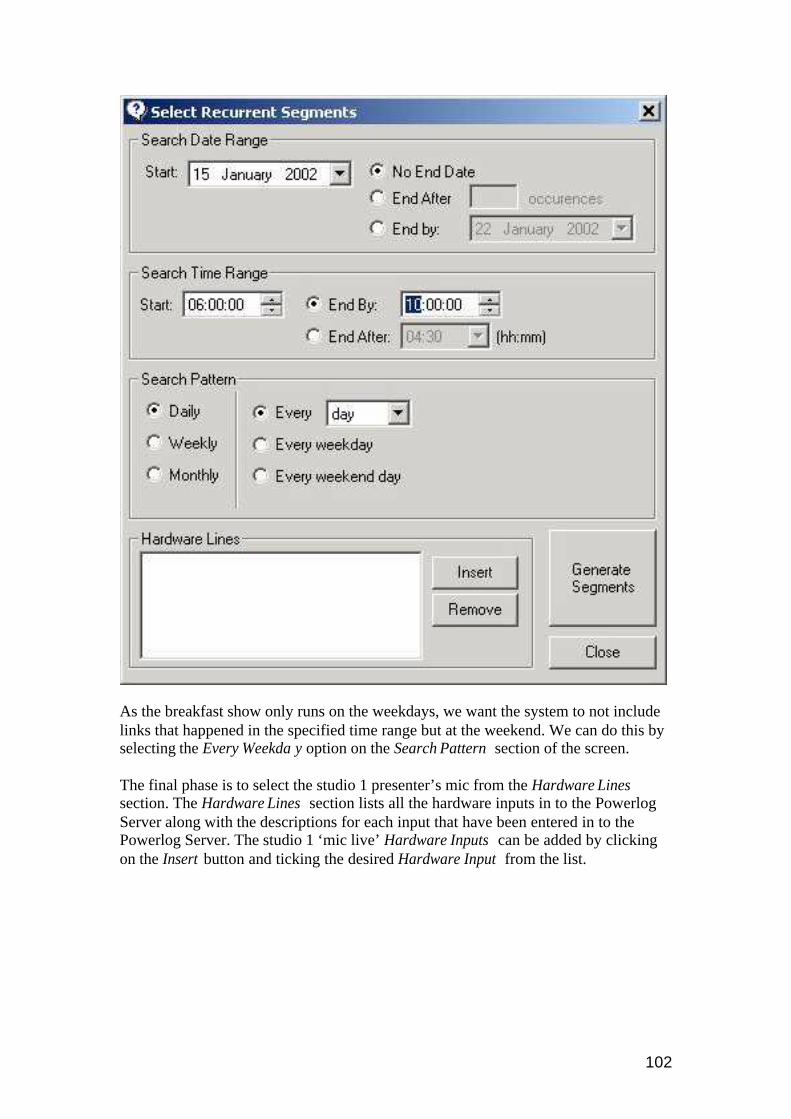
102
As the breakfast show only runs on the weekdays, we want the system to not include links that happened in the specified time range but at the weekend. We can do this by selecting the Every Weekda y option on the Search Pattern section of the screen. The final phase is to select the studio 1 presenter’s mic from the Hardware Lines section. The Hardware Lines section lists all the hardware inputs in to the Powerlog Server along with the descriptions for each input that have been entered in to the Powerlog Server. The studio 1 ‘mic live’ Hardware Inputs can be added by clicking on the Insert button and ticking the desired Hardware Input from the list.

103
We are now ready to search for the Hardware M arks that we have specified. To begin the search, click on the Generate Segments button. After a couple of minutes, all of the selected Hardware Marks within the specified time and date range will be displayed in the standard Compilation Manager .

104
The results will appear in the Compilation Window after a few moments but the Recurrent Segments Generator window will remain open so that you can perform more searches, the results of which will be added to any existing items in the Compilation Window. N.B. If you did not want to grab just the mic links but instead wanted to grab each weekday’s entire breakfast show, you could miss off the last step where we added in the Hardware Lines .

105
Changing The Order Of Items In The Compilation Window If you add several items to the Compilation Window they will be displayed in the order that they will be compiled when making a .WAV file.
Once you have several items in the list ready to be compiled, you can change the order that they will be played / compiled by moving individual items up or down the list. To do this, highlight the item that you want to move then click on the Up and Down Arrow button located to the right of the list.
Alternatively, you could also us your mouse’s right button to ‘right click’ on the item you want to move and select Move Item Up / Down .

106
Removing Items From The Compilation Window You can also easily remove items from the Compilation Window by clicking on the Remove Item (X Button) Button located to the right of the actual list.
Alternatively, you can also use the right click option on any item to remove it from the Compilation Window .

107
Right click on the item that you want to remove and select Delete from the menu. Finally, you can use the Remove Item button located at the top of the Compilation Window located next to the Compile button. The icon is supposed to be a pencil with an eraser on the end but looks more like a shish kebab on a spit.
Any of these options will remove the highlighted item from the list of sections to be compiled.
Listening To The Items Listed In The Compilation Window Once you have a list of items in the Compilation Window you can listen to the sections of the logs that you have added by clicking on the Play button that is located directly to the right of the main Compilation Window .

108
Once you have clicked on the Play button on the Compilation Window , playback from the main Powerlog Client will pause and the first item in the list will automatically start to play back. Information about the item playing is displayed at the bottom of the Compilation Window .
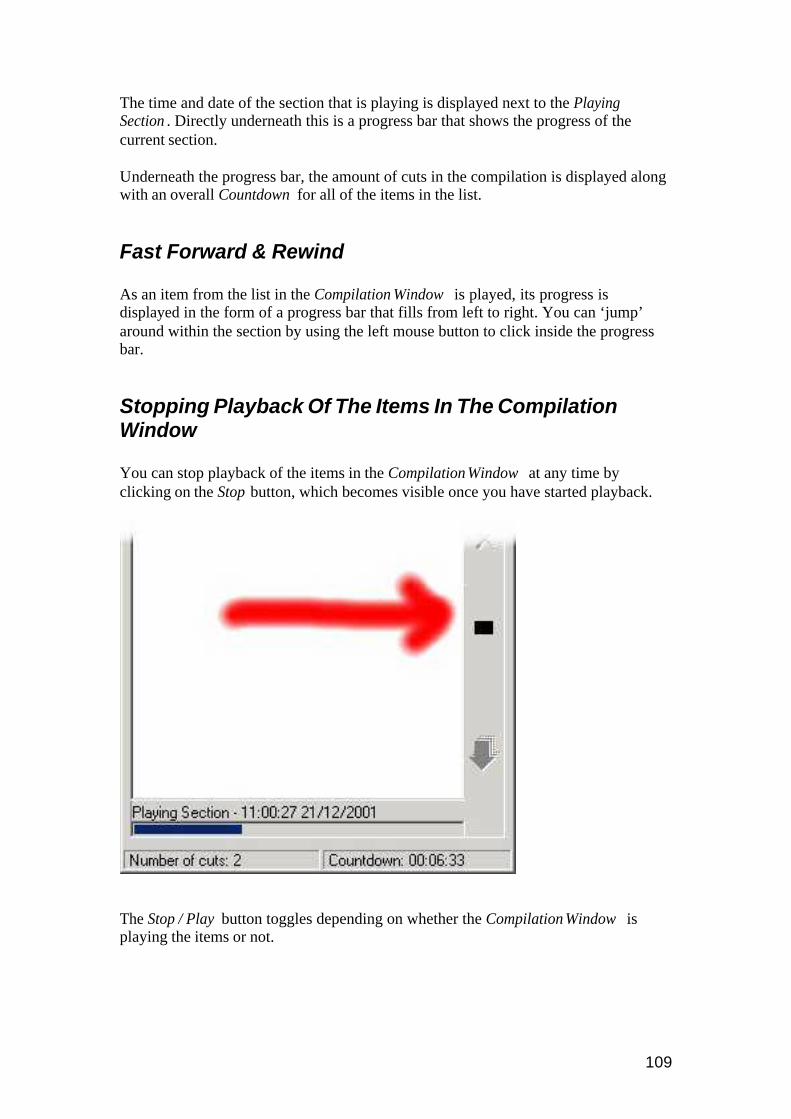
109
The time and date of the section that is playing is displayed next to the Playing Section . Directly underneath this is a progress bar that shows the progress of the current section. Underneath the progress bar, the amount of cuts in the compilation is displayed along with an overall Countdown for all of the items in the list.
Fast Forward & Rewind As an item from the list in the Compilation Window is played, its progress is displayed in the form of a progress bar that fills from left to right. You can ‘jump’ around within the section by using the left mouse button to click inside the progress bar.
Stopping Playback Of The Items In The Compilation Window You can stop playback of the items in the Compilation Window at any time by clicking on the Stop button, which becomes visible once you have started playback.
The Stop / Play button toggles depending on whether the Compilation Window is playing the items or not.
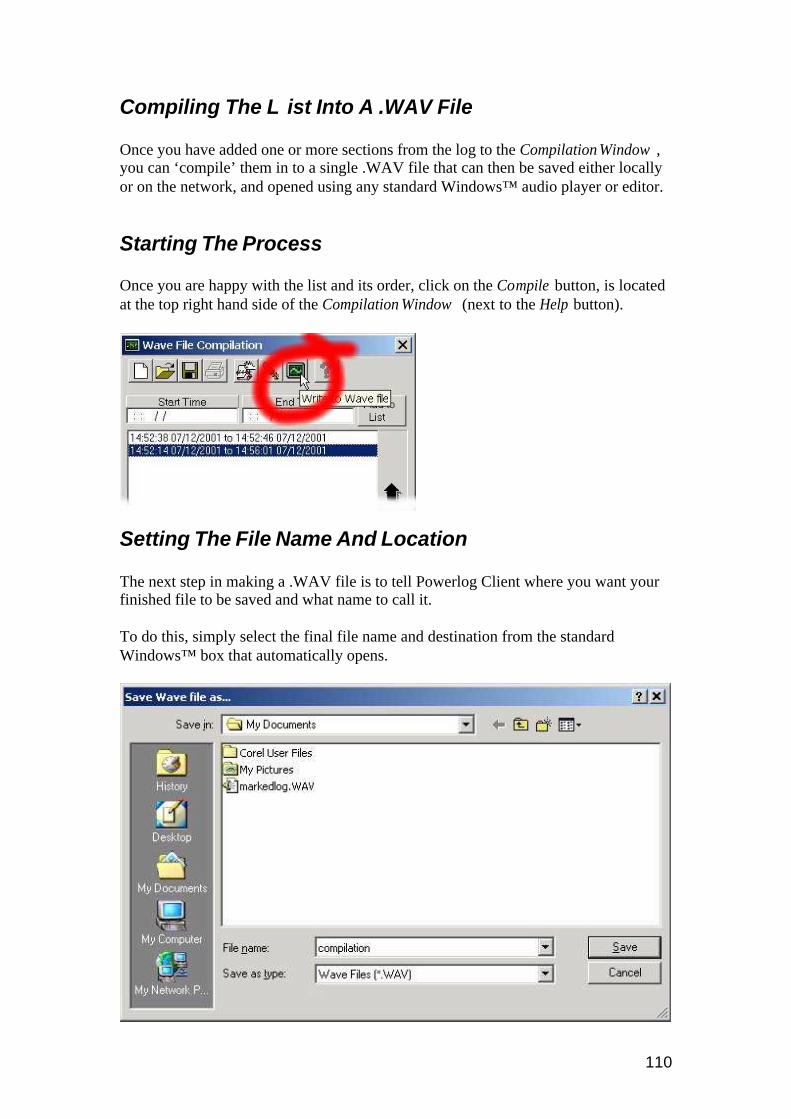
110
Compiling The L ist Into A .WAV File Once you have added one or more sections from the log to the Compilation Window , you can ‘compile’ them in to a single .WAV file that can then be saved either locally or on the network, and opened using any standard Windows™ audio player or editor.
Starting The Process Once you are happy with the list and its order, click on the Compile button, is located at the top right hand side of the Compilation Window (next to the Help button).
Setting The File Name And Location The next step in making a .WAV file is to tell Powerlog Client where you want your finished file to be saved and what name to call it. To do this, simply select the final file name and destination from the standard Windows™ box that automatically opens.
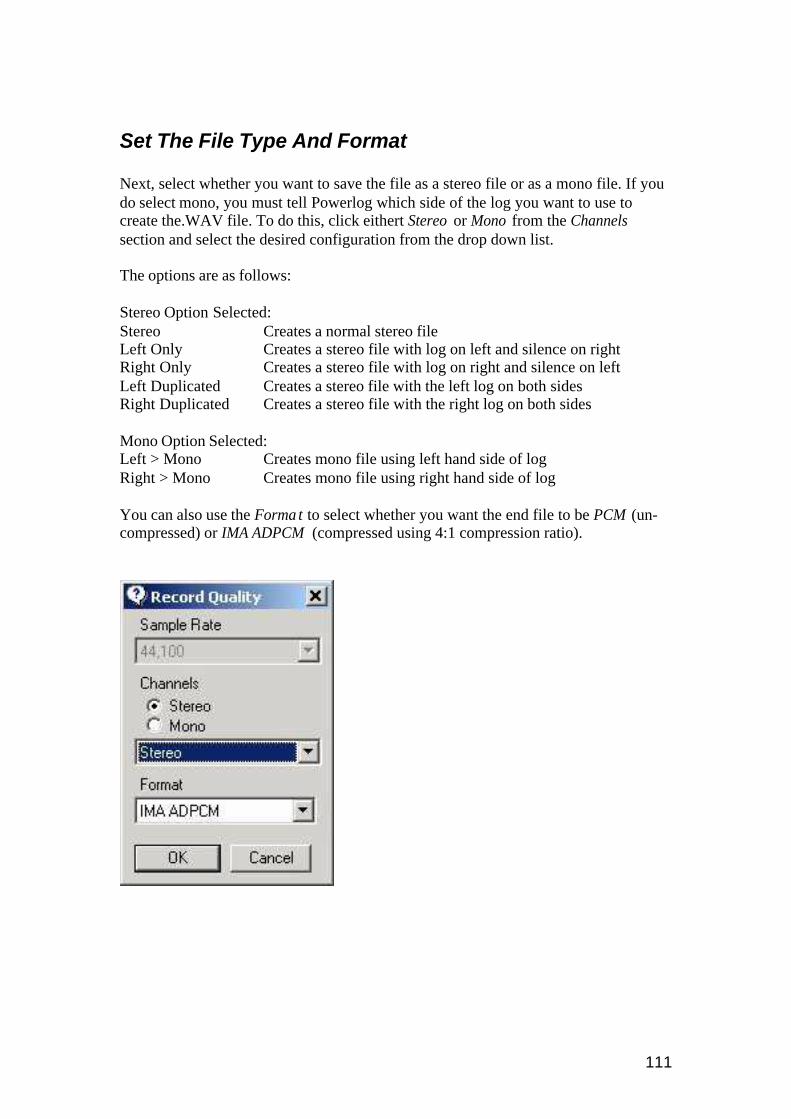
111
Set The File Type And Format Next, select whether you want to save the file as a stereo file or as a mono file. If you do select mono, you must tell Powerlog which side of the log you want to use to create the.WAV file. To do this, click eithert Stereo or Mono from the Channels section and select the desired configuration from the drop down list. The options are as follows: Stereo Option Selected: Stereo Creates a normal stereo file Left Only Creates a stereo file with log on left and silence on right Right Only Creates a stereo file with log on right and silence on left Left Duplicated Creates a stereo file with the left log on both sides Right Duplicated Creates a stereo file with the right log on both sides Mono Option Selected: Left > Mono Creates mono file using left hand side of log Right > Mono Creates mono file using right hand side of log You can also use the Forma t to select whether you want the end file to be PCM (un-compressed) or IMA ADPCM (compressed using 4:1 compression ratio).

112
Generating The Finished .WAV File When you have finished setting your file type and format on the Record Quality window, click on the OK button to begin to generate the .WAV file.
While the Compilation Window is compiling your .WAV file, the window is ‘greyed’ out and cannot be used with the exception of the Cancel button which can be used to abort writing the .WAV file. This process may take several minutes depending on the size of the file. Once the Compilation Window has finished compiling your .WAV file, you will get a little message, telling you that it was successful.

113
Loading, Saving And Clearing Compilations Once you have put all the hard work in to creating a list of items in the Compilation Window , you may well want to save your masterpiece for posterity, to show off to your friends, or to secretly listen to on your headphone when the boss is explaining the finer points of fly fishing to you at the next programming meeting. Whatever the reason, you can save the items in the Compilation Window by clicking on the Save button located at the top of the window.
Clicking on this button will allow you to enter a file name and location for your saved compilation. The file will be saved as a .cmp file and can be opened by any Powerlog Client that has network access to the file you have saved. N.B. The compilation file will only be valid while the audio remains on the Powerlog Server system. Once that section of the log has been deleted, the compilation file will be rendered useless. If you wish to keep the audio from your compilation for a longer period of time, you should make it into a .WAV file that can be saved for future use (see page 110, Compiling The List Into A .WAV File )

114
To load this compilation list back in to the Compilation Window, click on the Load button located at the top of the Compilation Window and locate the file that you want to load.
You can load multiple compilation files into the Compilation Window , each additional list is added to the bottom of the previous one. Finally, you can clear all of the items in the Compilation Window by clicking on the Clear button that is located to at the top left of the Compilation Window .
Caution: This button automatically clears all the entries in the Compilation Window without confirming, so use it carefully.

115