powerpoint presentation · it took our gdp almost st60 years to reach 1 us $ trillion; but only 7...
TRANSCRIPT

April 2016
Contents
Why India ?
India’s Next trillion Dollar Era
New Cycle of earnings growth
Current Valuations below decadal average
Why Motilal Oswal PMS?
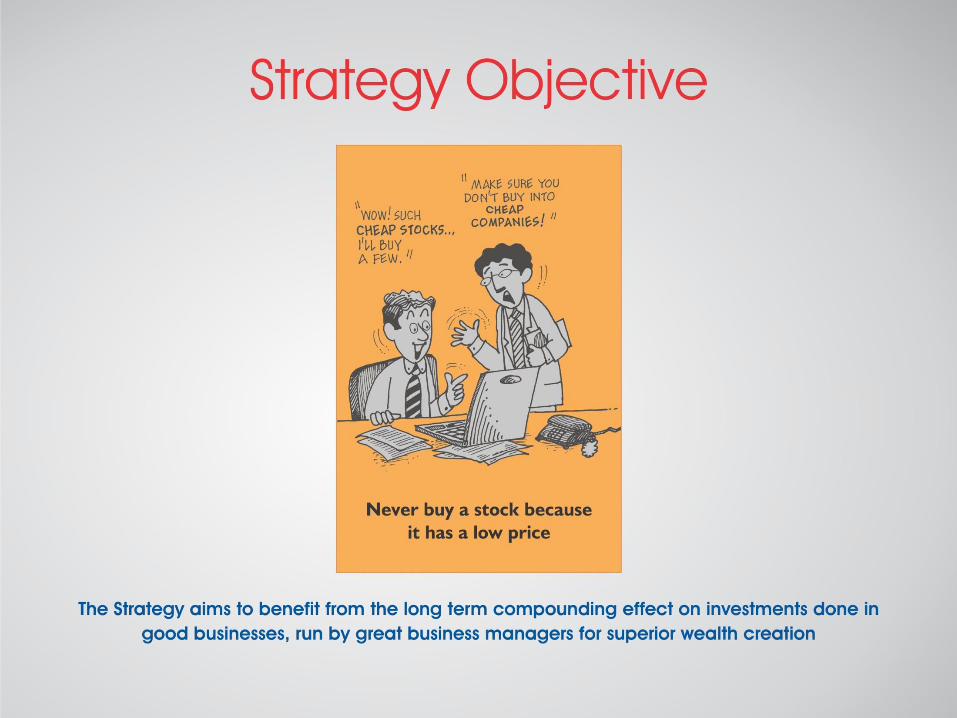
Why Value ?
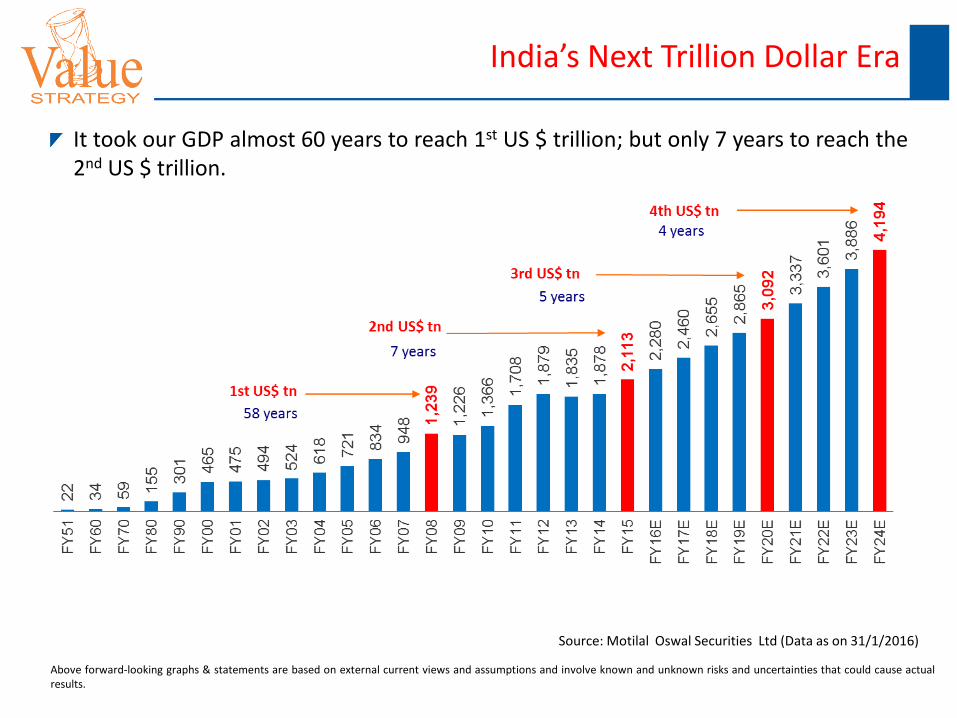
It took our GDP almost 60 years to reach 1st US $ trillion; but only 7 years to reach the 2nd US $ trillion.
Source: Motilal Oswal Securities Ltd (Data as on 31/1/2016)
Above forward-looking graphs & statements are based on external current views and assumptions and involve known and unknown risks and uncertainties that could cause actual results.
India’s Next Trillion Dollar Era
New cycle of earnings growth
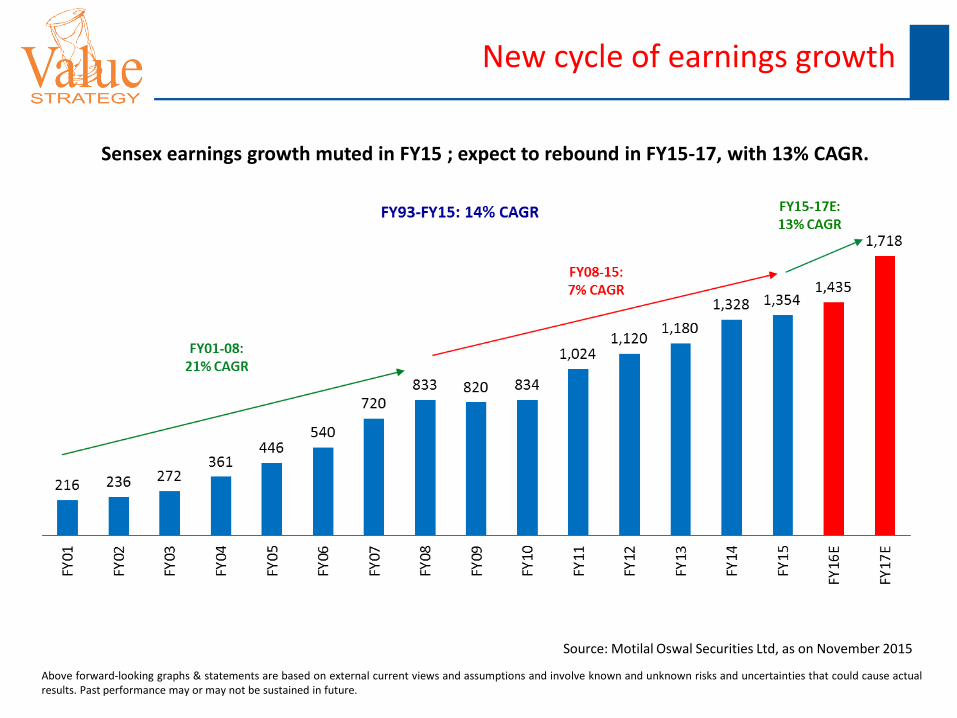
Sensex earnings growth muted in FY15 ; expect to rebound in FY15-17, with 13% CAGR.
Source: Motilal Oswal Securities Ltd, as on November 2015
Above forward-looking graphs & statements are based on external current views and assumptions and involve known and unknown risks and uncertainties that could cause actual results. Past performance may or may not be sustained in future.
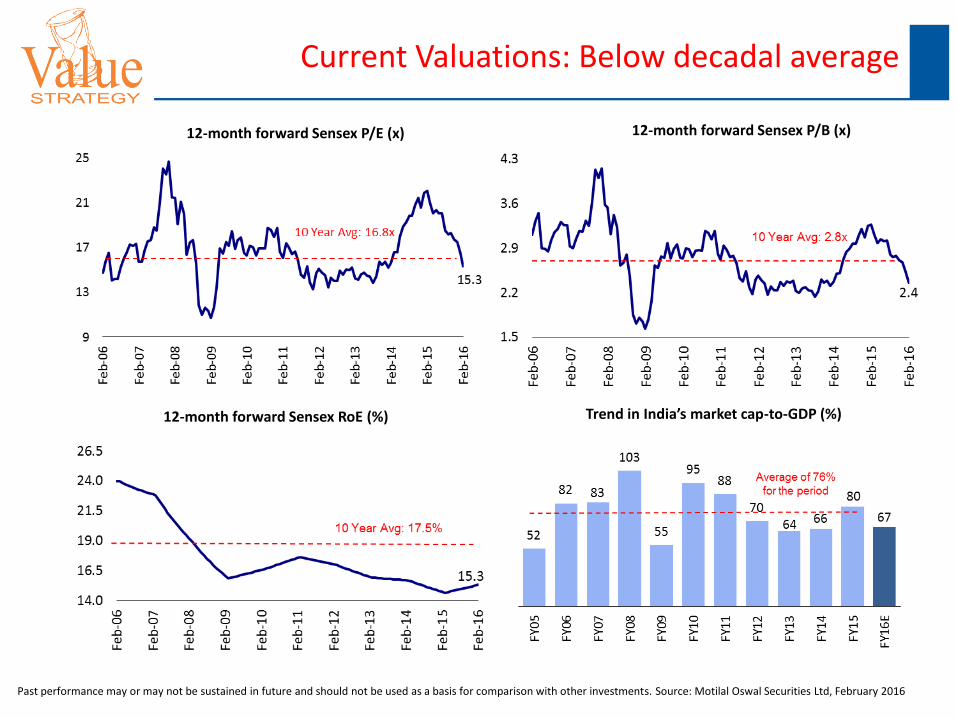
Current Valuations: Below decadal average
Past performance may or may not be sustained in future and should not be used as a basis for comparison with other investments. Source: Motilal Oswal Securities Ltd, February 2016
12-month forward Sensex P/E (x) 12-month forward Sensex P/B (x)
12-month forward Sensex RoE (%) Trend in India’s market cap-to-GDP (%)
Why Motilal Oswal PMS ?
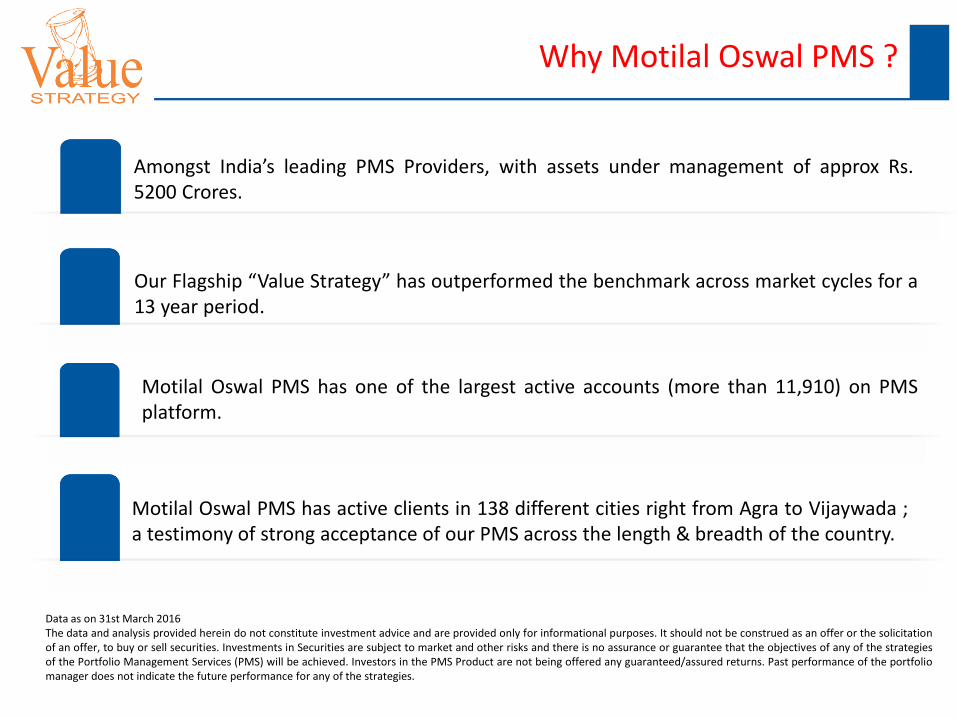
Amongst India’s leading PMS Providers, with assets under management of approx Rs. 5200 Crores.
Our Flagship “Value Strategy” has outperformed the benchmark across market cycles for a 13 year period.
Motilal Oswal PMS has one of the largest active accounts (more than 11,910) on PMS platform.
Motilal Oswal PMS has active clients in 138 different cities right from Agra to Vijaywada ; a testimony of strong acceptance of our PMS across the length & breadth of the country.
Data as on 31st March 2016 The data and analysis provided herein do not constitute investment advice and are provided only for informational purposes. It should not be construed as an offer or the solicitation of an offer, to buy or sell securities. Investments in Securities are subject to market and other risks and there is no assurance or guarantee that the objectives of any of the strategies of the Portfolio Management Services (PMS) will be achieved. Investors in the PMS Product are not being offered any guaranteed/assured returns. Past performance of the portfolio manager does not indicate the future performance for any of the strategies.
Our investment philosophy – ‘Buy Right : Sit Tight’
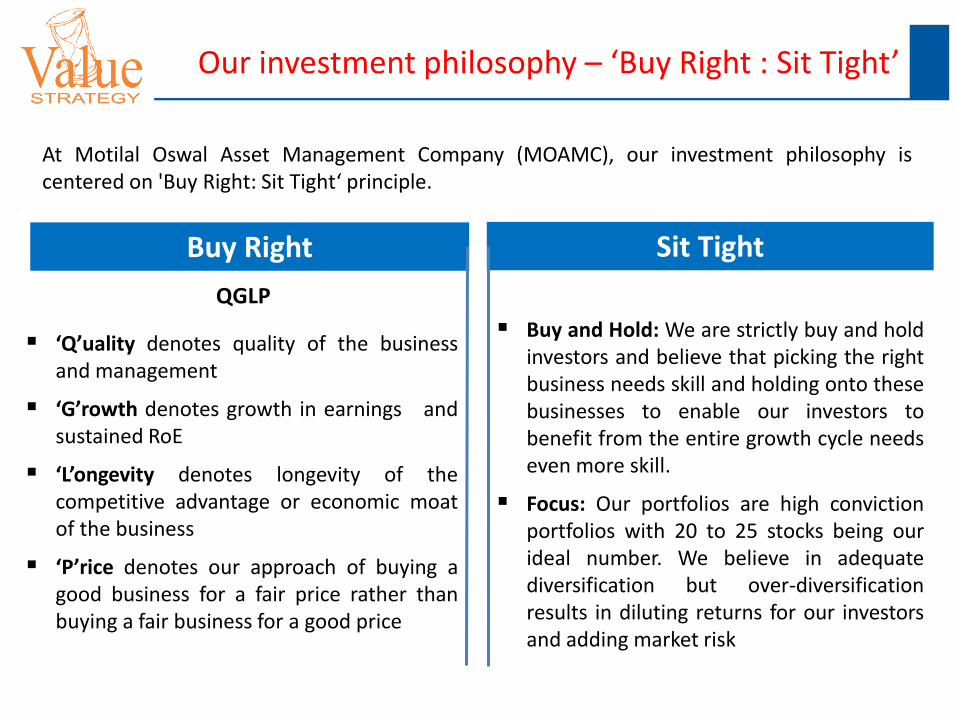
At Motilal Oswal Asset Management Company (MOAMC), our investment philosophy is centered on 'Buy Right: Sit Tight‘ principle.
Buy Right Sit Tight
‘Q’uality denotes quality of the business and management
‘G’rowth denotes growth in earnings and sustained RoE
‘L’ongevity denotes longevity of the competitive advantage or economic moat of the business
‘P’rice denotes our approach of buying a good business for a fair price rather than buying a fair business for a good price
Buy and Hold: We are strictly buy and hold investors and believe that picking the right business needs skill and holding onto these businesses to enable our investors to benefit from the entire growth cycle needs even more skill.
Focus: Our portfolios are high conviction portfolios with 20 to 25 stocks being our ideal number. We believe in adequate diversification but over-diversification results in diluting returns for our investors and adding market risk
QGLP
Why ‘Buy Right : Sit Tight’ is significant?
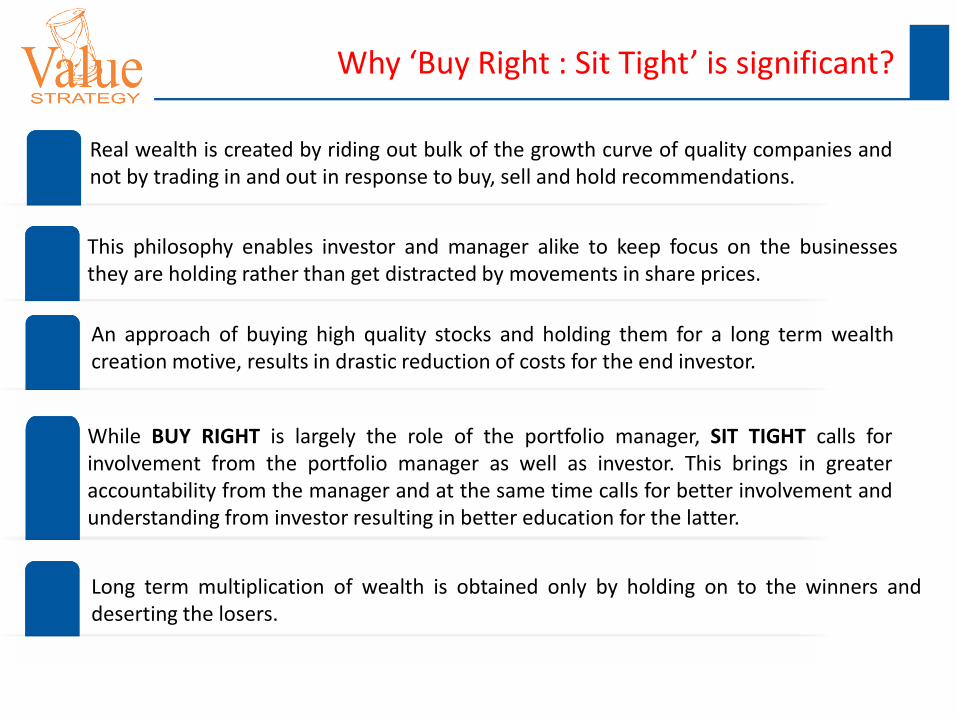
Long term multiplication of wealth is obtained only by holding on to the winners and deserting the losers.
Real wealth is created by riding out bulk of the growth curve of quality companies and not by trading in and out in response to buy, sell and hold recommendations.
This philosophy enables investor and manager alike to keep focus on the businesses they are holding rather than get distracted by movements in share prices.
An approach of buying high quality stocks and holding them for a long term wealth creation motive, results in drastic reduction of costs for the end investor.
While BUY RIGHT is largely the role of the portfolio manager, SIT TIGHT calls for involvement from the portfolio manager as well as investor. This brings in greater accountability from the manager and at the same time calls for better involvement and understanding from investor resulting in better education for the latter.
Wealth Creators - Buy and Hold Strategy
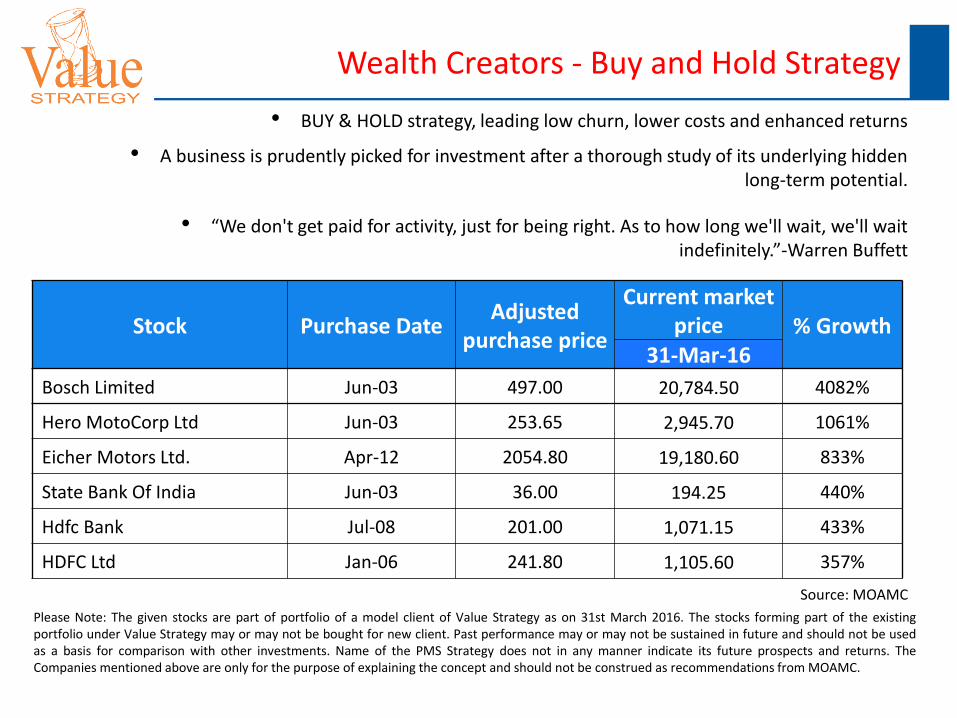
• BUY & HOLD strategy, leading low churn, lower costs and enhanced returns
• A business is prudently picked for investment after a thorough study of its underlying hidden long-term potential.
• “We don't get paid for activity, just for being right. As to how long we'll wait, we'll wait indefinitely.”-Warren Buffett
Please Note: The given stocks are part of portfolio of a model client of Value Strategy as on 31st March 2016. The stocks forming part of the existing portfolio under Value Strategy may or may not be bought for new client. Past performance may or may not be sustained in future and should not be used as a basis for comparison with other investments. Name of the PMS Strategy does not in any manner indicate its future prospects and returns. The Companies mentioned above are only for the purpose of explaining the concept and should not be construed as recommendations from MOAMC.
Source: MOAMC
Stock Purchase Date Adjusted
purchase price
Current market price % Growth
31-Mar-16
Bosch Limited Jun-03 497.00 20,784.50 4082%
Hero MotoCorp Ltd Jun-03 253.65 2,945.70 1061%
Eicher Motors Ltd. Apr-12 2054.80 19,180.60 833%
State Bank Of India Jun-03 36.00 194.25 440%
Hdfc Bank Jul-08 201.00 1,071.15 433%
HDFC Ltd Jan-06 241.80 1,105.60 357%
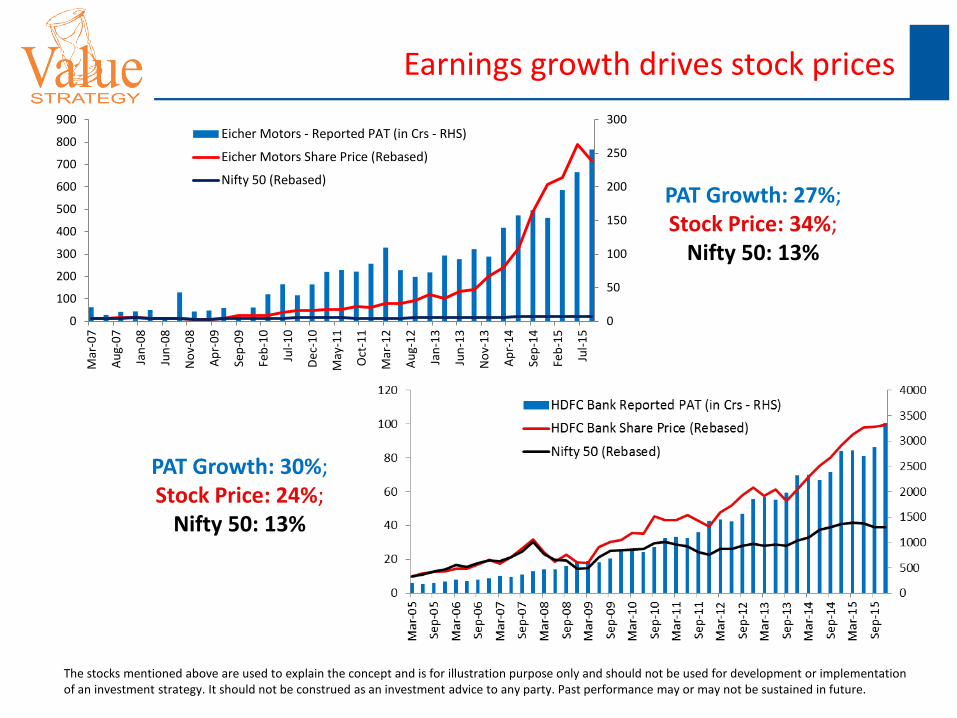
Earnings growth drives stock prices
0
50
100
150
200
250
300
0
100
200
300
400
500
600
700
800
900
Mar
-07
Au
g-0
7
Jan
-08
Jun
-08
No
v-0
8
Ap
r-0
9
Sep
-09
Feb
-10
Jul-
10
De
c-1
0
May
-11
Oct
-11
Mar
-12
Au
g-1
2
Jan
-13
Jun
-13
No
v-1
3
Ap
r-1
4
Sep
-14
Feb
-15
Jul-
15
Eicher Motors - Reported PAT (in Crs - RHS)
Eicher Motors Share Price (Rebased)
Nifty 50 (Rebased)
The stocks mentioned above are used to explain the concept and is for illustration purpose only and should not be used for development or implementation of an investment strategy. It should not be construed as an investment advice to any party. Past performance may or may not be sustained in future.
PAT Growth: 27%; Stock Price: 34%;
Nifty 50: 13%
PAT Growth: 30%; Stock Price: 24%;
Nifty 50: 13%
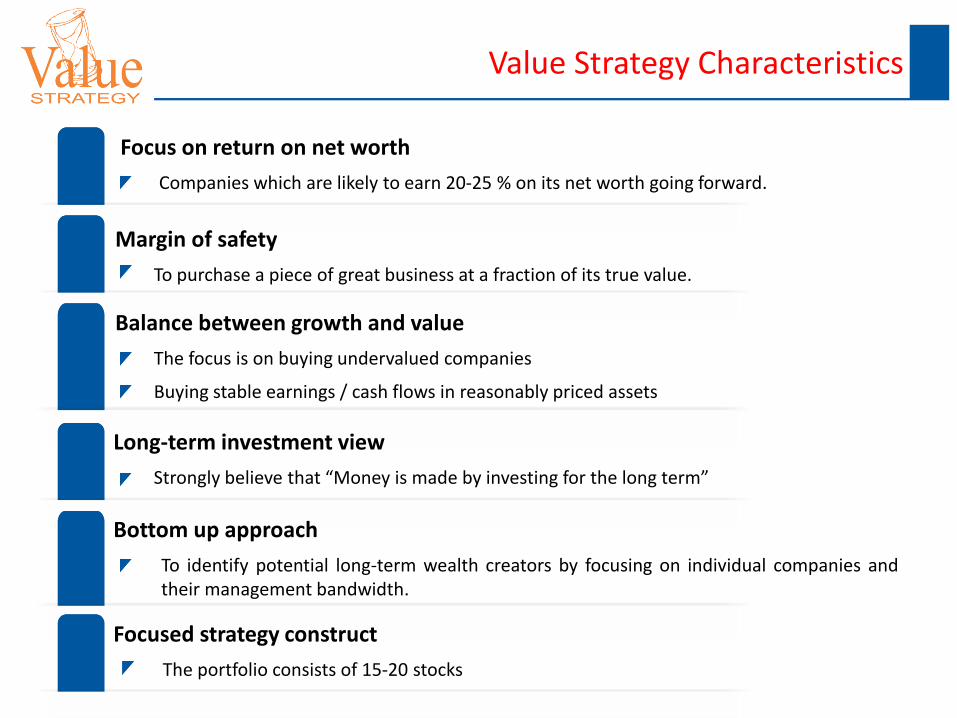
Value Strategy Characteristics
Focused strategy construct
The portfolio consists of 15-20 stocks
Focus on return on net worth
Companies which are likely to earn 20-25 % on its net worth going forward.
Margin of safety
To purchase a piece of great business at a fraction of its true value.
Balance between growth and value
The focus is on buying undervalued companies
Buying stable earnings / cash flows in reasonably priced assets
Long-term investment view
Strongly believe that “Money is made by investing for the long term”
Bottom up approach
To identify potential long-term wealth creators by focusing on individual companies and their management bandwidth.
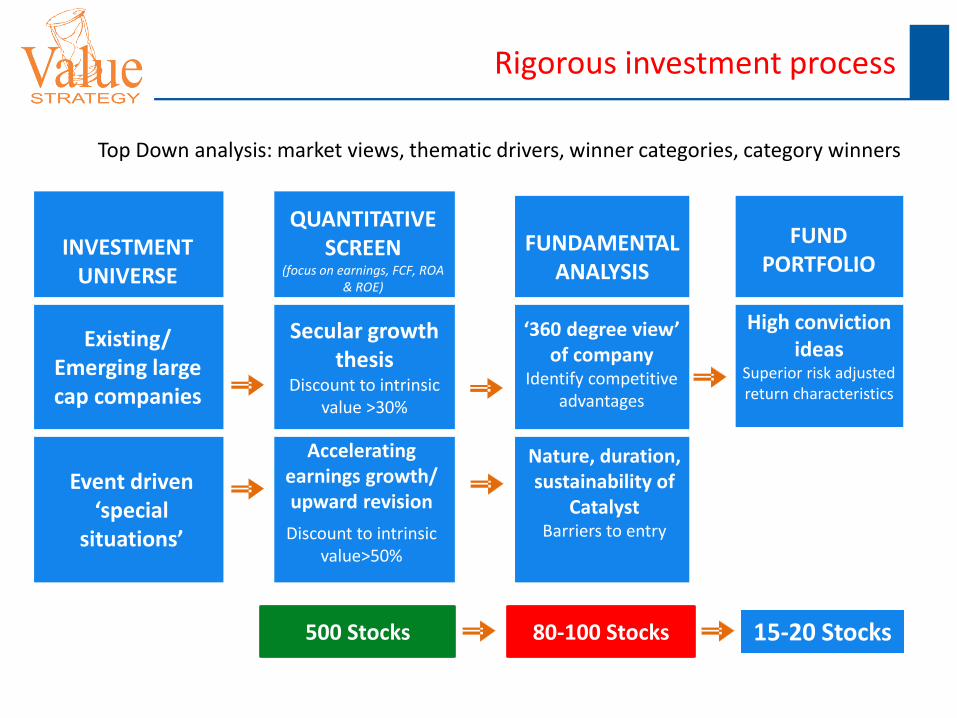
Top Down analysis: market views, thematic drivers, winner categories, category winners
Existing/ Emerging large cap companies
INVESTMENT UNIVERSE
Event driven ‘special
situations’
QUANTITATIVE SCREEN
(focus on earnings, FCF, ROA & ROE)
Secular growth thesis
Discount to intrinsic value >30%
Accelerating
earnings growth/ upward revision
Discount to intrinsic value>50%
FUNDAMENTAL ANALYSIS
‘360 degree view’ of company
Identify competitive advantages
Nature, duration, sustainability of
Catalyst Barriers to entry
FUND PORTFOLIO
High conviction ideas
Superior risk adjusted return characteristics
15-20 Stocks 500 Stocks 80-100 Stocks
Rigorous investment process
Value Strategy
Strategy objective
Risk-return matrix
Strategy construct
Model holding
Performance
Risk analysis
Fund management
Strategy structure
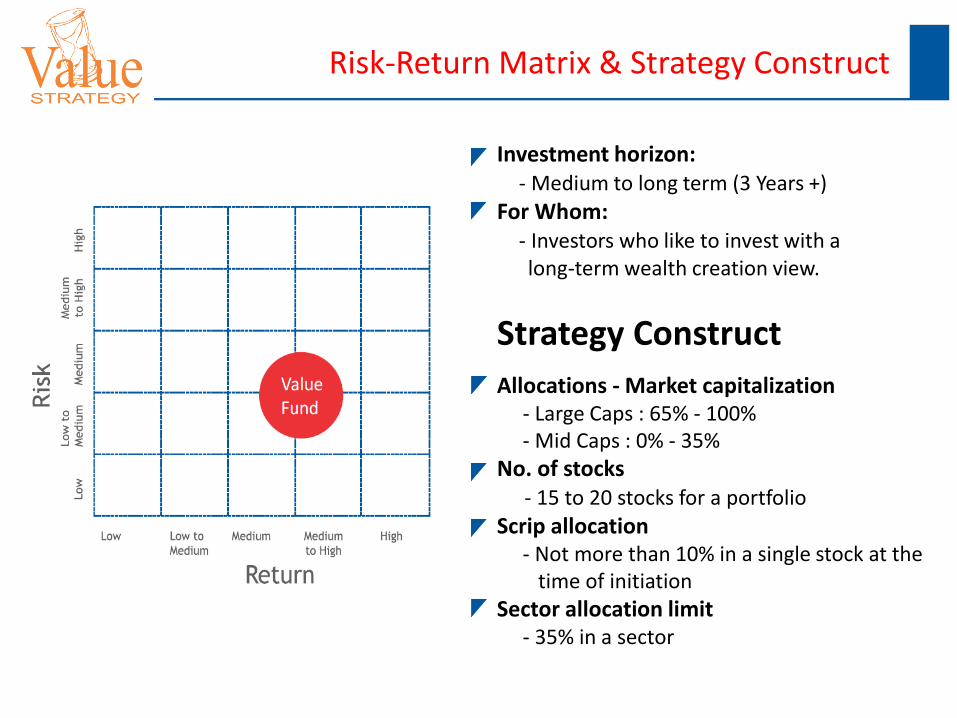
Investment horizon: - Medium to long term (3 Years +)
For Whom: - Investors who like to invest with a long-term wealth creation view.
Strategy Construct
Allocations - Market capitalization - Large Caps : 65% - 100% - Mid Caps : 0% - 35% No. of stocks - 15 to 20 stocks for a portfolio
Scrip allocation - Not more than 10% in a single stock at the time of initiation Sector allocation limit - 35% in a sector
Risk-Return Matrix & Strategy Construct
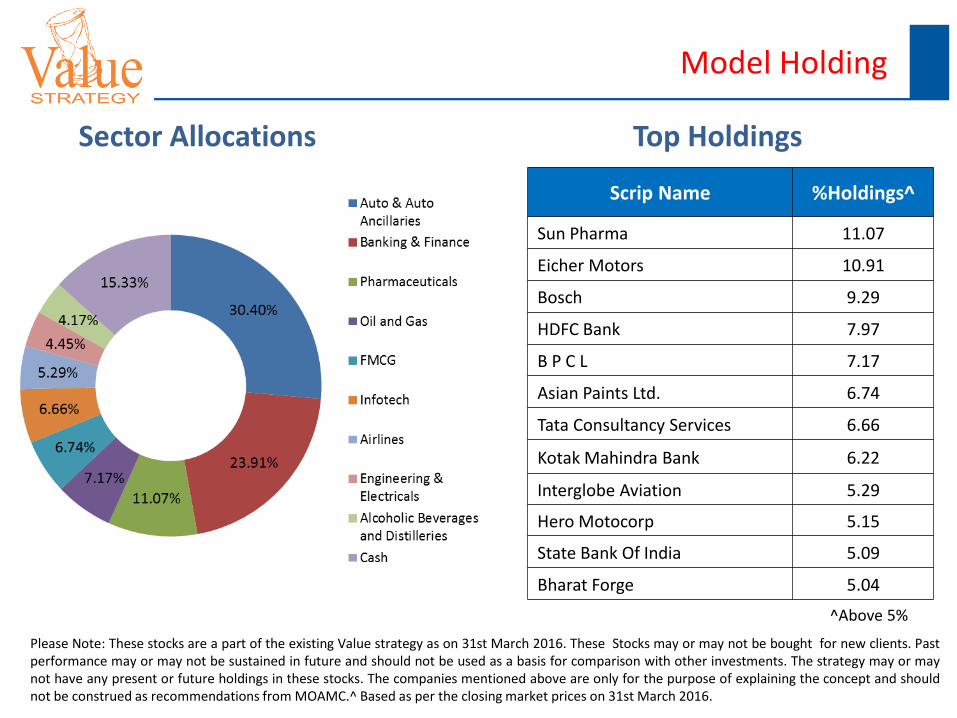
Model Holding
Sector Allocations Top Holdings
Scrip Name %Holdings^
Sun Pharma 11.07
Eicher Motors 10.91
Bosch 9.29
HDFC Bank 7.97
B P C L 7.17
Asian Paints Ltd. 6.74
Tata Consultancy Services 6.66
Kotak Mahindra Bank 6.22
Interglobe Aviation 5.29
Hero Motocorp 5.15
State Bank Of India 5.09
Bharat Forge 5.04
^Above 5%
Please Note: These stocks are a part of the existing Value strategy as on 31st March 2016. These Stocks may or may not be bought for new clients. Past performance may or may not be sustained in future and should not be used as a basis for comparison with other investments. The strategy may or may not have any present or future holdings in these stocks. The companies mentioned above are only for the purpose of explaining the concept and should not be construed as recommendations from MOAMC.^ Based as per the closing market prices on 31st March 2016.
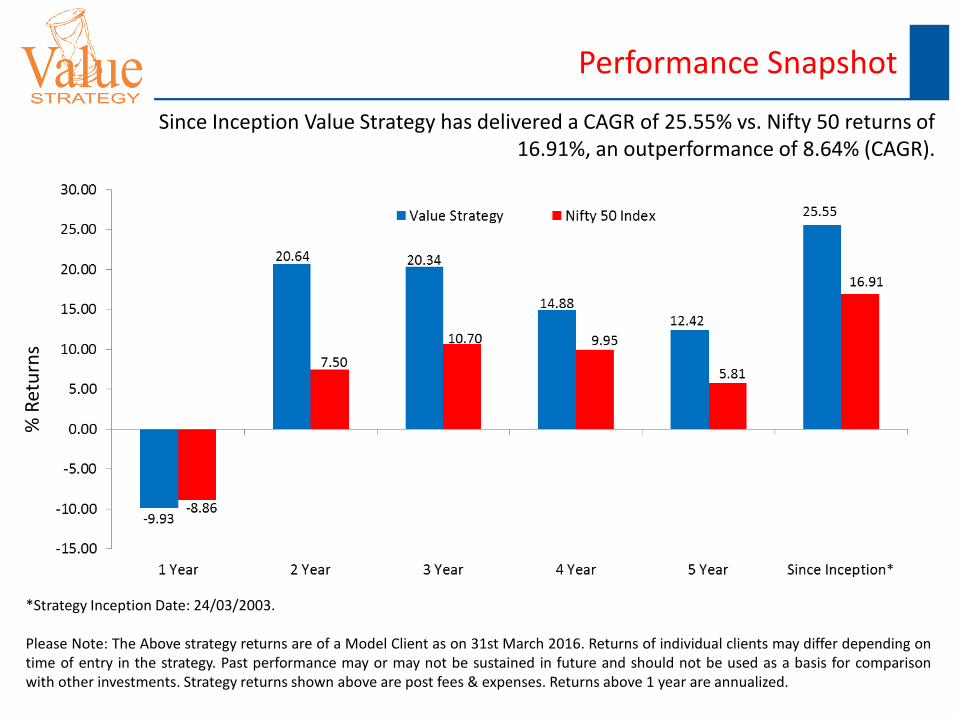
Since Inception Value Strategy has delivered a CAGR of 25.55% vs. Nifty 50 returns of 16.91%, an outperformance of 8.64% (CAGR).
Performance Snapshot
*Strategy Inception Date: 24/03/2003. Please Note: The Above strategy returns are of a Model Client as on 31st March 2016. Returns of individual clients may differ depending on time of entry in the strategy. Past performance may or may not be sustained in future and should not be used as a basis for comparison with other investments. Strategy returns shown above are post fees & expenses. Returns above 1 year are annualized.
% R
etu
rns
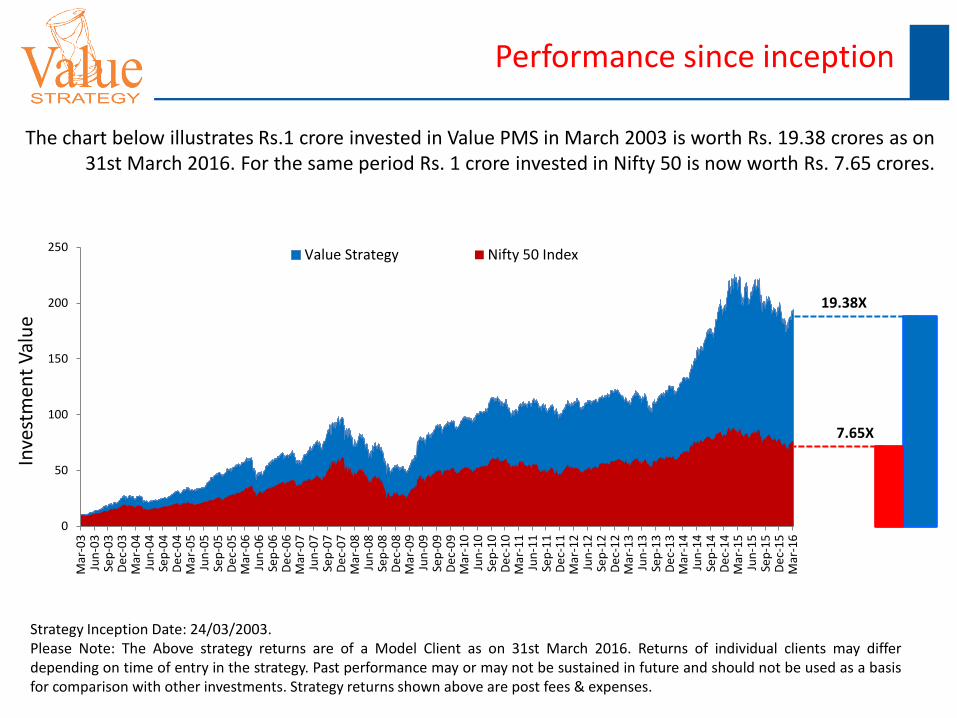
Performance since inception
The chart below illustrates Rs.1 crore invested in Value PMS in March 2003 is worth Rs. 19.38 crores as on 31st March 2016. For the same period Rs. 1 crore invested in Nifty 50 is now worth Rs. 7.65 crores.
Strategy Inception Date: 24/03/2003. Please Note: The Above strategy returns are of a Model Client as on 31st March 2016. Returns of individual clients may differ depending on time of entry in the strategy. Past performance may or may not be sustained in future and should not be used as a basis for comparison with other investments. Strategy returns shown above are post fees & expenses.
19.38X
7.65X
Inve
stm
ent
Val
ue
0
50
100
150
200
250
Mar
-03
Jun
-03
Sep
-03
De
c-0
3M
ar-0
4Ju
n-0
4Se
p-0
4D
ec-
04
Mar
-05
Jun
-05
Sep
-05
De
c-0
5M
ar-0
6Ju
n-0
6Se
p-0
6D
ec-
06
Mar
-07
Jun
-07
Sep
-07
De
c-0
7M
ar-0
8Ju
n-0
8Se
p-0
8D
ec-
08
Mar
-09
Jun
-09
Sep
-09
De
c-0
9M
ar-1
0Ju
n-1
0Se
p-1
0D
ec-
10
Mar
-11
Jun
-11
Sep
-11
De
c-1
1M
ar-1
2Ju
n-1
2Se
p-1
2D
ec-
12
Mar
-13
Jun
-13
Sep
-13
De
c-1
3M
ar-1
4Ju
n-1
4Se
p-1
4D
ec-
14
Mar
-15
Jun
-15
Sep
-15
De
c-1
5M
ar-1
6
Value Strategy Nifty 50 Index
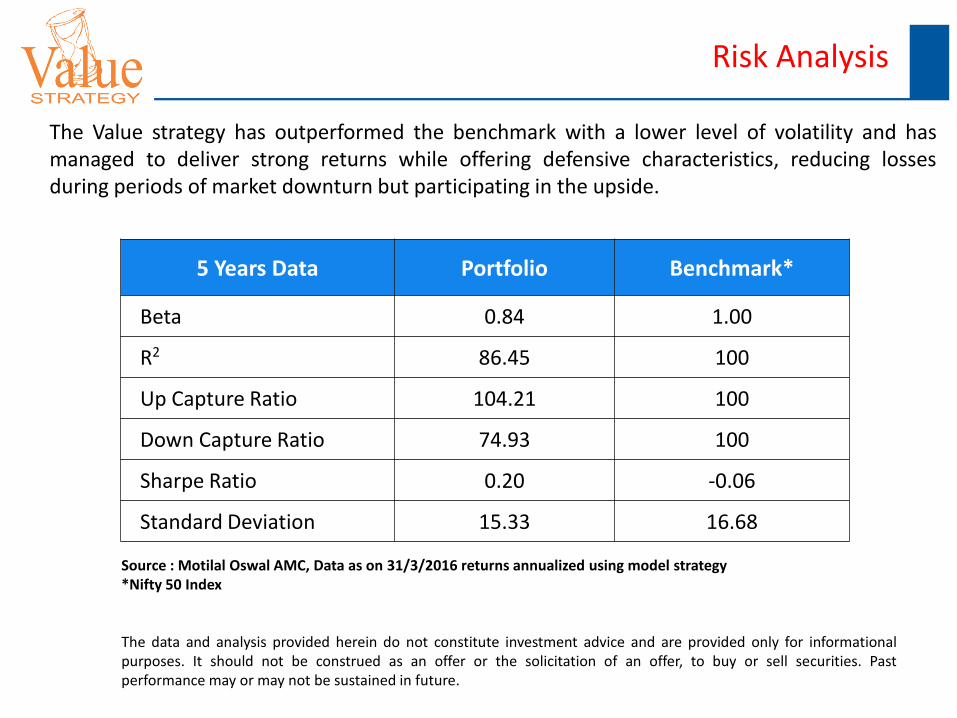
Risk Analysis
The Value strategy has outperformed the benchmark with a lower level of volatility and has managed to deliver strong returns while offering defensive characteristics, reducing losses during periods of market downturn but participating in the upside.
5 Years Data Portfolio Benchmark*
Beta 0.84 1.00
R2 86.45 100
Up Capture Ratio 104.21 100
Down Capture Ratio 74.93 100
Sharpe Ratio 0.20 -0.06
Standard Deviation 15.33 16.68
Source : Motilal Oswal AMC, Data as on 31/3/2016 returns annualized using model strategy *Nifty 50 Index The data and analysis provided herein do not constitute investment advice and are provided only for informational purposes. It should not be construed as an offer or the solicitation of an offer, to buy or sell securities. Past performance may or may not be sustained in future.
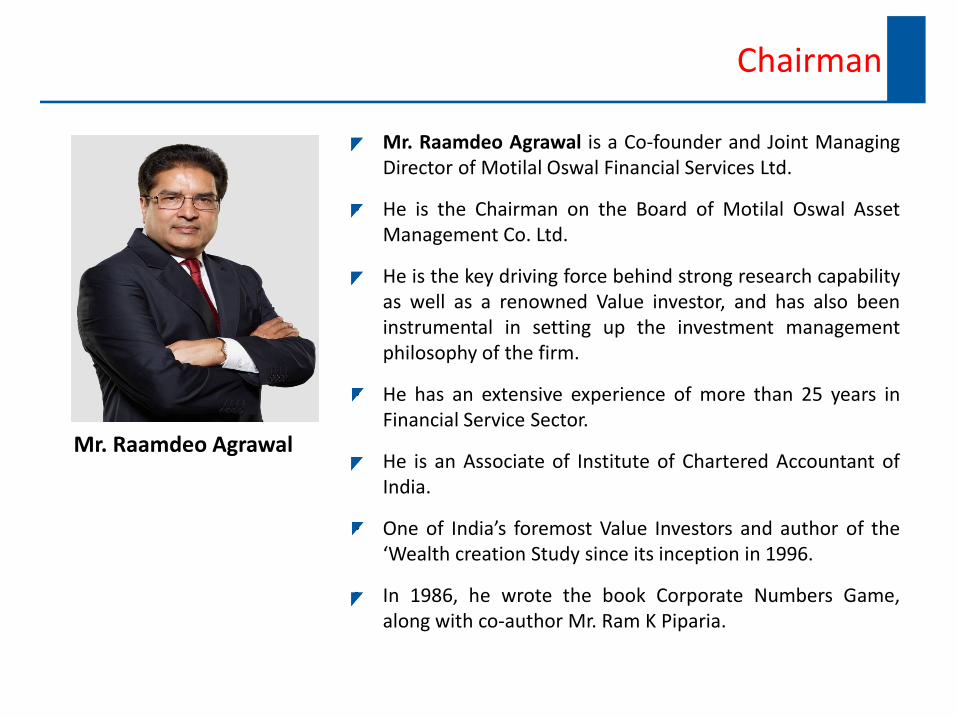
Chairman
• Mr. Raamdeo Agrawal is a Co-founder and Joint Managing Director of Motilal Oswal Financial Services Ltd.
• He is the Chairman on the Board of Motilal Oswal Asset Management Co. Ltd.
• He is the key driving force behind strong research capability as well as a renowned Value investor, and has also been instrumental in setting up the investment management philosophy of the firm.
• He has an extensive experience of more than 25 years in Financial Service Sector.
• He is an Associate of Institute of Chartered Accountant of India.
• One of India’s foremost Value Investors and author of the ‘Wealth creation Study since its inception in 1996.
• In 1986, he wrote the book Corporate Numbers Game, along with co-author Mr. Ram K Piparia.
Mr. Raamdeo Agrawal

Fund Manager
• Mr. Manish Sonthalia, Senior Vice President and Head - Equity PMS and Fund Manager of Value Strategy.
• He has equity research, fund management and equity sales
experience since 1992.
• Qualifications – FCA, ICWAI, CS, MBA
• Past Experience : He has been Vice President – Equity Research at Motilal Oswal Securities Ltd.
• Fund Manager with Motilal Oswal PMS since 2006 Mr. Manish Sonthalia
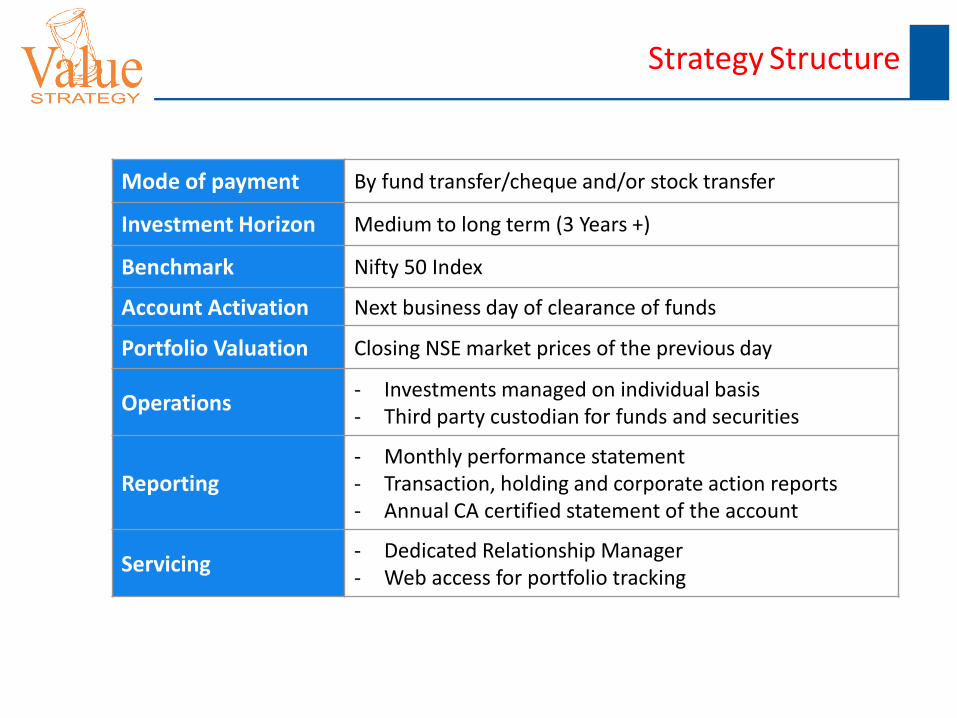
Strategy Structure
Mode of payment By fund transfer/cheque and/or stock transfer
Investment Horizon Medium to long term (3 Years +)
Benchmark Nifty 50 Index
Account Activation Next business day of clearance of funds
Portfolio Valuation Closing NSE market prices of the previous day
Operations - Investments managed on individual basis - Third party custodian for funds and securities
Reporting - Monthly performance statement - Transaction, holding and corporate action reports - Annual CA certified statement of the account
Servicing - Dedicated Relationship Manager - Web access for portfolio tracking
Disclaimer
Disclaimer: This presentation has been prepared and issued on the basis of internal data, publicly available information and other sources believed to be reliable. The information contained in this document is for general purposes only and not a complete disclosure of every material fact and terms and conditions. The information / data herein alone is not sufficient and shouldn’t be used for the development or implementation of an investment strategy. It should not be construed as investment advice to any party. All opinions, figures, charts/graphs, estimates and data included in this presentation are as on date and are subject to change without notice. While utmost care has been exercised while preparing this document, Motilal Oswal Asset Management Company Limited does not warrant the completeness or accuracy of the information and disclaims all liabilities, losses and damages arising out of the use of this information. The statements contained herein may include statements of future expectations and other forward-looking statements that are based on our current views and assumptions and involve known and unknown risks and uncertainties that could cause actual results, performance or events to differ materially from those expressed or implied in such statements. Readers shall be fully responsible / liable for any decision taken on the basis of this presentation. No part of this document may be duplicated in whole or in part in any form and/or redistributed without prior written consent of the Motilal Oswal Asset Management Company Limited. Readers should before investing in the Strategy make their own investigation and seek appropriate professional advice. • Investments in Securities are subject to market and other risks and there is no assurance or guarantee that the objectives of any of the strategies of the Portfolio Management Services will be achieved. • Clients under Portfolio Management Services are not being offered any guaranteed/assured returns. • Past performance of the Portfolio Manager does not indicate the future performance of any of the strategies. • The name of the Strategies do not in any manner indicate their prospects or return. • The strategy may not be suited to all categories of investors. • The material is based upon information that we consider reliable, but we do not represent that it is accurate or complete, and it should not be relied upon as such. • Neither Motilal Oswal Asset Management Company Ltd. (MOAMC), nor any person connected with it, accepts any liability arising from the use of this material. The recipient of this material should rely on their investigations and take their own professional advice. • Opinions, if any, expressed are our opinions as of the date of appearing on this material only. While we endeavor to update on a reasonable basis the information discussed in this material, there may be regulatory, compliance, or other reasons that prevent us from doing so. • The Portfolio Manager is not responsible for any loss or shortfall resulting from the operation of the strategy. •Recipient shall understand that the aforementioned statements cannot disclose all the risks and characteristics. The recipient is requested to take into consideration all the risk factors including their financial condition, suitability to risk return, etc. and take professional advice before investing. As with any investment in securities, the Value of the portfolio under management may go up or down depending on the various factors and forces affecting the capital market. Disclosure Document shall be read carefully before executing the PMS agreement . • Prospective investors and others are cautioned that any forward - looking statements are not predictions and may be subject to change without notice. • For tax consequences, each investor is advised to consult his / her own professional tax advisor. • This document is not for public distribution and has been furnished solely for information and must not be reproduced or redistributed to any other person. Persons into whose possession this document may come are required to observe these restrictions. No part of this material may be duplicated in any form and/or redistributed without’ MOAMCs prior written consent. • Distribution Restrictions – This material should not be circulated in countries where restrictions exist on soliciting business from potential clients residing in such countries. Recipients of this material should inform themselves about and observe any such restrictions. Recipients shall be solely liable for any liability incurred by them in this regard and will indemnify MOAMC for any liability it may incur in this respect.
Custodian: IL&FS Securities Services Ltd | Auditor: M/s Morzaria & Associates | Depository: Central Depositary Services Ltd Portfolio Manager: Motilal Oswal Asset Management Company Ltd. (MOAMC)| SEBI Registration No. : INP 000000670