powerpoint-presentatie - pelagic-ac.org ii... · 10/8/2015 1 pelacoustic ii: collecting acoustic...
TRANSCRIPT

10/8/2015
1
PelAcoustic II: collecting acoustic data from freezer-
trawlers
Sascha Fässler
Project aims
Continuation of data collection and “fisheries simulator” development
● Blue whiting
● Herring
Self-calibration by crew
● independent data collection
● increase data quantity
Calibration of acoustic equipment Calibration of acoustic equipment
Reference unit
Calibration
Calibration of acoustic equipment
113m
Project tasks
Build calibration sets for 5 trawlers

10/8/2015
2
scientific system: SIMRAD EK60 (includes a calibration program)
Project tasks
Develop calibration software
Echo from the reference sphere
Detected single target data points in the Calibration program
ER60 software
Custom made software for ES70
Project tasks
calibration courses / practicals
Project tasks
calibration courses / practicals Remote assistance during data collection & calibration
Project tasks
Assisted calibration in Scapa Flow
Scapa Flow
Cornelis Vrolijk (H171): 27.08.
Carolien (SCH81): 08.08.
Afrika (SCH24): 15.08.
Assisted calibration in Stornoway
Stornoway
Helen Mary (ROS785): 09.04.

10/8/2015
3
Remote calibration – via TeamViewer
Northern North Sea
Alida (SCH6): 12.07.
Remote assistance from ‘Tridens’ (during herring survey) via TeamViewer software
Data collection
Fishing seasons
Calibration
courses Self-calibrations / remote helpCalibration
practicals
Total project timeline
2013 2014 2015
Pro
ject
sta
rt
Calibration material &
software development
Example: 3 data collection trips during
North Sea herring fishery
Data collection...

10/8/2015
4
Data processingAcoustic raw data storage
Acoustic data
collection
Catch lists
Acoustic data processing
Calculate acoustic fish
density
Data output: fish detections
(T. Brunel, IMARES)
• example: North Sea herring fishery
Data output: fish detections
Data output: fish detections
June July August
Identified issues & way ahead
Calibration
● “Self-calibrations” not routine yet
● 1x per year assisted + regular check-ups?
Data recording & processing
● Data quantities are steadily increasing
● 1 week of data ~ 1 day of processing
● Automation procedures required
Analyses
● Take account of repeated coverages of the same stock and develop appropriate analysis methods for ‘preferential sampling’ design
10/8/2015
5
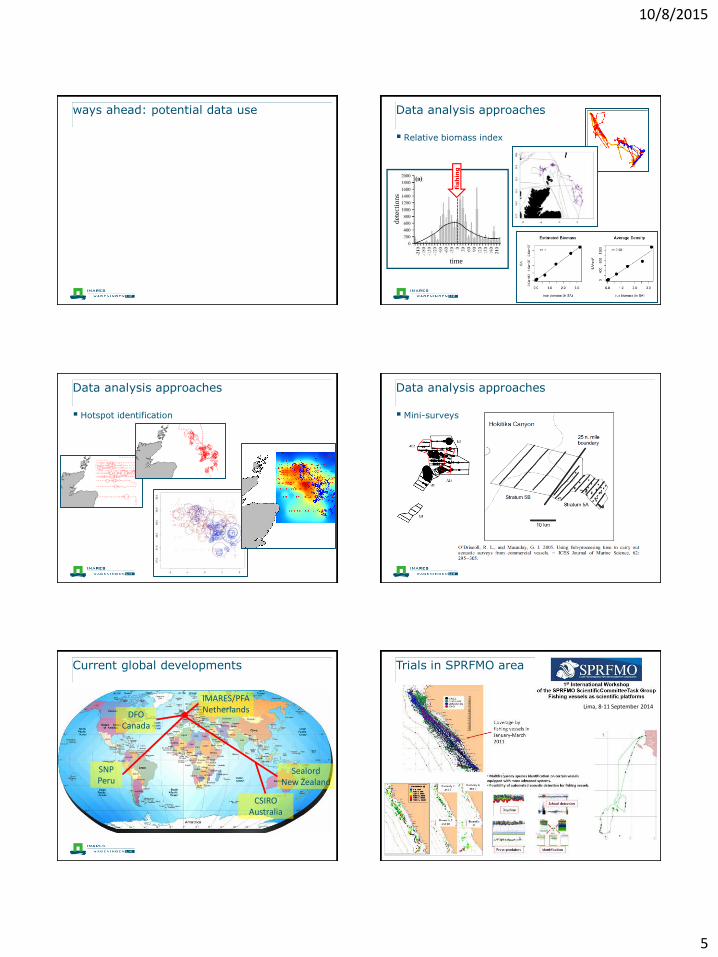
ways ahead: potential data use
Relative biomass index
Data analysis approaches
fish
ing
det
ecti
ons
time
Hotspot identification
Data analysis approaches
Mini-surveys
Data analysis approaches
Current global developments
SNP Peru
DFOCanada
SealordNew Zealand
CSIROAustralia
IMARES/PFANetherlands
Trials in SPRFMO area
Lima, 8-11 September 2014

10/8/2015
6
Antarctic krill VIa herring
SGHERWAY 2010
ICES WGFAST vessel calibration group &
2016 ICES ASC theme session
ICES ASC theme session
Thanks!