powerpoint presentation - stockport jsna 3 • summary 5 • inpatient admissions 11 • ed...
TRANSCRIPT

2015 JSNA
Health and Care Service Use
April 2016
1

CONTENTS
• Summary 3
• Inpatient Admissions 5
• ED Attendances 11
• Outpatients Appointments 15
• Community Activity 20
• Mental Health Care 22
• Adult Social Care 24
• Primary Care 28
• National analysis of opportunities for efficiencies 30
• Health and Social Care Workforce 31
2

3
Service Use Summary
The aim of this briefing is to set out the major trends in the use of health and care services over the past few years.
Overall the trends set out in this briefing show that a large volume of health and care activity takes place in Stockport each year across a range of settings, the majority of this care is for older people. Volumes of service use are increasing, but this increase is not driven solely by the changing demographics. Stockport benchmarks as a higher use authority nationally on a range of measures. Note on data quality Data sources are variable and caution should be taken with interpretation, as activity measures vary across sectors. For example, in primary and community care activity is measured mainly by appointments, in acute settings activity is measured through admissions or bed days and social care activity is measured using clients or care packages. This can make it challenging to compare levels. Data sources also vary in their quality and completeness.

4
Volume Trend Key issue
Inpatient admissions 97,000 36% in 10 years
• Rates rising, especially for older people • Significant inequalities profile • Delayed transfers of care rising
Inpatients - emergency 39,700 47% in 10 years • Benchmark as high levels compared to national
average and peers
Inpatients - Planned 46,300 25% in 10 years • Only 60% of activity at main provider,
A & E Attendances 94,000 13% in 7 years • Rise in demand • High levels of admission as result at Stockport FT
Outpatients appointments attended
483,600 11% in 3 years • Rising demand • Benchmark high on follow up ratio
Community contacts 543,000 District Nursing 13% in 2 years
• Rising activity for district nursing, linked to ageing • Demand will rise further with care planned outside of
hospital in Stockport Together.
Mental health care – people in contact with services
11,000 Non inpatient 39% in 6 years
• Physical health needs of people on psychiatric wards, especially facilities for physical activity
Adult Social Care 8,455 • Fall in levels of provision 2007-2011, now stable • Rise in dementia client group
Primary Care – contacts in practice
700,000+ ? • Prescribing volumes rising • Dental access better than average
Service Use Summary
The table below summarises the following analysis and shows that across the health and care economy there is a large amount of activity and that this activity is rising.

Background • Inpatient admissions are some of the highest cost and most invasive health care interventions, often disempowering for the patient. A
key policy drive is to minimise these episodes and shift towards care in a community setting where possible. • Analysis of admissions can give indications of the patterns of illness and disease and demonstrates the use of health services. • Admission type allows us to discriminate between planned care (where a patient is referred through health care pathways and which
are likely to be the most appropriate) and emergency admissions (which are more likely to result from lack of early presentation and diagnosis – although of course many can result from accidents or unforeseeable health care needs).
Analysis There are around 97,000 inpatient admissions made by Stockport residents each year.
Around 70% of these admissions are at Stockport NHS Foundation Trust, although this varies by admission type and area of Stockport
Only 20-30% of all admissions from Heald Green and Gately are at Stockport NHS Foundation Trust, the majority of patients in these areas attend University Hospital of South Manchester NHS Foundation Trust
Admission Type 14/15 admissions for Stockport residents
Number Proportion
All Planned Admissions 46,326 47.5%
All Emergency Admissions 39,721 40.7%
All Other Admissions (births, transfers etc.) 11,506 11.8%
TOTAL 97,553
Inpatient Admissions
2014/15 Admissions by Provider All Admissions All Planned Admissions
All Emergency Admissions
All Other Admissions (births, transfers etc.)
Stockport NHS Foundation Trust 68.6% 58.1% 78.6% 76.7%
University Hospital of South Manchester NHS Foundation Trust 12.6% 14.7% 10.8% 10.5%
Central Manchester University Hospitals NHS Foundation Trust 9.1% 12.6% 4.4% 11.1%
Salford Royal NHS Foundation Trust 2.4% 3.9% 1.2% 0.1%
The Christie NHS Foundation Trust 2.2% 3.5% 1.2% 0.1%
BMI Healthcare 1.6% 3.4%
Pennine Care NHS Foundation Trust 0.7% 0.0% 1.6% 0.1%
East Cheshire NHS Trust 0.6% 1.0% 0.3% 0.3%
All other trusts (England) <500 admissions each 2.2% 2.7% 1.9% 1.2%

Inpatient Admissions - Benchmarking
For non elective directly standardised admission rates Stockport CCG benchmarks as one of the highest CCGs nationally, with rates in excess of the national average and all peers. Non elective admissions benchmarking
Stockport 12,314 per 100,000 Peer average 9,921 per 100,000 National average 9,827 per 100,000
For elective directly standardised admission rates Stockport CCG benchmarks as just above the upper quartile. Elective admissions benchmarking
Stockport 2,568 per 1000,000 Peer average 2,094 per 100,000 National average 2,322 per 100,000

Inpatient Admissions – trends over time (registered based)
Trends over time show an increase in all types of admission, but particularly rapid for emergency admissions. Benchmarking shows that crude rates of admission in Stockport for emergency admissions have risen more rapidly than the national average, for other types of admission the rate of increase has been similar to the national trend

Inpatient Admissions – age trends (resident base)
Trends by age show rates are lowest for those ages 1–18 years and highest for those aged 0 (at birth) and rise rapidly from ages 65+.
Admissions relating to maternities lead to an increase in rates for women between the ages of 18-44.
At younger and older ages men have higher levels of admissions than females.
Benchmarking shows that rates of admission in Stockport are higher than the national average for all ages, but especially in for those aged 15-44 years.
Rates of admission for older ages have only exceeded national averages recently, until 2010 rates for those aged 60-74 and 75+ were well below the national average.

Inpatient Admissions – deprivation (resident base)
Trends by deprivation show that rates of admission are higher in the most deprived areas at all ages, and there is a clear gradient between each quintile.
However due to the uneven population share between these groups, from age 60+ there are higher numbers of admissions in the least deprived areas – so that services will see more older people from areas of affluence.
0
500
1,000
1,500
2,000
2,500
3,000
3,500
0 - 4 5 - 9 10 - 14 15 - 19 20 - 24 25 - 29 30 - 34 35 - 39 40 - 44 45 - 49 50 - 54 55 - 59 60 - 64 65 - 69 70 - 74 75 -79 80 - 84 85 - 89 90+
Age
sp
eci
fic
rate
pe
r 1
,00
0
Age group
2010/12 Inpatient Admissions by Age and deprivation - Stockport residents
Most deprived Second Most deprived Mid deprived Second Least deprived Least deprived

Inpatient Admissions – diagnosis
Analysis of the primary diagnosis of admissions show that the most common causes of admission relate to the digestive system, particularly diseases of the oesophagus, intestines and gallbladder.
30% of admissions for symptoms and signs are also related to the digestive system, with a further 30% relating to circulatory disease.
Pregnancy, musculoskeletal and neoplasms all cause more than 8,000 admissions a year. Factors influencing health status include the live births of babies and admissions for tests.

Background • A&E attendances give evidence about the acute demands for health care. • Analysis of attendance can give indications of the patterns of illness and of injuries and also demonstrates the use of the health service.
Summary There are around 94,000 ED Attendances made by Stockport residents each year.
Emergency Department Attendances (A&E)
75% of these attendances are made at Stockport NHS FT, with a further 11% at South Manchester and 8% at Central Manchester.
Like admissions, the pattern of A&E of use varies across the borough so that in Heald Green and Gately fewer than 10% of attendances are at Stockport, and 75% are at South Manchester.
50% of these attendances result in a discharge either with no follow up (39%) or with a follow up in primary care (12%).
30% result in admissions to hospital as an inpatient and 15% with a discharge with a follow up appointment in acute care (e.g. outpatients).
4% of attendances result in patients leaving before treatment.

Emergency Department Attendances (A&E) – trends over time
Rates of ED attendance have been increasing steadily over the last decade, with an increase every year apart from 2013/14.
Benchmarking data for activity volumes over time are not readily available so direct comparisons to other areas are not possible on this measure – however national trends have also been for an increase in demand.

Emergency Department Attendances (A&E) – trends by age
Rates of ED attendance peak at ages: • 0 - 1years • 18 - 29 years • and from ages 65
onwards they rise steadily
Rates of ED attendance are far higher than rates of inpatient admissions up to the age of 65, from this point on they converge Trends of ED attendance by deprivation show a similar pattern as admissions with rates far higher in the most deprived areas at all ages.

Emergency Department Attendances (A&E) – other trends
2013/14 ED Attendances by method of discharge
England Greater Manchester
Stockport NHS Foundation Trust
Admitted 21.2% 20.9% 30.0%
Discharged – GP follow up 19.7% 17.0% 11.7%
Discharged – no follow up 38.2% 42.3% 39.8%
Referred 12.5% 12.8% 13.9%
Other 8.4% 7.0% 4.6%
Comparison of trends between Stockport NHS Foundation Trust and other ED departments shows that
• Locally a far higher
proportion of attendances result in admission than is average – 30% compared to 21% nationally.
• The length of time people spend in ED in Stockport is on average longer than both England and Greater Manchester – fewer people are seen and discharged within an hour and more stay within the department for 4 hours or more.

Background • Outpatient attendances give evidence about the non-emergency demands for acute health care. • Analysis of attendance can give indications of the patterns of illness and of injuries and also demonstrates the use of the health service.
Summary There are around 547,800 outpatient appointments made by Stockport residents each year of which around 483,600 are attended.
Outpatient Services
56% of these appointments are made at Stockport NHS FT, with a further 15% at South Manchester, 13% at Central Manchester and 4% at Christie. 12% of appointments are made at a range of other trusts, but with no trust having a more than 3% of the total.
Like admissions and A&E attendances, the pattern of outpatient service use varies across the borough so that in Heald Green and Gately fewer than 15% of appointments are at Stockport, and 55% are at South Manchester.
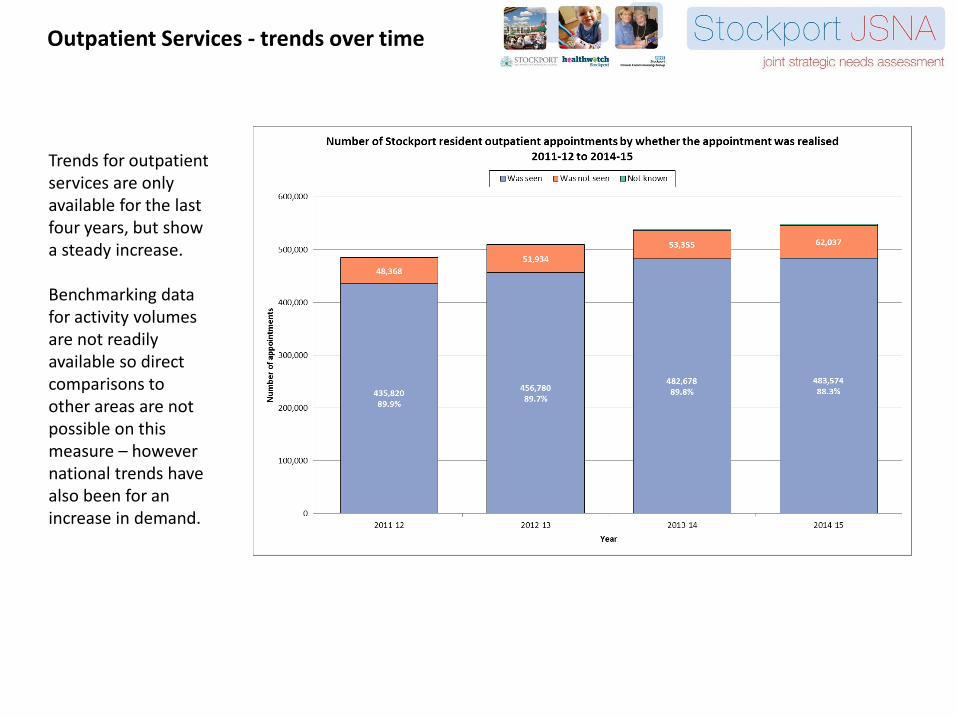
Outpatient Services - trends over time
Trends for outpatient services are only available for the last four years, but show a steady increase. Benchmarking data for activity volumes are not readily available so direct comparisons to other areas are not possible on this measure – however national trends have also been for an increase in demand.

Outpatient Services – age and gender
Trends show that as for admissions and A&E attendances outpatient attendance rates increase with age so that on average people in their 80s have more than 4 attendances each year. Gender trends show that from the late teens to age 70 females have higher rates of attendances than males, and which point the trend switches. The largest gender gap is between the ages of 25 to 40 and again are likely to be related to pregnancy or gynaecological causes.

Outpatient Services – follow up and diagnosis
For those outpatient appointments which were attended the trends shows that for every first attendance there are on average a further 3 follow up attendance in Stockport. This ratio has been gradually declining over time, but is still a significant pressure in the system.
Analysis of the speciality of the first appointments attended shows that: • 14% of attendances are due to trauma &
orthopaedics • 10% for
• allied health professionals • general surgery
• 7% for • Ophthalmology • ENT • General medicine
Further information on the reasons for attendance are not available from this source.

Outpatient Services - benchmarking
Stockport CCG value 31,618
Similar CCGs mean 28,341
National mean 29,400
Stockport CCG value 3
Similar CCGs mean 3
National mean 2
Benchmarking analysis shows that Stockport has high rates of first outpatient appointments, ranking within the top quartile and has especially high rates of 1st to follow up outpatient ratios – ranking amongst the highest nationally on this indicator. Analysis undertaken by NHS England suggest that there is a scope for at least £2million savings if the follow up ratio in Stockport was the same as the 25th percentile nationally – although as we have seen rates are now falling.

Background • Services provided in the community need to be effective and efficient and are a vital part of healthcare in the NHS. Recently the way
that community services are provided has undergone change due to the Transforming Communities initiative. • The challenge is to commission services with a clear strategy with quality improvement and the reduction of inequalities at its core. • Importantly local knowledge and information are needed so that the provision of these services is the most appropriate to meet local
needs. • Throughout the stages of life the demand for different services varies. • The population characteristics of different areas will impact on the need for services. • The data presented here is from the local community services system Lorenzo and shows the total number of contacts for the service. • There are a wide range of community health services provided in Stockport and data is shown for the services with the highest counts of
contacts with the service.
NHS Community Services - Stockport NHSFT
Child and Family140,363 contacts
Adults370,408 contacts
Public Health32,395
contacts
2014/15 Community Service ContactsSummary There are approximately 543,000 contacts for community services provided by Stockport NHS FT to Stockport patients each year, with a caseload of around 65,000 patients. The majority of contacts are in adults services, accounting for more than 65%, around a quarter of contacts are for children’s and family services, with the remainder for preventative public health services for adults. It should be noted that some of the children’s services also include public health and preventative elements. Comparison data for other areas is not available so it is not possible to assess the relative performance of the Stockport system.

NHS Community Services - Stockport NHSFT
Theme Service 2012/13 Contacts
2013/14 Contacts
2014/15 Contacts
Child and Family Health Visiting 80,225 75,459 72,418
Child and Family School Nursing 44,754 17,393 28,275
Child and Family Child Speech and Language Therapy 15,808 17,453 26,853
Child and Family Children's Physiotherapy 5,867 5,771 5,898
Child and Family Child Occupational Therapy 5,149 5,170 5,057
Child and Family Other services 3,875 3,909 1,862
Adults District Nursing 215,894 226,327 245,618
Adults Podiatry 53,446 49,840 47,860
Adults Primary Care Physiotherapy 19,880 19,530 20,747
Adults Community Rehabilitation 8,268 8,693 8,855
Adults COPD Nursing 4,708 4,631 6,928
Adults Orthopaedic Assessment Service - Tier 2 5,213 6,026 6,264
Adults Diabetes 3,318 3,646 6,201
Adults Tissue Viability Nursing 7,256 5,684 5,952
Adults Specialist Palliative Care 4,870 5,431 5,903
Adults Other services 18,123 14,360 16,080
Public Health Community Development Service 15,695 12,618 10,101
Public Health Contraception & Sexual Health 14,966 11,916 9,571
Public Health Healthy Stockport (Life Style Services) 6,719 5,350 7,235
Public Health Other services 4,616 5,284 5,488
This table shows the trends in volumes of contacts over the last three years District nursing is the largest service, followed by health visiting, podiatry and school nursing. Trends show a general increase in activity, although there are some variations by service, most likely due to coding changes or changes in practice.

Background
Mental Health Services
Background • Mental health services are provided in both acute and community settings. • Inpatient admissions, ED attendances and Outpatient appointments are included in the previous analysis, however community mental
health services – provided by Pennine Care, are not. • The analysis below is based on patients who attended the entire range of NHS Mental Health and Learning Disability services, out side
of primary care.
Summary In total, in 2014-15 there are 600 people who were admitted and 10,400 people who received outpatient or community services for mental health services. Trends are general increasing, however there have been changes to data collections (indicated by the dashed vertical lines) which may have impacted data.

Mental Health Services - benchmarking
Stockport CCG value 1,534
Similar CCGs mean 1,073
National mean 1,073
Benchmarking analysis shows that Stockport has higher rates than average of people in touch with secondary care for common mental health conditions. Evidence from more in depth profiles also shows that bed day rates for mental health and A&E attendances for psychiatric problems are also higher than average locally.

Background
• Adult Social Care Services provide vital personal and practical support to help people live their lives. • It supports vulnerable people to maintain their independence, dignity and control. • Clients include younger adults with disabilities and older people who need care and support, plus their carers • Unlike NHS services people need to meet certain criteria before receiving care
Summary • In 2013/14 there were 8,455 service users of Stockport Adult Social Care:
• 2,850 aged 18-64 (1.7% of the total population) • 5,603 aged 65+ (10.3% of the total population)
• Of these service users
• 6,980 used community based services (83%) • 1,050 were receiving residential care (12%) • 425 were receiving nursing care (5%)
• 6,200 received self directed support and / or direct payments
• 855 carers received services, and a further 1,420 were provided with information. • 555 of these people cared for those aged 18-64 (24%) • 1,720 of these people cared for those aged 65+ (76%)
• 9,970 contacts for new clients were made:
• 39% from NHS secondary care • 25% from NHS primary or community care • 14% from family, friends and neighbours • 7% were self referrals • 16% from other sources
Adult Social Care Services

Adult Social Care Services – trend over time
3,530 3,620
3,110 3,1352,710
2,940
2,480 2,5852,850
8,5208,860
7,975
6,625
5,6205,320
5,2305,570 5,605
0
200
400
600
800
1000
1200
1400
1600
1800
2000
0
1000
2000
3000
4000
5000
6000
7000
8000
9000
10000
2005/06 2006/07 2007/08 2008/09 2009/10 2010/11 2011/12 2012/13 2013/14
Cru
de
rate p
er 1
0,0
00N
um
be
r o
f cl
ien
ts
Year
Trend in Adult Social Care Clients - Stockport (Source: HSCIC RAP)
Number of Service Users - 18 - 64 Number of Service Users - 65 +
Rate per 10,000 - 18 - 64 Rate per 10,000 - 65 +
Trends over time shows that the number and rates of adult social care clients have fallen from the high in 2006/07 to a low in 2011/12 – some of this due to data quality improvements, but this also reflects changes in provision as a new service model was introduced.
Since 2011/12 rates and numbers have begun to increase reflecting increased need in the population – this is despite changes in finances.
The fall in client numbers has been largest both volume and proportionally for older adults.

Adult Social Care Services – benchmarking trend over time
Trends over time show rates also fell nationally and regionally and, unlike Stockport. are still falling. The rapid reduction in Stockport is likely down to changes in service models that were introduced, which have since stabilised. Stockport currently has rates of adult social care clients that are higher than the national average, but more similar than they have been historically.
0
200
400
600
800
1000
1200
1400
1600
1800
2000
2005/06 2006/07 2007/08 2008/09 2009/10 2010/11 2011/12 2012/13 2013/14
Cru
de
rat
e p
er
10
,00
0
Year
Trend in Adult Social Care Clients - Stockport, North West and England (Source: HSCIC RAP)
England - 18-64 North West - 18-64 Stockport - 18-64 England - 65+ North West - 65+ Stockport - 65+

Adult Social Care Services – trend over time
The client need profile has also changed over the last decade with a rise in the rates and numbers of clients with needs relating to dementia.
The biggest single need category is still physical disability or frailty.
0
50
100
150
200
250
300
350
400
2005/06 2006/07 2007/08 2008/09 2009/10 2010/11 2011/12 2012/13 2013/14
Cru
de
rat
e p
er
10
,00
0
Year
Trend in Adult Social Care Clients - Stockport (Source: HSCIC RAP)
Physical disability, frailty and / or temporary illness DementiaLearning Disability Sensory impairment
Client need profile 13/14 Number of
Clients Proportion
Physical disability, frailty and / or temporary illness 5,015 59.3%
Learning Disability 820 9.7%
Dementia 710 8.4%
Sensory impairment 175 2.1%
Other / unknown 1,735 20.5%

Background • Primary care services are provided in local communities and are often the first place of contact for health care • There are currently 47 GP Practices based in Stockport, with some residents (<4%) also using practices in other areas
(see JSNA Health Service Locations for more information) • There are currently 69 pharmacies, 48 dental practices and 38 opticians in the area (see JSNA Health Service
Locations for more information)
Summary Data for GP practice activity is not routinely available so analysis of long term trends is not possible, however a snapshot of activity in Stockport in 2014/15 has been collected as part of the Stockport Together baseline. It showed there are:
• 349,499 GP appointments • 138,728 Nurse appointment • 114,672 Health Care Assistant appointments
• 92,122 out-of-hours GP contacts • 50,592 out-of-hours nurse contacts
Data for dental activity suggest that as of 31st March 2015
• 74.4% of children aged 0-17 in Stockport have been seen by an NHS dentist in the last 24 months • 62.7% of adults aged 18+ in Stockport have been seen by an NHS dentist in the last 24 months
National rates are 69.4% and 55.8% respectively
Primary Care Services

Primary Care Services - prescribing
2014/15 Total prescribing items per 100,000 weighted population benchmarking
Ra
te p
er
10
0,0
00
we
igh
ted
po
pu
latio
n
Trends for prescribing show that whilst the total cost of prescribing in Stockport has been relatively stable, the volume of items has risen steadily – this is due to the average costs of drugs reducing. Benchmarking data from 2014/15 shows that the volume of prescribing in Stockport is higher than the national average, but is within the quartile ranges. Over 20% of all prescribing is for the central nervous system, including medications for pain relief, depression, epilepsy and mental health disorders. Prescribing for the endocrine system (diabetes), respiratory (asthma and COPD) and cardiovascular are the next most common, each at 13%.

Indicator Latest Value Financial
Opportunity Volume
Opportunity Rank Category
Outpatient Appointments 8,629.70
(outpatient appointments per 100,000 population)
£2.1M 13,265 129 Clinical
Emergency Admissions 555.18
(Emergency admissions per 100,000 population)
£2.0M 1,061 150 Clinical
Managing Surgical Thresholds
62.81 (Operations per 100,000
population) £218,456 99 34 Clinical
Overall opportunities for efficiency gains (Stockport Together Priority Areas)
National benchmarking analysis suggests that there is significant scope for savings in both outpatients and emergency admissions, there is less scope for planned admissions – this is based on modelling the trends in Stockport against the 25th percentile performance. A JSNA analysis of the Right Care products will be undertaken in the summer of 2016 to further investigate these opportunities.

31
Stockport Together Combined Workforce
Stockport
Together
Primary
Care
Social Care
Community
Care
Acute
Care Mental
Health
Mastercall
Private Care
Providers
Voluntary
Sector
631 FTE
769 people
490 FTE
733 People
462 FTE
604 People
489 FTE
583 People
3,785 FTE
4,614 People
5,857 FTE
7,303 People
32 FTE
(estimate)
Care
Homes
The vast majority of Health and Social Care staff in Stockport are employed by the Stockport NHS Foundation Trust (72.5%), of which almost 65% work in the hospital (acute care). Social Care is the next biggest element of the workforce – although this figure does not include staff in private companies delivering social care. Primary Care, Mental Health and Community services each constitute around 8% of the workforce – which explains the reactive system and need to change to enable a sustainable, preventative approach.

32
Workforce Characteristics
Gender
Part-Time Status by gender
Age
The vast majority of Health and Social Care staff in Stockport are female, and the average age of staff is in the 50s. Primary Care has particularly high levels of part-time working, a major factor in the choice to move into this field, making the push for 7 day working in primary care particularly challenging. Community services have the least male employees at (just 9%). The gender balance is most even in social care, but even here men make up just a quarter of the workforce. Social care has the oldest age profile of all sectors, the youngest being in hospital services.

33
Workforce by Sector Overview
Primary Care Community Acute Care Mental Health Social Care
Organisations 47 x GP
Practices Stockport NHS FT Stockport NHS FT Pennine Care FT Stockport MBC
No. employees 733 604 4,614 583 769
FTE 490 462 3,785 489 631
Part-time staff 62.75% 42.05% 49.57% 43.05% 35.37%
Salary Costs Not known £1.2m £109m £14m £5.5m
Average age 47 48 45 46 49
Gender 84 % female -
16 % male
91 % female
9 % male
78.05 % female
21.95 % male
79.85 % female
20.15 % male
74.35% female
25.65% male
Roles
52% Administration
29% GPs
11% Nurses
8% Direct Patient
Care practitioners
28% clerical workers
17.28% community
nurses
14.83% community
practitioners
9.58% HCAs
4.37% assistant
practitioners
4.36% podiatrists
4.26% managers
2.7% physios
2.12% OTs
32.21% nursing
20.39% admin /clerical
20.03% clinical
7.66% medical / dental
7.52% estates
6.16% AHPs
3.41% prof scientific
2.1% healthcare scientists
0.53% students
33.67% nursing
27.44% clinical
14.68% admin / clerical
12.33% prof scientific
5.34% AHPs
4.51% medical / dental
1.28% healthcare scientists
0.75% estates
48.1% support
workers
19.95% social
workers
17.19% management
8.29% administration
3.76% customer
support
1.22% estates
1.05% OTs
0.23% nurses
0.21% dietician
The large number of organisations in Primary Care (47 GP Practices) means it has the highest percentage of staff in administrative and back-office functions.