powerpoint presentationmarico.com/investorspdf/marico_limited_-_investor_presentation... ·...
TRANSCRIPT
INVESTOR PRESENTATION March 2018
Investor Presentation | March 2018 < Previous | Next >
DISCLAIMER
2
This investor presentation has been prepared by Marico Limited (“Marico”) and does not constitute a prospectus or placement memorandum or an offer to
acquire any securities. This presentation or any other documentation or information (or any part thereof) delivered or supplied should not be deemed to
constitute an offer.
No representation or warranty, express or implied is made as to, and no reliance should be placed on, the fairness, accuracy, completeness or correctness of
such information or opinions contained herein. The information contained in this presentation is only current as of its date. Certain statements made in this
presentation may not be based on historical information or facts and may be “forward looking statements”, including those relating to the general business
plans and strategy of Marico, its future financial condition and growth prospects, future developments in its industry and its competitive and regulatory
environment, and statements which contain words or phrases such as ‘will’, ‘expected to’, ‘horizons of growth’, ‘strong growth prospects’, etc., or similar
expressions or variations of such expressions. These forward-looking statements involve a number of risks, uncertainties and other factors that could cause
actual results, opportunities and growth potential to differ materially from those suggested by the forward-looking statements. These risks and
uncertainties include, but are not limited to risks with respect to its hair care, its healthcare business and its skin care business.
Marico may alter, modify or otherwise change in any manner the content of this presentation, without obligation to notify any person of such revision or
changes. This presentation cannot be copied and disseminated in any manner.
No person is authorized to give any information or to make any representation not contained in and not consistent with this presentation and, if given or
made, such information or representation must not be relied upon as having been authorized by or on behalf of Marico.
< Previous | Next > Investor Presentation | March 2018 3
TABLE OF CONTENTS
• Company Overview…………………
• Strategy Framework………………..
• India Business………………….........
• International Business……………...
• Key Areas of Transformation…........
• Financial Highlights…………………
• Sustainability ………………….........
• Stock Information………………......
• Exhibits………………………….......
4
14
17
32
39
46
49
51
53

Investor Presentation | March 2018 < Previous | Next >
COMPANY OVERVIEW
4
Investor Presentation | March 2018 < Previous | Next >
MARICO AT A GLANCE
5
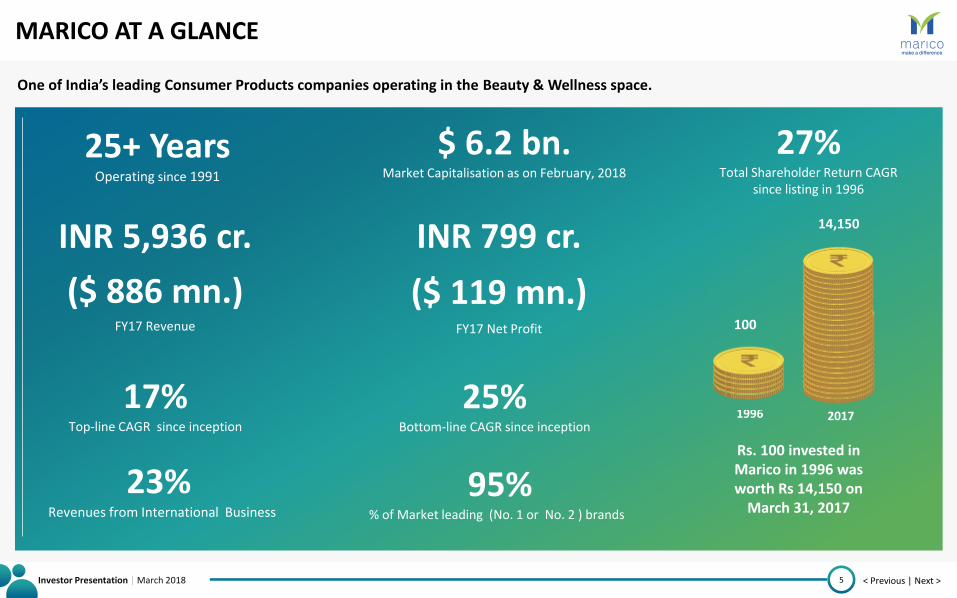
One of India’s leading Consumer Products companies operating in the Beauty & Wellness space.
95% % of Market leading (No. 1 or No. 2 ) brands
25% Bottom-line CAGR since inception
23% Revenues from International Business
17% Top-line CAGR since inception
INR 5,936 cr. INR 799 cr.
$ 6.2 bn. Market Capitalisation as on February, 2018
25+ Years Operating since 1991
($ 886 mn.)
FY17 Revenue
($ 119 mn.)
FY17 Net Profit
27% Total Shareholder Return CAGR
since listing in 1996
Rs. 100 invested in Marico in 1996 was worth Rs 14,150 on
March 31, 2017
1996 2017
100
14,150

Investor Presentation | March 2018 < Previous | Next >
INTERESTING FACTS
6
50% of our talent in consumer facing functions in Technology and Marketing are women
>10,000 Population of towns largely covered by Marico’s distribution network
170 million Households touched every month
1 out of 3 Indians’ lives is touched by Marico
47% of the total workforce are millennials
150 million Packs sold every month
1 out of 10 Coconuts grown in India are used by Marico
2,297 Size of Company workforce
Parachute World’s largest coconut oil brand
11 acquisitions in 11 years

Investor Presentation | March 2018 < Previous | Next >
MILESTONES IN MARICO’S JOURNEY SO FAR
7
Harsh Mariwala, a young graduate, joins the family
business
Harsh envisions a branded FMCG market for coconut and
refined edible oils
Harsh discovers the ubiquitous Parachute
blue bottle
2nd April 1990 – Marico is born
First overseas manufacturing facility
in Bangladesh
Marico lists on the Indian Stock Exchanges
Marico enters Skin Care solutions – Kaya is born
Marico launches Hair & Care, non-
sticky hair oil
1971 1990 1991 1996 1999 2002 1974 1980 2006
2010 2011 2012 2013 2014 2017 2006-07 2009
Nihar enters Marico’s fold
Marico enters Egypt and South Africa through
acquisitions
Marico Bangladesh lists on Dhaka Stock
Exchange
Marico introduces Saffola Breakfast
Marico enters Vietnam through acquisition of ICP
Marico acquires Livon & Set Wet
Kaya Skin Care demerged
Harsh steps down as MD and Saugata Gupta takes
over
Investment in Startup Ecosystem - Beardo
Investor Presentation | March 2018 < Previous | Next >
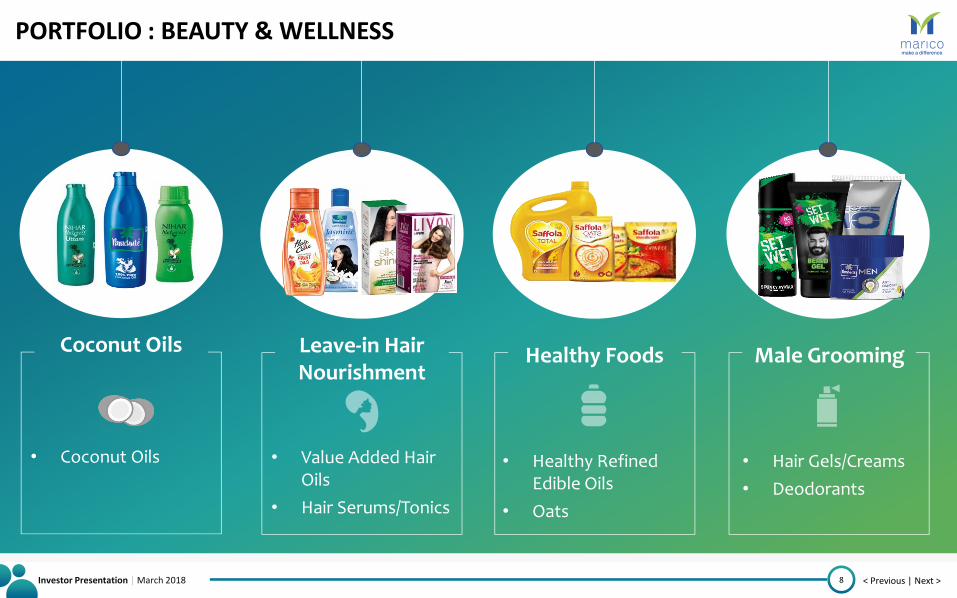
PORTFOLIO : BEAUTY & WELLNESS
8
Leave-in Hair Nourishment
Healthy Foods Male Grooming
• Value Added Hair Oils
• Hair Serums/Tonics
• Healthy Refined Edible Oils
• Oats
• Hair Gels/Creams
• Deodorants
Coconut Oils
• Coconut Oils
Investor Presentation | March 2018 < Previous | Next >
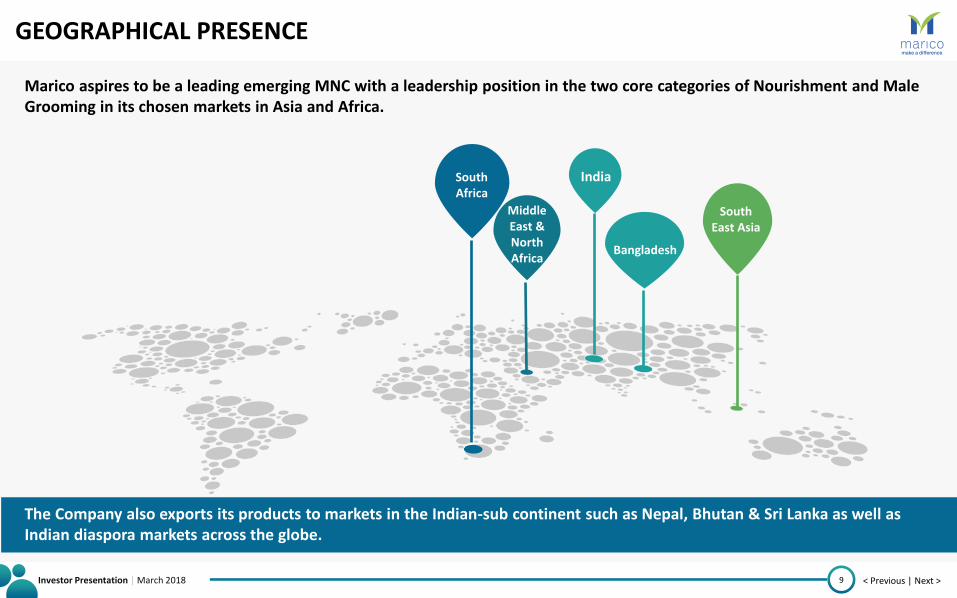
GEOGRAPHICAL PRESENCE
9
South Africa
Bangladesh
South East Asia
The Company also exports its products to markets in the Indian-sub continent such as Nepal, Bhutan & Sri Lanka as well as Indian diaspora markets across the globe.
Marico aspires to be a leading emerging MNC with a leadership position in the two core categories of Nourishment and Male Grooming in its chosen markets in Asia and Africa.
India
Middle East & North Africa
Investor Presentation | March 2018 < Previous | Next >
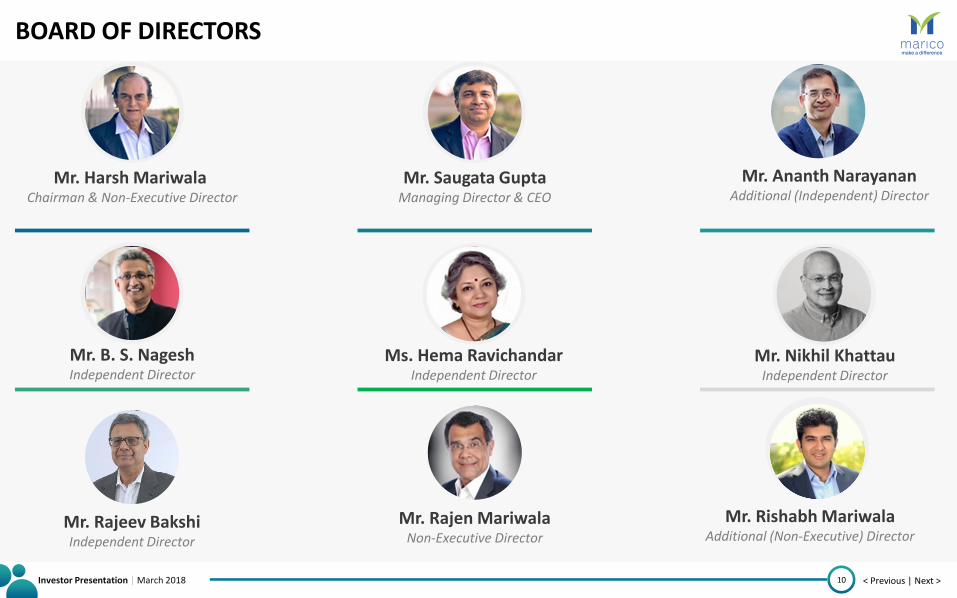
BOARD OF DIRECTORS
10
Mr. Harsh Mariwala Chairman & Non-Executive Director
Mr. Ananth Narayanan Additional (Independent) Director
Ms. Hema Ravichandar Independent Director
Mr. Saugata Gupta Managing Director & CEO
Mr. Rajen Mariwala Non-Executive Director
Mr. Nikhil Khattau Independent Director
Mr. B. S. Nagesh Independent Director
Mr. Rajeev Bakshi Independent Director
Mr. Rishabh Mariwala Additional (Non-Executive) Director
Investor Presentation | March 2018 < Previous | Next >
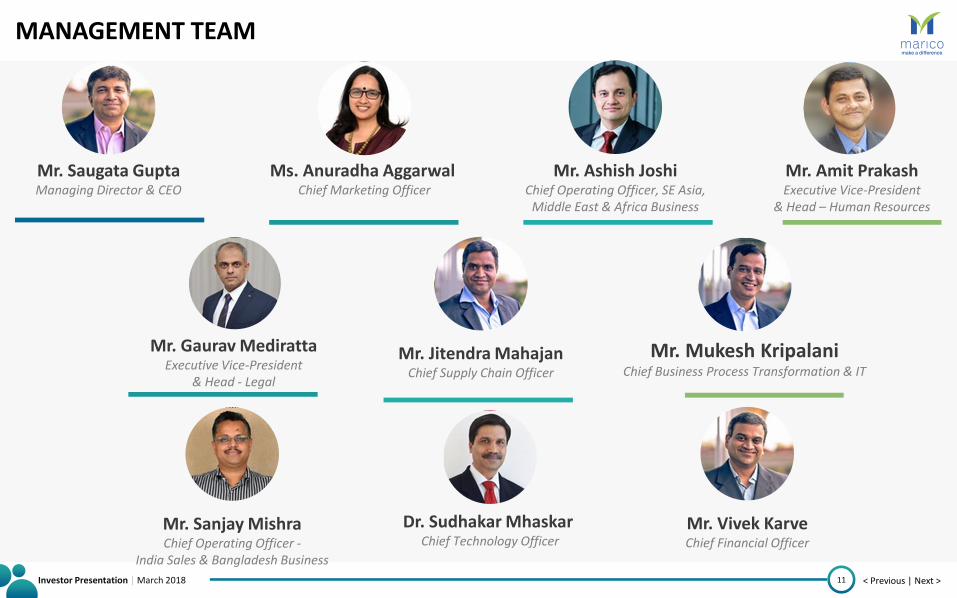
MANAGEMENT TEAM
11
Mr. Ashish Joshi Chief Operating Officer, SE Asia,
Middle East & Africa Business
Mr. Saugata Gupta Managing Director & CEO
Ms. Anuradha Aggarwal Chief Marketing Officer
Mr. Jitendra Mahajan Chief Supply Chain Officer
Mr. Mukesh Kripalani Chief Business Process Transformation & IT
Mr. Amit Prakash Executive Vice-President
& Head – Human Resources
Mr. Gaurav Mediratta Executive Vice-President
& Head - Legal
Mr. Sanjay Mishra Chief Operating Officer -
India Sales & Bangladesh Business
Dr. Sudhakar Mhaskar Chief Technology Officer
Mr. Vivek Karve Chief Financial Officer
Investor Presentation | March 2018 < Previous | Next >
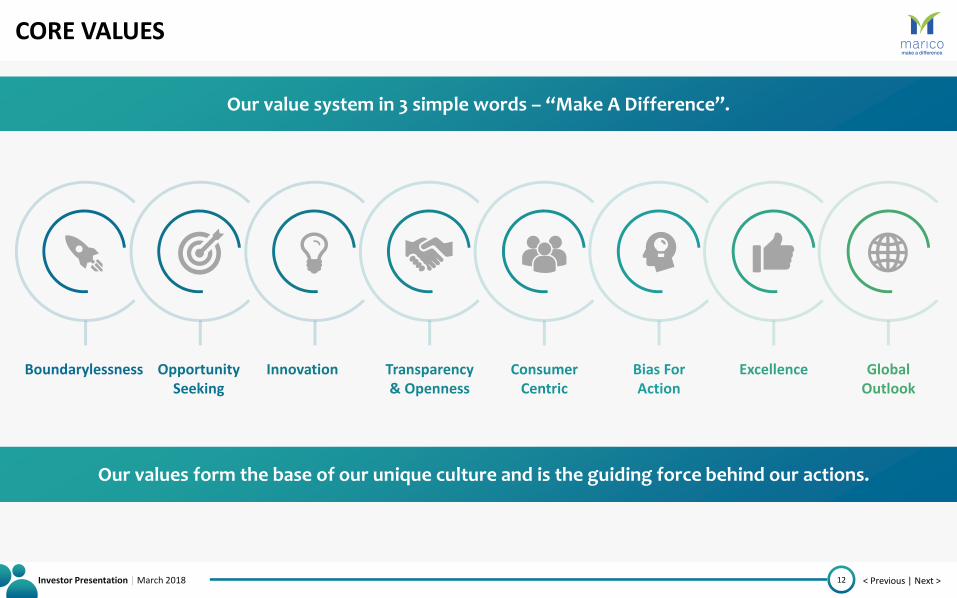
Our value system in 3 simple words – “Make A Difference”.
CORE VALUES
12
Our values form the base of our unique culture and is the guiding force behind our actions.
Boundarylessness Opportunity Seeking
Innovation Transparency & Openness
Consumer Centric
Bias For Action
Excellence Global Outlook

Investor Presentation | March 2018 < Previous | Next >
LIVING MARICO’S PURPOSE
13
SOCIETY
CUSTOMERS
SHAREHOLDERS
MEMBERS
BUSINESS ASSOCIATES
“To transform in a sustainable manner, the lives of those we touch, by nurturing and empowering them to maximise their true potential.”

Investor Presentation | March 2018 < Previous | Next >
STRATEGY FRAMEWORK
14
Investor Presentation | March 2018 < Previous | Next >
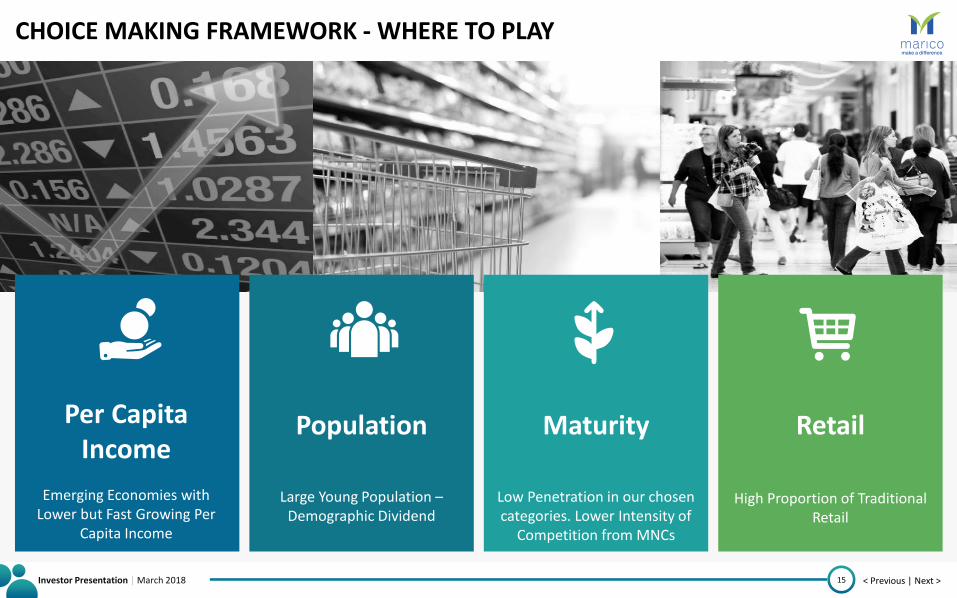
CHOICE MAKING FRAMEWORK - WHERE TO PLAY
15
Population
Large Young Population – Demographic Dividend
Per Capita Income
Emerging Economies with
Lower but Fast Growing Per Capita Income
Retail
High Proportion of Traditional Retail
Maturity
Low Penetration in our chosen categories. Lower Intensity of
Competition from MNCs

Investor Presentation | March 2018 < Previous | Next >
INORGANIC GROWTH OPPORTUNITIES - PLAYBOOK
16
New Markets
o Market Leader Brand
o Strong Distribution
Existing Markets
o Helps Build Scale -> Consolidate Market
o Broaden the Portfolio
o Accelerate Category Leadership
o Entry in New Category
o New Capabilities
Past Acquisitions
Hair Nourishment
Male Grooming
Categories Markets Existing Markets
Select Markets in
Asia and Africa
2006 2007-08
2011 2010
2017 2012
Key Attributes

Investor Presentation | March 2018 < Previous | Next >
INDIA BUSINESS
17
Investor Presentation | March 2018 < Previous | Next >
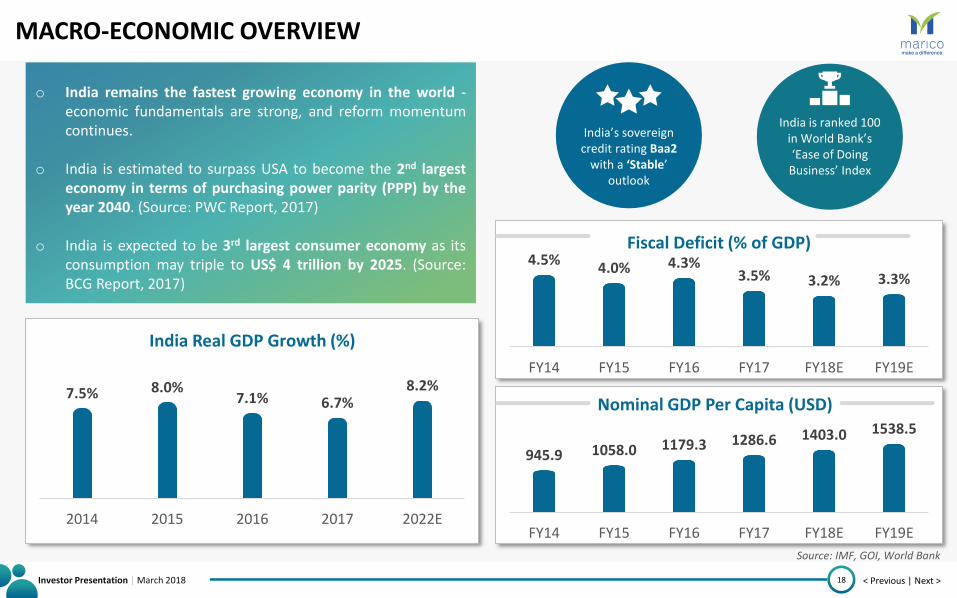
945.9 1058.0 1179.3 1286.6 1403.0 1538.5
0.0
200 .0
400 .0
600 .0
800 .0
100 0.0
120 0.0
140 0.0
160 0.0
180 0.0
FY14 FY15 FY16 FY17 FY18E FY19E
Nominal GDP Per Capita (USD)
MACRO-ECONOMIC OVERVIEW
18
o India remains the fastest growing economy in the world - economic fundamentals are strong, and reform momentum continues.
o India is estimated to surpass USA to become the 2nd largest economy in terms of purchasing power parity (PPP) by the year 2040. (Source: PWC Report, 2017)
o India is expected to be 3rd largest consumer economy as its consumption may triple to US$ 4 trillion by 2025. (Source: BCG Report, 2017)
4.5% 4.0% 4.3%
3.5% 3.2% 3.3%
0.0 %
0.5 %
1.0 %
1.5 %
2.0 %
2.5 %
3.0 %
3.5 %
4.0 %
4.5 %
5.0 %
FY14 FY15 FY16 FY17 FY18E FY19E
Fiscal Deficit (% of GDP)
Source: IMF, GOI, World Bank
7.5% 8.0% 7.1% 6.7%
8.2%
0.0 %
1.0 %
2.0 %
3.0 %
4.0 %
5.0 %
6.0 %
7.0 %
8.0 %
9.0 %
2014 2015 2016 2017 2022E
India Real GDP Growth (%)
India’s sovereign credit rating Baa2
with a ‘Stable’ outlook
India is ranked 100 in World Bank’s ‘Ease of Doing
Business’ Index
Investor Presentation | March 2018 < Previous | Next >
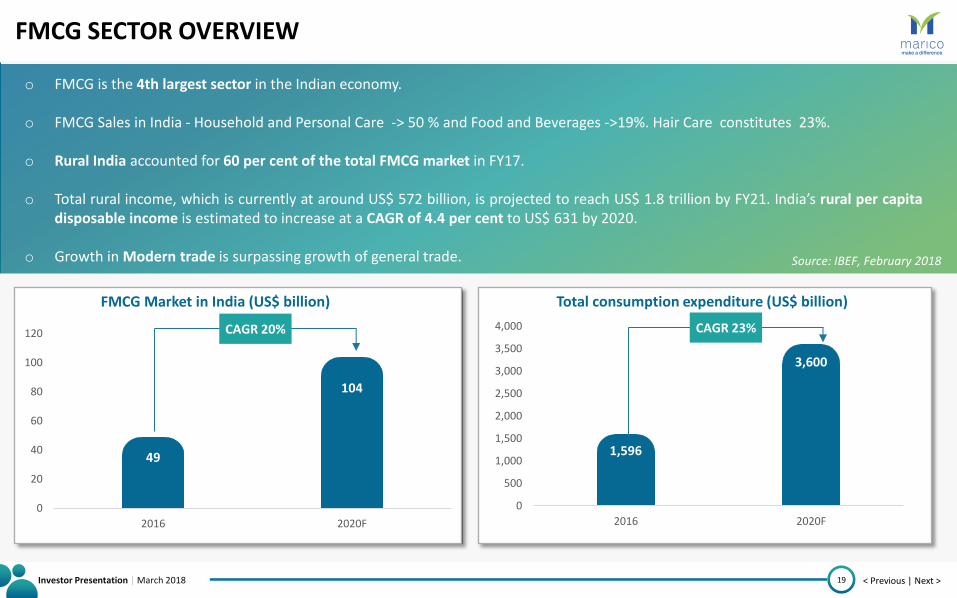
FMCG SECTOR OVERVIEW
19
o FMCG is the 4th largest sector in the Indian economy.
o FMCG Sales in India - Household and Personal Care -> 50 % and Food and Beverages ->19%. Hair Care constitutes 23%.
o Rural India accounted for 60 per cent of the total FMCG market in FY17.
o Total rural income, which is currently at around US$ 572 billion, is projected to reach US$ 1.8 trillion by FY21. India’s rural per capita disposable income is estimated to increase at a CAGR of 4.4 per cent to US$ 631 by 2020.
o Growth in Modern trade is surpassing growth of general trade. Source: IBEF, February 2018
49
104
0
20
40
60
80
100
120
2016 2020F
FMCG Market in India (US$ billion)
1,596
3,600
0
500
1,000
1,500
2,000
2,500
3,000
3,500
4,000
2016 2020F
Total consumption expenditure (US$ billion)
CAGR 20% CAGR 23%
Investor Presentation | March 2018 < Previous | Next >
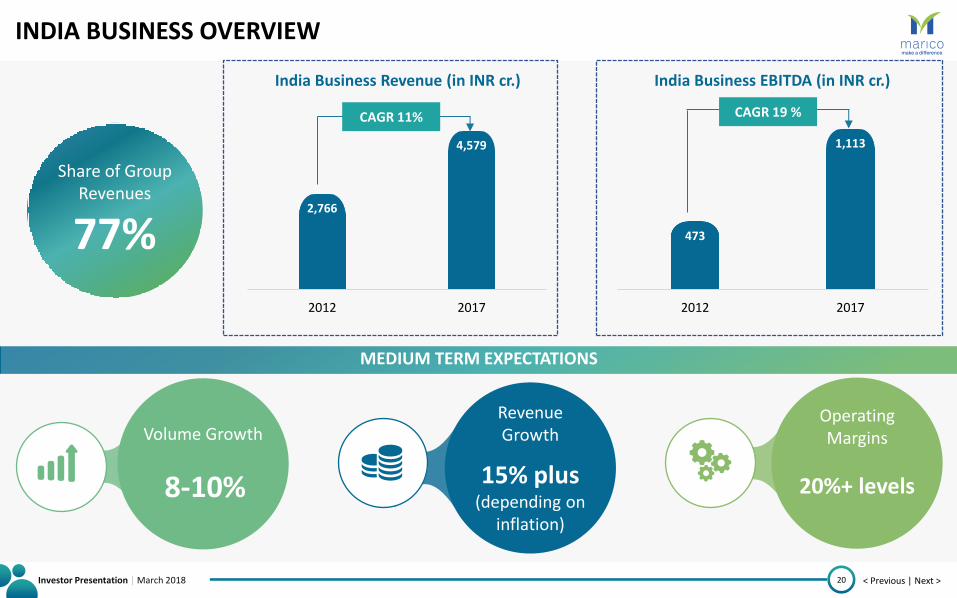
MEDIUM TERM EXPECTATIONS
INDIA BUSINESS OVERVIEW
20
Volume Growth
8-10%
Operating Margins
20%+ levels
Revenue Growth
15% plus (depending on
inflation)
473
1,113
2012 2017
India Business EBITDA (in INR cr.)
2,766
4,579
2012 2017
India Business Revenue (in INR cr.)
CAGR 11% CAGR 19 %
Share of Group Revenues
77%

Investor Presentation | March 2018 < Previous | Next >
INDIA BUSINESS - CATEGORY-WISE SHARE
21
PORTFOLIO DIVERSIFICATION: DEPENDENCE ON COCONUT OIL PROGRESSIVELY REDUCING
49%
20%
23%
1% 1%
6%
2012
Coconut Oil Value Added Hair OilsSaffola Male GroomingPremium Hair Nourishment Others
39%
28%
23%
3% 1% 6%
2017
Coconut Oil Value Added Hair OilsSaffola Male GroomingPremium Hair Nourishment Others
Investor Presentation | March 2018 < Previous | Next >
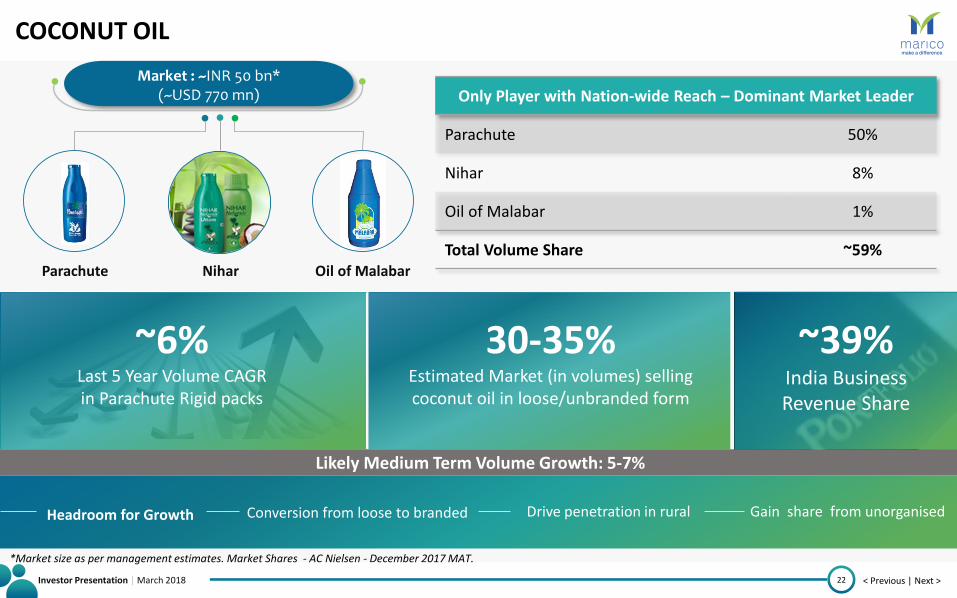
COCONUT OIL
22
~6% Last 5 Year Volume CAGR in Parachute Rigid packs
30-35% Estimated Market (in volumes) selling coconut oil in loose/unbranded form
~39% India Business Revenue Share
Headroom for Growth Conversion from loose to branded Drive penetration in rural Gain share from unorganised
Likely Medium Term Volume Growth: 5-7%
Only Player with Nation-wide Reach – Dominant Market Leader
Parachute 50%
Nihar 8%
Oil of Malabar 1%
Total Volume Share ~59%
Market : ~INR 50 bn* (~USD 770 mn)
Parachute Nihar Oil of Malabar
*Market size as per management estimates. Market Shares - AC Nielsen - December 2017 MAT.
Investor Presentation | March 2018 < Previous | Next >
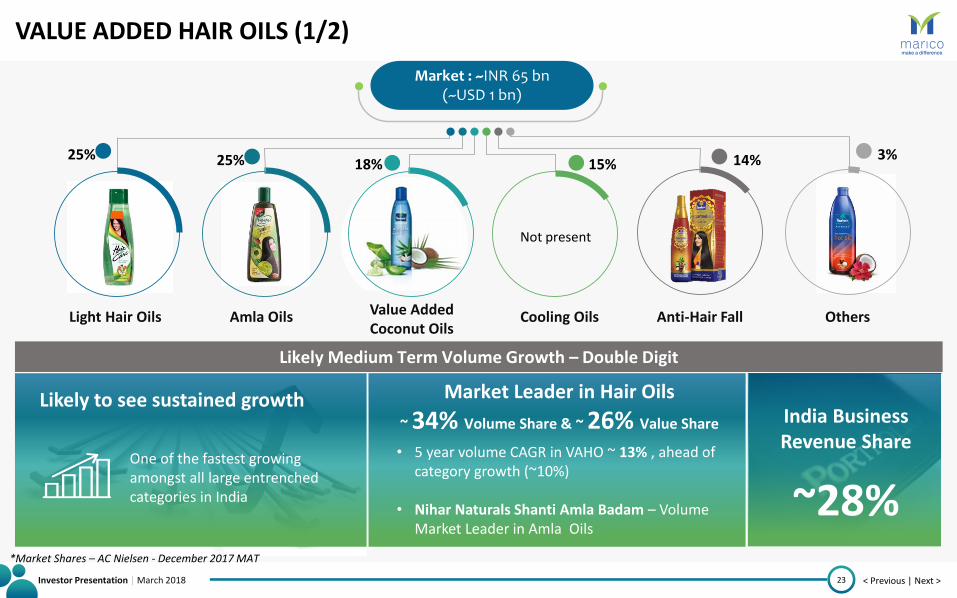
VALUE ADDED HAIR OILS (1/2)
23
Likely Medium Term Volume Growth – Double Digit
Likely to see sustained growth
One of the fastest growing amongst all large entrenched categories in India
Market Leader in Hair Oils
~ 34% Volume Share & ~ 26% Value Share
• 5 year volume CAGR in VAHO ~ 13% , ahead of category growth (~10%)
• Nihar Naturals Shanti Amla Badam – Volume Market Leader in Amla Oils
India Business Revenue Share
~28%
Market : ~INR 65 bn (~USD 1 bn)
Light Hair Oils Amla Oils Cooling Oils Anti-Hair Fall Others
25% 25% 18% 15% 14% 3%
Value Added Coconut Oils
Not present
*Market Shares – AC Nielsen - December 2017 MAT
Investor Presentation | March 2018 < Previous | Next >
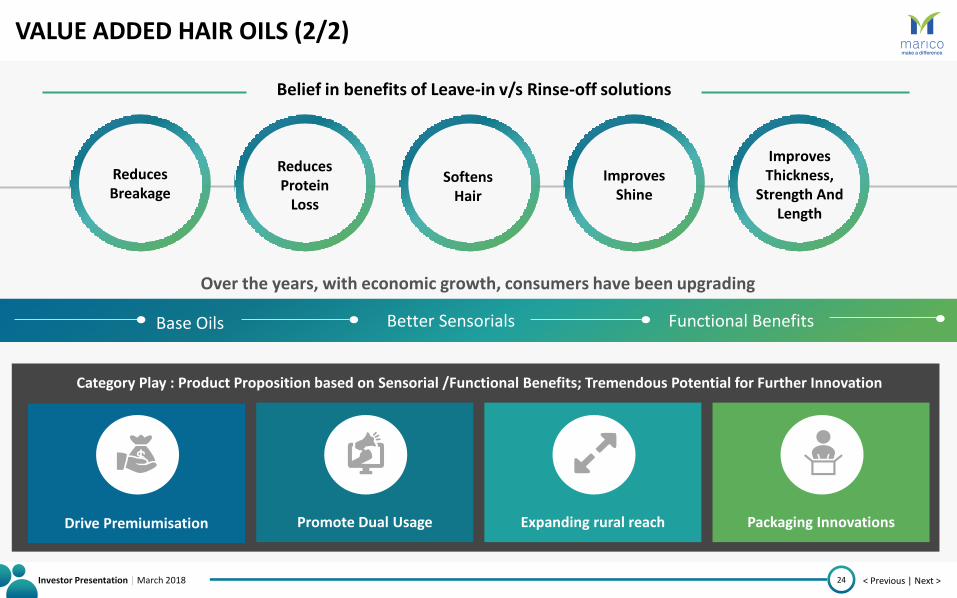
VALUE ADDED HAIR OILS (2/2)
24
Belief in benefits of Leave-in v/s Rinse-off solutions
Over the years, with economic growth, consumers have been upgrading
Base Oils Better Sensorials Functional Benefits
Reduces Breakage
Improves Thickness,
Strength And Length
Reduces Protein
Loss
Softens Hair
Improves Shine
Category Play : Product Proposition based on Sensorial /Functional Benefits; Tremendous Potential for Further Innovation
Drive Premiumisation Promote Dual Usage Expanding rural reach Packaging Innovations
Investor Presentation | March 2018 < Previous | Next >
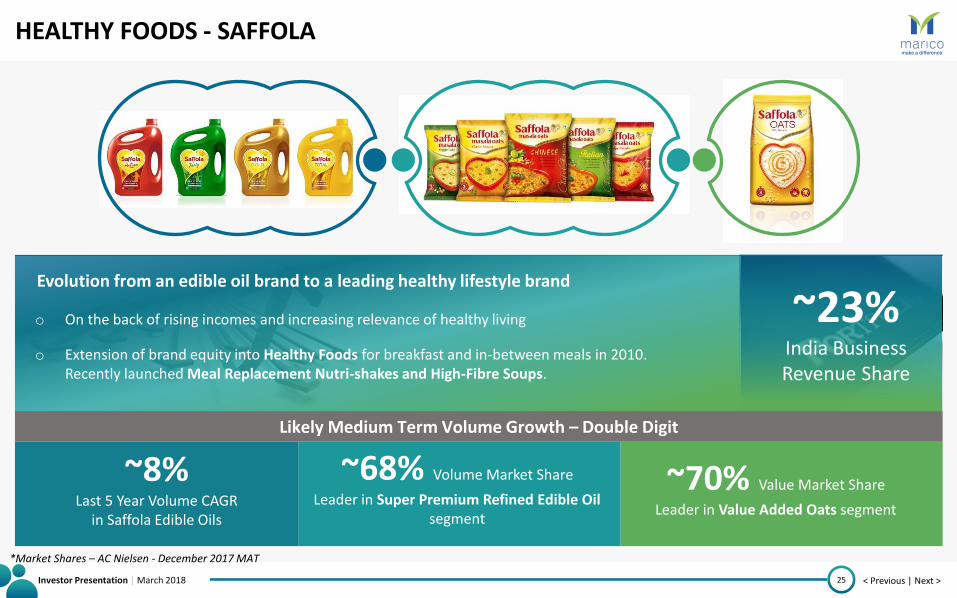
HEALTHY FOODS - SAFFOLA
25
~23% India Business Revenue Share
Evolution from an edible oil brand to a leading healthy lifestyle brand
o On the back of rising incomes and increasing relevance of healthy living
o Extension of brand equity into Healthy Foods for breakfast and in-between meals in 2010. Recently launched Meal Replacement Nutri-shakes and High-Fibre Soups.
Likely Medium Term Volume Growth – Double Digit
~68% Volume Market Share
Leader in Super Premium Refined Edible Oil segment
*Market Shares – AC Nielsen - December 2017 MAT
~70% Value Market Share
Leader in Value Added Oats segment
~8% Last 5 Year Volume CAGR
in Saffola Edible Oils
Investor Presentation | March 2018 < Previous | Next >
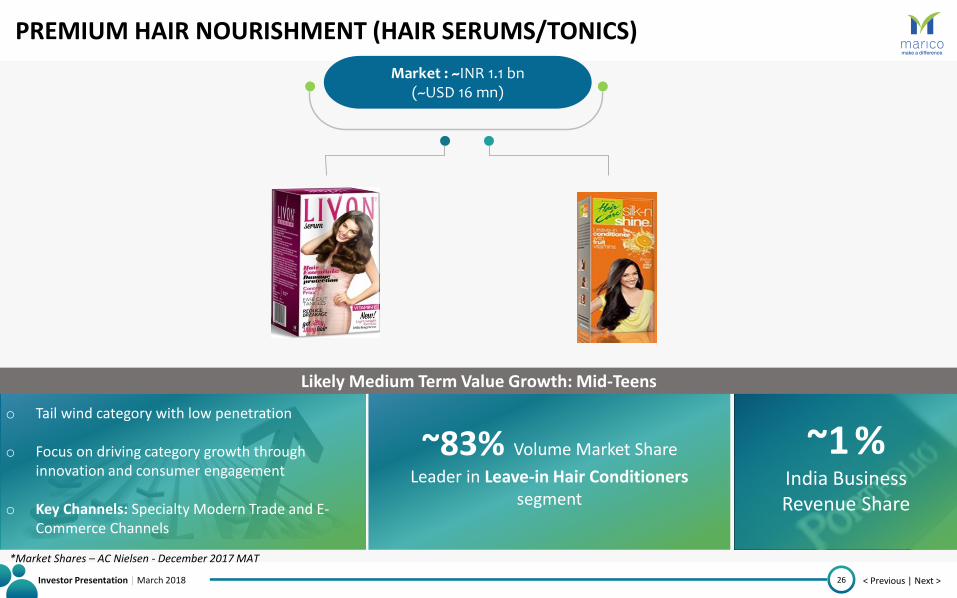
PREMIUM HAIR NOURISHMENT (HAIR SERUMS/TONICS)
26
o Tail wind category with low penetration
o Focus on driving category growth through innovation and consumer engagement
o Key Channels: Specialty Modern Trade and E-Commerce Channels
~1 % India Business Revenue Share
Likely Medium Term Value Growth: Mid-Teens
*Market Shares – AC Nielsen - December 2017 MAT
~83% Volume Market Share
Leader in Leave-in Hair Conditioners segment
Market : ~INR 1.1 bn (~USD 16 mn)

Investor Presentation | March 2018 < Previous | Next >
MALE GROOMING
27
~63% Value Market Share
Leader in Hair Creams/Gels segment
Medium Term Strategy
o Growing the market through continuous product and marketing innovations
o Leveraging the widespread distribution network and gain access to cosmetics/chemist outlets
Hair Gels/ Creams Market: INR 2.4 bn (~USD 37 mn)
Deodorants Market: INR 21 bn (~USD 323 mn)
o Marico acquired Set Wet in May 2012
o Tail wind category with low penetration
o Caters to millennials – therefore huge growth potential
~3 % India Business Revenue Share
Likely Medium Term Value Growth: Mid-Teens
*Market Shares – AC Nielsen - December 2017 MAT

Investor Presentation | March 2018 < Previous | Next >
STRONG DISTRIBUTION NETWORK
28
Channel Split: Modern Trade (includes E-Commerce) has outpaced the other channels. E-Commerce, currently at ~1%, is expected to be ~2% of the India Business by FY19.
Direct Reach: ~900,000 outlets Initiatives in place to increase the reach.
Increased by ~220,000 outlets over the last 5 years.
Project ONE – Targeting direct coverage increase in top 20 towns (Incremental Turnover ~INR circa 88 crores in FY 2017)
Leveraged technology coupled with robust IT Infrastructure to drive impact
Urban – Rural Split : Rural sales up from 26% in FY10 to 31% in FY17.
85% 83%
7% 10% 8% 7%
FY12 FY17
General Trade Modern Trade CSD
74% 69%
26% 31%
FY10 FY17
Urban Rural
OVERALL REACH: 4.7 MILLION OUTLETS OUT OF 9.9 MILLION OUTLETS – HUGE HEADROOM FOR GROWTH
Investor Presentation | March 2018 < Previous | Next >
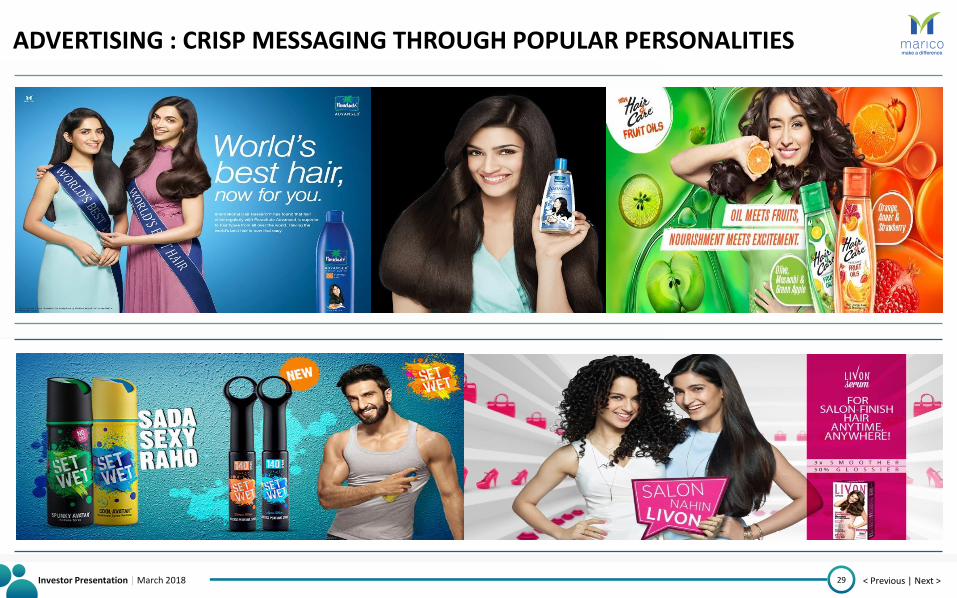
ADVERTISING : CRISP MESSAGING THROUGH POPULAR PERSONALITIES
29
Investor Presentation | March 2018 < Previous | Next >
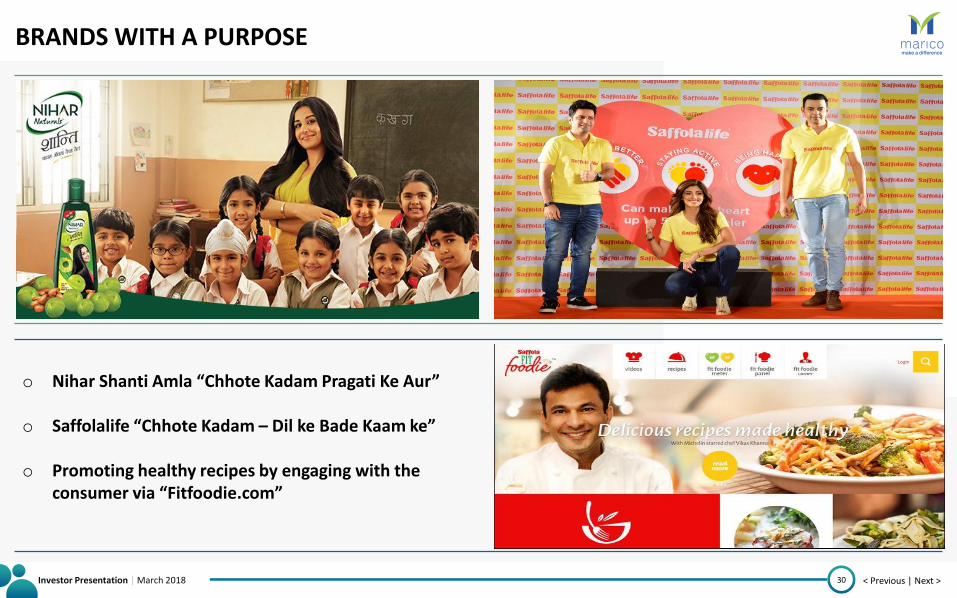
BRANDS WITH A PURPOSE
30
o Nihar Shanti Amla “Chhote Kadam Pragati Ke Aur”
o Saffolalife “Chhote Kadam – Dil ke Bade Kaam ke”
o Promoting healthy recipes by engaging with the consumer via “Fitfoodie.com”
Investor Presentation | March 2018 < Previous | Next >
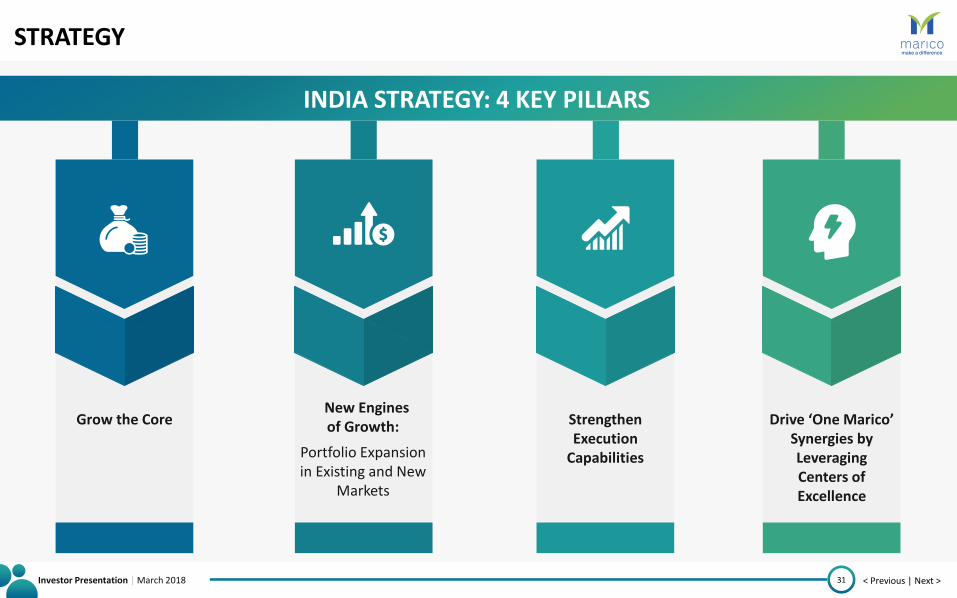
STRATEGY
31
INDIA STRATEGY: 4 KEY PILLARS
Drive ‘One Marico’ Synergies by Leveraging Centers of Excellence
Strengthen Execution
Capabilities
New Engines of Growth:
Portfolio Expansion in Existing and New
Markets
Grow the Core

Investor Presentation | March 2018 < Previous | Next >
INTERNATIONAL BUSINESS
32

Investor Presentation | March 2018 < Previous | Next >
MACRO-ECONOMIC OVERVIEW
33
Source: World Bank
2.8
5.0
1.8 3.0
3.2 3.2
FY2015 FY2016 FY2017 FY2018e FY2019e FY2020e
0.0
2.0
4.0
6.0
MENA (Middle East & North Africa)
GDP Growth (%)
6.7
6.2
6.7
6.5 6.5 6.5
FY2015 FY2016 FY2017 FY2018e FY2019e FY2020e
5.5
6
6.5
7
Vietnam
GDP Growth (%)
1.3
0.3 0.8
1.1
1.7 1.7
FY2015 FY2016 FY2017 FY2018e FY2019e FY2020e
0
1
2
South Africa
GDP Growth (%)
Recovery in Oil prices & Increase in Purchasing Power likely to overturn their fortune by 2020.
GDP Per Capita
$7,417 Projected
$7,156 by 2020
Inflation Rate
5.0%
GDP Per Capita
$1,850 Projected
$2,091 by 2020
Inflation Rate
3.2%
6.6
7.1
7.2
6.4 6.7 6.7
FY2015 FY2016 FY2017 FY2018e FY2019e FY2020e
6
6.5
7
7.5
Bangladesh
GDP Growth (%)
GDP Per Capita
$1,083 Projected
$1,292 by 2020
Inflation Rate
5.6%
BANGLADESH AND VIETNAM ON A FIRM FOOTING. HOPEFUL OF RECOVERY IN MENA AND SOUTH AFRICA.

Investor Presentation | March 2018 < Previous | Next >
MARICO INTERNATIONAL
34
935 1,008
1,168
1,284 1,345 1,356
FY12 FY13 FY14 FY15 FY16 FY17
44%
53%
15%
33%
7%
11%
28%
3%
6% FY17
FY10
Bangladesh MENA South Africa South East Asia Others
Likely Organic Growth : ~12-15% (constant currency) Maintain Operating Margin at ~16-17%
Operates in Geographic hubs leading to supply chain and media synergies
Share of Group Revenues
23%
MEDIUM TERM EXPECTATIONS
Investor Presentation | March 2018 < Previous | Next >
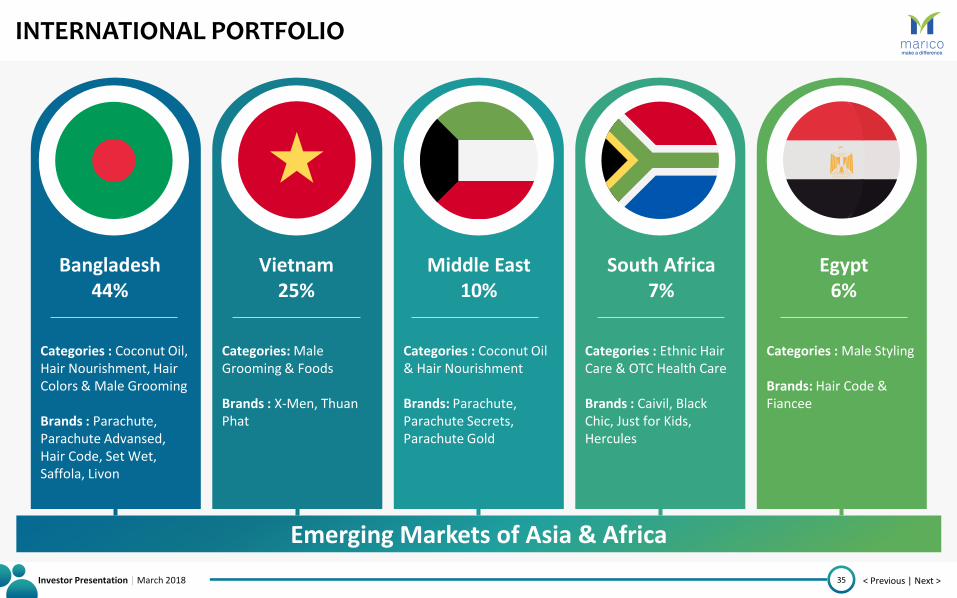
INTERNATIONAL PORTFOLIO
35
Categories : Coconut Oil & Hair Nourishment Brands: Parachute, Parachute Secrets, Parachute Gold
Middle East 10%
Categories : Coconut Oil, Hair Nourishment, Hair Colors & Male Grooming Brands : Parachute, Parachute Advansed, Hair Code, Set Wet, Saffola, Livon
Bangladesh 44%
Categories : Male Styling Brands: Hair Code & Fiancee
Egypt 6%
Categories: Male Grooming & Foods Brands : X-Men, Thuan Phat
Vietnam 25%
Categories : Ethnic Hair Care & OTC Health Care Brands : Caivil, Black Chic, Just for Kids, Hercules
South Africa 7%
Emerging Markets of Asia & Africa

Investor Presentation | March 2018 < Previous | Next >
INTERNATIONAL PORTFOLIO - BRANDS
36
X-Men - Vietnam Thuan Phat - Vietnam Parachute Gold – Middle East & Egypt
Parachute, VAHO and Hair Colours - Bangladesh Hair Code & Fiancee - Egypt
Code 10 – Malaysia & Myanmar Caivil, Black Chic, Hercules & Ingwe – South Africa
Investor Presentation | March 2018 < Previous | Next >
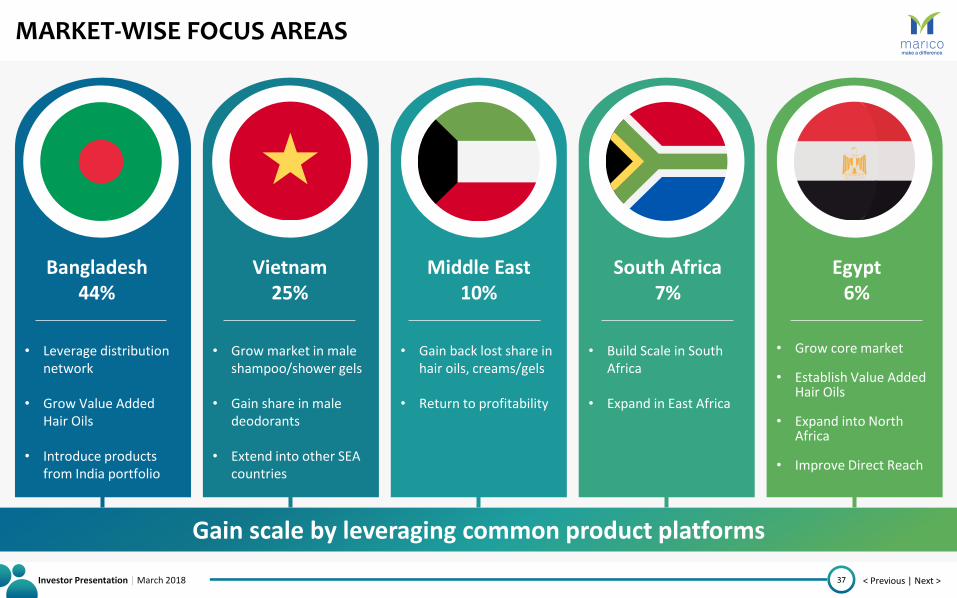
MARKET-WISE FOCUS AREAS
37
• Gain back lost share in hair oils, creams/gels
• Return to profitability
Middle East 10%
• Leverage distribution network
• Grow Value Added Hair Oils
• Introduce products from India portfolio
Bangladesh 44%
• Grow core market • Establish Value Added
Hair Oils
• Expand into North Africa
• Improve Direct Reach
Egypt 6%
• Grow market in male shampoo/shower gels
• Gain share in male
deodorants • Extend into other SEA
countries
Vietnam 25%
• Build Scale in South Africa
• Expand in East Africa
South Africa 7%
Gain scale by leveraging common product platforms
Investor Presentation | March 2018 < Previous | Next >
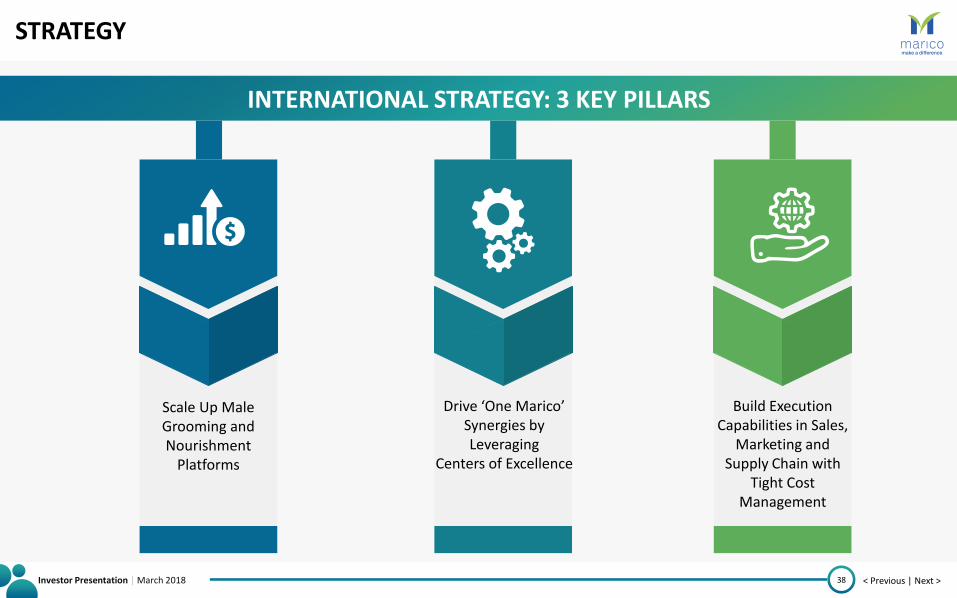
STRATEGY
38
INTERNATIONAL STRATEGY: 3 KEY PILLARS
Scale Up Male Grooming and Nourishment
Platforms
Drive ‘One Marico’ Synergies by Leveraging
Centers of Excellence
Build Execution Capabilities in Sales,
Marketing and Supply Chain with
Tight Cost Management
Investor Presentation | March 2018 < Previous | Next >
KEY AREAS OF TRANSFORMATION
39
Investor Presentation | March 2018 < Previous | Next >
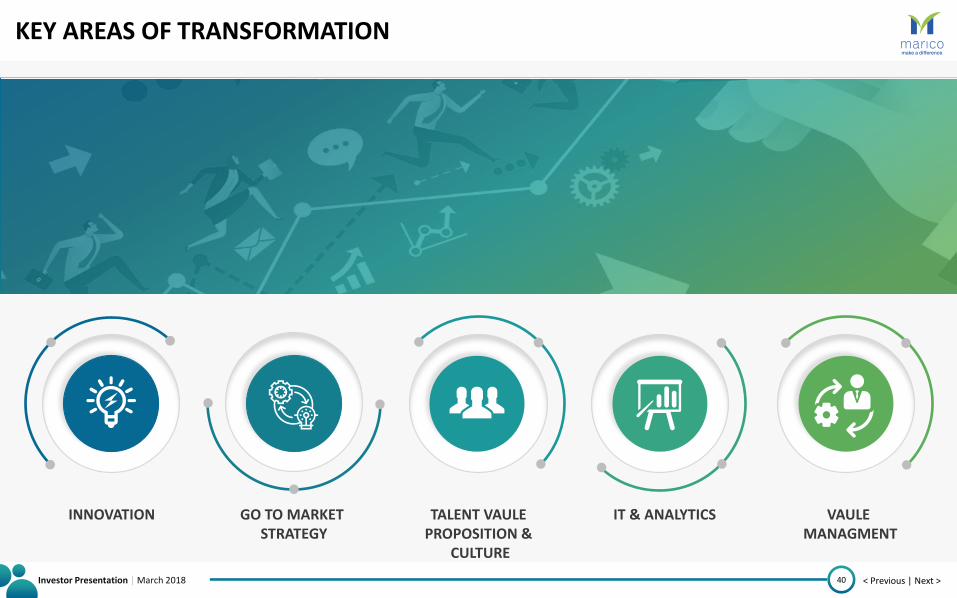
KEY AREAS OF TRANSFORMATION
40
INNOVATION GO TO MARKET STRATEGY
TALENT VAULE PROPOSITION &
CULTURE
IT & ANALYTICS VAULE MANAGMENT
Investor Presentation | March 2018 < Previous | Next >
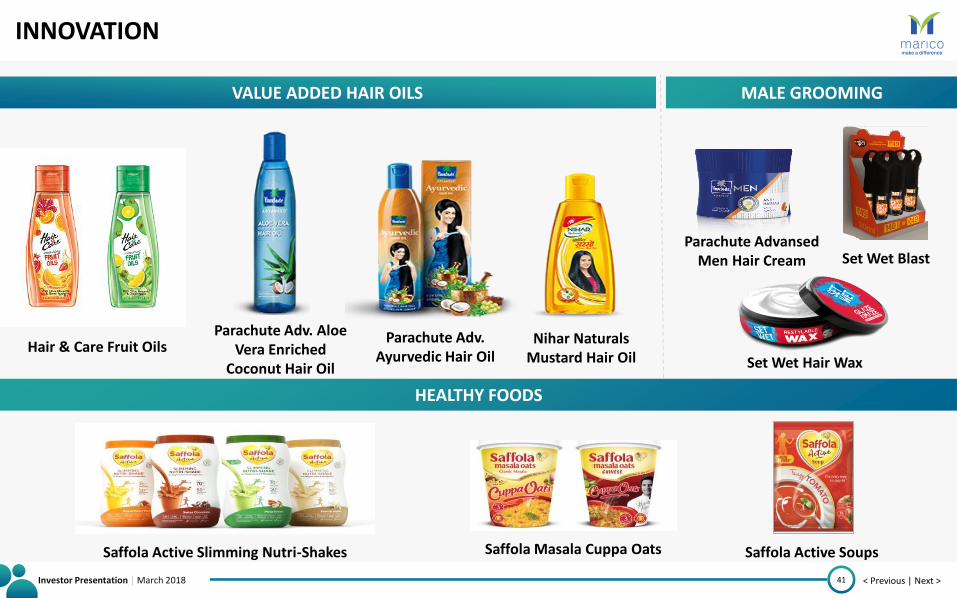
INNOVATION
41
VALUE ADDED HAIR OILS
HEALTHY FOODS
MALE GROOMING
Hair & Care Fruit Oils
Saffola Active Slimming Nutri-Shakes Saffola Masala Cuppa Oats Saffola Active Soups
Set Wet Hair Wax
Parachute Advansed Men Hair Cream Set Wet Blast
Parachute Adv. Aloe Vera Enriched
Coconut Hair Oil
Parachute Adv. Ayurvedic Hair Oil
Nihar Naturals Mustard Hair Oil
Investor Presentation | March 2018 < Previous | Next >
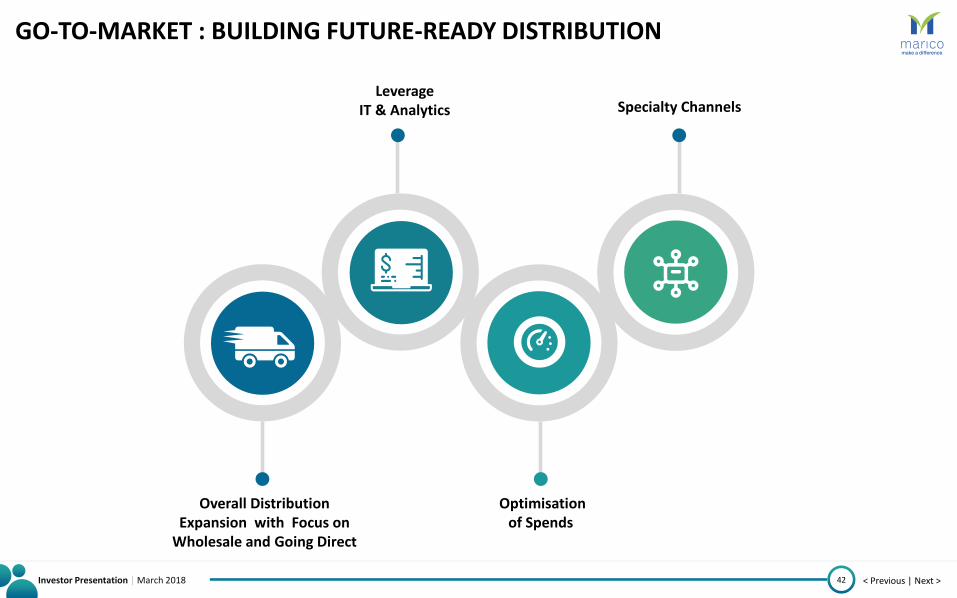
GO-TO-MARKET : BUILDING FUTURE-READY DISTRIBUTION
42
Overall Distribution Expansion with Focus on
Wholesale and Going Direct
Optimisation of Spends
Leverage IT & Analytics Specialty Channels
Investor Presentation | March 2018 < Previous | Next >
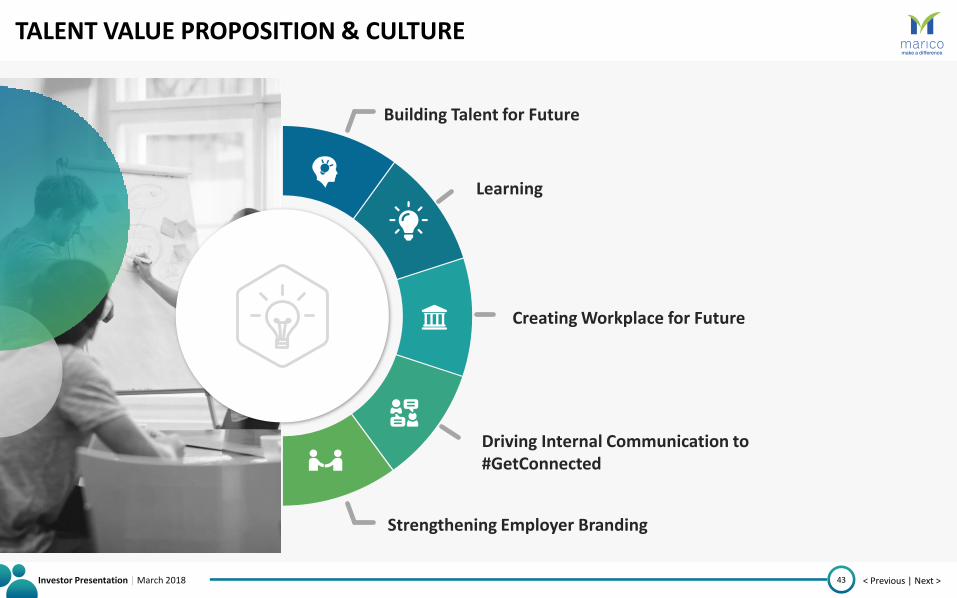
TALENT VALUE PROPOSITION & CULTURE
43
Building Talent for Future
Learning
Creating Workplace for Future
Driving Internal Communication to #GetConnected
Strengthening Employer Branding

Investor Presentation | March 2018 < Previous | Next >
IT & ANALYTICS
44
AUTOMATION LISTEN
REACH
ENGAGE
INNOVATE
SELL
ANALYTICS INTEGRATED CONSUMER EXPERIENCE
Digitise Operations
Innovate Business Models
Customers / Channel Partners
End Consumers
Investor Presentation | March 2018 < Previous | Next >
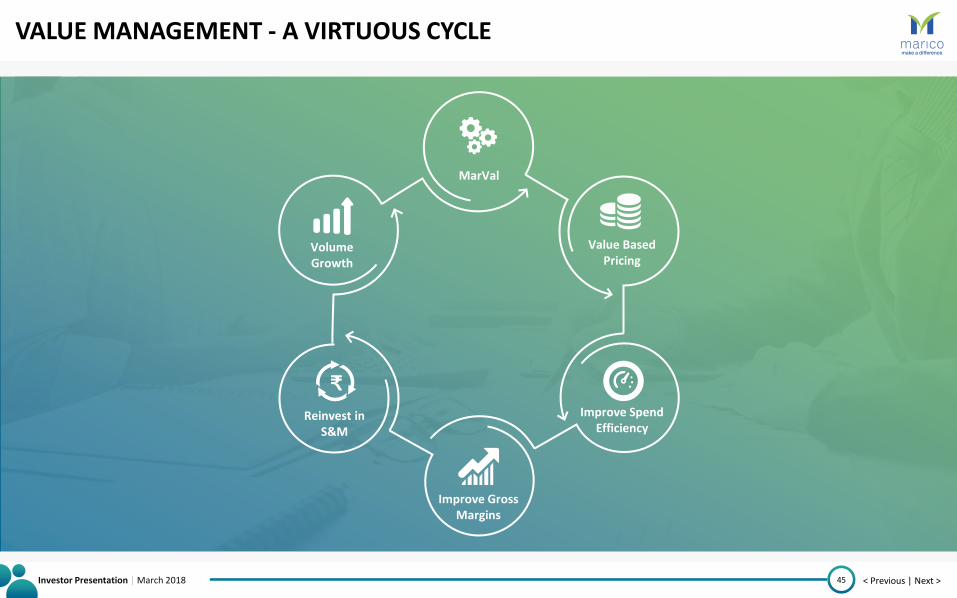
VALUE MANAGEMENT - A VIRTUOUS CYCLE
45
MarVal
Value Based Pricing
Improve Spend Efficiency
Improve Gross Margins
Reinvest in S&M
Volume Growth
₹

Investor Presentation | March 2018 < Previous | Next >
FINANCIAL HIGHLIGHTS
46
Investor Presentation | March 2018 < Previous | Next >
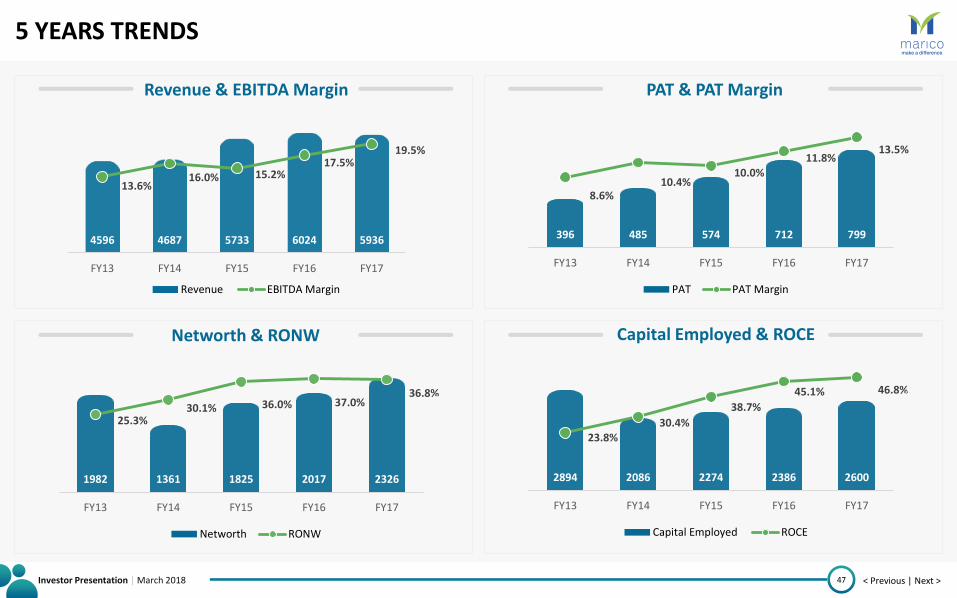
5 YEARS TRENDS
47
4596 4687 5733 6024 5936
13.6% 16.0% 15.2%
17.5% 19.5%
0.0%
5.0%
10.0%
15.0%
20.0%
25.0%
0
1000
2000
3000
4000
5000
6000
7000
FY13 FY14 FY15 FY16 FY17
Revenue & EBITDA Margin
Revenue EBITDA Margin
396 485 574 712 799
8.6% 10.4%
10.0% 11.8%
13.5%
0.0%
5.0%
10.0%
15.0%
0
200
400
600
800
1000
FY13 FY14 FY15 FY16 FY17
PAT & PAT Margin
PAT PAT Margin
1982 1361 1825 2017 2326
25.3% 30.1% 36.0% 37.0%
36.8%
0.0%
10.0%
20.0%
30.0%
40.0%
0
500
1000
1500
2000
2500
FY13 FY14 FY15 FY16 FY17
Networth & RONW
Networth RONW
2894 2086 2274 2386 2600
23.8% 30.4%
38.7%
45.1% 46.8%
0.0%
10.0%
20.0%
30.0%
40.0%
50.0%
0
500
1000
1500
2000
2500
3000
3500
FY13 FY14 FY15 FY16 FY17
Capital Employed & ROCE
Capital Employed ROCE
Investor Presentation | March 2018 < Previous | Next >
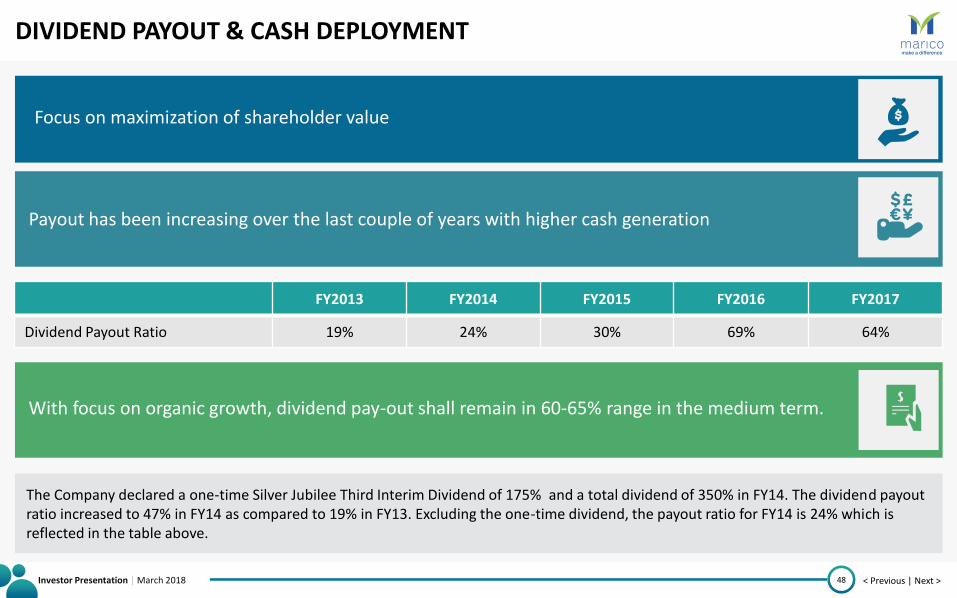
DIVIDEND PAYOUT & CASH DEPLOYMENT
48
The Company declared a one-time Silver Jubilee Third Interim Dividend of 175% and a total dividend of 350% in FY14. The dividend payout ratio increased to 47% in FY14 as compared to 19% in FY13. Excluding the one-time dividend, the payout ratio for FY14 is 24% which is reflected in the table above.
Focus on maximization of shareholder value
Payout has been increasing over the last couple of years with higher cash generation
With focus on organic growth, dividend pay-out shall remain in 60-65% range in the medium term.
FY2013 FY2014 FY2015 FY2016 FY2017
Dividend Payout Ratio 19% 24% 30% 69% 64%
Investor Presentation | March 2018 < Previous | Next >
SUSTAINABILITY
49
Investor Presentation | March 2018 < Previous | Next >
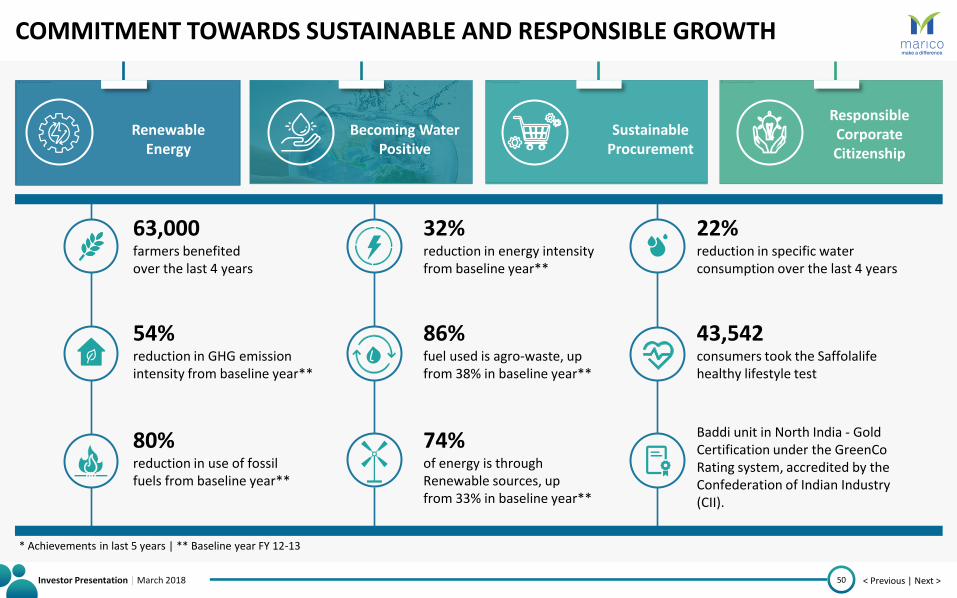
COMMITMENT TOWARDS SUSTAINABLE AND RESPONSIBLE GROWTH
50
Renewable Energy
Becoming Water Positive
Sustainable Procurement
Responsible Corporate Citizenship
63,000 farmers benefited over the last 4 years
54% reduction in GHG emission intensity from baseline year**
80% reduction in use of fossil fuels from baseline year**
32% reduction in energy intensity from baseline year**
86% fuel used is agro-waste, up from 38% in baseline year**
74% of energy is through Renewable sources, up from 33% in baseline year**
22% reduction in specific water consumption over the last 4 years
43,542 consumers took the Saffolalife healthy lifestyle test
Baddi unit in North India - Gold Certification under the GreenCo Rating system, accredited by the Confederation of Indian Industry (CII).
* Achievements in last 5 years | ** Baseline year FY 12-13
Investor Presentation | March 2018 < Previous | Next >
STOCK INFORMATION
51
Investor Presentation | March 2018 < Previous | Next >
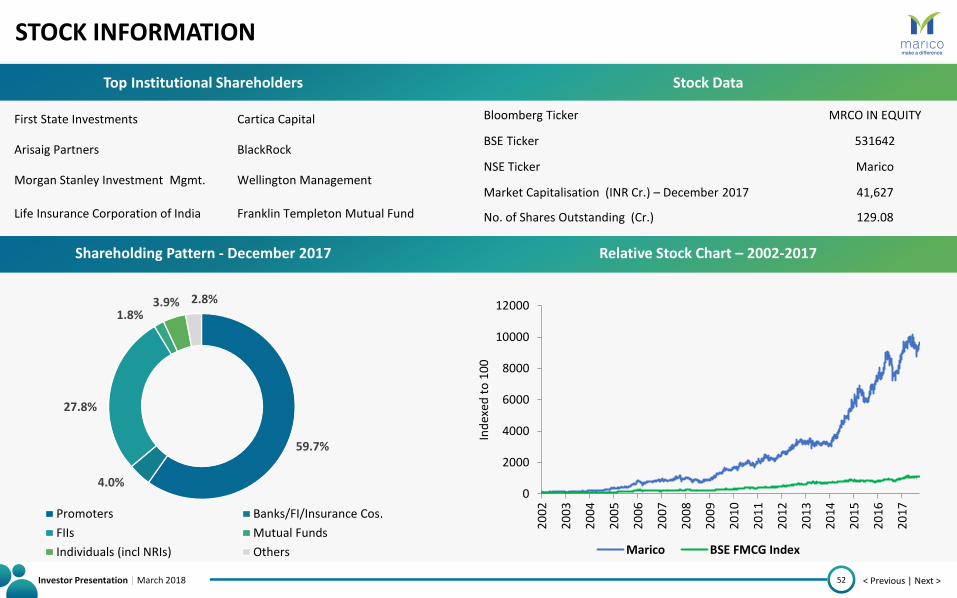
STOCK INFORMATION
52
First State Investments Cartica Capital
Arisaig Partners BlackRock
Morgan Stanley Investment Mgmt. Wellington Management
Life Insurance Corporation of India Franklin Templeton Mutual Fund
Bloomberg Ticker MRCO IN EQUITY
BSE Ticker 531642
NSE Ticker Marico
Market Capitalisation (INR Cr.) – December 2017 41,627
No. of Shares Outstanding (Cr.) 129.08
59.7%
4.0%
27.8%
1.8% 3.9% 2.8%
Promoters Banks/FI/Insurance Cos.
FIIs Mutual Funds
Individuals (incl NRIs) Others
Relative Stock Chart – 2002-2017
0
2000
4000
6000
8000
10000
12000
20
02
20
03
20
04
20
05
20
06
20
07
20
08
20
09
20
10
20
11
20
12
20
13
20
14
20
15
20
16
20
17
Ind
exed
to
10
0
Marico BSE FMCG Index
Shareholding Pattern - December 2017
Stock Data Top Institutional Shareholders
Investor Presentation | March 2018 < Previous | Next >
EXHIBITS
53
Investor Presentation | March 2018 < Previous | Next >
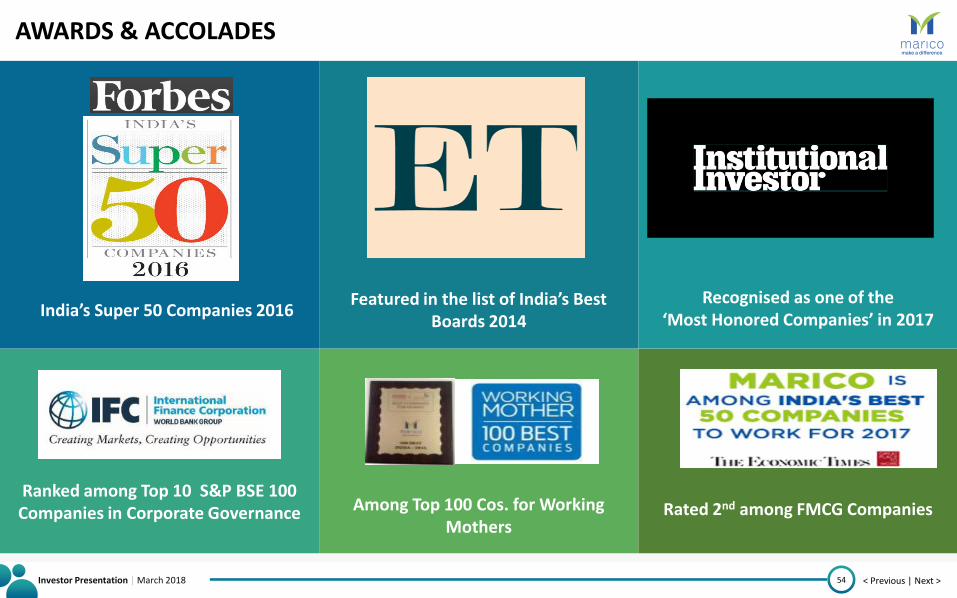
AWARDS & ACCOLADES
54
India’s Super 50 Companies 2016
Ranked among Top 10 S&P BSE 100 Companies in Corporate Governance Among Top 100 Cos. for Working
Mothers
Featured in the list of India’s Best Boards 2014
Recognised as one of the ‘Most Honored Companies’ in 2017
Rated 2nd among FMCG Companies
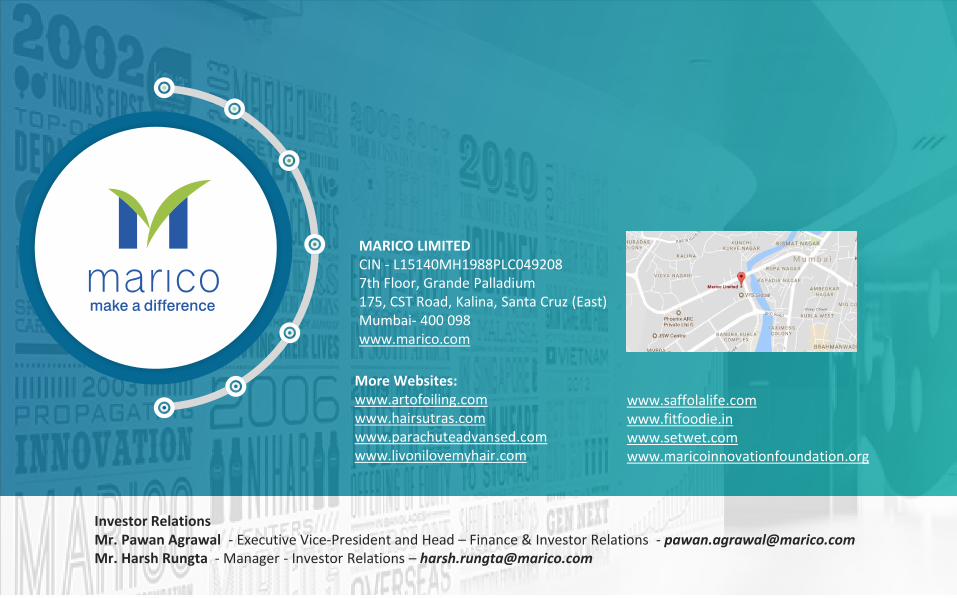
MARICO LIMITED CIN - L15140MH1988PLC049208 7th Floor, Grande Palladium 175, CST Road, Kalina, Santa Cruz (East) Mumbai- 400 098 www.marico.com
Investor Relations Mr. Pawan Agrawal - Executive Vice-President and Head – Finance & Investor Relations - [email protected] Mr. Harsh Rungta - Manager - Investor Relations – [email protected]
More Websites: www.artofoiling.com www.hairsutras.com www.parachuteadvansed.com www.livonilovemyhair.com
www.saffolalife.com www.fitfoodie.in www.setwet.com www.maricoinnovationfoundation.org