powerpoint templates page 1 powerpoint templates scalable text classification with sparse generative...
TRANSCRIPT

Powerpoint TemplatesPage 1
Powerpoint Templates
Scalable Text Classification with Sparse Generative Modeling
Antti Puurula Waikato University
Powerpoint TemplatesPage 2
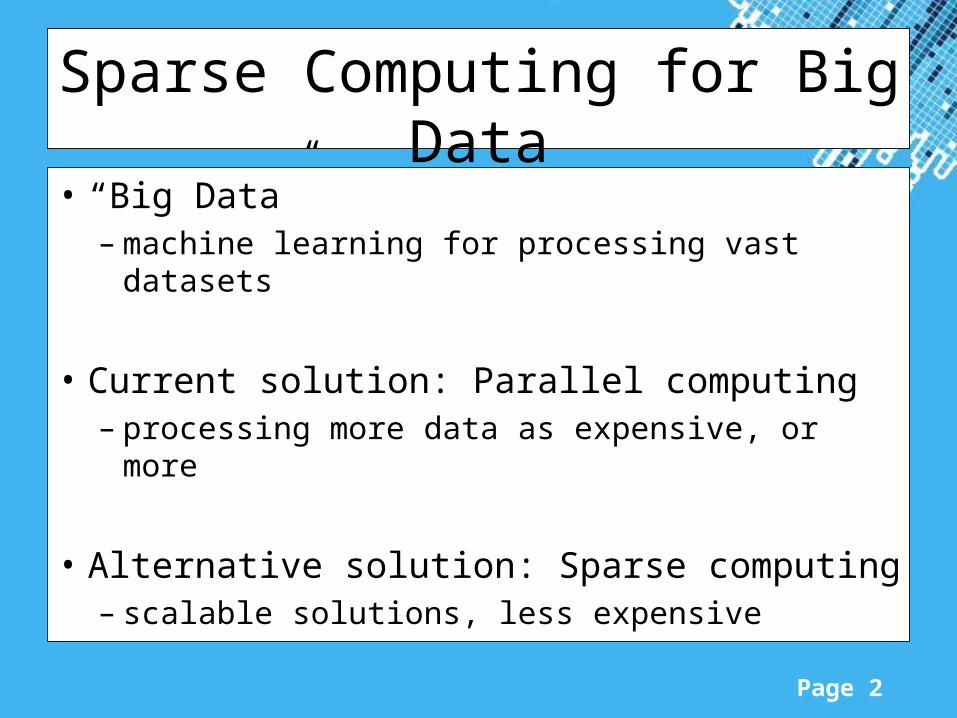
Sparse Computing for Big Data
• “Big Data”– machine learning for processing vast
datasets
• Current solution: Parallel computing– processing more data as expensive, or more
• Alternative solution: Sparse computing– scalable solutions, less expensive

Powerpoint TemplatesPage 3
Sparse Representation
• Example: document vector– Dense: word count vector w = [w1, …, wN]
• w = [0, 14, 0, 0, 0, 0, 0, 0, 0, 2, 0, 0, 0, 1, 0, 0, 3, 0, 0, 0]
– Sparse: vectors [v, c] of indices v and nonzeros c• v = [2, 10, 14, 17], c = [14, 2, 1, 3]
• Complexity: |w| vs. s(w), number of nonzeros
Powerpoint TemplatesPage 4
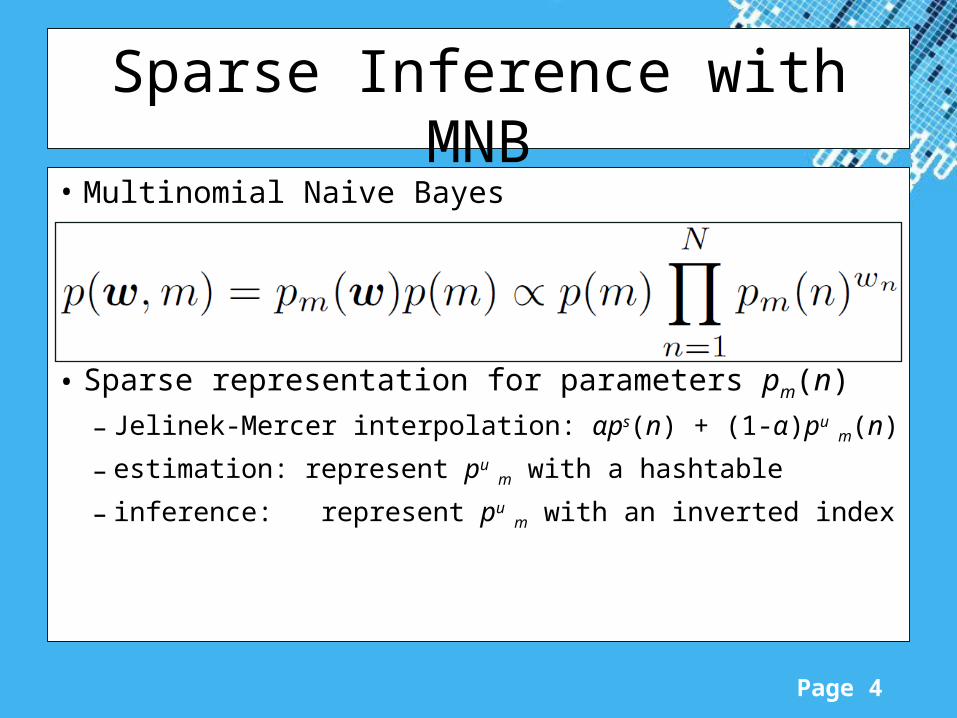
• Multinomial Naive Bayes
• Input word vector w, output label 1 ≤ m ≤ M
• Sparse representation for parameters pm(n)
– Jelinek-Mercer interpolation: αps(n) + (1-α)pu m(n)
– estimation: represent pu m with a hashtable
– inference: represent pu m with an inverted index
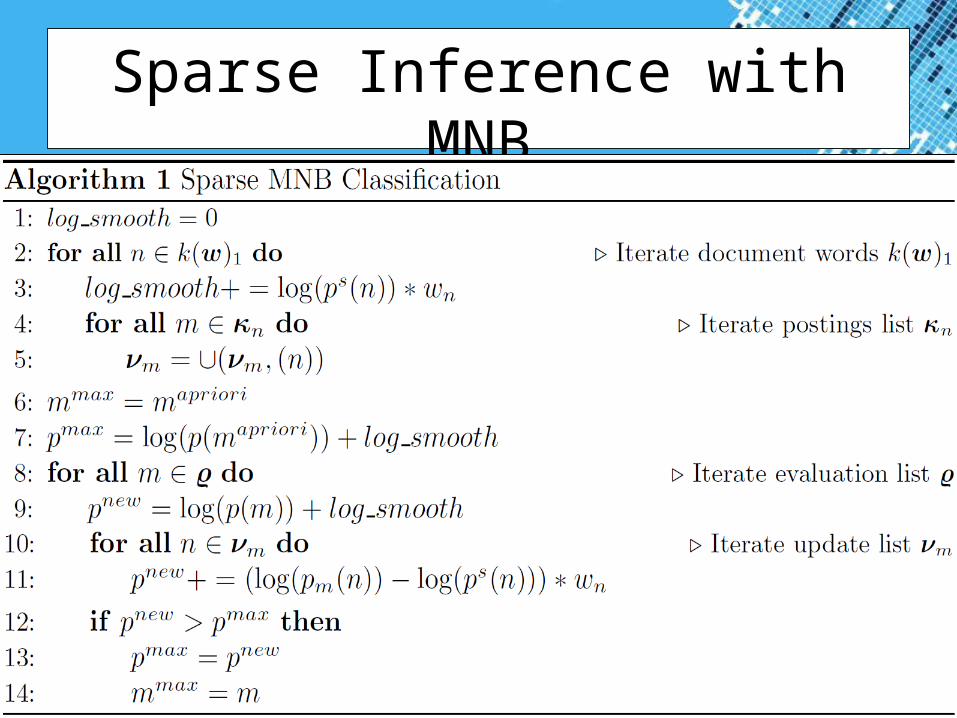
Sparse Inference with MNB

Powerpoint TemplatesPage 5
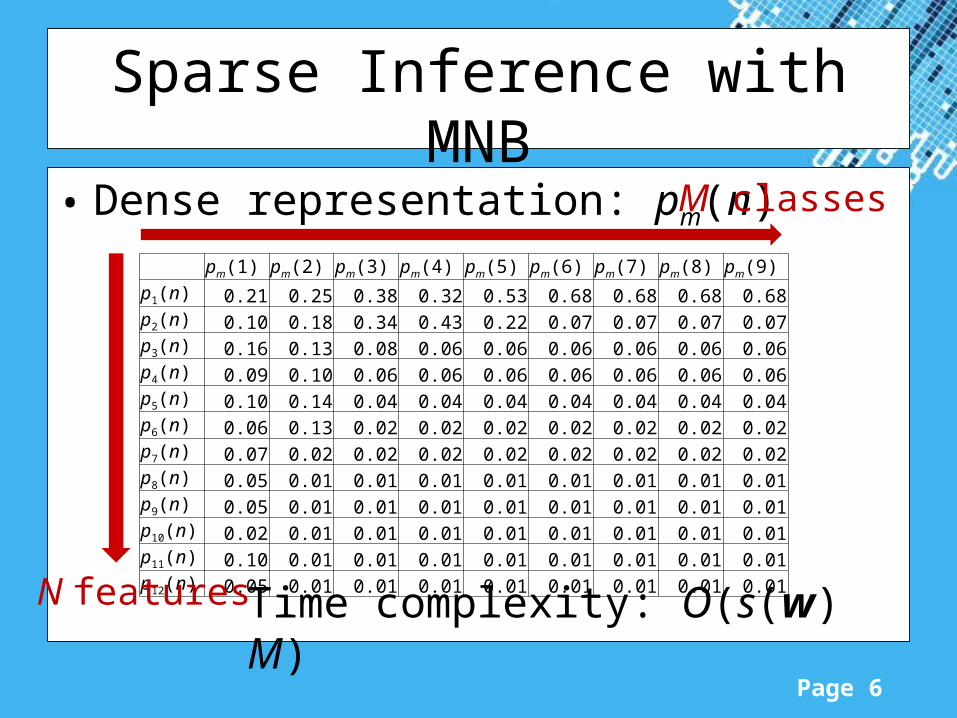
• Dense representation: pm(n)
Sparse Inference with MNB
pm(1) pm(2) pm(3) pm(4) pm(5) pm(6) pm(7) pm(8) pm(9) p1(n) 0.21 0.25 0.38 0.32 0.53 0.68 0.68 0.68 0.68p2(n) 0.10 0.18 0.34 0.43 0.22 0.07 0.07 0.07 0.07p3(n) 0.16 0.13 0.08 0.06 0.06 0.06 0.06 0.06 0.06p4(n) 0.09 0.10 0.06 0.06 0.06 0.06 0.06 0.06 0.06p5(n) 0.10 0.14 0.04 0.04 0.04 0.04 0.04 0.04 0.04p6(n) 0.06 0.13 0.02 0.02 0.02 0.02 0.02 0.02 0.02p7(n) 0.07 0.02 0.02 0.02 0.02 0.02 0.02 0.02 0.02p8(n) 0.05 0.01 0.01 0.01 0.01 0.01 0.01 0.01 0.01p9(n) 0.05 0.01 0.01 0.01 0.01 0.01 0.01 0.01 0.01p10(n) 0.02 0.01 0.01 0.01 0.01 0.01 0.01 0.01 0.01p11(n) 0.10 0.01 0.01 0.01 0.01 0.01 0.01 0.01 0.01p12(n) 0.05 0.01 0.01 0.01 0.01 0.01 0.01 0.01 0.01
Powerpoint TemplatesPage 6
• Dense representation: pm(n)
Sparse Inference with MNB
pm(1) pm(2) pm(3) pm(4) pm(5) pm(6) pm(7) pm(8) pm(9) p1(n) 0.21 0.25 0.38 0.32 0.53 0.68 0.68 0.68 0.68p2(n) 0.10 0.18 0.34 0.43 0.22 0.07 0.07 0.07 0.07p3(n) 0.16 0.13 0.08 0.06 0.06 0.06 0.06 0.06 0.06p4(n) 0.09 0.10 0.06 0.06 0.06 0.06 0.06 0.06 0.06p5(n) 0.10 0.14 0.04 0.04 0.04 0.04 0.04 0.04 0.04p6(n) 0.06 0.13 0.02 0.02 0.02 0.02 0.02 0.02 0.02p7(n) 0.07 0.02 0.02 0.02 0.02 0.02 0.02 0.02 0.02p8(n) 0.05 0.01 0.01 0.01 0.01 0.01 0.01 0.01 0.01p9(n) 0.05 0.01 0.01 0.01 0.01 0.01 0.01 0.01 0.01p10(n) 0.02 0.01 0.01 0.01 0.01 0.01 0.01 0.01 0.01p11(n) 0.10 0.01 0.01 0.01 0.01 0.01 0.01 0.01 0.01p12(n) 0.05 0.01 0.01 0.01 0.01 0.01 0.01 0.01 0.01
Time complexity: O(s(w) M)
M classes
N features
Powerpoint TemplatesPage 7
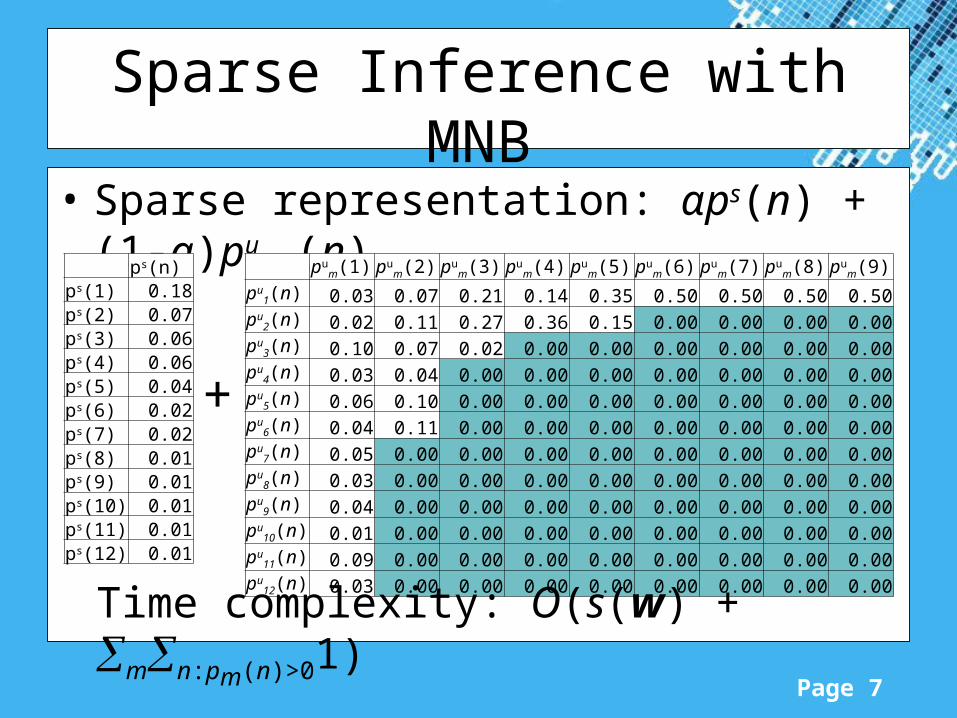
• Sparse representation: αps(n) + (1-α)pu
m(n)
Sparse Inference with MNB
pum(1) pu
m(2) pum(3) pu
m(4) pum(5) pu
m(6) pum(7) pu
m(8) pum(9)
pu1(n) 0.03 0.07 0.21 0.14 0.35 0.50 0.50 0.50 0.50
pu2(n) 0.02 0.11 0.27 0.36 0.15 0.00 0.00 0.00 0.00
pu3(n) 0.10 0.07 0.02 0.00 0.00 0.00 0.00 0.00 0.00
pu4(n) 0.03 0.04 0.00 0.00 0.00 0.00 0.00 0.00 0.00
pu5(n) 0.06 0.10 0.00 0.00 0.00 0.00 0.00 0.00 0.00
pu6(n) 0.04 0.11 0.00 0.00 0.00 0.00 0.00 0.00 0.00
pu7(n) 0.05 0.00 0.00 0.00 0.00 0.00 0.00 0.00 0.00
pu8(n) 0.03 0.00 0.00 0.00 0.00 0.00 0.00 0.00 0.00
pu9(n) 0.04 0.00 0.00 0.00 0.00 0.00 0.00 0.00 0.00
pu10(n) 0.01 0.00 0.00 0.00 0.00 0.00 0.00 0.00 0.00
pu11(n) 0.09 0.00 0.00 0.00 0.00 0.00 0.00 0.00 0.00
pu12(n) 0.03 0.00 0.00 0.00 0.00 0.00 0.00 0.00 0.00
ps(n)ps(1) 0.18ps(2) 0.07ps(3) 0.06ps(4) 0.06ps(5) 0.04ps(6) 0.02ps(7) 0.02ps(8) 0.01ps(9) 0.01ps(10) 0.01ps(11) 0.01ps(12) 0.01
+
Time complexity: O(s(w) + mn:pm(n)>01)
Powerpoint TemplatesPage 8
Sparse Inference with MNB
Powerpoint TemplatesPage 9
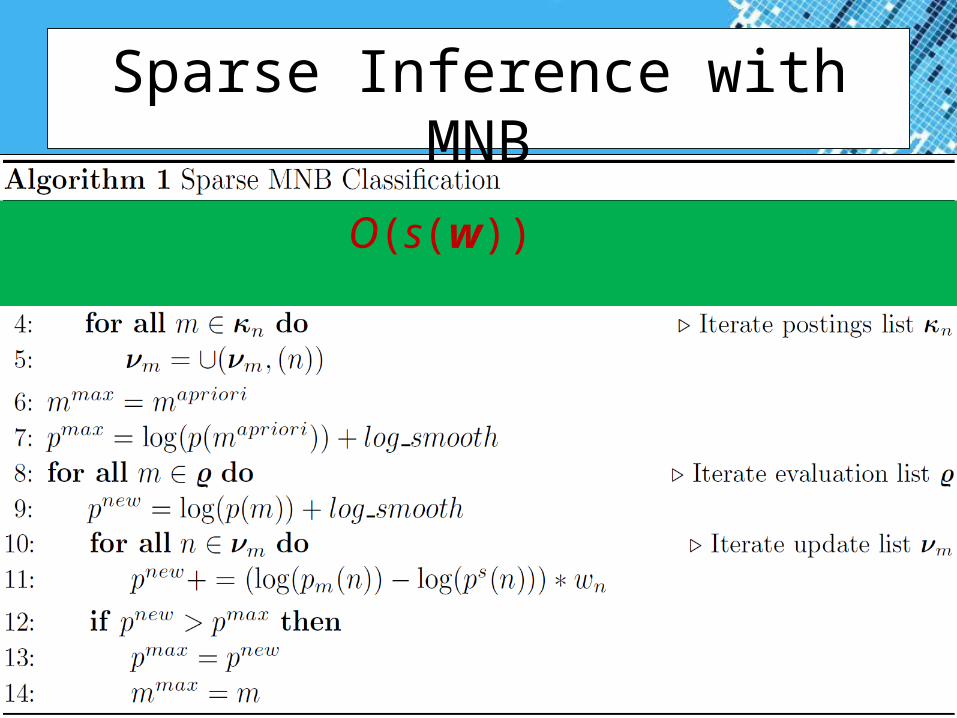
Sparse Inference with MNB
O(s(w))
Powerpoint TemplatesPage 10
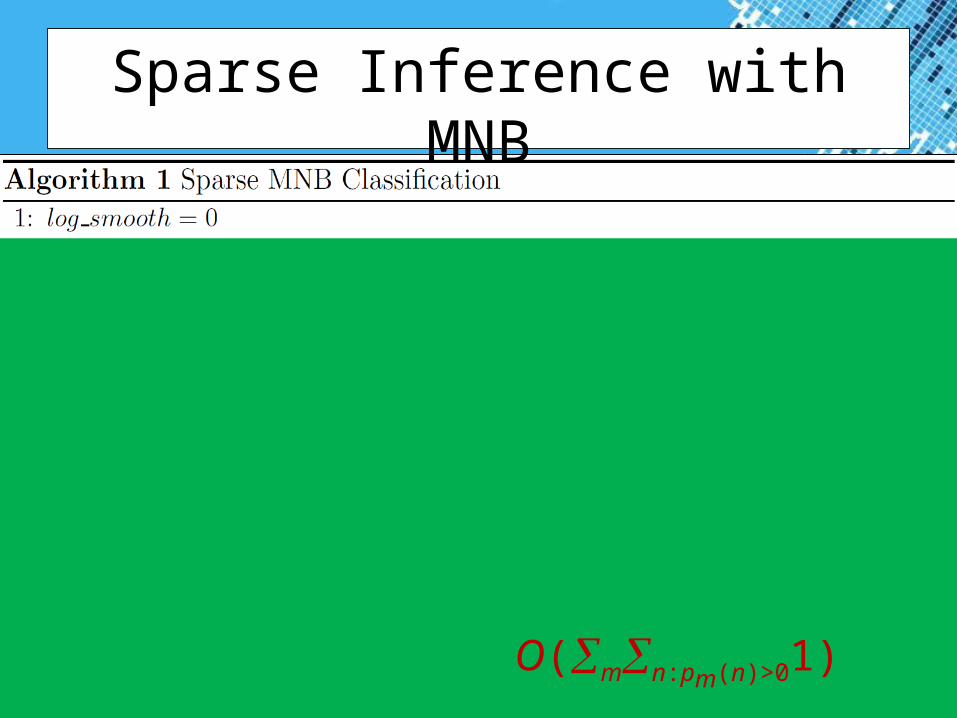
Sparse Inference with MNB
O(mn:pm(n)>01)
Powerpoint TemplatesPage 11
Multi-label Classifiers
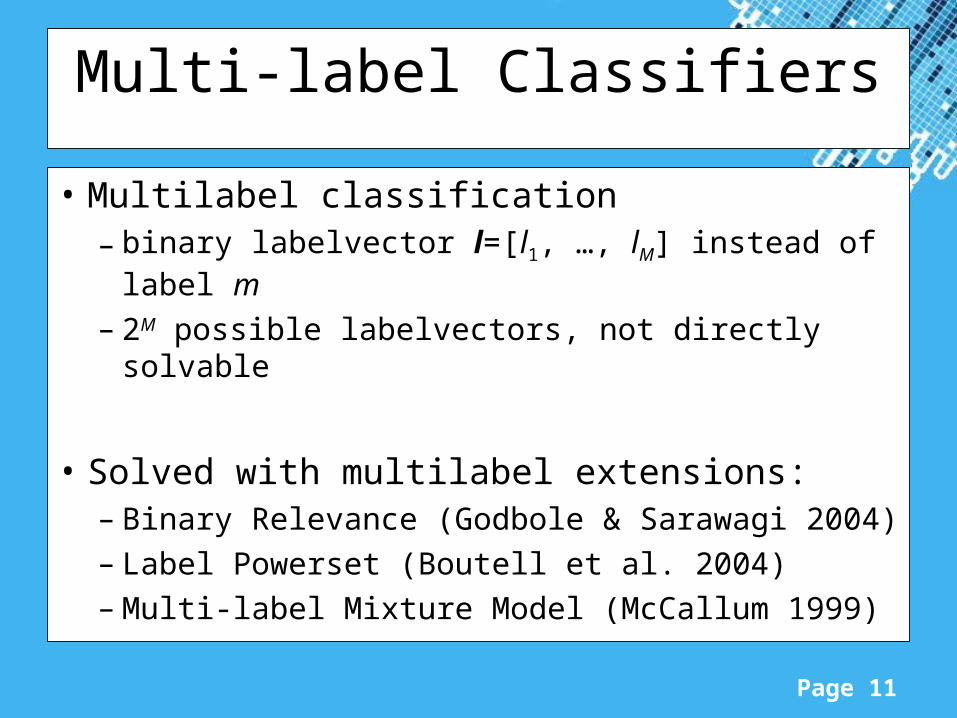
• Multilabel classification– binary labelvector l=[l1, …, lM] instead of label
m– 2M possible labelvectors, not directly solvable
• Solved with multilabel extensions:– Binary Relevance (Godbole & Sarawagi 2004)– Label Powerset (Boutell et al. 2004)– Multi-label Mixture Model (McCallum 1999)
Powerpoint TemplatesPage 12
Multi-label Classifiers
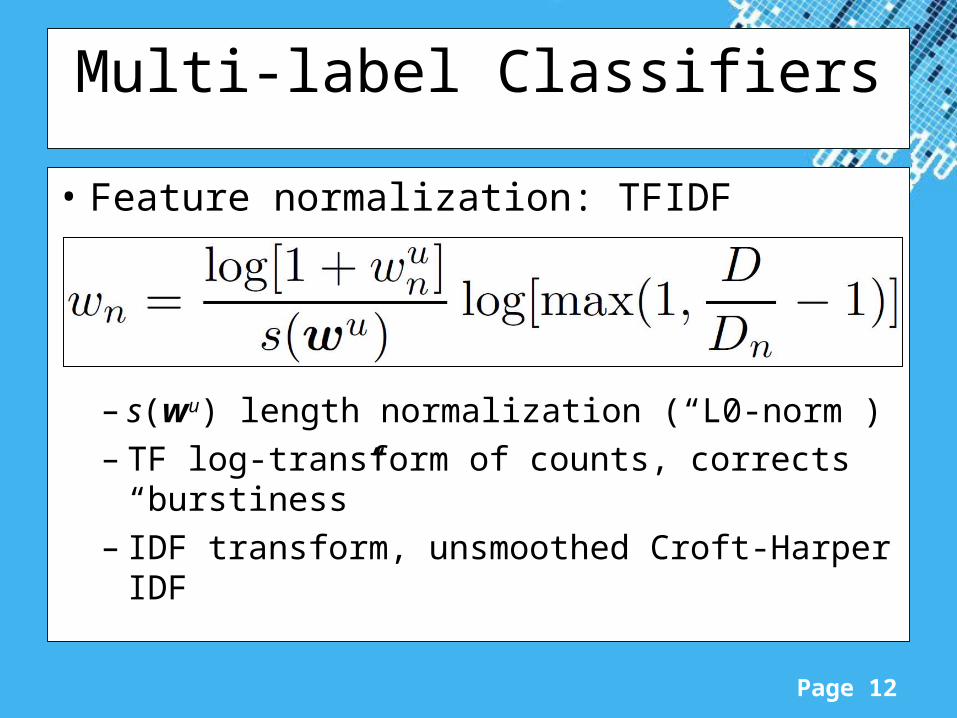
• Feature normalization: TFIDF
– s(wu) length normalization (“L0-norm”)– TF log-transform of counts, corrects
“burstiness”– IDF transform, unsmoothed Croft-Harper
IDF
Powerpoint TemplatesPage 13
Multi-label Classifiers
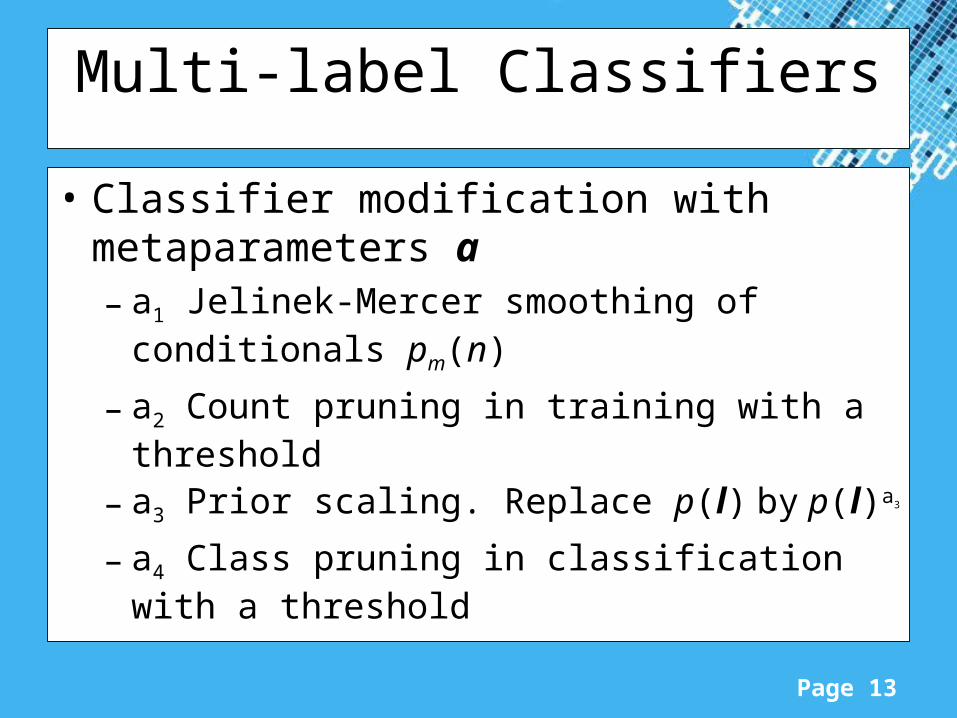
• Classifier modification with metaparameters a– a1 Jelinek-Mercer smoothing of
conditionals pm(n)
– a2 Count pruning in training with a threshold
– a3 Prior scaling. Replace p(l) by p(l)a3
– a4 Class pruning in classification with a threshold
Powerpoint TemplatesPage 14
Multi-label Classifiers
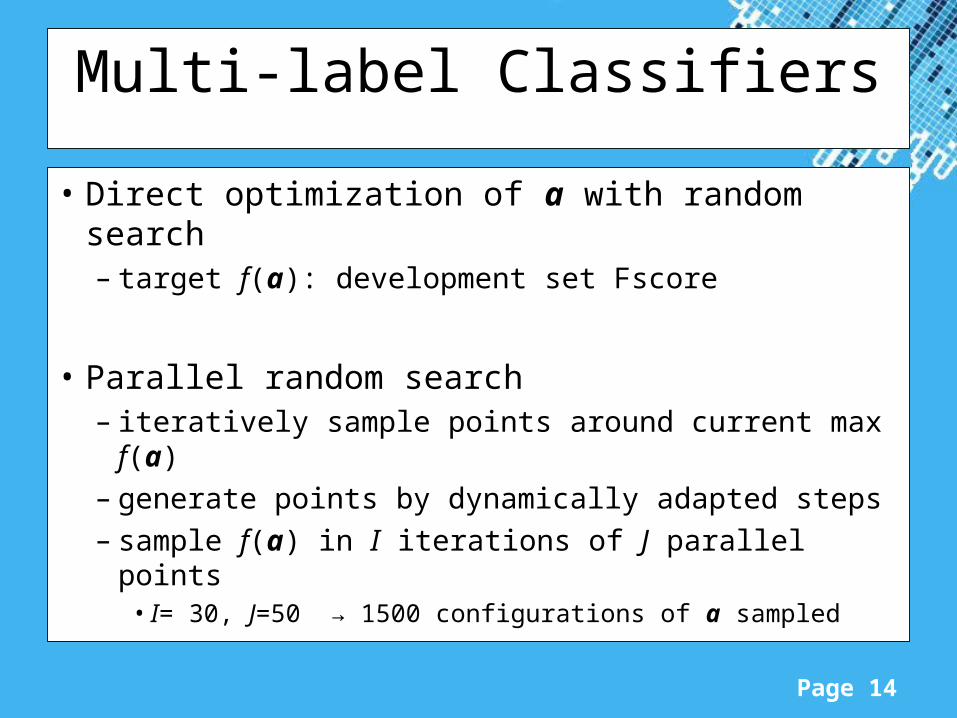
• Direct optimization of a with random search– target f(a): development set Fscore
• Parallel random search– iteratively sample points around current max
f(a)– generate points by dynamically adapted steps– sample f(a) in I iterations of J parallel points
• I= 30, J=50 → 1500 configurations of a sampled
Powerpoint TemplatesPage 15
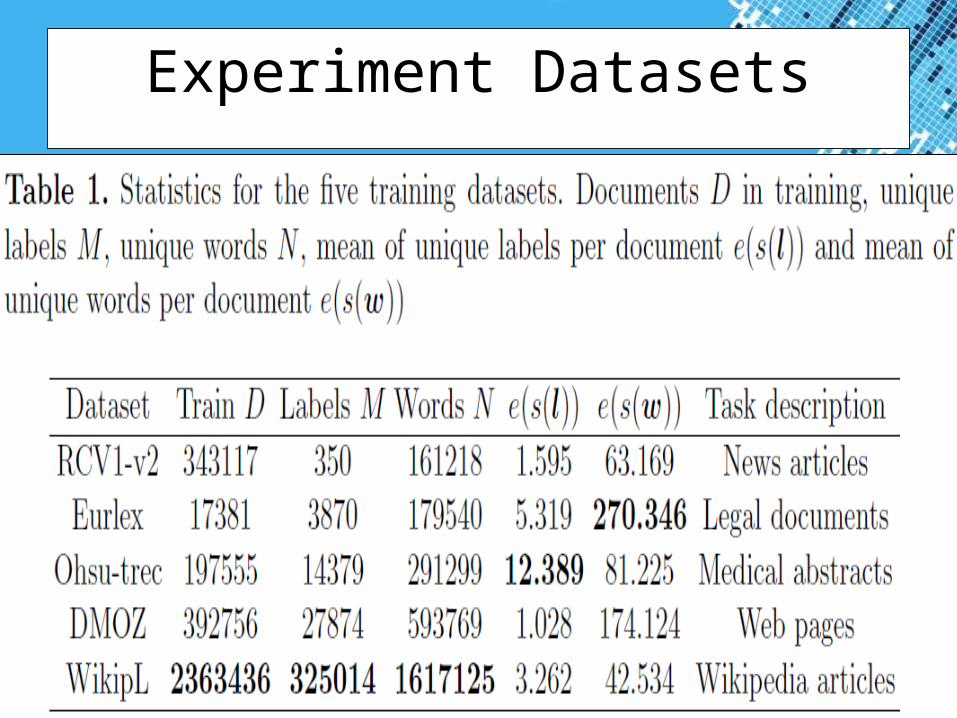
Experiment Datasets
Powerpoint TemplatesPage 16
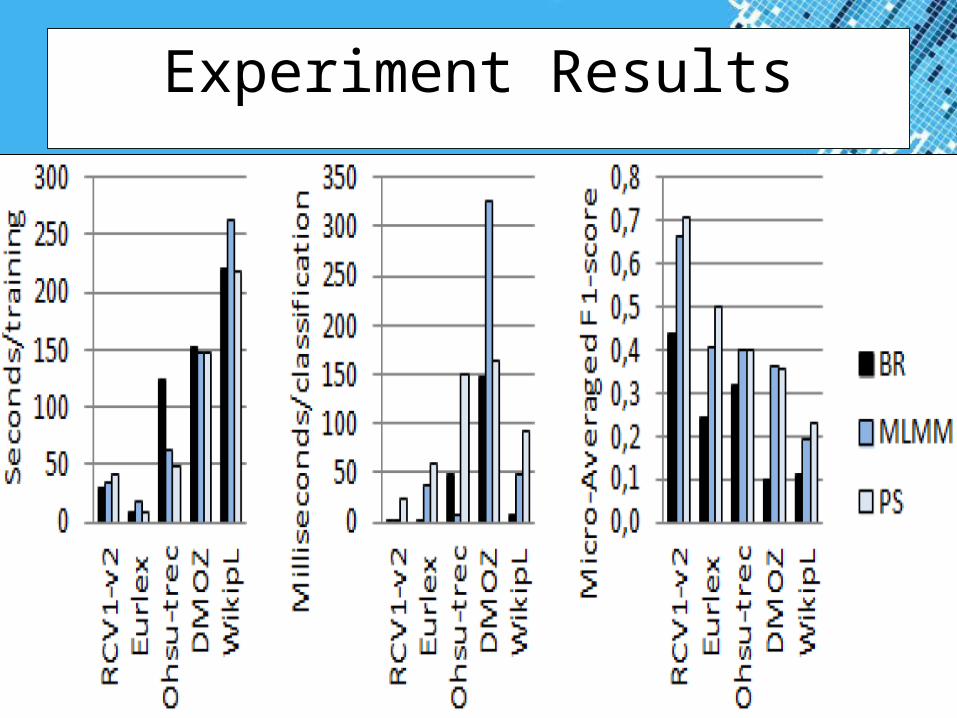
Experiment Results
Powerpoint TemplatesPage 17
Conclusion
• New idea: sparse inference– reduces time complexity of probabilistic
inference– demonstrated for multi-label classification– applicable with different models (KNN, SVM,
…) and uses (clustering, ranking, …)
• Code available, with Weka wrapper:– Weka package manager:
SparseGenerativeModel– http://sourceforge.net/projects/sgmweka/
Powerpoint TemplatesPage 18
Multi-label classification
• Binary Relevance (Godbole & Sarawagi 2004)– each label decision independent binary problem– positive multinomial vs. negative multinomial
• negatives approximated with background multinomial
– threshold parameter for improved accuracy
+ fast, simple, easy to implement- ignores label correlations, poor performance
Powerpoint TemplatesPage 19
Multi-label classification
• Label Powerset (Boutell et al. 2004)– each labelset seen in training is mapped to a
class– hashtable for converting classes to labelsets
+ models label correlations, good performance
- takes memory, cannot classify new labelsets

Powerpoint TemplatesPage 20
Multi-label classification
• Multi-label Mixture Model– mixture for prior:– classification with greedy search (McCallum
1999)• complexity: q times MNB complexity, where q is
maximum labelset size s(l) seen in training
+ models labelsets, generalizes to new labelsets
- assumes uniform linear decomposition
Powerpoint TemplatesPage 21
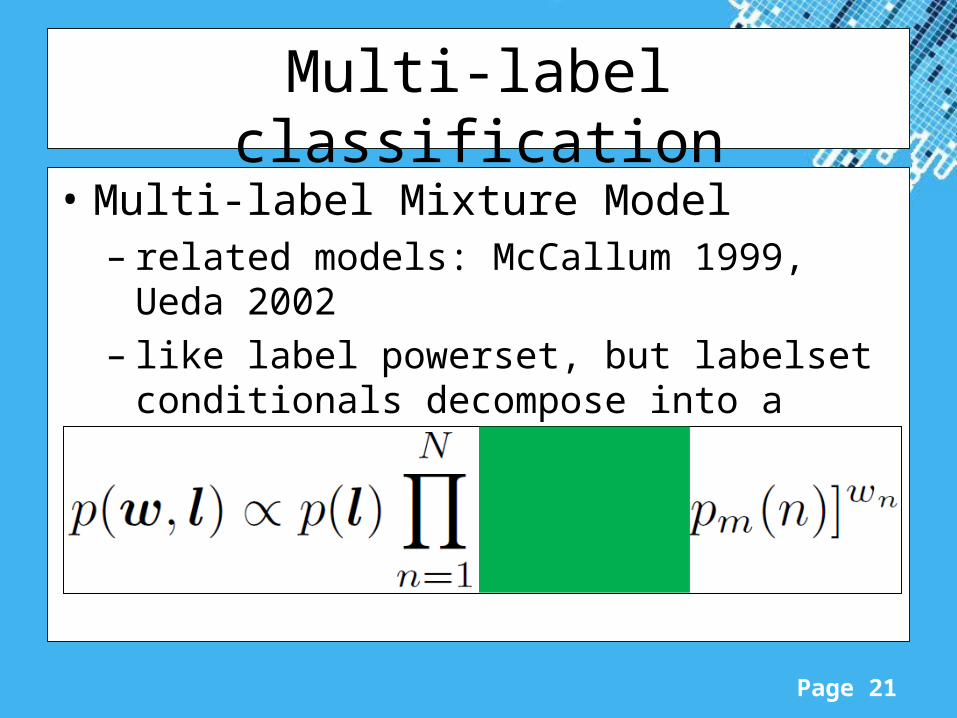
Multi-label classification
• Multi-label Mixture Model– related models: McCallum 1999, Ueda
2002– like label powerset, but labelset
conditionals decompose into a mixture of label conditionals:• pl(n) = 1/s(l) ∑mlmpm(n)
Powerpoint TemplatesPage 22
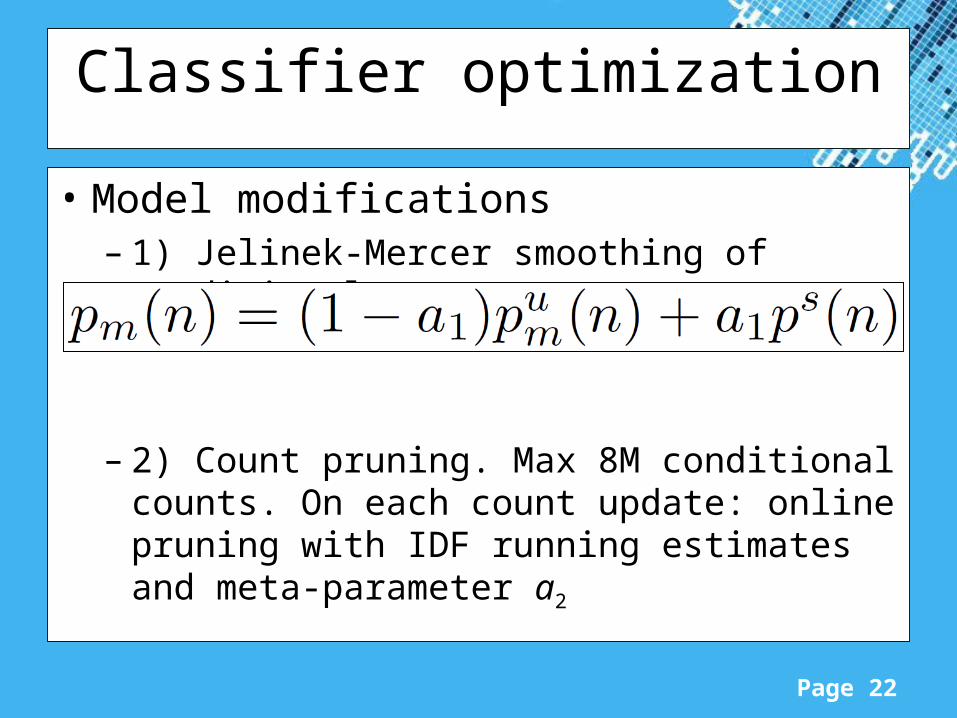
Classifier optimization
• Model modifications– 1) Jelinek-Mercer smoothing of
conditionals:
– 2) Count pruning. Max 8M conditional counts. On each count update: online pruning with IDF running estimates and meta-parameter a2

Powerpoint TemplatesPage 23
Classifier optimization
• Model modifications– 3) Prior scaling. Replace p(l) by p(l)a3
• equivalent to LM scaling in speech recognition
– 4) Pruning in classification. Sort classes by rank and stop classification on a threshold a4
• sort by:• prune:
Powerpoint TemplatesPage 24
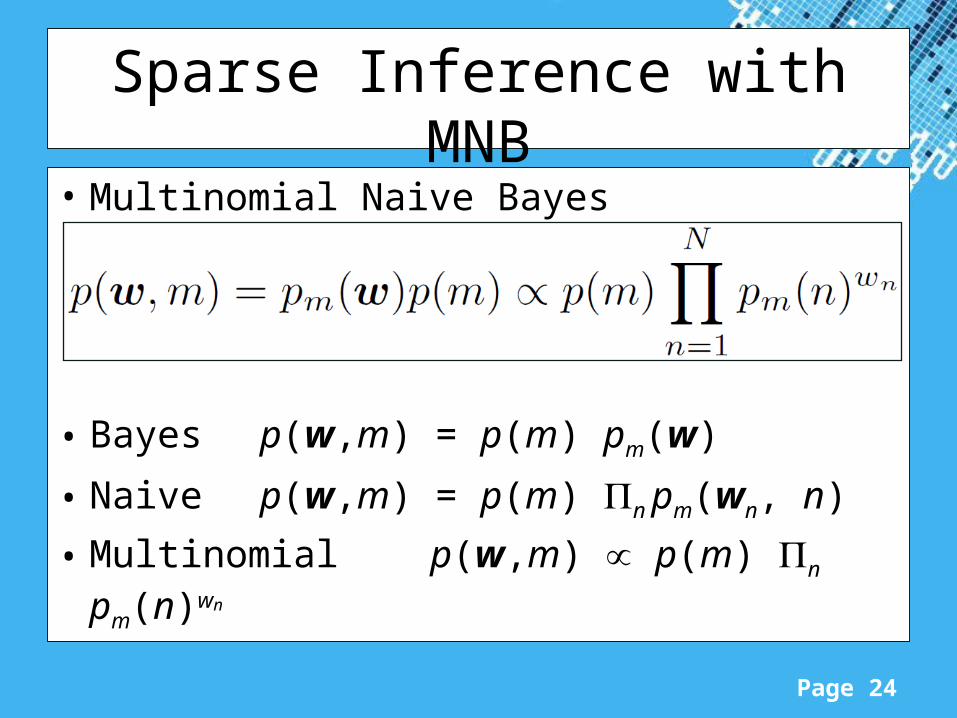
• Multinomial Naive Bayes
• Bayes p(w,m) = p(m) pm(w)
• Naive p(w,m) = p(m) n pm(wn, n)
• Multinomial p(w,m) p(m) n pm(n)wn
Sparse Inference with MNB