pozavarovalnica sava, d. d. financial report 1-6 2012 august 2012
TRANSCRIPT


Pozavarovalnica Sava, d. d.
Financial Report1-6 2012
August 2012

1-6 2012 Consolidated Results
3
Sava Re Group 1-6 2011 1-6 2012 Plan 2012% Change
1-6 12/1-6 11Plan/actual
Net profit (EUR) 3.990.775 10.304.211 10.588.677 158,2% 97,3%
Net combined ratio S&P 97,4% 96,1% 97,8% -1,3 o.t. -1,7 o.t.
ROE 2,6% 6,6% 6,6% +4,0 o.t. 31.12.2011 30.6.2012 31.12.2012
Equity (EUR) 148.080.050 164.066.369 166.426.254 10,8% 98,6%

1-6 2012 Results: Sava Reinsurance Company
4
Sava Reinsurance Company 1-6 2011 1-6 2012 Plan 2012% Change
1-6 12/1-6 11Plan/actual
Net profit (EUR) 4.220.402 4.582.351 9.597.535 8,6% 47,7%
Net combined ratio S&P 90,4% 94,1% 97,3% +3,7 o.t. -3,2 o.t.ROE 2,7% 2,8% 5,7% +0,1 o.t. -2,9 o.t. 31.12.2011 30.6.2012 31.12.2012 Equity (EUR) 158.454.528 166.794.919 172.376.906 5,3% 96,8%

Pozavarovalnica Sava, d. d.
Financial ReportSava Re Group
1-6 2012

The Sava Re Group
6
After the reporting date, Sava Reinsurance Company purchased minority interests and is at the time of preparing this presentation sole owner of Tila.

Structure of Results
7
*The operating result and the investment result do not include data relating to policyholders who bear the investment risk.
cumulative cumulative
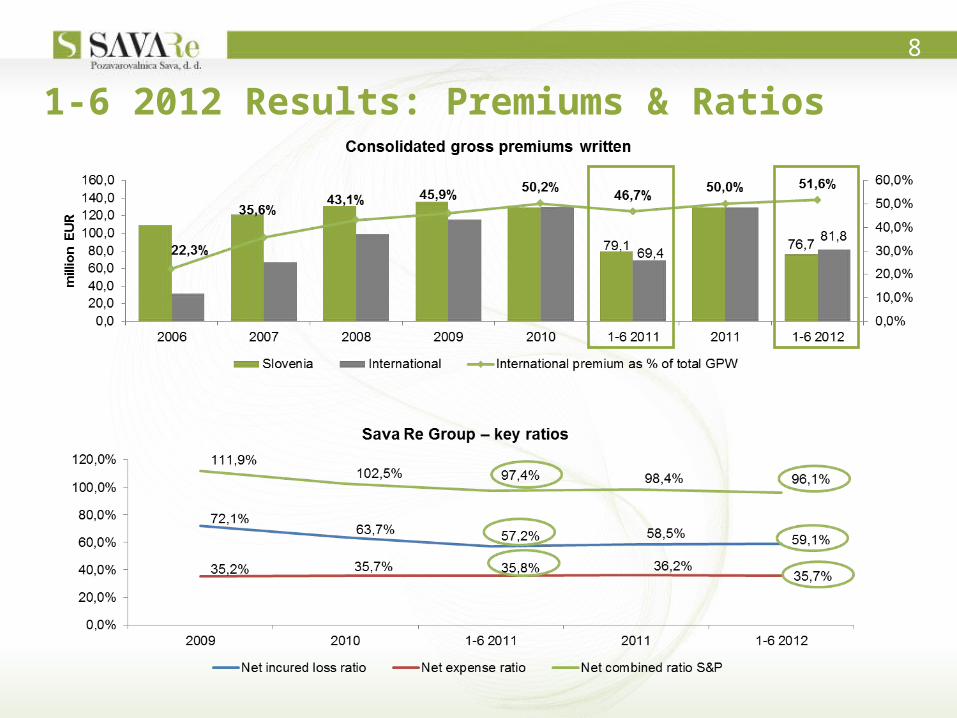
1-6 2012 Results: Premiums & Ratios
8

1-6 2012 Results: Reinsurance Business9
**Figures are unconsolidated and net of tax.*The Other item includes other income, expenses for bonuses and rebates and other expenses.
cumulative

1-6 2012 Results: Non-life Insurance Business10
** Figures are unconsolidated and net of tax.*The other item includes: other income, expenses for bonuses and rebates and other expenses.
cumulative

1-6 2012 Results: Life Insurance Business11
** Figures are unconsolidated and net of tax.* The other item includes: other income, expenses for bonuses and rebates and other expenses.
cumulative

1-6 2012 Results: Consolidated Expenses
12
EUR 1-6 2011 1-6 2012% Change
1-6 12/1-6 11
NET OPERATING EXPENSES 41.914.581 42.410.389 1,2%
Acquisition costs including change in DAC 25.067.547 28.514.147 13,7%
Other operating expenses 18.355.892 15.387.720 -16,2%
Income from reinsurance commission -1.508.858 -1.491.478 -1,2%
The increase is a combined effect of portfolio growth and a favourable loss burden for the reinsurance portfolio as well
as of increased commissions.

1-6 2012 Results: Net Profit by Group Company
13
EUR 1-6/2011 1-6/2012
Sava Re 4.220.399 4.582.348
Zavarovalnica Tilia 768.394 3.125.041
Sava osiguranje -587.362 151.995
Illyria -68.581 -31.539
Sava osiguruvanje -977.699 -669.789
Sava Montenegro -74.449 378.702
Illyria Life 76.196 = 75.552Sava Life -524.322 -135.122
Velebit osiguranje -906.542 -379.053
Velebit Life -315.999 -352.324
Ostale družbe -73.008 350.706
Zavarovalnica Maribor 2.339.200 3.102.592
Moja naložba 114.548 105.102
Total 3.990.775 10.304.211

1-6 2012: Sava Re Group Investments
14
* The other item includes loans, land and buildings and other.
409,3 million EUR
380,3 million EUR
+8%
- 2%
+11%
- 49%
+13%
- 6%
-14%
+23%
- Increased share of deposits as a result of a larger share of call deposits. - Increase in corporate bonds due to decision to purchase covered bonds and other highly-rated corporate bonds, and
foreign government guaranteed bonds. - Reduced share of government bonds partly because of maturity of Slovenian government bond. - Reduced share of shares due to impairment losses. - Reduced share of mutual funds as a result of decision to sell them.

Investments by issuer credit rating
15
Investments by region
Investments by IFRS categories
1-6 2012 Results: Investments of the Sava Re Group
*Investments do not include strategic investments, deposits with cedants nor investments for the benefit of policyholders who bear the investment risk.

Investments by issuer
16
Issuer: financial institutions
1-6 2012 Results: Investments of the Sava Re Group
Issuer: government
*Investments do not include strategic investments, deposits with cedants nor investments for the benefit of policyholders who bear the investment risk.
The "Other" item includes: business, investment property and strategic investments.Financial institutions include: banks incl. savings banks, insurance companies, mutual funds and other financial institutions.
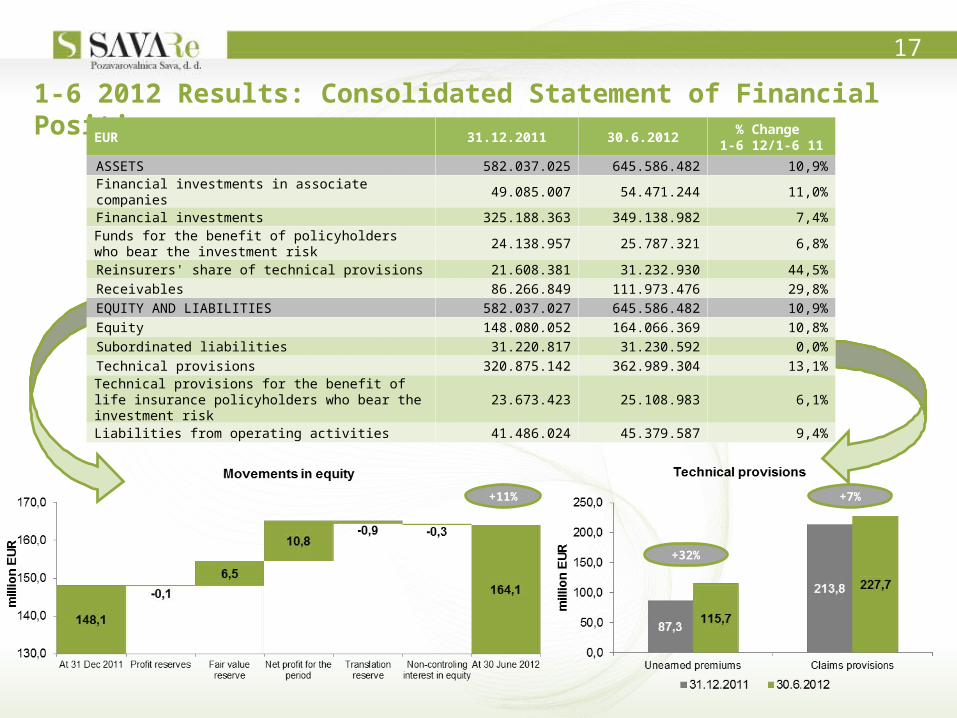
1-6 2012 Results: Consolidated Statement of Financial Position
17
+32%
+7%+11%
EUR 31.12.2011 30.6.2012% Change
1-6 12/1-6 11
ASSETS 582.037.025 645.586.482 10,9%
Financial investments in associate companies 49.085.007 54.471.244 11,0%
Financial investments 325.188.363 349.138.982 7,4%Funds for the benefit of policyholders who bear the investment risk
24.138.957 25.787.321 6,8%
Reinsurers' share of technical provisions 21.608.381 31.232.930 44,5%
Receivables 86.266.849 111.973.476 29,8%
EQUITY AND LIABILITIES 582.037.027 645.586.482 10,9%
Equity 148.080.052 164.066.369 10,8%
Subordinated liabilities 31.220.817 31.230.592 0,0%
Technical provisions 320.875.142 362.989.304 13,1%Technical provisions for the benefit of life insurance policyholders who bear the investment risk
23.673.423 25.108.983 6,1%
Liabilities from operating activities 41.486.024 45.379.587 9,4%