ppt prs econ ch21 9e
DESCRIPTION
EconomicsTRANSCRIPT

CH
AP
TE
R 2
1 M
ea
su
rin
g N
atio
na
l O
utp
ut
an
d N
atio
na
l In
co
me
© 2009 Pearson Education, Inc. Publishing as Prentice Hall Principles of Economics 9e by Case, Fair and Oster 1 of 53
PowerPoint Lectures for
Principles of Economics,
9e
By
Karl E. Case,
Ray C. Fair &
Sharon M. Oster
; ;

CH
AP
TE
R 2
1 M
ea
su
rin
g N
atio
na
l O
utp
ut
an
d N
atio
na
l In
co
me
© 2009 Pearson Education, Inc. Publishing as Prentice Hall Principles of Economics 9e by Case, Fair and Oster 2 of 53

© 2009 Pearson Education, Inc. Publishing as Prentice Hall Principles of Economics 9e by Case, Fair and Oster
21
PART IV CONCEPTS AND PROBLEMS IN MACROECONOMICS
Measuring National
Output and National
Income
Fernando & Yvonn Quijano
Prepared by:

CH
AP
TE
R 2
1 M
ea
su
rin
g N
atio
na
l O
utp
ut
an
d N
atio
na
l In
co
me
© 2009 Pearson Education, Inc. Publishing as Prentice Hall Principles of Economics 9e by Case, Fair and Oster 4 of 53
21
Gross Domestic Product
Final Goods and Services
Exclusion of Used Goods and Paper Transactions
Exclusion of Output Produced Abroad by Domestically Owned Factors of Production
Calculating GDP
The Expenditure Approach The Income Approach
Nominal versus Real GDP Calculating Real GDP Calculating the GDP Deflator The Problems of Fixed Weights
Limitations of the GDP Concept GDP and Social Welfare
The Underground Economy
Gross National Income per Capita
Looking Ahead
CHAPTER OUTLINE
Measuring National
Output and National
Income
PART IV CONCEPTS AND PROBLEMS IN MACROECONOMICS
CH
AP
TE
R 2
1 M
ea
su
rin
g N
atio
na
l O
utp
ut
an
d N
atio
na
l In
co
me
© 2009 Pearson Education, Inc. Publishing as Prentice Hall Principles of Economics 9e by Case, Fair and Oster 5 of 53
Measuring National Output and National Income
national income and product accounts Data
collected and published by the government
describing the various components of national
income and output in the economy.

CH
AP
TE
R 2
1 M
ea
su
rin
g N
atio
na
l O
utp
ut
an
d N
atio
na
l In
co
me
© 2009 Pearson Education, Inc. Publishing as Prentice Hall Principles of Economics 9e by Case, Fair and Oster 6 of 53
Gross Domestic Product
gross domestic product (GDP) The total market
value of all final goods and services produced
within a given period by factors of production
located within a country.
GDP is the total market value of a country’s output.
It is the market value of all final goods and
services produced within a given period of time by
factors of production located within a country.

CH
AP
TE
R 2
1 M
ea
su
rin
g N
atio
na
l O
utp
ut
an
d N
atio
na
l In
co
me
© 2009 Pearson Education, Inc. Publishing as Prentice Hall Principles of Economics 9e by Case, Fair and Oster 7 of 53
Gross Domestic Product
final goods and services Goods and services
produced for final use.
Final Goods and Services
intermediate goods Goods that are produced by
one firm for use in further processing by another
firm.
value added The difference between the value of
goods as they leave a stage of production and the
cost of the goods as they entered that stage.

CH
AP
TE
R 2
1 M
ea
su
rin
g N
atio
na
l O
utp
ut
an
d N
atio
na
l In
co
me
© 2009 Pearson Education, Inc. Publishing as Prentice Hall Principles of Economics 9e by Case, Fair and Oster 8 of 53
To arrive at GDP, the Bureau of Economic Analysis (BEA) counts:
a. The value of total sales, including sales to suppliers and
sales to consumers.
b. The value of final sales.
c. The value of intermediate goods and final goods.
d. Value added plus the value of sales at the retail level.
e. Any of the above.

CH
AP
TE
R 2
1 M
ea
su
rin
g N
atio
na
l O
utp
ut
an
d N
atio
na
l In
co
me
© 2009 Pearson Education, Inc. Publishing as Prentice Hall Principles of Economics 9e by Case, Fair and Oster 9 of 53
To arrive at GDP, the Bureau of Economic Analysis (BEA) counts:
a. The value of total sales, including sales to suppliers and
sales to consumers.
b. The value of final sales.
c. The value of intermediate goods and final goods.
d. Value added plus the value of sales at the retail level.
e. Any of the above.

CH
AP
TE
R 2
1 M
ea
su
rin
g N
atio
na
l O
utp
ut
an
d N
atio
na
l In
co
me
© 2009 Pearson Education, Inc. Publishing as Prentice Hall Principles of Economics 9e by Case, Fair and Oster 10 of 53
Gross Domestic Product
Final Goods and Services
In calculating GDP, we can sum up the value
added at each stage of production or we can take
the value of final sales. We do not use the value
of total sales in an economy to measure how much
output has been produced.
TABLE 21.1 Value Added in the Production of a Gallon of
Gasoline (Hypothetical Numbers)
Stage Of Production Value Of Sales Value Added
(1) Oil drilling $3.00 $3.00
(2) Refining 3.30 0.30
(3) Shipping 3.60 0.30
(4) Retail sale 4.00 0.40
Total value added $4.00

CH
AP
TE
R 2
1 M
ea
su
rin
g N
atio
na
l O
utp
ut
an
d N
atio
na
l In
co
me
© 2009 Pearson Education, Inc. Publishing as Prentice Hall Principles of Economics 9e by Case, Fair and Oster 11 of 53
Gross Domestic Product
Exclusion of Used Goods and Paper Transactions
GDP is concerned only with new, or current,
production. Old output is not counted in current
GDP because it was already counted when it was
produced.
GDP does not count transactions in which money
or goods changes hands but in which no new
goods and services are produced.

CH
AP
TE
R 2
1 M
ea
su
rin
g N
atio
na
l O
utp
ut
an
d N
atio
na
l In
co
me
© 2009 Pearson Education, Inc. Publishing as Prentice Hall Principles of Economics 9e by Case, Fair and Oster 12 of 53
Gross Domestic Product
Exclusion of Output Produced Abroad by Domestically Owned Factors
of Production
GDP is the value of output produced by factors of
production located within a country.
gross national product (GNP) The total market
value of all final goods and services produced
within a given period by factors of production
owned by a country’s citizens, regardless of where
the output is produced.
CH
AP
TE
R 2
1 M
ea
su
rin
g N
atio
na
l O
utp
ut
an
d N
atio
na
l In
co
me
© 2009 Pearson Education, Inc. Publishing as Prentice Hall Principles of Economics 9e by Case, Fair and Oster 13 of 53
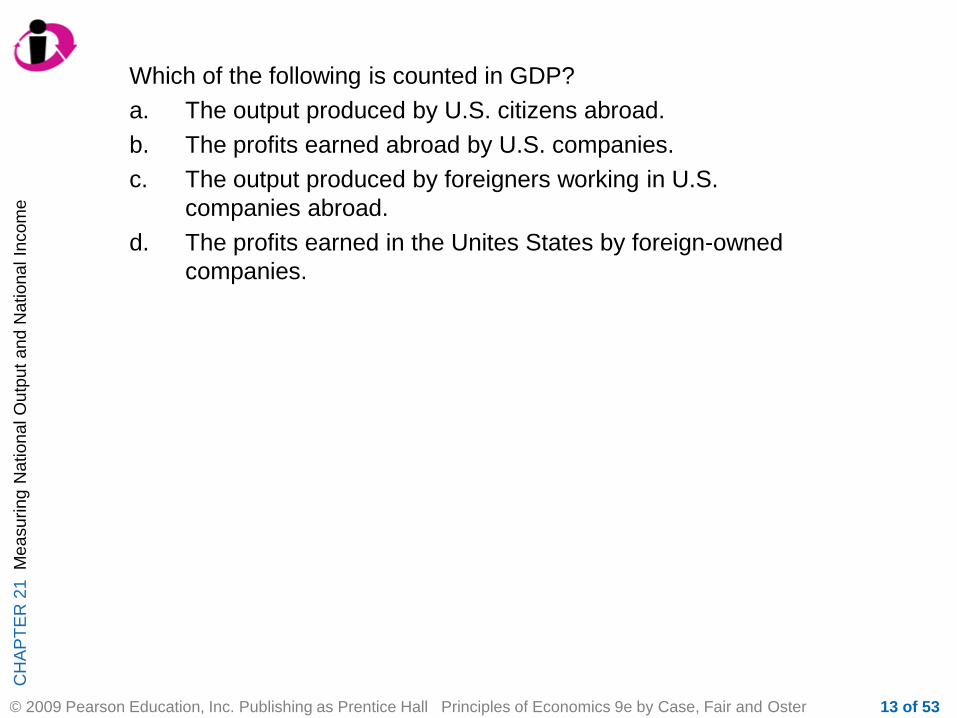
Which of the following is counted in GDP?
a. The output produced by U.S. citizens abroad.
b. The profits earned abroad by U.S. companies.
c. The output produced by foreigners working in U.S.
companies abroad.
d. The profits earned in the Unites States by foreign-owned
companies.
CH
AP
TE
R 2
1 M
ea
su
rin
g N
atio
na
l O
utp
ut
an
d N
atio
na
l In
co
me
© 2009 Pearson Education, Inc. Publishing as Prentice Hall Principles of Economics 9e by Case, Fair and Oster 14 of 53
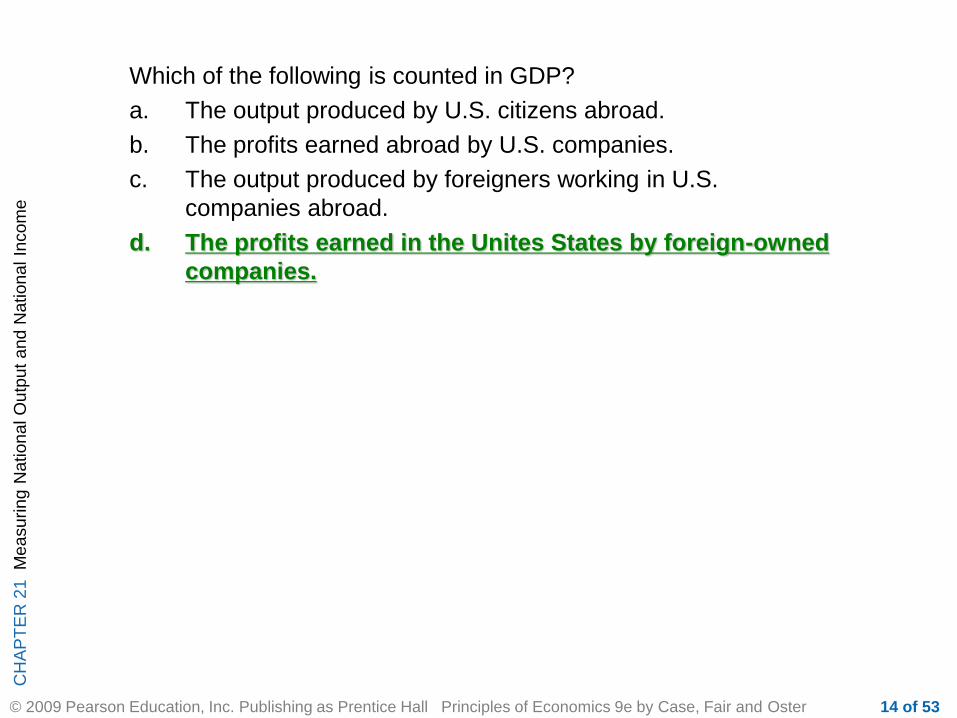
Which of the following is counted in GDP?
a. The output produced by U.S. citizens abroad.
b. The profits earned abroad by U.S. companies.
c. The output produced by foreigners working in U.S.
companies abroad.
d. The profits earned in the Unites States by foreign-owned
companies.

CH
AP
TE
R 2
1 M
ea
su
rin
g N
atio
na
l O
utp
ut
an
d N
atio
na
l In
co
me
© 2009 Pearson Education, Inc. Publishing as Prentice Hall Principles of Economics 9e by Case, Fair and Oster 15 of 53
Calculating GDP
expenditure approach A method of computing
GDP that measures the total amount spent on all
final goods and services during a given period.
income approach A method of computing GDP
that measures the income—wages, rents, interest,
and profits—received by all factors of production in
producing final goods and services.
CH
AP
TE
R 2
1 M
ea
su
rin
g N
atio
na
l O
utp
ut
an
d N
atio
na
l In
co
me
© 2009 Pearson Education, Inc. Publishing as Prentice Hall Principles of Economics 9e by Case, Fair and Oster 16 of 53
Calculating GDP
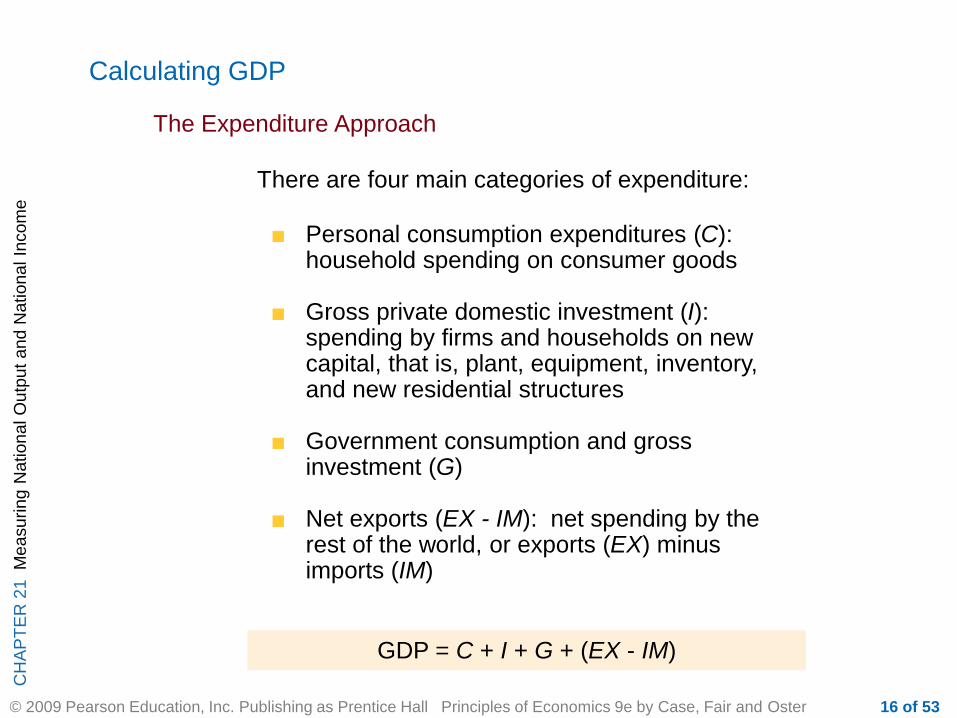
The Expenditure Approach
There are four main categories of expenditure:
Personal consumption expenditures (C): household spending on consumer goods
Gross private domestic investment (I): spending by firms and households on new capital, that is, plant, equipment, inventory, and new residential structures
Government consumption and gross investment (G)
Net exports (EX - IM): net spending by the rest of the world, or exports (EX) minus imports (IM)
GDP = C + I + G + (EX - IM)
CH
AP
TE
R 2
1 M
ea
su
rin
g N
atio
na
l O
utp
ut
an
d N
atio
na
l In
co
me
© 2009 Pearson Education, Inc. Publishing as Prentice Hall Principles of Economics 9e by Case, Fair and Oster 17 of 53
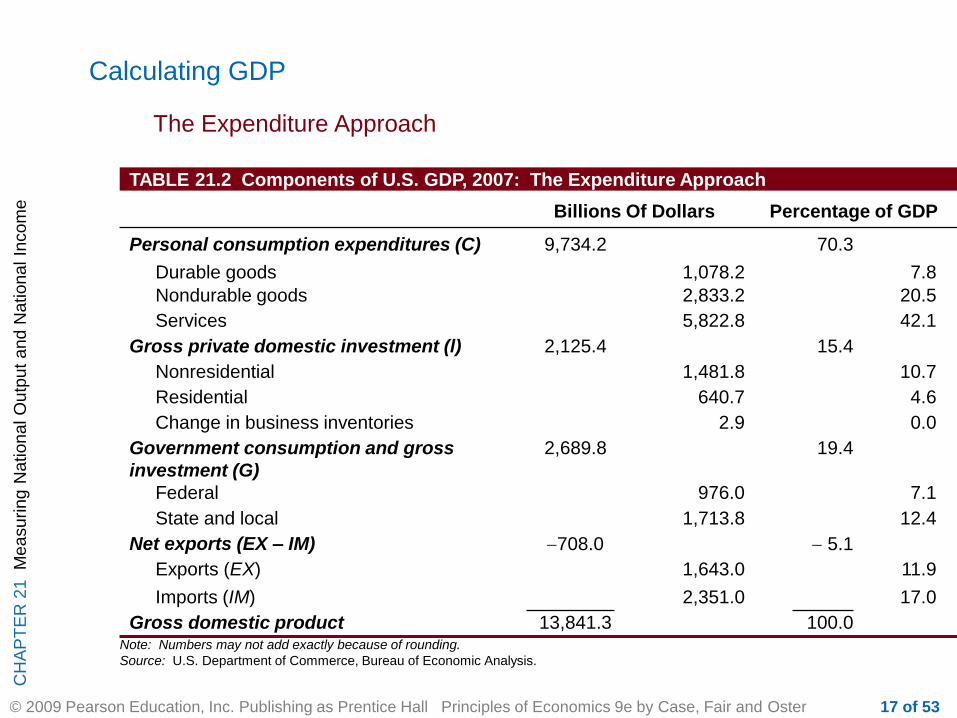
Calculating GDP
The Expenditure Approach
TABLE 21.2 Components of U.S. GDP, 2007: The Expenditure Approach
Billions Of Dollars Percentage of GDP
Personal consumption expenditures (C) 9,734.2 70.3
Durable goods 1,078.2 7.8
Nondurable goods 2,833.2 20.5
Services 5,822.8 42.1
Gross private domestic investment (l) 2,125.4 15.4
Nonresidential 1,481.8 10.7
Residential 640.7 4.6
Change in business inventories 2.9 0.0
Government consumption and gross
investment (G)
2,689.8 19.4
Federal 976.0 7.1
State and local 1,713.8 12.4
Net exports (EX – IM) -708.0 - 5.1
Exports (EX) 1,643.0 11.9
Imports (IM) 2,351.0 17.0
Gross domestic product 13,841.3 100.0 Note: Numbers may not add exactly because of rounding.
Source: U.S. Department of Commerce, Bureau of Economic Analysis.

CH
AP
TE
R 2
1 M
ea
su
rin
g N
atio
na
l O
utp
ut
an
d N
atio
na
l In
co
me
© 2009 Pearson Education, Inc. Publishing as Prentice Hall Principles of Economics 9e by Case, Fair and Oster 18 of 53
For the year 2004, the percentages of C, I, G, and (EX – IM) in
U.S. aggregate expenditure were roughly as follows:
a. 70%, 16%, 19%, and –5%.
b. 40%, 18%, 25%, and 17%.
c. 24%, 35%, 45%, and –4%
d. 35%, 27%, 41%, and –3%.

CH
AP
TE
R 2
1 M
ea
su
rin
g N
atio
na
l O
utp
ut
an
d N
atio
na
l In
co
me
© 2009 Pearson Education, Inc. Publishing as Prentice Hall Principles of Economics 9e by Case, Fair and Oster 19 of 53
For the year 2004, the percentages of C, I, G, and (EX – IM) in
U.S. aggregate expenditure were roughly as follows:
a. 70%, 16%, 19%, and –5%.
b. 40%, 18%, 25%, and 17%.
c. 24%, 35%, 45%, and –4%
d. 35%, 27%, 41%, and –3%.

CH
AP
TE
R 2
1 M
ea
su
rin
g N
atio
na
l O
utp
ut
an
d N
atio
na
l In
co
me
© 2009 Pearson Education, Inc. Publishing as Prentice Hall Principles of Economics 9e by Case, Fair and Oster 20 of 53
Calculating GDP
The Expenditure Approach
Personal Consumption Expenditures (C)
personal consumption expenditures (C)
Expenditures by consumers on goods and
services.
durable goods Goods that last a relatively long
time, such as cars and household appliances.
nondurable goods Goods that are used up fairly
quickly, such as food and clothing.
services The things we buy that do not involve
the production of physical things, such as legal
and medical services and education.

CH
AP
TE
R 2
1 M
ea
su
rin
g N
atio
na
l O
utp
ut
an
d N
atio
na
l In
co
me
© 2009 Pearson Education, Inc. Publishing as Prentice Hall Principles of Economics 9e by Case, Fair and Oster 21 of 53
The largest component of Personal Consumption Expenditures (C)
is:
a. Durable goods.
b. Nondurable goods.
c. Services.
d. Residential Investment.
e. Imports.
CH
AP
TE
R 2
1 M
ea
su
rin
g N
atio
na
l O
utp
ut
an
d N
atio
na
l In
co
me
© 2009 Pearson Education, Inc. Publishing as Prentice Hall Principles of Economics 9e by Case, Fair and Oster 22 of 53
The largest component of Personal Consumption Expenditures (C)
is:
a. Durable goods.
b. Nondurable goods.
c. Services.
d. Residential Investment.
e. Imports.

CH
AP
TE
R 2
1 M
ea
su
rin
g N
atio
na
l O
utp
ut
an
d N
atio
na
l In
co
me
© 2009 Pearson Education, Inc. Publishing as Prentice Hall Principles of Economics 9e by Case, Fair and Oster 23 of 53
Calculating GDP
The Expenditure Approach
Personal Consumption Expenditures (C)
Where Does eBay
Get Counted?
So do any of eBay’s services
count as part of GDP? eBay’s
business is to provide a
marketplace for exchange. In
doing so, it uses labor and
capital and creates value. In
return for creating this value,
eBay charges fees to the sellers that use its site. The value of these
fees do enter into GDP. So while the old knickknacks that people
sell on eBay do not contribute to current GDP, the cost of finding an
interested buyer for those old goods does indeed get counted.

CH
AP
TE
R 2
1 M
ea
su
rin
g N
atio
na
l O
utp
ut
an
d N
atio
na
l In
co
me
© 2009 Pearson Education, Inc. Publishing as Prentice Hall Principles of Economics 9e by Case, Fair and Oster 24 of 53
Calculating GDP
The Expenditure Approach
Gross Private Domestic Investment (I)
gross private domestic investment (I) Total
investment in capital—that is, the purchase of new
housing, plants, equipment, and inventory by the
private (or nongovernment) sector.
nonresidential investment Expenditures by
firms for machines, tools, plants, and so on.
residential investment Expenditures by
households and firms on new houses and
apartment buildings.
CH
AP
TE
R 2
1 M
ea
su
rin
g N
atio
na
l O
utp
ut
an
d N
atio
na
l In
co
me
© 2009 Pearson Education, Inc. Publishing as Prentice Hall Principles of Economics 9e by Case, Fair and Oster 25 of 53
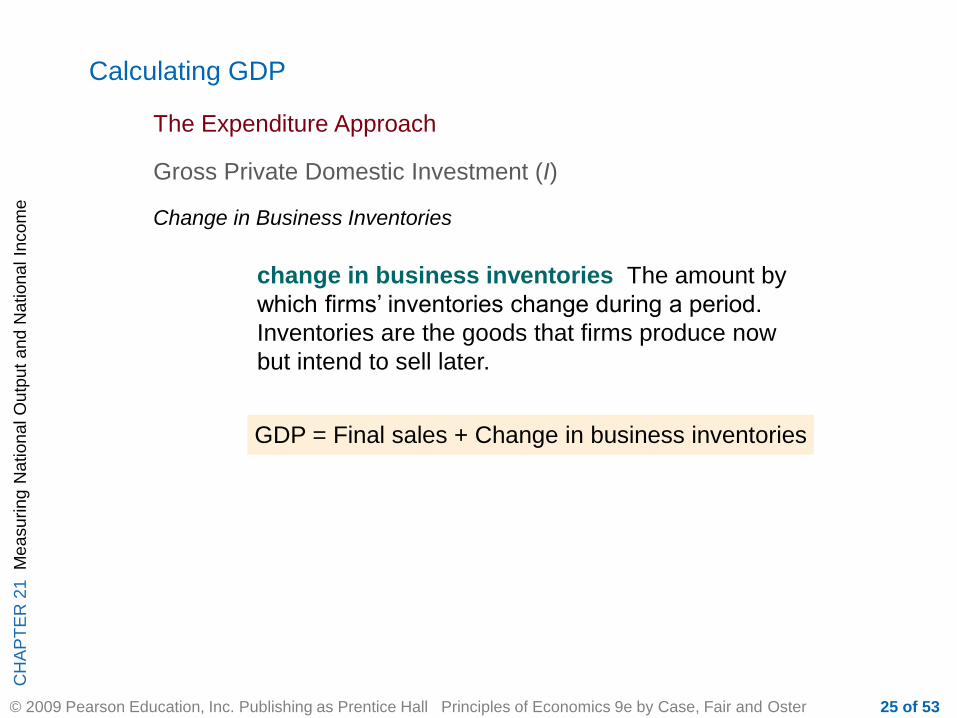
Calculating GDP
The Expenditure Approach
Gross Private Domestic Investment (I)
change in business inventories The amount by
which firms’ inventories change during a period.
Inventories are the goods that firms produce now
but intend to sell later.
GDP = Final sales + Change in business inventories
Change in Business Inventories

CH
AP
TE
R 2
1 M
ea
su
rin
g N
atio
na
l O
utp
ut
an
d N
atio
na
l In
co
me
© 2009 Pearson Education, Inc. Publishing as Prentice Hall Principles of Economics 9e by Case, Fair and Oster 26 of 53
Calculating GDP
The Expenditure Approach
Gross Private Domestic Investment (I)
depreciation The amount by which an asset’s
value falls in a given period.
Gross Investment versus Net Investment
gross investment The total value of all newly
produced capital goods (plant, equipment,
housing, and inventory) produced in a given
period.
net investment Gross investment minus
depreciation.
capitalend of period = capitalbeginning of period + net investment
CH
AP
TE
R 2
1 M
ea
su
rin
g N
atio
na
l O
utp
ut
an
d N
atio
na
l In
co
me
© 2009 Pearson Education, Inc. Publishing as Prentice Hall Principles of Economics 9e by Case, Fair and Oster 27 of 53
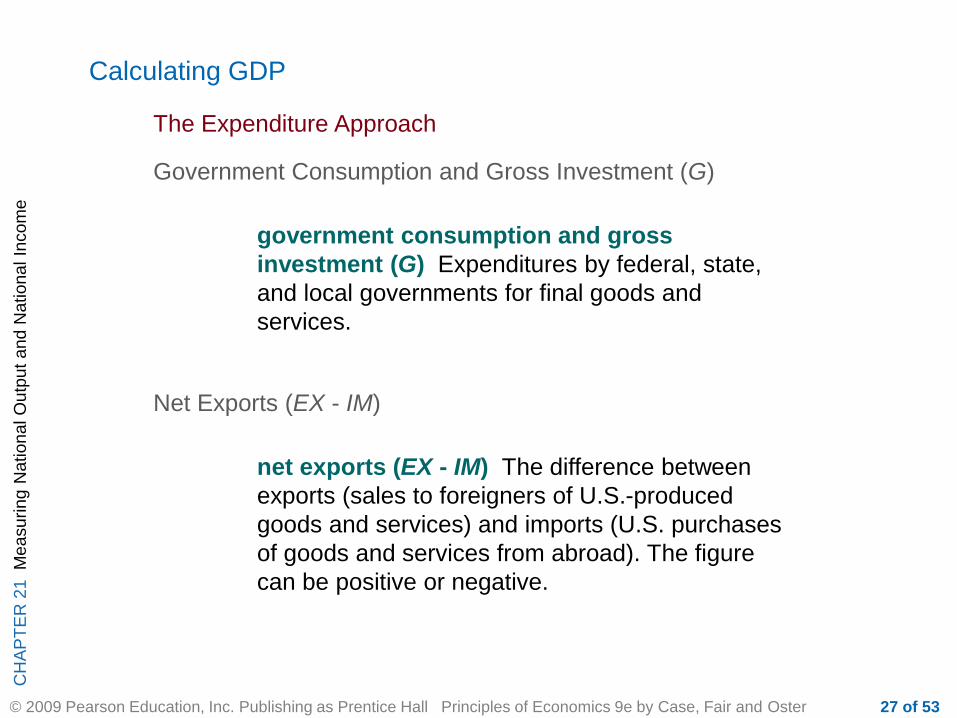
Calculating GDP
The Expenditure Approach
Government Consumption and Gross Investment (G)
government consumption and gross
investment (G) Expenditures by federal, state,
and local governments for final goods and
services.
Net Exports (EX - IM)
net exports (EX - IM) The difference between
exports (sales to foreigners of U.S.-produced
goods and services) and imports (U.S. purchases
of goods and services from abroad). The figure
can be positive or negative.
CH
AP
TE
R 2
1 M
ea
su
rin
g N
atio
na
l O
utp
ut
an
d N
atio
na
l In
co
me
© 2009 Pearson Education, Inc. Publishing as Prentice Hall Principles of Economics 9e by Case, Fair and Oster 28 of 53
Which of the following statements about exports and imports is
correct?
a. Exports must be subtracted out of GDP to obtain the correct
figure.
b. Imports must be subtracted out of GDP to obtain the correct
figure.
c. The difference between exports and imports is negative
when the country is a net exporter.
d. Before 1976, the United States was generally a net importer.
Only after 1976, exports began to exceed imports.

CH
AP
TE
R 2
1 M
ea
su
rin
g N
atio
na
l O
utp
ut
an
d N
atio
na
l In
co
me
© 2009 Pearson Education, Inc. Publishing as Prentice Hall Principles of Economics 9e by Case, Fair and Oster 29 of 53
Which of the following statements about exports and imports is
correct?
a. Exports must be subtracted out of GDP to obtain the correct
figure.
b. Imports must be subtracted out of GDP to obtain the
correct figure.
c. The difference between exports and imports is negative
when the country is a net exporter.
d. Before 1976, the United States was generally a net importer.
Only after 1976, exports began to exceed imports.

CH
AP
TE
R 2
1 M
ea
su
rin
g N
atio
na
l O
utp
ut
an
d N
atio
na
l In
co
me
© 2009 Pearson Education, Inc. Publishing as Prentice Hall Principles of Economics 9e by Case, Fair and Oster 30 of 53
Calculating GDP
The Income Approach
national income The total income earned by the
factors of production owned by a country’s
citizens.
TABLE 21.3 National Income, 2007
Billions of
Dollars
Percentage of
National Income
National Income 12,221.1 100.0
Compensation of employees 7,874.2 64.4
Proprietors’ income 1,042.6 8.5
Rental income 65.4 0.5
Corporate profits 1,598.2 13.1
Net interest 602.6 4.9
Indirect taxes minus subsidies 961.4 7.9
Net business transfer payments 94.2 0.8
Surplus of government enterprises -14.5 -0.1 Source: See Table 6.2.

CH
AP
TE
R 2
1 M
ea
su
rin
g N
atio
na
l O
utp
ut
an
d N
atio
na
l In
co
me
© 2009 Pearson Education, Inc. Publishing as Prentice Hall Principles of Economics 9e by Case, Fair and Oster 31 of 53
Calculating GDP
The Income Approach
compensation of employees Includes wages,
salaries, and various supplements—employer
contributions to social insurance and pension
funds, for example—paid to households by firms
and by the government.
proprietors’ income The income of
unincorporated businesses.
rental income The income received by property
owners in the form of rent.
corporate profits The income of corporations.
net interest The interest paid by business.

CH
AP
TE
R 2
1 M
ea
su
rin
g N
atio
na
l O
utp
ut
an
d N
atio
na
l In
co
me
© 2009 Pearson Education, Inc. Publishing as Prentice Hall Principles of Economics 9e by Case, Fair and Oster 32 of 53
Which of the following statements is/are correct about the
components of GDP using the income approach?
a. Compensation of employees is the largest item in national
income.
b. Proprietor’s income refers to the profits earned by
corporations.
c. Net interest refers to interest paid by households, business
firms, and the government.
d. Rental income is a major component of national income.
CH
AP
TE
R 2
1 M
ea
su
rin
g N
atio
na
l O
utp
ut
an
d N
atio
na
l In
co
me
© 2009 Pearson Education, Inc. Publishing as Prentice Hall Principles of Economics 9e by Case, Fair and Oster 33 of 53
Which of the following statements is/are correct about the
components of GDP using the income approach?
a. Compensation of employees is the largest item in
national income.
b. Proprietor’s income refers to the profits earned by
corporations.
c. Net interest refers to interest paid by households, business
firms, and the government.
d. Rental income is a major component of national income.

CH
AP
TE
R 2
1 M
ea
su
rin
g N
atio
na
l O
utp
ut
an
d N
atio
na
l In
co
me
© 2009 Pearson Education, Inc. Publishing as Prentice Hall Principles of Economics 9e by Case, Fair and Oster 34 of 53
Calculating GDP
The Income Approach
indirect taxes minus subsidies Taxes such as
sales taxes, customs duties, and license fees less
subsidies that the government pays for which it
receives no goods or services in return.
net business transfer payments Net transfer
payments by businesses to others.
surplus of government enterprises Income of
government enterprises.
CH
AP
TE
R 2
1 M
ea
su
rin
g N
atio
na
l O
utp
ut
an
d N
atio
na
l In
co
me
© 2009 Pearson Education, Inc. Publishing as Prentice Hall Principles of Economics 9e by Case, Fair and Oster 35 of 53
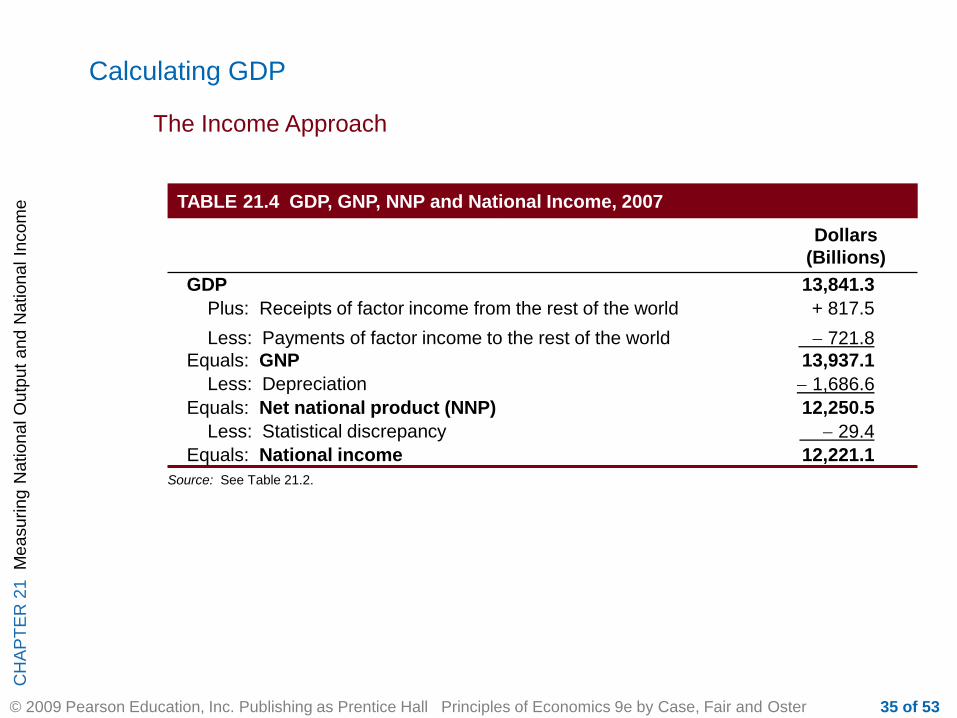
Calculating GDP
The Income Approach
TABLE 21.4 GDP, GNP, NNP and National Income, 2007
Dollars
(Billions)
GDP 13,841.3
Plus: Receipts of factor income from the rest of the world + 817.5
Less: Payments of factor income to the rest of the world - 721.8
Equals: GNP 13,937.1
Less: Depreciation - 1,686.6
Equals: Net national product (NNP) 12,250.5
Less: Statistical discrepancy - 29.4
Equals: National income 12,221.1
Source: See Table 21.2.

CH
AP
TE
R 2
1 M
ea
su
rin
g N
atio
na
l O
utp
ut
an
d N
atio
na
l In
co
me
© 2009 Pearson Education, Inc. Publishing as Prentice Hall Principles of Economics 9e by Case, Fair and Oster 36 of 53
Calculating GDP
The Income Approach
net national product (NNP) Gross national
product minus depreciation; a nation’s total
product minus what is required to maintain the
value of its capital stock.
statistical discrepancy Data measurement error.
personal income The total income of
households.

CH
AP
TE
R 2
1 M
ea
su
rin
g N
atio
na
l O
utp
ut
an
d N
atio
na
l In
co
me
© 2009 Pearson Education, Inc. Publishing as Prentice Hall Principles of Economics 9e by Case, Fair and Oster 37 of 53
Calculating GDP
The Income Approach
TABLE 21.5 National Income, Personal Income, Disposable Personal Income,
and Personal Saving, 2007
Dollars
(Billions)
National income 12,221.1
Less: Amount of national income not going to households - 561.6
Equals: Personal income 11,659.5
Less: Personal income taxes - 1,482.5
Equals: Disposable personal income 10,177.0
Less: Personal consumption expenditures - 9,734.2
Personal interest payments -262.8
Transfer payments made by households -137.1
Equals: Personal saving 42.9
Personal saving as a percentage of disposable personal income: 0.4%
Source: See Table 21.2.
CH
AP
TE
R 2
1 M
ea
su
rin
g N
atio
na
l O
utp
ut
an
d N
atio
na
l In
co
me
© 2009 Pearson Education, Inc. Publishing as Prentice Hall Principles of Economics 9e by Case, Fair and Oster 38 of 53
The difference between gross national product (GNP) and net
national product (NNP) is:
a. Net exports.
b. The surplus of government enterprises.
c. Net interest.
d. Depreciation.
CH
AP
TE
R 2
1 M
ea
su
rin
g N
atio
na
l O
utp
ut
an
d N
atio
na
l In
co
me
© 2009 Pearson Education, Inc. Publishing as Prentice Hall Principles of Economics 9e by Case, Fair and Oster 39 of 53
The difference between gross national product (GNP) and net
national product (NNP) is:
a. Net exports.
b. The surplus of government enterprises.
c. Net interest.
d. Depreciation.

CH
AP
TE
R 2
1 M
ea
su
rin
g N
atio
na
l O
utp
ut
an
d N
atio
na
l In
co
me
© 2009 Pearson Education, Inc. Publishing as Prentice Hall Principles of Economics 9e by Case, Fair and Oster 40 of 53
Calculating GDP
The Income Approach
GDP: One of the Great
Inventions of the 20th
Century
While the GDP and the rest of the
national income accounts may seem
to be arcane concepts, they are truly
among the great inventions of the
twentieth century.
Paul A. Samuelson and
William D. Nordhaus
CH
AP
TE
R 2
1 M
ea
su
rin
g N
atio
na
l O
utp
ut
an
d N
atio
na
l In
co
me
© 2009 Pearson Education, Inc. Publishing as Prentice Hall Principles of Economics 9e by Case, Fair and Oster 41 of 53
Calculating GDP
The Income Approach
disposable personal income or after-tax
income Personal income minus personal income
taxes. The amount that households have to spend
or save.
personal saving The amount of disposable
income that is left after total personal spending in
a given period.
personal saving rate The percentage of
disposable personal income that is saved. If the
personal saving rate is low, households are
spending a large amount relative to their incomes;
if it is high, households are spending cautiously.

CH
AP
TE
R 2
1 M
ea
su
rin
g N
atio
na
l O
utp
ut
an
d N
atio
na
l In
co
me
© 2009 Pearson Education, Inc. Publishing as Prentice Hall Principles of Economics 9e by Case, Fair and Oster 42 of 53
Nominal versus Real GDP
current dollars The current prices that we pay for
goods and services.
nominal GDP Gross domestic product measured
in current dollars.
weight The importance attached to an item within
a group of items.

CH
AP
TE
R 2
1 M
ea
su
rin
g N
atio
na
l O
utp
ut
an
d N
atio
na
l In
co
me
© 2009 Pearson Education, Inc. Publishing as Prentice Hall Principles of Economics 9e by Case, Fair and Oster 43 of 53
Nominal versus Real GDP
Calculating Real GDP
TABLE 21.6 A Three-Good Economy
(1) (2) (3) (4) (5) (6) (7) (8)
GDP in GDP in GDP in GDP in
Year 1 Year 2 Year 1 Year 2
in in in in
Production Price Per Unit Year 1 Year 1 Year 2 Year 2
Year 1 Year 2 Year 1 Year 2 Prices Prices Prices Prices
Q1 Q2 P1 P2 P1 x Q1 P1 x Q2 P2 x Q1 P2 X Q2
Good A 6 11 $0.50 $0.40 $3.00 $5.50 $2.40 $4.40
Good B 7 4 0.30 1.00 2.10 1.20 7.00 4.00
Good C 10 12 0.70 0.90 7.00 8.40 9.00 10.80
Total $12.10 $15.10 $18.40 $19.20
Nominal GDP
in year 1
Nominal
GDP
in year 2

CH
AP
TE
R 2
1 M
ea
su
rin
g N
atio
na
l O
utp
ut
an
d N
atio
na
l In
co
me
© 2009 Pearson Education, Inc. Publishing as Prentice Hall Principles of Economics 9e by Case, Fair and Oster 44 of 53
Nominal versus Real GDP
Calculating Real GDP
base year The year chosen for the weights in a
fixed-weight procedure.
fixed-weight procedure A procedure that uses
weights from a given base year.
weight The importance attached to an item within
a group of items.

CH
AP
TE
R 2
1 M
ea
su
rin
g N
atio
na
l O
utp
ut
an
d N
atio
na
l In
co
me
© 2009 Pearson Education, Inc. Publishing as Prentice Hall Principles of Economics 9e by Case, Fair and Oster 45 of 53
The difference between nominal GDP and real GDP comes from:
a. Changes in the level of income.
b. Changes in purchasing power of the dollar caused by
changes in the exchanger rate.
c. Changes in prices.
d. Differences in the value of GDP depending on whether the
income approach or the expenditure approach is chosen to
compute GDP.
CH
AP
TE
R 2
1 M
ea
su
rin
g N
atio
na
l O
utp
ut
an
d N
atio
na
l In
co
me
© 2009 Pearson Education, Inc. Publishing as Prentice Hall Principles of Economics 9e by Case, Fair and Oster 46 of 53
The difference between nominal GDP and real GDP comes from:
a. Changes in the level of income.
b. Changes in purchasing power of the dollar caused by
changes in the exchanger rate.
c. Changes in prices.
d. Differences in the value of GDP depending on whether the
income approach or the expenditure approach is chosen to
compute GDP.

CH
AP
TE
R 2
1 M
ea
su
rin
g N
atio
na
l O
utp
ut
an
d N
atio
na
l In
co
me
© 2009 Pearson Education, Inc. Publishing as Prentice Hall Principles of Economics 9e by Case, Fair and Oster 47 of 53
Nominal versus Real GDP
Calculating the GDP Deflator
The GDP deflator is one measure of the overall
price level. The GDP deflator is computed by the
Bureau of Economic Analysis (BEA).
Overall price increases can be sensitive to the
choice of the base year. For this reason, using
fixed-price weights to compute real GDP has some
problems.

CH
AP
TE
R 2
1 M
ea
su
rin
g N
atio
na
l O
utp
ut
an
d N
atio
na
l In
co
me
© 2009 Pearson Education, Inc. Publishing as Prentice Hall Principles of Economics 9e by Case, Fair and Oster 48 of 53
Nominal versus Real GDP
The Problems of Fixed Weights
The use of fixed-price weights to estimate real
GDP leads to problems because it ignores:
• Structural changes in the economy.
• Supply shifts, which cause large decreases in
price and large increases in quantity supplied.
• The substitution effect of price increases.

CH
AP
TE
R 2
1 M
ea
su
rin
g N
atio
na
l O
utp
ut
an
d N
atio
na
l In
co
me
© 2009 Pearson Education, Inc. Publishing as Prentice Hall Principles of Economics 9e by Case, Fair and Oster 49 of 53
Limitations of the GDP Concept
GDP and Social Welfare
Society is better off when crime decreases;
however, a decrease in crime is not reflected in
GDP.
An increase in leisure is an increase in social
welfare, but not counted in GDP.
Most nonmarket and domestic activities, such as
housework and child care, are not counted in GDP
even though they amount to real production.
CH
AP
TE
R 2
1 M
ea
su
rin
g N
atio
na
l O
utp
ut
an
d N
atio
na
l In
co
me
© 2009 Pearson Education, Inc. Publishing as Prentice Hall Principles of Economics 9e by Case, Fair and Oster 50 of 53
Limitations of the GDP Concept
Gross National Income per Capita
gross national income (GNI) GNP converted
into dollars using an average of currency
exchange rates over several years adjusted for
rates of inflation.

CH
AP
TE
R 2
1 M
ea
su
rin
g N
atio
na
l O
utp
ut
an
d N
atio
na
l In
co
me
© 2009 Pearson Education, Inc. Publishing as Prentice Hall Principles of Economics 9e by Case, Fair and Oster 51 of 53
Limitations of the GDP Concept
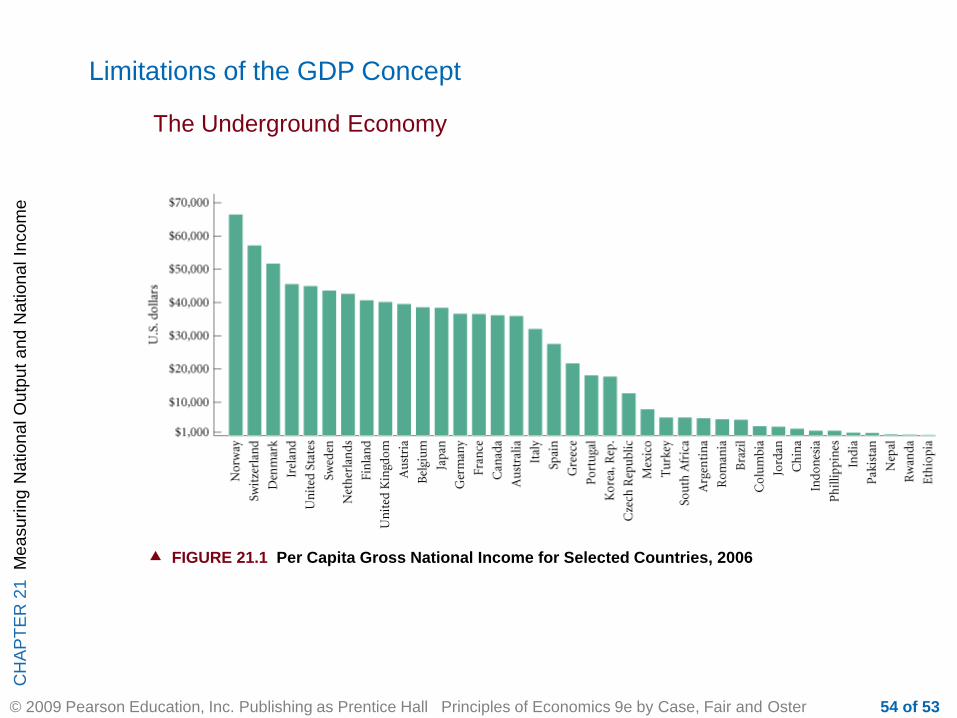
The Underground Economy
underground economy The part of the economy
in which transactions take place and in which
income is generated that is unreported and
therefore not counted in GDP.

CH
AP
TE
R 2
1 M
ea
su
rin
g N
atio
na
l O
utp
ut
an
d N
atio
na
l In
co
me
© 2009 Pearson Education, Inc. Publishing as Prentice Hall Principles of Economics 9e by Case, Fair and Oster 52 of 53
Legalizing all forms of illegal activities would:
a. Reduce both the underground economy and GDP.
b. Increase both the underground economy and GDP.
c. Increase the underground economy but reduce the value of
GDP.
d. Reduce the underground economy and increase the value of
GDP.

CH
AP
TE
R 2
1 M
ea
su
rin
g N
atio
na
l O
utp
ut
an
d N
atio
na
l In
co
me
© 2009 Pearson Education, Inc. Publishing as Prentice Hall Principles of Economics 9e by Case, Fair and Oster 53 of 53
Legalizing all forms of illegal activities would:
a. Reduce both the underground economy and GDP.
b. Increase both the underground economy and GDP.
c. Increase the underground economy but reduce the value of
GDP.
d. Reduce the underground economy and increase the
value of GDP.
CH
AP
TE
R 2
1 M
ea
su
rin
g N
atio
na
l O
utp
ut
an
d N
atio
na
l In
co
me
© 2009 Pearson Education, Inc. Publishing as Prentice Hall Principles of Economics 9e by Case, Fair and Oster 54 of 53
Limitations of the GDP Concept
The Underground Economy
FIGURE 21.1 Per Capita Gross National Income for Selected Countries, 2006

CH
AP
TE
R 2
1 M
ea
su
rin
g N
atio
na
l O
utp
ut
an
d N
atio
na
l In
co
me
© 2009 Pearson Education, Inc. Publishing as Prentice Hall Principles of Economics 9e by Case, Fair and Oster 55 of 53
base year
change in business inventories
compensation of employees
corporate profits
current dollars
depreciation
disposable personal income, or after-tax
income
durable goods
expenditure approach
final goods and services
fixed-weight procedure
government consumption and gross
investment (G)
gross domestic product (GDP)
gross investment
gross national income (GNI)
gross national product (GNP)
gross private domestic investment (I)
income approach
indirect taxes minus subsidies
intermediate goods
national income
national income and product accounts
net business transfer payments
net exports (EX - IM)
net interest
net investment
net national product (NNP)
nominal GDP
nondurable goods
nonresidential investment
personal consumption expenditures (C)
personal income
personal saving
personal saving rate
proprietors’ income
rental income
residential investment
services
statistical discrepancy
surplus of government enterprises
underground economy
value added
weight
Expenditure approach to GDP: GDP =
C + I + G + (EX - IM)
GDP = Final sales - Change in
business inventories
Net investment = Capital end of period
- Capital beginning of period
REVIEW TERMS AND CONCEPTS