pq log - fluke corporationassets.fluke.com/manuals/pqlog___umeng0000.pdf · 2006-06-29 · pq log...
TRANSCRIPT

®
PQ Log PC Software for 1740 Series
Users Manual
June 2006 © 2006 Fluke Corporation, All rights reserved. All product names are trademarks of their respective companies.


i
Table of Contents
Title Page Introduction........................................................................................................ 1
Logging Functions......................................................................................... 1 Activities You Can Do with PQ Log............................................................. 2 System Requirements .................................................................................... 2 Installing PQ Log .......................................................................................... 2
Preparing the Logger for Use............................................................................. 3 Establishing a Connection to the Logger....................................................... 3 Setting Up Logger for a P Type Job .............................................................. 5
Logging Power Quality Data ............................................................................. 9 Downloading Logged Data to the PC ................................................................ 9 Viewing Live Readings ..................................................................................... 11 Advanced (Optional) Logger Settings ............................................................... 11
Settings – User Preferences ........................................................................... 11 Settings for Medium Voltage Networks ........................................................ 13 Defining Interharmonics (A function only)................................................... 14 Sequential Logging Jobs................................................................................ 15
Analyzing Logged Data ..................................................................................... 16 Timeplot Display ........................................................................................... 16 EN 50160 (for Europe) .................................................................................. 16
PQ Log Feature Reference................................................................................. 18 Tool Bar......................................................................................................... 18
The Main Toolbar ..................................................................................... 19 Toolbar for Timeplot:................................................................................ 19 Toolbar for ONLINE Test......................................................................... 20 Toolbar for Measurement Value List ....................................................... 21 Toolbar for Voltage, Current Cumulative Frequency ............................... 22 Toolbar for Events (UNIPEDE DISDIP Table) ....................................... 22 Toolbar for Data List of All Events .......................................................... 22
Logger Menu ................................................................................................. 25 Setting up a Logger - Interharmonics (A) ................................................. 26 Reset.......................................................................................................... 26 Information about the Logger ................................................................... 27 Online Data from Logger .......................................................................... 28
Analysis ......................................................................................................... 28 Graphical Summary .................................................................................. 29

PQ Log Users Manual
ii
Voltage Cumulative Frequency (A Only) ................................................ 30 Current Cumulative Frequency (A Only)................................................. 31 Symbol Bar for the Cumulative Frequency Display ................................. 33 Events........................................................................................................ 41 Table Summary ......................................................................................... 42 Statistical Values (A Only) ....................................................................... 44 Most Critical Values (A Only) .................................................................. 44
Settings .......................................................................................................... 45 Settings- General ....................................................................................... 45 Limit Value Level File .............................................................................. 47 Limit Value Level File – Voltage Harmonics ........................................... 51 Limit Value Level File – Interharmonics.................................................. 52 Limit Value Level File - Signaling Voltages ............................................ 52 Application Oriented Analysis File........................................................... 53 Colors ........................................................................................................ 54 Print Diagram without Background .......................................................... 54 Curve Width .............................................................................................. 54 Language................................................................................................... 54 Export........................................................................................................ 55
Window Menu ............................................................................................... 55 Appendix A........................................................................................................ 56
Abbreviations, Symbols ................................................................................ 56 General ...................................................................................................... 56
Index

iii
List of Tables
Table Title Page
1. System Requirements............................................................................................. 2 2. Available Parameters for Version P ....................................................................... 36 3. Available Parameters for Version A -Voltage, Current ......................................... 36 4. Available Parameters for Version A - Power, Energy ........................................... 37

PQ Log Users Manual
iv

v
List of Figures
Figure Title Page
1. Start Menu.............................................................................................................. 3 2. Preparing a Logger Job .......................................................................................... 4 3. Problem in Connection Message............................................................................ 4 4. Serial Port Settings................................................................................................. 5 5. Current Setup Menu ............................................................................................... 6 6. Time Setting Menu................................................................................................. 7 7. Summary Screen .................................................................................................... 8 8. Warning Message Before Sending Setup Information........................................... 8 9. Successful Saving Confirmation Message ............................................................. 9 10. Selecting an Analysis Time Period ........................................................................ 10 11. Timeplot Display.................................................................................................... 10 12. General Settings Menu........................................................................................... 12 13. Potential Transformer............................................................................................. 13 14. Current Transformer............................................................................................... 14 15. Set up Logger for Function A ................................................................................ 15 16. Timeplot Display.................................................................................................... 16 17. PQ Log Table Summary......................................................................................... 17 18. Harmonics Graph ................................................................................................... 18 19. Information About the Connected Logger ............................................................. 27 19. Logger Graphical Summary Screen ....................................................................... 29 20. Voltage Parameters ................................................................................................ 31 21. Current Harmonics ................................................................................................. 32 22. Application Oriented Channel Selection................................................................ 34 23. UNIPEDE DISDIP Table....................................................................................... 42 24. Enter your title here................................................................................................ 42 25. Selecting Parameters .............................................................................................. 45 26. General Settings Menu........................................................................................... 46

PQ Log Users Manual
vi

1
PQ Log
PC Software for 1740 Series Introduction
The Fluke 1740 Series Loggers monitor power quality and locate disturbances in low and medium voltage distribution networks. The “Logger” in this manual refers to either of the Models 1744 or 1745. The Logger measures up to 3 voltages and 4 currents. Logged values are saved in your choice of sequential averaging periods. You graphically or numerically evaluate measured values with PQ Log Software. PQ Log is the PC application software for 1740 Series Loggers. PQ Log is compatible with MS Windows NT, 2000 and XP. PQ Log prepares the Logger for use, and receives downloaded data from the Logger. You transfer logged data to a PC for graphical and tabular evaluation, export to a spreadsheet, or generation of reports for printing.
Logging Functions Models 1744 and 1745 have two types of logging functions: logging function A (Advanced) and logging function P (Power). Function A is the full set of parameters, and function P provides logging capability optimized for load studies and basic power logging. Function P contains every parameter in Function A except voltage and current harmonics and interharmonics. Model 1743 operates only with logging function P. Logging function parameters:
• RMS Voltage of each phase (average, min, max) • RMS Current of each phase and neutral (average, min, max) • Voltage events (dips, swells, interruptions) • Power (kW, kVA, kVAR, Power Factor, Cosine φ) • Energy, total energy • Flicker (Pst – short term, and Plt – long term) • Voltage thd (Total Harmonic Distortion) • Current thd • Current CF (Crest Factor) • Voltage harmonics to the 50th (not in P function) • Voltage interharmonics (not in P function)

PQ Log Users Manual
2
• Mains signaling voltage • V Unbalance (Positive sequence/negative sequence harmonics) • Line (mains) frequency
Activities You Can Do with PQ Log The activities that you can do with PQ Log are:
• Prepare the Logger for use, connected to the Logger, or in advance • Monitor live data from the Logger • Download recorded logged data to the PC • View, print, and export timeplots of all channels • Application-oriented analysis (sets of parameters to graph to achieve different
typical analysis tasks) • Perform harmonic studies • Perform statistical analysis • Generate data tables • Print tables, graphs, and comprehensive, formatted reports • Export data to an ASCII file • Upgrade the Logger’s Firmware (operating software) when a new release is
available on the Fluke website • Perform standardized analysis of measured values according to the European
standard EN 50160
System Requirements Table 1 shows the minimum computer requirements for PQ Log.
Table 1. System Requirements
PC Configuration for PQ Log Necessary Recommended
Free hard disk space 10 MB >50 MB
CD-ROM drive
Monitor 800 x 600 pixels 1024 x 768 pt
Serial interface, or a serial-to-USB interface adapter and the USB adapter manufacturer’s driver software for the adapter
Windows NT, 2000, XP or later version
Color printer
Installing PQ Log Insert the Logger’s product CD into the CD-ROM drive. If your CD-ROM drive is configured for Autorun, the installation starts automatically. If not, run the Launch.exe program on the CD-ROM. Follow the instructions on the screen to install PQ Log in your choice of language.

PC Software for 1740 Series Preparing the Logger for Use
3
Preparing the Logger for Use PQ Log and this manual refer to logging (recording) sessions as Jobs. A Job is a package of Logger settings that configures a Logger for a recording session. In addition to saving the setups in the Logger, you can save setups as template files on the PC for later recall. The following instructions take you through the Logger setup process.
W X Warning To avoid electrical shock or damage to the equipment, read and follow the safety warnings and cautions in the 1744/1743 or 1745 Users Manual before you make any connections to the Logger.
Establishing a Connection to the Logger Connect the Logger to a power supply and to the PC’s serial interface using the original serial cable provided with the Logger before you proceed. If you are using a serial-to-USB converter cable, install the drivers that are shipped with the converter cable first, then connect the original Logger serial cable and adapter to your USB connector.
Note The red serial cable shipped with the Logger is a special cable – it is a null-modem cable, with the TX and RX lines crossed. This allows the Logger to work with a modem or a PC.
To establish a connection to the Logger: 1. Start up your PC.
2. Start PQ Log by selecting the PQ Log program icon from Start/Programs/Fluke/PQ Log. The PQ Log Start Menu appears:
egd001.bmp
Figure 1. Start Menu
3. Click on the Set up button next to ”Set up a logger for function P – basic power logging”.
4. Verify that a screen similar to the one shown below appears. This means the PC and Logger are communicating properly.

PQ Log Users Manual
4
egd002.bmp
Figure 2. Preparing a Logger Job
5. If the following screen appears, there is a problem with the connection to the Logger.
egd003.bmp
Figure 3. Problem in Connection Message
6. If your PC is not connecting to the Logger, find the serial port that connects to the Logger by trying them sequentially. You will find this setting under Settings/General Settings. The following picture shows the communication settings portion of the General Settings menu.

PC Software for 1740 Series Preparing the Logger for Use
5
egd004.bmp
Figure 4. Serial Port Settings
Setting Up Logger for a P Type Job If PQ Log is connected to the Logger, the Logger automatically identifies the Logger type and the current probe type attached. To set up P type Logger Job:
1. Make sure the PC is communicating with the Logger. Starting from step 3 above, set up the Logger parameters for the job as follows, starting from the top of the “Set up for Logger” function P menu.
2. Enter the Nominal Voltage. This can be a phase-to-neutral voltage or a phase-to-phase voltage.
3. Select 50 Hz or 60 Hz from the Frequency pull-down menu. 4. Select the Power Type from the pull-down menu. This is where you set up the
Logger for Delta (3-wire) or Wye (star or 4-wire), or other power configurations from a list of choices.
5. Select the Min-Max-value from the pull-down list. This determines the averaging period of min/max capture for rms voltage levels for later display. Some standards require certain min/max averaging periods. The shortest setting is ½-cycle, which is the most sensitive for measuring the absolute highs and lows that occur within an overall averaging period for measurements. (You choose averaging period for measurements in in Figure 2.)
6. Click on the Current button on the right side of the menu. The Current menu appears.

PQ Log Users Manual
6
egd005.bmp
Figure 5. Current Setup Menu
7. Select the current Min-Max-value from the pull-down list. This is an independent setting for averaging period just for current. You will use the effects of this setting later during the analysis of the data when you choose to see the voltage at the time max current happened.
8. If you are using Flexi-Set current probes, you have a choice of sensitivity ranges. Select the one you want from the pull-down list.
9. (Optional) Choose Measure or Calculate to determine how PQ Log will derive the data it displays for neutral current. Sometimes it is useful to choose Calculate even if the neutral current probe is connected around the neutral feeder. This is the case when you want to measure power the same way a revenue power meter does it, if the power meter uses a calculated neutral.
10. Click OK and you are back to the Setup for Logger function P menu. Select the Averaging Period from the pull-down list. Notice how different settings affect the available logging time. If you select 1 s, the available logging time is shortest, but you get the most detailed data. Choose the setting that is required for the power quality standards you want your data to comply with, or the one that gives you the most detailed data for the time period of your logging session.
11. Select whether you want the Logger to quit logging when its memory is full (Linear), or keep logging continuously by overwriting the oldest data with new data (Circular).
12. (Optional) Choose the averaging period for min/max power measurements from the pull-down list.
13. Select how you want to control the start and stop times of the logging session:

PC Software for 1740 Series Preparing the Logger for Use
7
• Continuous job – The Logger starts logging as soon as it receives the setup information you are completing now
• Switch-activated job – The Logger starts logging when you press the START button on the front of the Logger, and stops when you press it again
• Time-activated job – The Logger waits until a programmed time to start logging, and stops when the programmed stop time occurs. If you select Time activated job, you need to fill in the start and stop times in the following menu. This menu appears when you select the Time activated job radio button
egd006.bmp
Figure 6. Time Setting Menu
14. Click the Next button. The confirmation screen appears, which allows you to review the settings you are about to load into the Logger or save as a template to a file on the PC.

PQ Log Users Manual
8
egd007.bmp
Figure 7. Summary Screen
15. Once you are satisfied that the settings are correct, save these settings to a template for later recall by clicking on the PC Save or Save As button. To write the setup data to the Logger, click on the Logger Save button. If you want to make sure you are not about to delete any important data, download the data before you send the job setup information to the Logger.
egd008.bmp
Figure 8. Warning Message Before Sending Setup Information
16. Click on the Yes (Continue) button. A message tells you that the settings have been saved successfully.

PC Software for 1740 Series Logging Power Quality Data
9
egd009.bmp
Figure 9. Successful Saving Confirmation Message
Note If you have checked the box Automatic time synchronization in the Settings/General menu, the date and time of the PC clock is transferred to the Logger every time you write setups to the Logger.
Logging Power Quality Data W X Warning
To avoid electrical shock or damage to the equipment, read and follow the safety warnings and cautions in the 1744/1743 or 1745 Users Manual before you make any connections to the Logger.
Once you have saved the Logger setup data in the Logger, disconnect the Logger from the PC, and attach the voltage leads and current probes to the distribution system to be measured as described in the Logger’s Users Manual. The Logger settings and the recorded data are retained in the Logger’s memory when the power is disconnected from the Logger. How you start and stop the logging session depends on how you set the Measurement Period buttons – continuous job, switch activated job, or time activated job.
Downloading Logged Data to the PC After completion of the measurement or when the job is active, you can transfer logged data stored in the Logger to the PC. This action does not disrupt the ongoing logging activity, so you can do it anytime. To download the logged data to the PC:
1. Connect the Logger to the serial port of your PC. Select the menu Logger>Read Results or click button from tool bar.
2. Specify the name and path for the logged data file. 3. Click Save. PQ Log transfers measurement data from Logger to the PC. You will
see progress bars on the screen as the data is transferred from the Logger to the PC.
4. The data transfer can take seconds or minutes, depending on the Baud rate and the amount of data.
5. Once the data has downloaded to the PC, you choose a time period from the downloaded data to store in the data file for analysis. Selecting a time period shorter than the logging period does not delete any data. See Figure 10 for an example how this time period selection appears. Refer to the section “Analyzing

PQ Log Users Manual
10
Logged Data” for how to use the timeplot, and how to analyze the data in the data file in general.
egd009a.bmp
Figure 10. Selecting an Analysis Time Period
egd010.bmp
Figure 11. Timeplot Display

PC Software for 1740 Series Viewing Live Readings
11
Viewing Live Readings You can view live readings to gain assurance that the data being logged is going to be useful, and the settings and current probe range is correct. To view live readings:
1. Connect the PC to the Logger while the logging is active.
2. Click on the icon or select “Online data from the Logger” from the Logger menu. A strip chart display shows data from any channel you select to view.
You can monitor nearly all parameters, although Flicker (Plt) and min/max-values are not available. Flicker (Pst) shows 5-second values. For all other parameters, 200 ms values are displayed. There is a stripchart on the screen which is updated in about 1-second intervals, depending on the data transmission speed and the PC response time. PQ Log maintains about 17 minutes of stripchart data in memory, and then writes over older values. The buttons for time and y-axis scaling are:
Buttons Descriptions
Scales the Y-axis according to the extreme values. This is useful if the curve leaves the visible area of the diagram during test
Allows you to add or delete additional parameters to or from the diagram
Activates the application oriented analysis. This feature groups parameters to view based on the particular problem you are trying to resolve. For more details refer to “PQ Log Feature Reference” section
Presents recorded data in a table format. The table is not updated automatically
Toggles the auto scroll function (the diagram is scrolled automatically if active)
Suspends the ONLINE display of data
Note As long as the Online test is active, no communication to Logger is possible because the serial port is occupied. You can print the stripchart by selecting File>Print document from the menu bar.
Advanced (Optional) Logger Settings The preceding setup procedures are the minimum necessary to carry out a logging session. Other Logger settings that you can specify are explained below.
Settings – User Preferences The settings menu presents choices for the following:
• Setting of limits (thresholds) for events • Selection of an “Application oriented analysis” template • Choice of colors for timeplot traces • Your choice of language

PQ Log Users Manual
12
In the Settings Menu under General, the following screen presents you with choices for the following:
egd011.bmp
Figure 12. General Settings Menu
• Title to print on the automatic report • Serial port and baud rate • Calculation method for harmonics readings (A function only) • Number of harmonic orders included in thd calculation (40 or 50) (A function
only) • Phase identification (display of ”L1, L3, and L3” or ”A, B, and C”) • A way to turn off automatic display of the Startup Screen when PQ Log is started • Turning on or off automatic transfer of the PC’s internal real-time time/date
setting to the Logger’s internal real-time clock every time settings for a new job are written to the Logger

PC Software for 1740 Series Advanced (Optional) Logger Settings
13
• A way to turn on or off display of a warning message that a logging period is not in conformance with the European EN 50160 standard
• Turning on or off flicker and thd values during data analysis
Settings for Medium Voltage Networks When preparing a Logger for use, you can enter ratios for voltage and current, resulting in the calculation and display of primary side values. For example, in 14 kV delta power network, the primary side of a Potential Transformer (PT) might be at 14 kV potential, and the secondary side might be at 100 V potential. There might be a Current Transformer (CT) with a ratio of 1000 A to 5 A. For the Logger to display readings in the 14 kV and 1000 A range:
1. In the ”Set up a logger for function P or A” screen, check the box for ”Voltage transformer” at the top of the screen. Entry boxes for Primary and Secondary appear. Make the voltage entries as shown:
egd012.bmp
Figure 13. Potential Transformer
2. Open the Current menu. Check the box for Current Transformer, and enter the current primary and secondary as shown:

PQ Log Users Manual
14
egd013.bmp
Figure 14. Current Transformer
Defining Interharmonics (A function only) The Logger uses an interharmonics calculation to measure mains signaling, or ripple control signals. These signals are used in some parts of Europe to control industrial equipment and lighting. Logging of interharmonics is optional. To define interharmonics to log:
1. Click Edit Interharmonics from the ”Set up for Logger function A” screen. The screen that enables defining of ripple control signals and interharmonics appears.
This is where you can select the frequency of the ripple control signal, give a descriptive name to the signal, and select the measurement method for the signal.

PC Software for 1740 Series Advanced (Optional) Logger Settings
15
egd013a.bmp
Figure 15. Set up Logger for Function A
2. Enter the frequency of the ripple control signals of your local power utility, or of
the interharmonics which are to be monitored. Five different channels (frequencies) are possible.
Sequential Logging Jobs The 1744/1743 and 1745 Power Quality Loggers can handle two measurement jobs of the same type (both P or both A) in sequence: While one measurement job is active, the setup data of the previous jobs are temporarily retained in the memory. You can check the ”running” or ”complete” status of these jobs anytime by selecting Menu>Logger>Information about Logger. Clicking the Info button on the tool bar also allows you to check the job status.
• Logger name • Date/time
Note Retrieving the data will not influence the logging job. The Logger will continuously record interval and event data during the data transfer and the active job will not be aborted.

PQ Log Users Manual
16
Analyzing Logged Data Note
Check that the appropriate limit value file is selected. Use menu Software Settings>General>Select Limit value file for analysis.
“Default GWD60 Hz.gwd” is for applications in 60 Hz systems. “EN 50160.gwd” is preset for limits defined in EN 50160 “50160_61000-2-2.gwd” has limits for harmonics up to the 50th order according to IEC 61000-2-2
Timeplot Display When you first open a data file to analyze, a Timeplot is displayed. See Figure 16.
egd015.bmp
Figure 16. Timeplot Display
Refer to the PQ Log Features Reference section for how to view different parameters and how to manipulate the x and y-axis ranges. The icons and menus for manipulating the Timeplot display are explained there.
EN 50160 (for Europe) This view provides a statistical analysis of the measured parameters. From this presentation we can see which measured variables exceed the limit values set up in the limit value file (default: according to EN 50160). The measured values of each measurement row (voltage variations, interruptions, events, harmonics and flicker) are classified according to the quantity. In function P there are bars for thd of voltages, the bars ”Flicker” represent long term flicker Plt .
PC Software for 1740 Series Analyzing Logged Data
17
95 % of all measured values are less or equal to the 95 %-value. The remaining 5 % of measured values exceed this value but must be below the 100 % limit value. Thus, the 95 %-value provides statistical information about the distribution of the measured values. Also refer to PQ Log Feature Reference section. Menu File>Print Document will print this diagram.
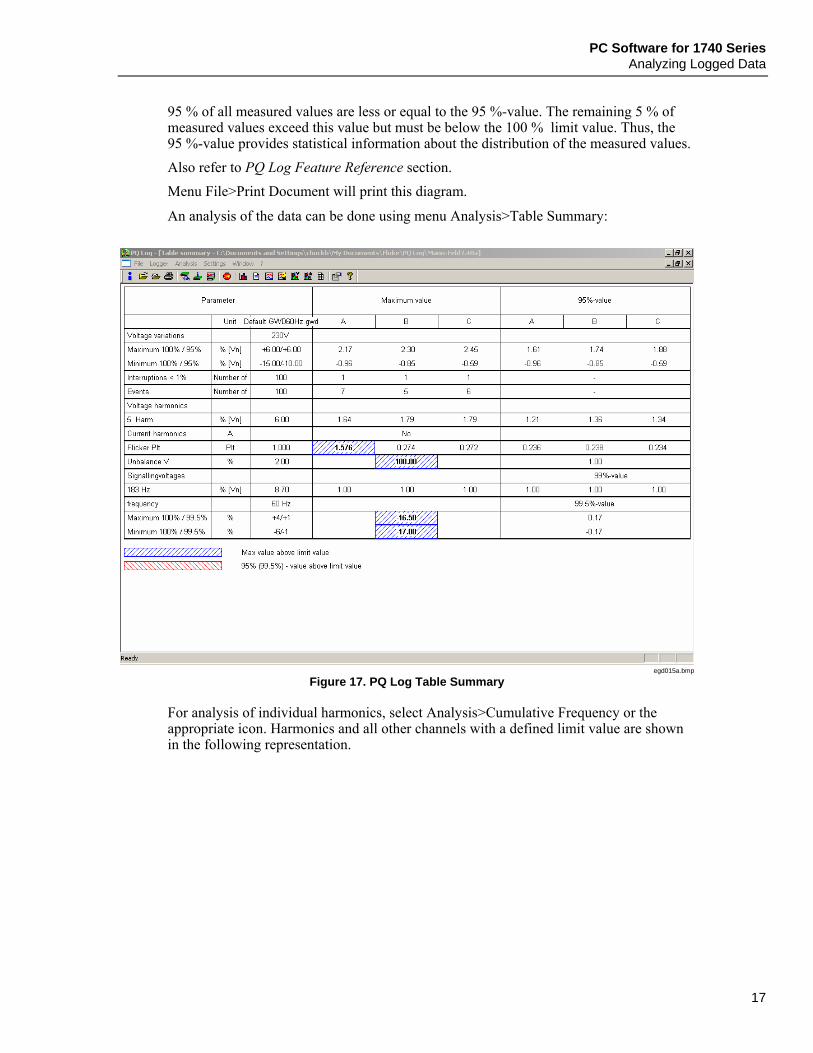
An analysis of the data can be done using menu Analysis>Table Summary:
egd015a.bmp
Figure 17. PQ Log Table Summary
For analysis of individual harmonics, select Analysis>Cumulative Frequency or the appropriate icon. Harmonics and all other channels with a defined limit value are shown in the following representation.

PQ Log Users Manual
18
egd015b.bmp
Figure 18. Harmonics Graph
From this representation, it can be seen which harmonics on which phases exceed the limit value as per standard EN 50160.
PQ Log Feature Reference This section contains detailed information about options and dialog boxes for PQ Log. It is divided into the following sections:
• Tool Bar • Options Menu • Logger Menu • Job Templates • Analysis • Settings • Window Menu
Tool Bar Some options can be selected directly from the tool bar. Click the appropriate icon and an additional tool bar appears for the timeplot and events analysis. Symbols below marked with an asterisk (*) are active only when a measurement data file is open.
PC Software for 1740 Series PQ Log Feature Reference
19
The Main Toolbar
Information about a data file*
Open a data file
Reopen data file
Print directly*
Read results
Information about Logger
Online Test
Stop logging
Graphical summary*
Table summary*
Timeplot*
Application oriented analysis*
Voltage cumulative frequency*
Current cumulative frequency*
Events, UNIPEDE DISDIP table*
Software Settings
Info
Toolbar for Timeplot:
X-axis: Entire measurement period
X-axis: 28 days
X-axis: 7 days
X-axis: 1 day

PQ Log Users Manual
20
Move to begin of measurement
Previous time segment
Next time segment
Move to end of measurement
Enlarge time scale
Reduce time scale
Open X-axis scaling dialog box
Zoom undo
Left scaling selection is affected
Right scaling selection is affected
Scaling dialog for Y-axis
Show/hide limit values
Channel selection
Application-oriented channel selection
Measurement value list
Show energy (in functions A, P only)
Toolbar for ONLINE Test
X-axis: Entire measurement period
X-axis: 28 days
X-axis: 7 days
X-axis: 1 day
Move to beginning of measurement

PC Software for 1740 Series PQ Log Feature Reference
21
Previous time segment
Next time segment
Move to end of measurement
Enlarge
Reduce
Open X-axis scaling dialog box
Zoom undo
Left scaling selection is affected
Right scaling selection is affected
Scaling dialog for Y-axis
Scale Y according to extreme value
Show/hide limit values
Channel selection
Application-oriented channel selection
Measurement value list
Auto scroll on/off
Stop
Toolbar for Measurement Value List
Print one page only
Print whole measurement period
Print 7 days…1 h, starting from the actual time
Select starting time and period

PQ Log Users Manual
22
Show/hide interval status
Toolbar for Voltage, Current Cumulative Frequency
Scaling according to limit value, not available for current
Scaling according to nominal value
Class limits
Create timeplot with selected curves
Print list of harmonics
Toolbar for Events (UNIPEDE DISDIP Table)
Events of all phases
Events phase L1 or A only
Events phase L2 or B only
Events phase L3 or C only
Data list of all events
Toolbar for Data List of All Events
Events of all phases
Events L1 or A
Events L2 or B
Events L3 or C
Events and interruptions
Events only
Short interruptions only
Long interruptions only
Print one page only

PC Software for 1740 Series PQ Log Feature Reference
23
Print whole measurement period
Opening a Data File This menu item opens a saved Logger measurement data file. To open a Logger data file:
1. Select the desired file in the "File/Open a data file" dialog box. 2. Select the evaluation period. This is important if the data was recorded for a long
period and a report according to European standard EN 50160 is required (1 week period). This selection does not delete any data in the data file. It just limits what data in the file you will be viewing.
Reopen a Data File This menu option allows you to reopen a saved Logger measurement data file to select another evaluation period.
Close the Data File This menu option allows you to close the data file
Information about the Data File This menu option displays information about the data file. To enter information about the measurement:
1. Click the Text button. The data file screen, for entering/modifying specific text for a finished measurement appears.
2. Click OK. Your text annotation is stored in the data file.
Note The text is transferred to the ASCII file during the export function. In that way, PQ Log passes information from the data file to the exported data file.
The Logger button shows all relevant information on the firmware and hardware of the Logger that has been used for the logged data.
Print Document This option prints the active analysis (of the active window). You can activate a screen by clicking on the required window or you can select it from Window>Name of Window menu. .
Setup Printer This option opens the standard dialog box for printer settings.
Exporting Data This option exports the selected measurement data to a file in the ASCII-format. This option is active only in the analysis mode. Check the settings for the export before using this option using Software Settings>Export menu.
1. Interval data: This option exports the parameters that are stored at the end of each interval (normally after every 10 minutes).

PQ Log Users Manual
24
2. Statistical measurement data : This option exports the value classes for signaling voltages and the frequency (function A only).
3. Exporting Events: This option exports data on the voltage dips, voltage surges, and voltage interruptions.
4. VSE-Export: This is a special export format mainly used in Switzerland. 5. V-Export: This is an export format especially created for Venezuela. It can
also be used in other Spanish speaking countries. 6. Create 10 min and 15 min file: This special export function creates 10 min
interval files for PQ-analysis and 15 min interval files for power applications from 5 min interval measurements.
Each export file can be opened in other applications, for example, MS Excel MS Word .Each file can contain measurement data from only one of the export types. If you wish to export measurement data of all types, you have to create different files. To export data files:
1. Open a measurement data file, File>Export. 2. Select the output format. For data that is processed with MS Excel , the default
format is suitable. Suppress the header lines to make post-processing in MS EXCEL easier (CSV-format, comma separated values).
3. Click OK to confirm. For interval data select the measurement rows which are to be exported. If items are invisible there are no related measurement data.
Note For available parameters refer to the Timeplot section.
Note
With the buttons and you can move all available parameters simultaneously. You can move a maximum of 999 at one time.
To export Logger data: 1. Select the statistical-type measurement data you wish to export (version A only). 2. Click OK to initiate the export.
Note The filename is created automatically with the name of the actual measurement data file followed by the extension .ASC.
To export events, click OK in ”Export – Events” screen. 1. Select the desired export period in ”Export Period” screen. 2. Click OK to confirm. The ”Save ASCII file as” dialog box appears. 3. Enter the file name. Click OK to confirm.
Export (VSE Format) This option exports the measurement data file in a special format used in Switzerland for the VSE statistics.

PC Software for 1740 Series PQ Log Feature Reference
25
To export data in the .vse format: 1. Go to File>Export>VSE Export. 2. Select the measurement parameters and the transformer power for export. 3. Click OK to initiate the export. 4. Select the harmonics to be exported.
Note Do not change any of the settings if you are performing a standard export.
Note
With the buttons and you can move all the available parameters simultaneously. You can move a maximum of 999 parameters at one time.
5. Click OK to confirm. 6. Select the file name and click OK to confirm.
1…9 File Name This option opens the specified data file and allows you to select one of the nine measurement files you last worked on. On opening the files, a timeplot appears automatically.
Close Exit This option enables you to close a data file evaluation in the analysis mode or to exit PQ Log.
Logger Menu This menu contains all the options related to the setting up and communication with a Logger.
Note PERMLINK software,available as an optional accessory, allows programming the Logger through a modem connection and to read out data through the modem.
Read Results Downloading data was explained earlier in this manual.
Read Old Measurement Data This selection performs the same function as the Read Results option, but downloads measurement data of the previous job still stored in the Logger.
Setting up a Logger– Events –Hysteresis Enables you to define a hysteresis for the detection of events (this is required by the IEC1000-4-30 standard): The value in % of Vn is used for voltage swells and also for voltage dips in a similar way. On entering 0 %, the hysteresis is deactivated.

PQ Log Users Manual
26
Advantage: Many small events that are detected if the mains voltage is close to the threshold are concatenated to one main event.
Setting up a Logger - Interharmonics (A)
Interharmonics (maximum 5) Up to 5 interharmonic frequencies can be selected. Voltages and currents with these frequencies are monitored.
Note Interval data and statistical data are recorded for each interharmonic. Classes between 1 % and 11 % of Vn are created for the 3 s-Max-values for each phase and each frequency. The statistical data are used for the analysis of signaling voltages (ripple control signals) according to EN-50160.
Measurement Principle Specify measurement method: 200 ms maximum or minimum value, 3 s maximum value, or mean value during the interval period. Thus precise monitoring of ripple control signal levels can be performed.
Frequency Measurement Absolute: The absolute measurement is based only on the frequency. Relative: The relative measurement is based on a frequency in relation to the fundamental of the input signal.
Special Transformer (A, P) In this field, a maximum of +9 ° phase shift can be corrected by entering –9 °. For an inductive (lagging) error of 9 ° the measurement results are corrected with –9 °.
Reset
W Caution Ensure that the data transfer is not interrupted during this
process. Interruptions could cause problems and the RESET
must be repeated from the beginning.
This screen allows you to reinstall the firmware of a Logger.
Note This function is a service tool and should not be used during the normal operation of the Logger. In case of problems (example, no RS232 communication possible to Logger) RESET allows transferring the firmware to the Logger.
To reset firmware to the Logger: 1. Select Logger>Reset. The Reset screen appears. 2. Turn off the power supply of the Logger. Click OK to confirm.
PQ Log prepares the serial port for the firmware download mode.

PC Software for 1740 Series PQ Log Feature Reference
27
3. Define the type of the connected Logger. Be very careful that your selection matches the Logger type that you are using. If you select an improper type, the results could be unpredictable. Details such as the Type, Mains Frequency, and Order Reference are displayed on rear panel of the Logger. The next field defines the nominal mains frequency. Enter the nominal power frequency of the system in which the Logger should be used in the following measurements.
4. Click OK to start the firmware transfer. 5. Click OK to start normal operation.
Information about the Logger This screen provides information on the current status of the Logger: hardware and software version details.
egd015k.bmp
Figure 19. Information About the Connected Logger
Status Provides information about the job:
• Number of intervals • Number of statistics

PQ Log Users Manual
28
• Number of events The available messages are:
• No job is programmed • Job is active (between segments) • Job is active, previous job is available • Job is completed
Additionally the following information is also available: • Logger name • Logger date/time • Hardware type of the Logger • Serial number • The field ”Current sensor type” shows the type of the connected accessory:
o Type 0: No accessory detected o Type 1, 3: Flexi Set 3-phase o Type 2, 4: Flexi Set 3-phase+N o Type 5: 3-phase current clamp set o Type 6: Current clamp set 3-phase + N o Type 7: 1-phase clamp set o Type 8: 1-phase Flexi Set
Note Types 1 and 2 are sensors which were shipped with the earlier instruments that are compatible with the Logger.
Max. Clamp current Shows the nominal measuring range of the actual accessory.
Logger Details This screen displays type of analog and digital board, version of Boot-, CPU and DSP software.
Online Data from Logger Starts the ONLINE function as previously described. This is the stripchart of live readings. This feature can be used only when a logger has been set up and logging is active..
Analysis This menu option enables the analysis of a Logger data file:
Note This menu is available only if a measurement file is open.

PC Software for 1740 Series PQ Log Feature Reference
29
Graphical Summary The Graphical Summary screen, Figure 19, is for the European EN50160 standard.
egd015c.bmp
Figure 20. Logger Graphical Summary Screen
A graphical representation of a statistical analysis of all measured parameters for the total measuring period is shown. We can see which values exceed the limit values as per standard EN 50160 and/or which reserves are available. The measured values of each measurement row such as voltage variations, interruptions, harmonics (i.e. thd), and flicker are classified according to quantity. 95 % of all measured values are below the 95 % value. The remaining 5 % of measured values exceed this value but have to be below the 100 % limit value (for slow voltage variations and frequency). The 95 % value provides statistical information about the distribution of the measured values. Beneath the limit value line the file name of the actual limit value file can be seen. A stacked bar chart is used for the presentation. Bars are drawn for each of the three phases for each measurement parameter. The measured maximum value and 95 %-value are scaled with the corresponding limit value. The limit value line is superimposed so that it can be determined whether:
• The limit value has been exceeded. The 95 %-value (red bar) is above the limit value line
• The limit value has not been exceeded. The bar is always below the limit value line

PQ Log Users Manual
30
• There are any reserves available
Note In the EN-50160 regulation there is a 95 % limit value for all measured parameters. That is, 95 % of all measured values during one week must be below this limit value. For some parameters (frequency and slow voltage variations) there is a 100 % limit value. That is, 100 % of all measured values must be below this limit value.
There are thd V bars for thd of voltages of each phase. The bars ”Flicker” show the long term values, Plt.
Stacked Bar Charts from Measured Values The values measured during one week are put in increasing order together with the limit value line. Maximum value and 95 % value are benchmark figures for the stacked bar chart. It can easily be seen which measured values exceed the limits defined in the limit level file and which reserves are still available. Select Print>Print document menu to print the document.
Note For voltage variations there are two independent bars:
• For the red (95 %) bar the limit value line represents the 95 % limit value (for example –10 % as per EN 50160)
• For the blue (MAX) bar the limit line represents the 100 % limit value (for example –15 % as per EN 50160)
The red bar is before the blue one. The standard is met if the red and blue bars are always below the limit value line.
Voltage Cumulative Frequency (A Only) The graphical analysis of the cumulative frequency is a well arranged statistical form of representation for the analysis of harmonics. The stacked bar chart principle is the same as the Graphical summary analysis. 1. Select Analysis>Cumulative frequency. The Voltage Cumulative Frequency screen
appears. 2. For the analysis of the harmonics, select ”Scaling according to limit value”. This is
also the selected standard scaling.

PC Software for 1740 Series PQ Log Feature Reference
31
egd015d.bmp
Figure 21. Voltage Parameters
You can easily see which harmonics exceed the permissible limit value and how many reserves are available. Only the first 25 harmonics in the limit value level file EN 50160.GWD are assigned a limit value. If you wish to examine the harmonics between 25-40, select the limit value level file 50160_1000-2-2.gwd. This selection can be made through the menu option – Software Settings. The order of a harmonic is shown under the associated numeric values when you place the cursor onto the respective bar. A second possibility is scaling according to the nominal value. Using this type of representation, the individual harmonics are shown in their effective amplitude. This type of representation is particularly suited for analyzing the load current if you specify the nominal value of the cable or the transformer as the nominal value of currents. All three phase loads can be seen immediately.
Current Cumulative Frequency (A Only) The graphical analysis of the cumulative frequency is a well-arranged statistical form of representation of the analysis of harmonics. The stacked bar chart principle is the same as in the Graphical summary analysis. The harmonics of the phase currents and of the Neutral currents are presented graphically in relation to the appropriate nominal current:

PQ Log Users Manual
32
egd015e.bmp
Figure 22. Current Harmonics
Presentations and creation of timeplots are similar to voltage cumulative frequency.
Note The nominal value can be modified at any time for the stored measurement data files to achieve optimal scaling: Select File>Change current transformer to enter the required nominal current values and reopen the measurement data file.
Creation of a Timeplot: It is possible to directly view the timeplot for each measured variable, i.e., its harmonics 1-40 (function A: 1-50), 5 interharmonics, thd, voltage, Flicker Pst, unbalance, frequency, and current values. Click the respective bar(s) and then click the Timeplot icon on the Symbol bar of the cumulative frequency.

PC Software for 1740 Series PQ Log Feature Reference
33
Symbol Bar for the Cumulative Frequency Display
Scaling Limit value Scales the diagram according to the selected limit value level file. Not available for current cumulative frequency.
Scaling Nominal value Scales according to the nominal value.
Scaling Class limits Selects the class limits.
Analysis>Timeplot Creates a timeplot with selected curves.
Print File list Prints a list with all harmonics.
Scaling to Limit Values - The bars of the diagram are scaled to the limits. For each phase the parameter and the limit are displayed. Each phase has an extra line with minimum/maximum values, date/time and the 5 % and the 95 % values.
Scaling to Nominal Values
Note Fundamental is scaled to 100 % of Vn and the harmonics are scaled to 10 % of Vn. The harmonics are normally very small in relation to fo so including V h1 and harmonics in the same diagram does not adversely affect the resolution.
Cumulative Frequency – Class Limits Define the class limits. 95 % and 5 % are the standard class limits. On selecting 95 % for the lower class limit, the green bars disappear. Then, the presentation is similar to the graphical overview. If the lower class limit is set to 0 %, the lowest value that ever occurred, is displayed (there are no other values below this value). The ”Standard” button resets the lower class limit to 5 % and the upper class limit to 95 %. 5 % of all measured values are below the 5 % value.
Timeplot-
Mark important bars in the cumulative frequency diagram. Click the icon to directly open a Timeplot for the selected parameters.
Print a List of Harmonics - PQ Log prints a table with harmonics V h1 up to V h50, thd V, voltage (min, mean, max), flicker Pst, frequency, current (mean, max, peak), crest factor CF. For all parameters the nominal value is displayed, 5 % value, 95 % value, maximum, unit, date/time. There is one table for each phase.

PQ Log Users Manual
34
Timeplot - Channel Selection Options There are three options for selecting the measurement rows for the diagram.
• Application-oriented selection • Manual selection • Selection in cumulative frequency representation
Application Oriented Analysis Selects predefined measured variable combinations, and represents the values in the timeplot using significant scaling. Select Analysis>Application oriented analysis. The Timeplot – Application Oriented Channel Selection screen appears.
egd015f.bmp
Figure 23. Application Oriented Channel Selection
To select a channel:
1. Select a suitable entry from application group. The right-hand window contains channel options for selection. There are single-phase, three-phase and mixed-phase analyses.

PC Software for 1740 Series PQ Log Feature Reference
35
Note Check the different options using the demo measurements, or one of your own measurements. This will quickly give you an impression of the predefined analyses.
2. Click OK. The timeplot appears in the desired format with the selected channels.
Info Click this button to view the information text for each predefined analysis. A message explains why the selected channels are relevant for the analysis.
Copy This button copies the entire contents onto the clipboard. The descriptions can be used in the measurement documentation. The channel selection can be called up from any Timeplot. Click the icon in the Symbol bar of the respective diagram.
Timeplot – Manual Channel Selection The timeplot diagram shows important correlations and the course of the measured variables. To manually select the channel:
1. Select the desired channels.
2. Select the measured values and phases. All means phase L1 or A, L2 or B, and L3 or C. Click. .
The desired measurement rows are selected. Double clicking on a measured variable has the same effect. The selected measurement rows appear in the selection window. Selection is possible only up to 9 channels.
3. Click if you wish to deselect one of the channels and to deselect all the selected channels.
4. Click OK to confirm.
Selection in Cumulative Frequency Opens a timeplot for the harmonics selected out of the cumulative frequency diagram. To select a cumulative frequency:
1. Open the measurement data file and a cumulative frequency presentation. 2. Select the columns of the harmonics you wish to have in the timeplot. 3. Click the Timeplot button. 4. The timeplot with the selected harmonics is shown.
Timeplot The following three tables show the relation between the parameters and their course versus time in detail for all measurement parameters.

PQ Log Users Manual
36
Table 2. Available Parameters for Version P
Voltage Current Active
power P Apparent power S
Others
V. average I average Active power average
Apparent power average
PF
V min I max P min Apparent power min
PF total
V min act I max act P max S max tan
V Max I act at V max |P| average S total average tan total
V max act I act at V min |P| min Apparent power total min
Energy
V act at Imax I h1 (A) |P| max Apparent power total max
Energy total
V h1 thd I average P total average
thd.V.average thd I max Active power total min
thd.V.max Active power total max
Flicker Pst |P total| average
Flicker Plt |P total| min
|P total| max
Table 3. Available Parameters for Version A -Voltage, Current
Voltage Current Interharmonics Voltage/Current
Others
Average I average 200 ms max Unbalance
V Min I max 200 ms min Frequency
V min act I max act 3 s max
V max I peak mean
V max act CF I
V act at Imax I act at Vmax
V delta rms I act at Vmin
Flicker Pst thd I average
Of interharmonics defined in the job
Flicker Plt Harmonics I h1 – Ih50
THD V average thd I (A)
THD V max

PC Software for 1740 Series PQ Log Feature Reference
37
V h1 (V)
Harmonics V h1–V h50
Note The phase-phase voltages V delta rms is measured as:
• V delta rms L1 or A: between L1 or A and L2 or B • V delta rms L2 or B: between L2 or B and L3 or C • V delta rms L3 or C: between L3 or C and L1 or A
Table 4. Available Parameters for Version A - Power, Energy
Active Power P Apparent Power S Distorting Power D Others
Active power average
S.average Distortion power average
COS PHI
P min Apparent power min D max COS PHI tot
P max S max Distortion power total average
PF
P h1 S total average D total max PF total
P h1 total Apparent power total min
tan
|P| average Apparent power total max
tan total
|P| min Energy
|P| max Energy total
P total average
Active power total min
Active power total max
||P total| average
|P total| min
|P total| max
The parameters are available for each specific phase (L1 or A, L2 or B, L3 or C) and also for neutral N if applicable, except the total parameters which are for the whole 3-phase supply system. For details about symbols and abbreviations refer to Appendix at the end of the manual. The scaling of the individual curves can be set. There are 3 scaling options as follows:
• According to measurement range: Scales according to the measurement range of each individual measured variable.

PQ Log Users Manual
38
• According to the extreme value: All channels are scaled according to the minimum and maximum values. They are always visible in the diagram (the maximum value is scaled to the middle of the diagram).
Note Each individual measurement row can have its own scaling. The scaling can look unfamiliar and the evaluation complex especially when indicating the voltage’s minimum, maximum, and mean values. So grouping of similar parameters to use identical scales is recommended. • Manual: Enter the 0 %- and the 100 %-scaling value for each measurement row.
The actual minimum and maximum values of each measurement row are given. Also select the channels to be used for labeling the value-axes.
Grouped If this checkbox is selected, related measurement rows, example, voltage (1), current (2), and flicker (3), are scaled in the same way. Click OK to view the timeplot in the desired format. The advantages are obvious:
• Manual entry of the manual scaling values is only required once, which substantially facilitates the scaling process.
• Reading errors due to different scales are prevented. A channel selection can be called up from every timeplot by clicking the icon in the symbol bar of the diagram.
Note Check the different options using the demo measurements, or one of your own measurements. This will give you a summary of the different options of the level-time diagram analysis.
The Symbol Bar of the Timeplot The individual icons shown in the left column are accompanied by their respective menu options, as well as the descriptions.

PC Software for 1740 Series PQ Log Feature Reference
39
Toolbar Scaling
Measurement period The entire time-axis is shown.
28-days 28 days are shown.
7-days 7 days are shown.
1-day 1 day is shown.
To the beginning Goes to the beginning of the measurement.
Previous time segment Moves a time segment backwards.
Next time segment Moves a time segment forwards.
To Measurement end Goes to the end of the measurement.
Enlarge The scaling of time segments is decreased by one level.
Reduce The scaling of time segments is increased by one step.
X-axis scaling Select the time segment, and the start time of the measurement segment.
Zoom undo Restores the last enlargement after using the zoom function.
Scaling left Activate this icon and click on the leg-end of the measured variable that is to be used as scaling factor.
Scaling right Activate this icon and click on the leg-end of the measured variable that is to be used as scaling factor.
Scale Y-axis Calls up the scaling dialog. This is where you can select which labels are used for the right and left sides of the graph.
Show/hide limit value data Calls up the limit value dialog.

PQ Log Users Manual
40
Channel selection Calls up the channel selection dialog for this diagram.
Application-oriented channel selection data Calls up the application-oriented channel selection dialog for this diagram.
Measurement value list Shows the measurement value list with the channels selected in the level-time diagram.
Display energy (measurement function P only) Integrated over visible time interval in actual window. Positive and negative values are integrated separately: negative value/positive value.
Zoom To zoom an image:
• Draw a rectangle within the diagram using the left mouse button. • Release the left mouse key. The zoom option is executed.
Multiple zooming actions are possible. There is also an undo function. After zooming, you will always get a reasonable time-axis zoning, therefore there are no interrupted intervals.
Note To move a curve to the foreground, press and hold the Shift key. Click on the legend of a curve, the diagram is redrawn, whereby the selected curve is drawn last, i.e., it is not obstructed by another curve.
Timeplot: Data Menu There are two options for a new selection of measurement rows for the diagram:
1. Manual channel selection to change the selected channel. 2. Application oriented selection for channel selection according to measuring
tasks.
Show limit value Shows the limit values as dashed lines in the diagram. The limit value of a measured value can be displayed. Exceedings are represented as shaded segments.
Measurement Value List Shows the measurement value list with the channels selected in the Timeplot. Click the appropriate icon. All measurement values with date/time are displayed in a table format. The start point in the table matches the start point in the current timeplot (the first value is available at the end of the first interval).

PC Software for 1740 Series PQ Log Feature Reference
41
Print Click this button to print the selected measurement period using the default settings, or with the desired start time and period setting. Click S, to view details such as the interval information, including number of intervals, voltage (V) and current (I) overflow, as well as power supply failure (N). (G) signifies a valid measurement interval. (C), a clamp error, signifies the type of the current sensor changed during a measurement.
Note Values that are out of the measurement range are marked with the symbol ‘>’ on the left side of the numeric value.
Correlations of Voltages and Currents The voltage and current values can be used to get information about sources of disturbances in the power network. The relation between the extreme voltage values (Vmax, Vmin) and the actual phase currents can be seen. On the other hand, the voltage at the time of the maximum current is recorded simultaneously. Within each measuring interval (example 10 min), the extreme values of the mains voltage (Vmin act, Vmax act) based on 10 ms rms values are recorded. Exactly at the time of the occurrence of these extreme voltage values (Vmax act, Vmin act), the phase currents (Iact at Vmax, Iact at Vmin) are stored. On the other hand, at the time of the maximum current (Imax act) the actual pending voltage (Vact at Imax) is stored. All of these parameters can be evaluated graphically in the timeplot or numerically in the measurement value tables. Export with all other interval values is possible.
Note The extreme values (Imax act, Vmax act, Vmin act) are always based on 10 ms rms values, independent of the averaging time preset in the job 1/2-cycle up to 5 s).
Events The UNIPEDE DISDIP table is used for the classification of voltage dips. The events are sorted by their duration and deviation from the nominal value, and their quantities are listed in the corresponding fields. An extended UNIPEDE DISDIP table can be found in the corresponding analysis in PQ Log. In addition, voltage interruptions and surges are also displayed. The part of DISDIP table defined by UNIPEDE is marked with a frame.

PQ Log Users Manual
42
egd015h.bmp
Figure 24. UNIPEDE DISDIP Table
L1, L2, L3 Click this button to view the number of events of the respective phases.
Lx Click this button to view the events of all the phases.
Note If there is a power failure on all three phases, three single events for each phase are recorded. The response time for events is always 10 ms, which cannot be modified. There are two extra lines which sum up short and long interruptions (<3 min, ≥3 min).
Events - Measurement Value List Click the List icon to create a detailed list of all events. Details such as the time, duration, and minimum or maximum voltage during an event are displayed. If there is no voltage value given in the table, the event is classified as an interruption (threshold is defined in limit value file example, 1 % or 10 %).
• The buttons L1, L2, and L3 show only the number of events of the respective phase
• The button Lx shows the events on all phases • The button E+i shows events and interruptions • The button E shows only the events • The buttons ist / ilt show only the short (ist) or long (ilt) interruptions
Table Summary Displays the values represented in the Graphical Summary analysis in table form. In this table, the numerical values for all parameters represented in the graphical summary can be seen (1st column). Also displayed are the limit value (3rd column), the maximum value (4th column) and the 95 %-value (5th column).

PC Software for 1740 Series PQ Log Feature Reference
43
Voltage Variations The column Maximum value displays the maximum and minimum deviation in percentage in relation to the nominal voltage. In the 95 %-value column, the upper and lower limits indicate that 95% of all measurement values are between the positive and the negative values.
Note The absolute value of the voltage deviation is used to calculate the 95 % value. However, the information about the sign is lost. Therefore, there is only one 95 %-value. With symmetrical limit values (example, ± 10 %), the 95 %-value is given under Maximum, if the maximum interval value is not below the 95 %-value; otherwise, the maximum interval value is given. And, the 95 %-value is given under Minimum, if the minimum is not above the 95 %-value; otherwise, the minimum interval value is given. With unsymmetrical limit values (example, +6 % / - 10 %), the individual measurement values are scaled according to the limit values, and the 95 %-value is recalculated based on the scaled values. This takes into account that, example, 103 % Vn have a greater impact than 97 % Vn, if the limit value is +6 % / -10 % The number of interruptions per phase, number per phase is given, although there is no 95 %-value given.
Events (Voltage Dips and Swells) Details such as the number per phase are displayed. There is no 95 %-value given.
Harmonics In this field, amplitude of the harmonic, interharmonic, or thd which has the highest 95 %-value, that is closest to the limit value, or exceeds it the most, is given for each phase. If the most critical result is the same for all three phases, only one column is displayed; otherwise, two or three are displayed. Only those harmonics/interharmonics, or thd can be analyzed that have a defined limit value, and that have actually been measured. The EN 50160 only defines limit values up to the 25th harmonic. Use the cumulative frequency representation for more detailed examination. Select a limit value file with limit values for all harmonics, for example 50160_61000-2-2.gwd.
Flicker The maximum values and the 95 %-values are given for each phase.
Unbalance The maximum value and the 95 %-value are given.
Signaling Voltages The signaling voltage of each phase is given that has the most critical 95 %-value. If the most critical signaling voltage is the same for all three phases, only one column is displayed; otherwise, two or three are displayed.

PQ Log Users Manual
44
Only those signaling voltages that have a defined limit value in the actual limit value level file can be analyzed.
Frequency The maximum value column shows the maximum and minimum deviation in percent as related to the base frequency. To calculate the 95 %-value the absolute value of the frequency deviation is used. The information about the mathematical sign is lost. So there is only one 95 %-value. With symmetrically limited values (example, ±1 %), the maximum indicates the 95 %-value with a positive sign, and the minimum indicates the same 95 %-value with a negative sign With respect to the maximum value, the maximum and minimum is given in percent as related to the frequency.
Statistical Values (A Only) Shows the table summary of the measurement analysis. A presentation of the statistical analysis of the most important measured values is displayed. Columns #1 to #3 contain the measurement parameter, the unit and the limit values defined in the job or in limit value file. Column #4 shows the percentage of the measured values which are within the limits and the minimum and the maximum values which were detected during the whole measuring period. Column #5 gives the deviation between limit value and actual values.
Most Critical Values (A Only) This screen displays the most critical values of the selected measurement parameters in table form. In the Most Critical Values screen, the time of the five most critical values (those which come closest to the limit value) is given in addition to the numerical values. Parameters such as voltage variations, interruptions, events, harmonics #3, #5, #7 and #9 thd V, flicker, frequency, and unbalance are checked because they are important for practical power quality measurements.
All Exceedings (A Only) Displays all exceedings from the standard of a measurement in table form.
1. Select Analysis>All exceedings. 2. Select the required parameters (for available parameters refer to the table in the
”Timeplot – Channel Selection options” section). All measured values are represented in a table form with time and value. The following display shows how you can select any parameter you want to view in this analysis.

PC Software for 1740 Series PQ Log Feature Reference
45
egd015i.bmp
Figure 25. Selecting Parameters
Settings This menu is mainly used to set up general settings such as language of user interface, communication parameters, selection of files which contain the limits for evaluation, or files for the AOA, the application oriented analysis function.
Settings- General This function is used to:
1. Select the limit value file and file for Application Oriented Analysis. 2. Enter a header for the printouts. 3. All settings are saved and are active when the PQ Log is switched on again. 4. Set serial port (COM1) and Baud rate. The “General” screen is shown next:

PQ Log Users Manual
46
egd015j.bmp
Figure 26. General Settings Menu
Title on Print Enter the title text with maximum of 50 characters. This text is displayed on every printout.
Limit Value Level File for Analysis Select the file which contains the limit values for the analysis of the Logger measurements. If you change the limit value file while a measurement is open, the measurement will be analyzed with the new limit value file after exiting the screen. Select one of the prepared files. For example, ”EN 50160-50 Hz.gwd” and ”EN 50160-60 Hz.gwd” files are preset for the limits defined in EN 50160 and the limits for harmonics up to the 25th order.

PC Software for 1740 Series PQ Log Feature Reference
47
Note If one of the files is selected, the presentation of current harmonics bars is suppressed because EN 50160 does not deal with current harmonics. To see graphs for the current harmonics, save the limit value file under another specific name. Filename 50160_61000-2-2.gwd provides harmonics limits up to the 50th order according to IEC 61000-2-2. Default GWD60Hz.gwd is for applications in 60 Hz systems.
Application Oriented Analysis File Select a user defined application oriented analysis file, which can be modified according to your experience and knowledge.
Serial Port Set COM port (COM1.9) and Baud rate. The Logger automatically recognizes the Baud rate. The standard Baud rate is 115200 Baud. If there are problems with data download, select a lower Baud rate and close other applications (example, virus scanners).
Number of Harmonics for THD Calculation This option is used to select whether 40 harmonics (as per EN 50160) or 50 harmonics are taken into account for the calculation of voltage and current thd.
Reference Value for Harmonics Presentations Define the reference for the presentation of voltage and current harmonics. The settings are global and are applied to the Timeplot and cumulative summary of voltage and current harmonics.
Limit Value Level File This screen enables you to load and modify a limit value file. We can define specific limit value files in addition to the default limit value file. EN 50160-50 Hz.gwd and EN 50160-60 Hz.gwd are according to standard EN 50160. This modified limit value file can be stored. Select Software Settings>General. The Limit Value Level File appears. The Limit value file selected in this screen serves as a limit value table for the analysis of the measurement data files.
Values within Tolerance Enter the modified limit value for the occurrence probability. According to the EN 50160 standard, this statistical limit value is 95 %. If you change this value, all limit values will be in relation to the new value. The new value will be updated in the entire screen.
Slow Voltage Variations Positive tolerance, 95 % of the time: Indicates the upper limit value of Vn, which, when exceeded, is registered as a slow voltage variation. The % Vn is entered. The limit value is calculated as Vn + x % Vn. In the standard case, this value is 230 V + 10 %, i.e. 253 V. Negative tolerance, 95 % of the time:

PQ Log Users Manual
48
Indicates the Vn lower limit value, which, when exceeded, is registered as a slow voltage variation. The % Vn is entered. The limit value is calculated as Vn - x % Vn. According to the EN 50160 standard, this limit value is 230 V – 10 %, i.e. 207 V.
Note A voltage variation occurs when the measured mean value (according to the EN 50160 standard, the 10 minute mean value) is above or below the limit value. The standard is met if 95 % of all measured values are between the positive and the negative 95 % limit value and 100 % of all measured values are within the 100 % limit value tolerance band.
Note Short voltage surges or dips are recorded as events. The limit values for events can only be defined in job processing.
Line Frequency Fundamental Frequency This value cannot be changed. For 60 Hz versions of Logger, select an appropriate limit value file. Positive tolerance, 99.5 % of the measuring periods Indicates the upper limit value, which, when exceeded, is registered as an exceeding of the mains frequency. The % fn is entered. The limit value is calculated as fn + x % fn. In the standard case, this limit value is 50 Hz + 1 %, i.e. 50.5 Hz. Negative tolerance, 99.5% of the measuring period This value is similar to the positive tolerance. Limit Value is 49 Hz.
Note A frequency variation of the voltage occurs if the measured mean value (according to the EN 50160 standard, the 10 minute mean value) is above or below the limit value. The standard is met if 95 % of all measured values are between the positive and the negative limit values.
Positive tolerance, 100 % of the measuring period Indicates the upper limit value, which, when exceeded, is registered as an exceeding of the mains frequency. The % fn is entered. The limit value is calculated as fn + x % fn. In the standard case, this limit value is 50 Hz + 4 %, i.e. 52 Hz. Negative tolerance, 100 % of the time This value is analogous to the positive tolerance. According to the standard, the limit value is 47 Hz. (- 6 % fn).
Note If the values under normal operating conditions are above or below these values, it is considered to be a violation of the standard. All values must fulfill this requirement (100 %).
Flicker Indicates the limit value for permissible flicker level Plt.

PC Software for 1740 Series PQ Log Feature Reference
49
Note An exceeding occurs when the mean measured value Plt (according to the EN 50160 standards, the mean value Plt is calculated over twelve 10 minute mean values Pst) is above or below the limit value. The standard is met if 95 % of all measured values are below the limit value.
Voltage Unbalance This option indicates the limit value for permissible voltage unbalance in three phase systems.
Note An exceeding occurs if the measured mean value (according to the EN-50160 standard, the 10 minute mean value) is above the limit value. The standard is met if 95 % of all measured values are below the limit value.
Number of Allowed Events Determines the permissible number of events. The standard does not prescribe a value. The default value is 100 events during one week.
Interruption Limit Allows you to define the threshold for interruptions in % of Vn. A dip below this value will be considered an interruption.
Interharmonics Opens the Limit value level file - Interharmonics screen. It indicates the limit values for interharmonics.
Voltage Harmonics Opens the Limit value level file - Voltage Harmonics screen. It indicates the limit values for harmonics and the thd.
Current Harmonics This function is similar to voltage harmonics. This button opens the “Limit value level file – Current Harmonics” screen. Limit values for individual current harmonics and the thd can be defined in this screen.
Tip for Central European Distribution Networks A very important task for utilities is to assess the additional network distortion produced by new consumers which are to be connected to the network. There are clearly defined emission levels for each single current harmonic to further ensure safe and correct operation of all consumers in the network without any failures. There is a recommendation issued by experts of the Austrian E-CONTROL, the Austrian VEÖ, the Swiss VSE, the German VDN and the Czech CSRES, which prescribes a procedure for assessing the impact of new appliances to the distribution network which can be carried out easily with the Logger product range with the measuring function A. The Procedure in General: For a specific installation there are some parameters which provide us with the relevant basic information:

PQ Log Users Manual
50
• The rated current IA which is the nominal current the installation is designed for • The rated apparent power SA • The short circuit apparent power SkV at the PCC (Point of Common Coupling)
For each harmonic current In there is limit value which can be calculated from these basic parameters. The PQ Log software is able now to adapt these limits for specific installations where the measurements were taken. The mathematical formulae are: calculation of limit values for each current harmonic with orders of n = 2 up to n = 50.
AA
kVnn I
SSP
I ⋅⋅=1000
The parameter pn can be found in the following table: Harmonic order n 3 5 7 11 13 17 19 >19 pn 6 15 10 5 4 2 1.5 1
The limit value for the thd I in % is also calculated from the installation specific data:
%1001000
20 ∗⋅=A
kV
SS
THDI
These values are proposed in several documents such as the ”TOR D2” issued by the Austrian E-CONTROL as a recommendation for assessing the impact of distorting loads to the network. This document is the basis for a common recommendation D.A.CH.CZ 301/004 which will be mandatory in the following countries: Austria, Germany, Switzerland, and the Czech Republic. To use PQ Log:
1. Take the measurements and transfer the data to your PC from the PQ Log. 2. Open the Software Settings – Limit value level file screen. 3. In the dialog box for current harmonics, click the VSE/VEOE/VDN button. 4. Enter the values specific for the installation under test. 5. Click OK. The values are stored in the limit value file temporarily and can be
modified later for other measurements. 6. If required, the list field ”Parameter Pn” in the same dialog window presents the
actual multipliers Pn for each single harmonic of order n. 7. Each of them can be modified by selecting them and/or entering the order and the
new value Pn and pressing the Set button for future requirements. 8. The button Standard allows restoring of the initial values as recommended by
D.A.CH.CZ 301/004. 9. Click OK to confirm and to quit the dialog. 10. PQ Log calculates the limit values for each current harmonic accordingly.

PC Software for 1740 Series PQ Log Feature Reference
51
The calculated values appear in the left list field and can be transferred individually with the button or all at once with the button to the right list field. The values in the right list will be taken into account in further evaluations in PQ Log.
• Save the limit value level file under an appropriate name. The installation specific values IA, SkV, SA, and the new limit values are stored for future use.
Do the PQ Log evaluations as usual, PQ Log will take into account the adapted limits.
Signaling Voltages Opens the screen Limit value level file - Signaling Voltages which indicate the limit values for signaling voltages.
Open Opens a saved limit value level file with data extension *.gwd.
Save Saves the selected limit values under the same file name. The data extension of a limit value level file is *.gwd.
Note If you make changes to the standard limit value level file and then save this file, when you exit from the screen, a message prompting confirmation on whether you wish the open measurement to be analyzed with the updated limit value level file appears.
Save as Saves the selected limit values. The file name can be selected. The data extension of a limit value level file is *.gwd.
Print Prints the values of the current limit value level file.
Close Exits the screen without saving changes. A warning message appears, prompting confirmation on whether or not the modified values should be saved.
Limit Value Level File – Voltage Harmonics This screen is used to specify or modify the limit values for harmonics. These altered limit values can be saved. All limit values for harmonics which appear in the list on the right hand side (limit value list) are saved in the limit value level file.
THD Enter the limit value for the Total Harmonic Distortion (thd).
Harmonic Enter the order of the harmonic (2nd - 50th harmonic).

PQ Log Users Manual
52
Level Enter the limit value in % Vn for the selected harmonics.
Set Enter the required harmonic and the appropriate limit value. The frequency and the limit value are adapted in the limit value list by using Set. 50 limit values for harmonics can be defined.
Transfers the harmonics selected in the selection list with the appropriate limit value to the limit value list.
Transfers all harmonics listed in the selection list with the appropriate limit value to the limit value list.
Transfer the harmonics selected in the limit value list with the appropriate limit value to the selection list.
Transfers all harmonics listed in the limit value list with the appropriate limit value to the selection list.
Limit Value Level File – Interharmonics This screen allows you to specify or modify the limit values for interharmonics and save them to the hard disk. Only limit values for interharmonic frequencies, such as 105 Hz or 1010 Hz, can be specified. For harmonic frequencies up to 2000 Hz, the limit values defined for harmonics are valid. The frequency resolution is 5 Hz.
Set Enter the required interharmonic and the appropriate limit value. Enter the frequency and the limit value into the list by using the Set button. A maximum of 10 limit values for interharmonics can be defined.
Limit Value Level File - Signaling Voltages This screen allows you to specify or modify the limit values for signaling voltages. The modified limit values can be saved.
Frequency Enter the frequency of the signaling voltages (ripple control signals).
Level Enter the limit value in % Vn for the selected signaling voltage frequency.
Set Enter the required signaling voltage frequency and the appropriate limit value. The signaling voltage frequency and limit value are entered in the limit value list by using this button.

PC Software for 1740 Series PQ Log Feature Reference
53
Transfers the signaling voltages selected in the selection list with the appropriate limit value to the limit value list.
Transfers all signaling voltages listed in the selection list with the appropriate limit value to the limit value list.
Transfers the signaling voltages selected in the limit value list with the appropriate limit value to the selection list.
Transfers all signaling voltages listed in the limit value list with the appropriate limit value to the selection list.
Application Oriented Analysis File This screen enables you to load and modify a file for Application Oriented Analysis . This modified file can be stored. Select or create a new definition file with ”Select definition file…“ button for building up a specific analysis.
Fill with defaults This button enables you to have standard entries. It copies useful definitions to the actual file for all measuring functions (P or A). This option allows you to import useful applications from other files.
Select source Opens the existing definition files. There is a default file installed in the folder of PQ Log for each language. In the Filter section, set the desired measurement function to P and required phases (one, all, or mixed).
Show source Presents the actual contents of the source file. From the source file, useful application data can be transferred by dragging and dropping into the new definition file. A definition file as per user requirements can be built.
Application Group The entries in this field can be sorted by drag and drop.
Edit Enables you to modify the name you want to give the analysis.
Add and Delete Enables you to add or delete the application groups. The analysis system can learn from your experience and support future measurement tasks optimally.
Application Displays the contents of the actual application group. The Add button allows you to add new applications. Enter an appropriate name, a new limit value file, and specific text.

PQ Log Users Manual
54
Copy Copies the text to the clip-board for insertion into a measurement protocol.
Delete Enables you to delete an application if desired.
Edit Enables you to edit the text in the related fields.
Selected channels Displays the predefined channels for the Timeplot.
Edit Opens a special editor for precise setup of the analysis channel. We can add and delete specific channels and define analysis parameters, for example begin and end of scale, and rounding. For beginning and end of an axis, we can choose Nominal, Minimum, Maximum, Range begin, Range end, or Value. There is an additional offset to these values which will be added. The settings in the picture above will define a scale from 230 V-15 %=195.5 V up to 230 V+10 %=253 V for Vmean.
OK Saves all the settings. Select this file in menu Software Settings>Application Oriented Analysis. It will be automatically used for the next analysis.
Colors You can assign a freely definable color to each curve and column. Select Software Settings>Colors and double-click on the color to be changed. The Windows standard color selection dialog box will appear. You can select the colors for the bars used in the analyses regarding Cumulative Frequency, and Graphical Summary, and for the curves in the Timeplot.
Standard Resets the values to default settings.
Print Diagram without Background This function is available if the Graphical Summary screen is the active window. The Graphical Summary diagram is printed on a white background if this option is active.
Curve Width This function is available if a timeplot is the active window. You have three options regarding the curve width. You can select Software Settings>Curve width>thin, medium, or large.
Language Select from a list of available languages under Settings.

PC Software for 1740 Series PQ Log Feature Reference
55
Note Changing languages is not available if a measurement file is open.
Export This function is used to set up all settings required for automatic or manual data export. For data export to Windows applications, the parameters for the export must be defined once. The menu Software Settings>Export provides all necessary definitions. The default format is perfect for importing into MS EXCEL . Click OK to confirm.
Select up to 999 Channels for Exporting For available parameters refer to the table in ”Timeplot – Channel Selection Option” section. These settings are stored and will be used for all future exports. Select the menu File>Export. Interval or event data can be exported to an ASCII file which will have the name of the actual measurement data file with .ASC as extension. The file can easily be explored by a text editor or opened in MS EXCEL . Importing into MS EXCEL is very simple.
• Open the respective ASC-File with File>Open. • The import wizard will automatically format the imported data
Note PQ Log automatically exports interval and event data after the data transfer from the Logger to the PC using these settings.
Window Menu New Window Opens a new window. Cascade Cascades active windows. Tile windows Tiles active windows. Arrange icons Arranges the icons of minimized PQ Log windows. Window name Enables you to put the required analysis window in
the foreground.
PQ Log Users Manual
56
Appendix A
Abbreviations, Symbols
General Total For all three phases, A or L1, B or L2, C or L3 Min General: minimum value Max General: maximum value Mean Average value |xxx| Absolute value of a parameter, always positive A or L1, B or L2, C or L3
Phases A or L1, B or L2, C or L3
Voltage Parameters V Voltage Vn Nominal voltage V h1 Voltage, fundamental component V h1 – V h50 Voltage harmonics with order 2 - 50 V delta rms A or L1 Voltage RMS value between A or L1 and B or L2 V delta rms B or L2 Voltage rms value between B or L2 and C or L3 V delta rms C or L3 Voltage rms value between C or L3 and A or L1 Vmin Smallest voltage rms value in the measuring
interval based on the averaging time set in the job (1/2-cycle up to 5 s)
Vmax Highest voltage rms value in the measurement interval based on the averaging time set in the job (1/2-cycle up to 5 s)
Vact at Imax Voltage at the time Imax occurred Vmin act Minimum voltage based on 10 ms rms values Vmax act Maximum voltage based on 10 ms rms values Flicker Pst Flicker value short term Flicker Plt Flicker value long term THD V Total harmonic distortion, harmonic contents of
voltage
Current Parameters I Current I h1 Current, fundamental component I h1 – I h50 Current harmonics with order 2-50 Imax Highest current rms value in the measurement
interval based on the averaging time set in the job

PC Software for 1740 Series Appendix A
57
(1/2-cycle up to 5 s) Iact at Vmax Actual current at the time Vmax occurred Iact at Vmin Actual current at the time Vmin occurred Imax act Maximum current based on 10 ms rms values THD I Total harmonic distortion, harmonic contents of
current
Power Parameters P Active power P h1 Active power of fundamental Q Reactive power Q h1 Reactive power of fundamental S Apparent power D Distorting power COS PHI Power factor of fundamentals PF Power factor incl. harmonics CF Crest factor (peak value / rms value) TAN Tangent

PQ Log Users Manual
58

59
Index
—"— "50160_61000-2-2.gwd, 43
—1— 100 % limit value, 17
—5— 50160_61000-2-2.gwd, 16
—9— 95 %-value, 17
—A— Analysis
5 most critical values, 44 All Exceedings, 44 Cumulative frequency, 30 Statistical Values, 44 Table Summary, 42
Analysis Graphical Summary, 16 Analysis of the Measurement Data, 16 Analysis>Cumulative Frequency, 17 Analysis>Table Summary, 17 Application Oriented Analysis, 34 ASC, 24
—C— Close Exit, 25 Colors, 54 COM1.9, 47 Continuous Curve, 30 Correlations, 41 Cumulative Frequency, 17, 30, 33, 35, 54
—D— Default GWD60 Hz.gwd, 16
—E— EN50160, 16 EN50160 50 Hz.gwd, 30 En50160.gwd, 16 EN50160.gwd, 31 Events, 41, 43 Events Measurement Value List, 42 Export, 23 Export VSE Format, 24
—F— filter, 53 firmware status, 28 Flicker, 43 Frequency, 44 Frequency Measurement, 26
—G— Graphical Summary, 54 Grouped Scaling, 38
—H— hardware version, 28 Harmonics, 43, 49
—I— Interharmonics, 49, 52 Interruptions, 43
—L— Languages, 55 Level Time Symbol Bar, 38

PQ Log Users Manual
60
Limit value level file, 47, 53 Limit values, 47 List of Harmonics, 33 Live stripchart, 11 Logger Information, 27
—M— Main Symbol Bar, 19 Measurement data file, 9 Measurement Principle, 26 Measurement protocol, 23
—O— Online Data from Logger, 28
—P— Pegel-Zeit Diagram, 35 PERMLINK, 25 Print Diagram without Background, 54 Print Document, 23
—R— Read Previous Results, 25 Reading out the Measurement Data, 9 Reset, 26
—S— Scaling, 37 Serial Interface, 47 Settings Colors, 54 Settings Export, 55
Setup printer, 23 Show source, 53 Signaling Voltage, 43 Signaling Voltages, 51 Software Settings, 45 Standard limit value file, 45 Statistical measurement data, 24 Stripchart view, live, 11 Summenhaufigkeit, 31 Symbol Bar Cumulative Frequency, 22 Symbol Bar Events, 22 Symbol Bar for ONLINE Test, 20 Symbol Bar for Timeplot, 19 Symbol Bar Measurement Value List, 21
—T— Timeplot, 35
—U— Unbalance, 43
—V— Values within Tolerance, 47 Voltage Variations, 43 VSE -Export, 24
—Z— Zoom, 40