pqo update: performance measurement · 0 presentation to: care management subcommittee of the dch...
TRANSCRIPT

0
Presentation to: Care Management Subcommittee of the DCH Board
Presented by: Janice Carson, MD, Deputy Director
Performance, Quality and Outcomes Unit
Date: 9/12/13
PQO Update: Performance Measurement

1
Mission The Georgia Department of Community Health
We will provide Georgians with access to
affordable, quality health care through
effective planning, purchasing and oversight.
We are dedicated to A Healthy Georgia.

2
Bright Futures Periodicity Schedule
Services for Children

3

4
CY2010 CY2011 CY2012
Amerigroup CMO 60.1% 63.6% 63.0%
Peach State CMO 53.9% 50.5% 55.3%
WellCare CMO 59.1% 61.3% 66.6%
State Target 69.7%
HEDIS 50th Percentile 61.3%
0.0%
10.0%
20.0%
30.0%
40.0%
50.0%
60.0%
70.0%
80.0%
% w
ith
Six
or
Mo
re V
isit
s
Well-Child Visits in the First 15 Months of Life: Six or More Visits

5
CY2010 CY2011 CY2012
GA Families CMO 49.4% 58.7% 62.7%
Fee For Service 20.9% 27.5% 24.3%
HEDIS 50th Percentile 61.3%
0.0%
10.0%
20.0%
30.0%
40.0%
50.0%
60.0%
70.0%
% w
ith
Six
or
Mo
re V
isit
s
Well-Child Visits in the First 15 Months of Life: Six or More Visits

6
CY2010 CY2011 CY2012
Amerigroup CMO 70.2% 73.6% 68.2%
Peach State CMO 68.5% 67.4% 67.6%
WellCare CMO 64.7% 66.2% 68.5%
State Target 71.8%
HEDIS 50th Percentile 72.3%
60.0%
62.0%
64.0%
66.0%
68.0%
70.0%
72.0%
74.0%
76.0%
% o
f V
isit
s
Well-Child Visits in the Third, Fourth, Fifth, and Sixth Years of Life

7
CY2010 CY2011 CY2012
GA Families CMO 59.0% 68.1% 68.2%
Fee For Service 51.1% 54.6% 57.8%
HEDIS 50th Percentile 72.3%
0.0%
10.0%
20.0%
30.0%
40.0%
50.0%
60.0%
70.0%
80.0%
% o
f V
isit
s
Well-Child Visits in the Third, Fourth, Fifth, and Sixth Years of Life

8
CY2010 CY2011 CY2012
Amerigroup CMO 75.0% 80.0% 82.6%
Peach State CMO 77.0% 76.6% 76.7%
WellCare CMO 72.3% 81.0% 78.8%
State Target 82.0%
HEDIS 50th Percentile 71.0%
64.0%
66.0%
68.0%
70.0%
72.0%
74.0%
76.0%
78.0%
80.0%
82.0%
84.0%
% Im
mu
niz
ed
Childhood Immunization Status: Combo 3

9
CY2010 CY2011 CY2012
GA Families CMO 24.8% 79.5% 79.2%
Fee For Service 16.1% 47.0% 52.8%
HEDIS 50th Percentile 71.0%
0.0%
10.0%
20.0%
30.0%
40.0%
50.0%
60.0%
70.0%
80.0%
90.0%
% Im
mu
niz
ed
Childhood Immunization Status: Combo 3

10
CY2010 CY2011 CY2012
Amerigroup CMO 45.6% 43.9% 46.6%
Peach State CMO 38.2% 38.5% 44.0%
WellCare CMO 38.0% 41.4% 51.6%
State Target 46.8%
HEDIS 50th Percentile 46.1%
0.0%
10.0%
20.0%
30.0%
40.0%
50.0%
60.0%
% w
ith
On
e o
r M
ore
Vis
its
Adolescent Well-Care Visits
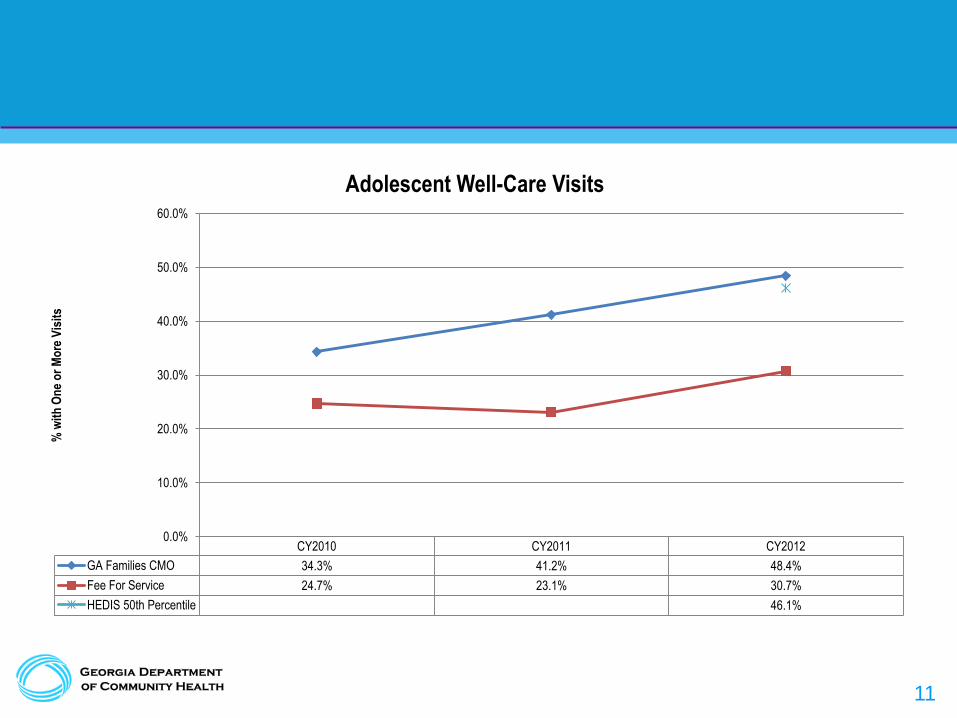
11
CY2010 CY2011 CY2012
GA Families CMO 34.3% 41.2% 48.4%
Fee For Service 24.7% 23.1% 30.7%
HEDIS 50th Percentile 46.1%
0.0%
10.0%
20.0%
30.0%
40.0%
50.0%
60.0%
% w
ith
On
e o
r M
ore
Vis
its
Adolescent Well-Care Visits

12
CY2010 CY2011 CY2012
Amerigroup CMO 61.7% 67.6% 71.4%
Peach State CMO 70.6% 70.8% 71.3%
WellCare CMO 70.1% 71.0%
State Target 65.9%
HEDIS 50th Percentile 49.8%
0.0%
10.0%
20.0%
30.0%
40.0%
50.0%
60.0%
70.0%
80.0%
% Im
mu
niz
ed
Adolescent Immunizations: Combo 1

13
CY2010 CY2011 CY2012
GA Families CMO 55.8% 69.7% 71.2%
Fee For Service 45.3% 56.0% 66.2%
HEDIS 50th Percentile 49.8%
0.0%
10.0%
20.0%
30.0%
40.0%
50.0%
60.0%
70.0%
80.0%
% Im
mu
niz
ed
Adolescent Immunizations: Combo 1
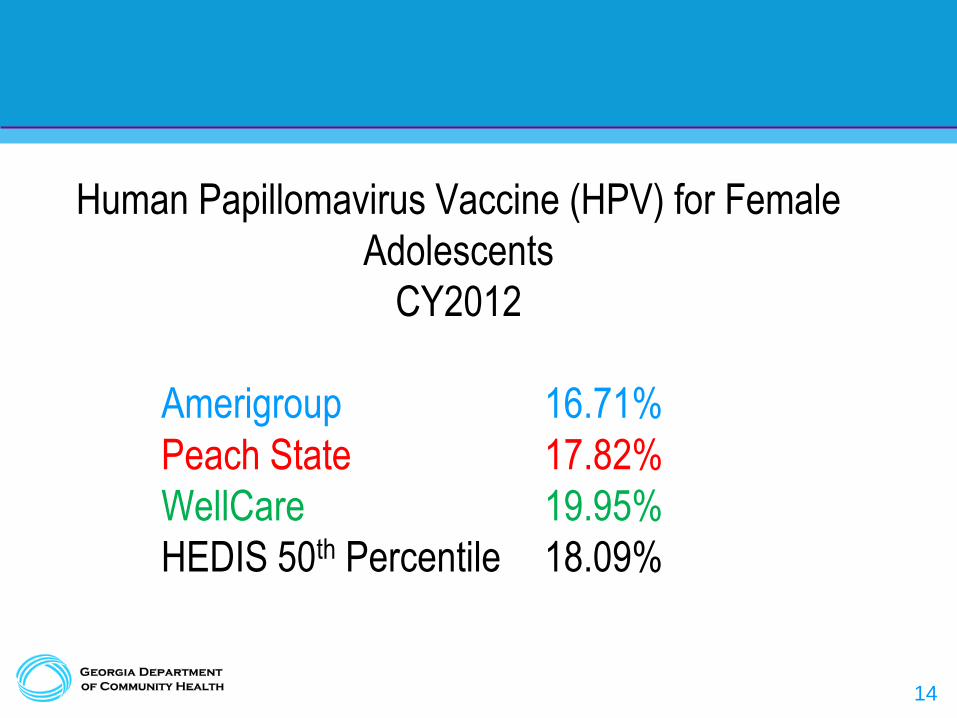
14
Human Papillomavirus Vaccine (HPV) for Female
Adolescents
CY2012
Amerigroup 16.71%
Peach State 17.82%
WellCare 19.95%
HEDIS 50th Percentile 18.09%

15
CY2010 CY2011 CY2012
Amerigroup CMO 28.5% 33.3% 40.7%
Peach State CMO 29.0% 22.7% 47.7%
WellCare CMO 30.4% 56.9% 38.7%
State Target 45.2%
HEDIS 50th Percentile 37.5%
0.0%
10.0%
20.0%
30.0%
40.0%
50.0%
60.0%
% w
ith
BM
I M
easu
rem
ent
Weight Assessment for Children and Adolescents: BMI Percentile

16
CY2010 CY2011 CY2012
GA Families CMO 1.0% 42.5% 41.5%
Fee For Service 1.0% 22.9% 27.3%
HEDIS 50th Percentile 37.5%
0.0%
5.0%
10.0%
15.0%
20.0%
25.0%
30.0%
35.0%
40.0%
45.0%
% w
ith
BM
I M
easu
rem
ent
Weight Assessment for Children and Adolescents: BMI Percentile

17
CY2010 CY2011 CY2012
Amerigroup CMO 48.8% 58.3% 52.3%
Peach State CMO 45.5% 40.7% 56.0%
WellCare CMO 48.9% 50.4% 55.5%
State Target 57.7%
HEDIS 50th Percentile 51.1%
0.0%
10.0%
20.0%
30.0%
40.0%
50.0%
60.0%
70.0%
% w
ith
Nu
trit
ion
Co
un
selin
g
Counseling for Nutrition for Children and Adolescents

18
CY2010 CY2011 CY2012
GA Families CMO 0.5% 49.7% 54.9%
Fee For Service 1.4% 49.6% 37.5%
HEDIS 50th Percentile 51.1%
0.0%
10.0%
20.0%
30.0%
40.0%
50.0%
60.0%
% w
ith
Nu
trit
ion
Co
un
selin
g
Counseling for Nutrition for Children and Adolescents

19
CY2010 CY2011 CY2012
Amerigroup CMO 30.9% 44.9% 39.8%
Peach State CMO 32.0% 29.4% 47.7%
WellCare CMO 30.9% 37.0% 42.1%
State Target 45.5%
HEDIS 50th Percentile 40.6%
0.0%
10.0%
20.0%
30.0%
40.0%
50.0%
60.0%
% w
ith
Ph
ysic
al A
ctiv
ity
Co
un
selin
g
Counseling for Physical Activity for Children and Adolescents

20
CY2010 CY2011 CY2012
GA Families CMO 0.1% 36.8% 43.0%
Fee For Service 0.1% 31.9% 27.7%
HEDIS 50th Percentile 40.6%
0.0%
5.0%
10.0%
15.0%
20.0%
25.0%
30.0%
35.0%
40.0%
45.0%
50.0%
% w
ith
Ph
ysic
al A
ctiv
ity
Co
un
selin
g
Counseling for Physical Activity for Children and Adolescents

21
CY2010 CY2011 CY2012
GA Families CMO 78.6% 78.1% 82.8%
Fee For Service 77.2% 76.3% 79.3%
HEDIS 50th Percentile 87.5%
70.0%
72.0%
74.0%
76.0%
78.0%
80.0%
82.0%
84.0%
86.0%
88.0%
90.0%
% A
pp
rop
riat
e T
reat
men
t R
ecei
ved
Appropriate Treatment for Children with Upper Respiratory Infection

22
CY2010 CY2011 CY2012
Amerigroup CMO 45.6% 44.3% 42.3%
Peach State CMO 41.9% 43.7% 43.7%
WellCare CMO 41.3% 40.0% 39.4%
State Target 48.1%
HEDIS 50th Percentile 38.3%
0.0%
10.0%
20.0%
30.0%
40.0%
50.0%
60.0%
% w
ith
Fo
llow
up
Vis
it w
ith
in 3
0 D
ays
Followup Care for Children Prescribed ADHD Medication: Initiation Phase

23
CY2010 CY2011 CY2012
GA Families CMO 36.9% 36.3% 35.7%
Fee For Service 34.6% 33.4% 31.7%
HEDIS 50th Percentile 38.3%
0.0%
5.0%
10.0%
15.0%
20.0%
25.0%
30.0%
35.0%
40.0%
45.0%
% w
ith
Fo
llow
up
Vis
it w
ith
in 3
0 D
ays
Followup Care for Children Prescribed ADHD Medication: Initiation Phase

24
CY2010 CY2011 CY2012
Amerigroup CMO 58.4% 61.2% 58.2%
Peach State CMO 56.0% 57.4% 58.6%
WellCare CMO 52.1% 54.6% 53.1%
State Target 57.6%
HEDIS 50th Percentile 45.2%
0.0%
10.0%
20.0%
30.0%
40.0%
50.0%
60.0%
70.0%
% w
ith
Req
uir
ed F
ollo
wu
p V
isit
s
Followup Care for Children Prescribed ADHD Medication: Continuation and Maintenance Phase

25
CY2010 CY2011 CY2012
GA Families CMO 48.5% 49.9% 48.3%
Fee For Service 43.9% 41.7% 42.3%
HEDIS 50th Percentile 45.2%
36.0%
38.0%
40.0%
42.0%
44.0%
46.0%
48.0%
50.0%
52.0%
% w
ith
Req
uir
ed F
ollo
wu
p V
isit
s
Followup Care for Children Prescribed ADHD Medication: Continuation and Maintenance Phase

26
CY2010 CY2011 CY2012
Amerigroup CMO 69.1% 69.7% 69.9%
Peach State CMO 63.6% 67.5% 67.9%
WellCare CMO 67.5% 70.5% 71.5%
State Target 64.1%
HEDIS 50th Percentile 51.6%
0.0%
10.0%
20.0%
30.0%
40.0%
50.0%
60.0%
70.0%
80.0%
% w
ith
On
e o
r M
ore
Vis
its
Annual Dental Visit: Ages 2 to 21 Years

27
CY2010 CY2011 CY2012
GA Families CMO 67.2% 68.8% 69.8%
Fee For Service 54.0% 54.0% 54.5%
HEDIS 50th Percentile 51.6%
0.0%
10.0%
20.0%
30.0%
40.0%
50.0%
60.0%
70.0%
80.0%
% w
ith
On
e o
r M
ore
Vis
its
Annual Dental Visit: Ages 2 to 21 Years

28
CY2011 CY2012
Amerigroup CMO 49.5% 50.8%
Peach State CMO 45.9% 48.1%
WellCare CMO 51.7% 52.5%
State Target 80.0%
0.0%
10.0%
20.0%
30.0%
40.0%
50.0%
60.0%
70.0%
80.0%
90.0%
% R
ecei
vin
g S
ervi
ces
Total Eligibles Receiving Preventive Dental Treatment Services

29
Title or Chapter Slide
(use as needed; feel free to delete)
Services for Adults

30
CY2010 CY2011 CY2012
Amerigroup CMO 47.5% 52.8% 57.0%
Peach State CMO 52.6% 60.2% 59.6%
WellCare CMO 48.5% 48.9% 48.7%
State Target 55.7%
HEDIS 50th Percentile 57.2%
0.0%
10.0%
20.0%
30.0%
40.0%
50.0%
60.0%
70.0%
% S
cree
ned
Chlamydia Screening in Women: Age 16 to 24 Years

31
CY2010 CY2011 CY2012
GA Families CMO 46.3% 47.1% 53.5%
Fee For Service 39.8% 41.2% 41.3%
HEDIS 50th Percentile 57.2%
0.0%
10.0%
20.0%
30.0%
40.0%
50.0%
60.0%
70.0%
% S
cree
ned
Chlamydia Screening in Women: Age 16 to 24 Years

32
CY2010 CY2011 CY2012
Amerigroup CMO 53.0% 55.9% 59.2%
Peach State CMO 51.4% 52.9% 56.5%
WellCare CMO 53.4% 56.4% 55.8%
State Target 59.6%
HEDIS 50th Percentile 52.4%
46.0%
48.0%
50.0%
52.0%
54.0%
56.0%
58.0%
60.0%
62.0%
% S
cree
ned
Breast Cancer Screening: Age 40 to 69 Years

33
CY2010 CY2011 CY2012
GA Families CMO 53.0% 54.5% 56.5%
Fee For Service 41.6% 37.0% 32.0%
HEDIS 50th Percentile 52.4%
0.0%
10.0%
20.0%
30.0%
40.0%
50.0%
60.0%
% S
cree
ned
Breast Cancer Screening: Age 40 to 69 Years

34
Title or Chapter Slide
(use as needed; feel free to delete)
Pregnancy and Birth Outcomes

35
CY2010 CY2011 CY2012
Amerigroup CMO 90.5% 90.5% 84.7%
Peach State CMO 83.0% 85.9% 86.7%
WellCare CMO 84.7% 80.5% 84.2%
State Target 90.0%
HEDIS 50th Percentile 86.0%
74.0%
76.0%
78.0%
80.0%
82.0%
84.0%
86.0%
88.0%
90.0%
92.0%
% w
ith
Vis
it w
ith
in G
uid
elin
e
Timeliness of Prenatal Care

36
CY2010 CY2011 CY2012
GA Families CMO 36.0% 84.5% 85.0%
Fee For Service 49.0% 63.7% 64.7%
HEDIS 50th Percentile 86.0%
0.0%
10.0%
20.0%
30.0%
40.0%
50.0%
60.0%
70.0%
80.0%
90.0%
100.0%
% w
ith
Vis
it w
ith
in G
uid
elin
e
Timeliness of Prenatal Care

37
CY2010 CY2011 CY2012
Amerigroup CMO 72.6% 72.3% 66.4%
Peach State CMO 64.4% 70.5% 65.0%
WellCare CMO 63.0% 53.0% 62.5%
State Target 73.7%
HEDIS 50th Percentile 64.4%
0.0%
10.0%
20.0%
30.0%
40.0%
50.0%
60.0%
70.0%
80.0%
% o
f V
isit
s
Frequency of Ongoing Prenatal Care: More Than 81% of Expected Visits

38
CY2010 CY2011 CY2012
GA Families CMO 6.0% 62.6% 62.9%
Fee For Service 4.9% 32.4% 38.2%
HEDIS 50th Percentile 64.4%
0.0%
10.0%
20.0%
30.0%
40.0%
50.0%
60.0%
70.0%
% o
f V
isit
s
Frequency of Ongoing Prenatal Care: More Than 81% of Expected Visits

39
CY2010 CY2011 CY2012
Amerigroup CMO 65.7% 65.7% 59.5%
Peach State CMO 60.7% 61.7% 71.6%
WellCare CMO 63.3% 63.0% 62.5%
State Target 70.3%
HEDIS 50th Percentile 64.6%
0.0%
10.0%
20.0%
30.0%
40.0%
50.0%
60.0%
70.0%
80.0%
% w
ith
Vis
it w
ith
in G
uid
elin
e
Postpartum Care

40
CY2010 CY2011 CY2012
GA Families CMO 40.3% 63.3% 64.3%
Fee For Service 27.5% 45.5% 48.2%
HEDIS 50th Percentile 64.6%
0.0%
10.0%
20.0%
30.0%
40.0%
50.0%
60.0%
70.0%
% w
ith
Vis
it w
ith
in G
uid
elin
e
Postpartum Care

41
CY2010 CY2011 CY2012
Amerigroup CMO 7.81% 7.00% 8.45%
Peach State CMO 7.45% 7.00% 8.53%
WellCare CMO 7.53% 7.70% 8.02%
AHRQ Benchmark 8.15%
0.00%
1.00%
2.00%
3.00%
4.00%
5.00%
6.00%
7.00%
8.00%
9.00%
Nu
mb
er o
f In
fan
ts p
er 1
00 B
irth
s
Note: A Lower Rate is Better
Rate of Infants with Low Birth Weight

42
CY2010 CY2011 CY2012
GA Families CMO 8.1% 8.4% 8.59%
Fee For Service 7.7% 8.8% 8.52%
AHRQ Benchmark 8.15%
7.0%
7.2%
7.4%
7.6%
7.8%
8.0%
8.2%
8.4%
8.6%
8.8%
9.0%
% o
f In
fan
ts p
er 1
00 B
irth
s
Increasing GA Families LBW rate despite higher prenatal care visit rates than FFS and earlier entry into prenatal care compared with FFS
Rate of Infants with Low Birth Weight

43
CY2010 CY2011 CY2012
Amerigroup CMO 32.89% 33.60% 29.76%
Peach State CMO 31.42% 31.90% 30.01%
WellCare CMO 31.11% 31.20% 29.10%
AHRQ Benchmark 31.0%
26.00%
27.00%
28.00%
29.00%
30.00%
31.00%
32.00%
33.00%
34.00%
Nu
mb
er o
f C
esar
ean
Del
iver
ies
per
100
Del
iver
ies
Note: A Lower Rate is Better
Cesarean Delivery Rate

44
CY2011 CY2012
GA Families CMO 30.4% 31.25%
Fee For Service 26.0% 27.48%
AHRQ Benchmark 31.00%
0.0%
5.0%
10.0%
15.0%
20.0%
25.0%
30.0%
35.0%
% o
f C
esar
ean
Del
iver
ies
per
100
Del
iver
ies
Expect to see improvements in the C-sec rate following implementation of our EED Policy October 1, 2013
Cesarean Delivery Rate

45
Title or Chapter Slide
(use as needed; feel free to delete)
Asthma

46
CY2010 CY2011 CY2012
GA Families CMO 90.5% 90.0% 88.1%
Fee For Service 90.4% 82.9% 79.7%
HEDIS 50th Percentile 88.9%
74.0%
76.0%
78.0%
80.0%
82.0%
84.0%
86.0%
88.0%
90.0%
92.0%
% A
pp
rop
riat
ely
Pre
scri
bed
Use of Appropriate Medications for People with Asthma: Age 5 to 64 Years

47
CY2011 CY2012
GA Families CMO 11.3% 13.5%
Fee For Service 13.9% 17.0%
0.0%
2.0%
4.0%
6.0%
8.0%
10.0%
12.0%
14.0%
16.0%
18.0%
% w
ith
On
e o
r M
ore
ER
Vis
it
Annual Percentage of Asthma Patients with One or More Asthma-Related ER Visit
Note reductions in appropriate medication use with increases in ER use

48
Title or Chapter Slide
(use as needed; feel free to delete)
Diabetes

49
CY2010 CY2011 CY2012
Amerigroup CMO 81.9% 79.8% 79.4%
Peach State CMO 72.6% 77.4% 79.8%
WellCare CMO 82.3% 80.3% 78.5%
State Target 86.4%
HEDIS 50th Percentile 82.2%
65.0%
70.0%
75.0%
80.0%
85.0%
90.0%
% T
este
d
Comprehensive Diabetes Care (Ages 18-75): HbA1c Testing

50
CY2010 CY2011 CY2012
GA Families CMO 74.4% 79.4% 79.2%
Fee For Service 45.9% 63.7% 60.2%
HEDIS 50th Percentile 82.2%
0.0%
10.0%
20.0%
30.0%
40.0%
50.0%
60.0%
70.0%
80.0%
90.0%
% T
este
d
Comprehensive Diabetes Care (Ages 18-75): HbA1c Testing

51
CY2010 CY2011 CY2012
GA Families CMO 99.9% 52.3% 54.3%
Fee For Service 99.0% 62.8% 67.9%
HEDIS 50th Percentile 43.2%
0.0%
20.0%
40.0%
60.0%
80.0%
100.0%
120.0%
% w
ith
Po
or
Co
ntr
ol
Note: Results in CY2010 were administrative while results in CY2011 and CY2012 were calculated with medical record reviews. A lower rate is better.
Comprehensive Diabetes Care (Ages 18-75): HbA1c Poor Control (>9.0%)
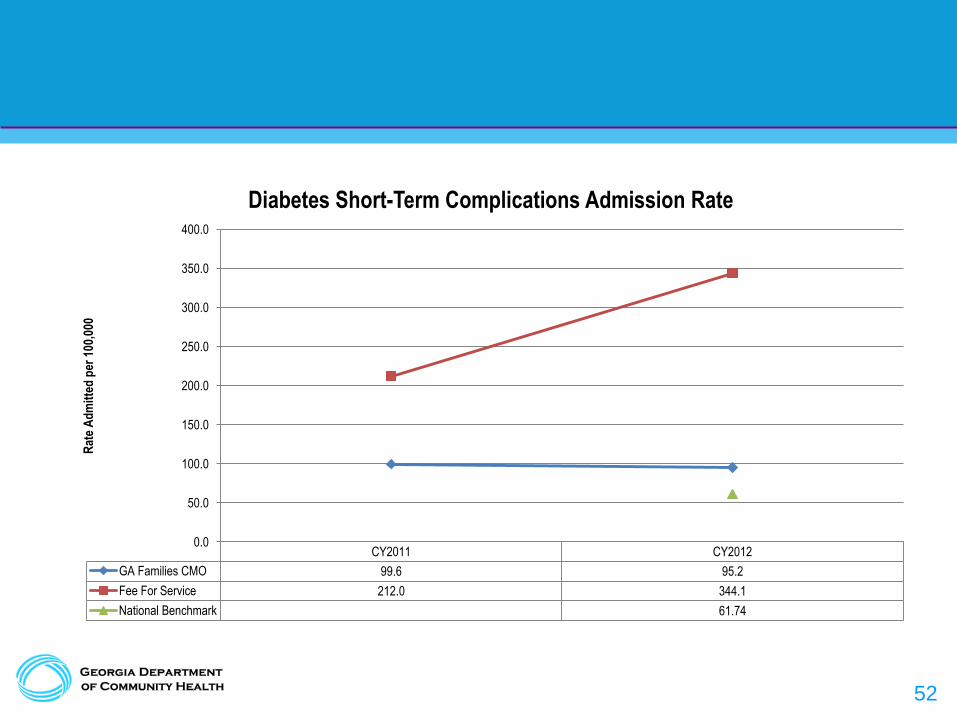
52
CY2011 CY2012
GA Families CMO 99.6 95.2
Fee For Service 212.0 344.1
National Benchmark 61.74
0.0
50.0
100.0
150.0
200.0
250.0
300.0
350.0
400.0
Rat
e A
dm
itte
d p
er 1
00,0
00
Diabetes Short-Term Complications Admission Rate

53
Title or Chapter Slide
(use as needed; feel free to delete)
Cardiovascular Conditions

54
Controlling High Blood Pressure (BP < 140/90)
CY2012
Amerigroup 38.72%
Peach State 49.78%
WellCare 49.64%
HEDIS 50th Percentile 56.40%
Congestive Heart Failure Admission Rate (per 100,000)
CY2012
Amerigroup 29.64
Peach State 25.53
WellCare 41.04
National Benchmark 399.95

55
CY2011 CY2012
GA Families CMO 29.8 26.4
Fee For Service 1569.6 5268.1
National Benchmark 399.95
0.0
1000.0
2000.0
3000.0
4000.0
5000.0
6000.0
Rat
e A
dm
itte
d p
er 1
00,0
00
Congestive Heart Failure Admission Rate

56
Title or Chapter Slide
(use as needed; feel free to delete)
Chronic Obstructive Pulmonary Disease

57
COPD Admission Rate per 100,000
CY2012
Amerigroup 76.56
Peach State 18.87
WellCare 19.24
National Benchmark 578.39

58
CY2011 CY2012
GA Families CMO 239.9 75.5
Fee For Service 2803.0 4884.1
National Benchmark 578.39
0.0
1000.0
2000.0
3000.0
4000.0
5000.0
6000.0
Rat
e A
dm
itte
d p
er 1
00,0
00
COPD Admission Rate

59
Title or Chapter Slide
(use as needed; feel free to delete)
Behavioral Health

60
CY2011 CY2012
GA Families CMO 48.7% 53.4%
Fee For Service 56.4% 60.3%
HEDIS 50th Percentile 50.1%
0.0%
10.0%
20.0%
30.0%
40.0%
50.0%
60.0%
70.0%
% T
reat
ed
Antidepressant Medication Management: Effective Acute Phase Treatment

61
CY2011 CY2012
GA Families CMO 30.0% 35.7%
Fee For Service 42.1% 47.2%
HEDIS 50th Percentile 32.7%
0.0%
5.0%
10.0%
15.0%
20.0%
25.0%
30.0%
35.0%
40.0%
45.0%
50.0%
% T
reat
ed
Antidepressant Medication Management: Effective Continuation Phase Treatment

62
CY2010 CY2011 CY2012
Amerigroup CMO 46.6% 48.4% 45.8%
Peach State CMO 52.7% 51.4% 52.5%
WellCare CMO 54.0% 57.1% 60.4%
State Target 64.3%
HEDIS 50th Percentile 45.1%
0.0%
10.0%
20.0%
30.0%
40.0%
50.0%
60.0%
70.0%
% w
ith
Fo
llow
up
7 D
ays
of
Dis
char
ge
Followup After Hospitalization for Mental Illness: 7 Day Followup

63
CY2010 CY2011 CY2012
GA Families CMO 44.3% 45.9% 47.1%
Fee For Service 35.1% 37.1% 40.2%
HEDIS 50th Percentile 45.1%
0.0%
5.0%
10.0%
15.0%
20.0%
25.0%
30.0%
35.0%
40.0%
45.0%
50.0%
% w
ith
Fo
llow
up
7 D
ays
of
Dis
char
ge
Followup After Hospitalization for Mental Illness: 7 Day Followup

64
CY2010 CY2011 CY2012
Amerigroup CMO 70.9% 71.4% 67.3%
Peach State CMO 72.8% 74.7% 70.8%
WellCare CMO 73.8% 75.1% 77.2%
State Target 83.6%
HEDIS 50th Percentile 66.6%
0.0%
10.0%
20.0%
30.0%
40.0%
50.0%
60.0%
70.0%
80.0%
90.0%
% w
ith
Fo
llow
up
30
Day
s o
f D
isch
arg
e
Followup After Hospitalization for Mental Illness: 30 Day Followup

65
CY2010 CY2011 CY2012
GA Families CMO 65.8% 67.6% 65.1%
Fee For Service 57.6% 59.1% 61.3%
HEDIS 50th Percentile 66.6%
52.0%
54.0%
56.0%
58.0%
60.0%
62.0%
64.0%
66.0%
68.0%
70.0%
% w
ith
Fo
llow
up
30
Day
s o
f D
isch
arg
e
Followup After Hospitalization for Mental Illness: 30 Day Followup

66
CY2011 CY2012
GA Families CMO 43.8% 38.5%
Fee For Service 50.9% 43.4%
HEDIS 50th Percentile 40.8%
0.0%
10.0%
20.0%
30.0%
40.0%
50.0%
60.0%
% T
reat
ed
Initiation of Alcohol and Other Drug Dependence Treatment
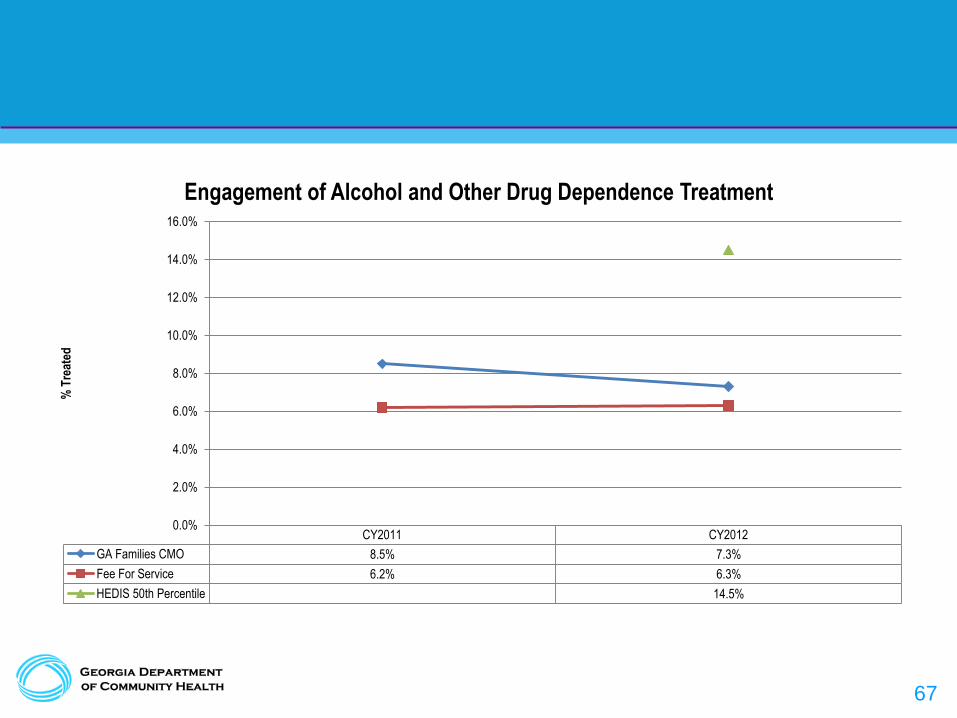
67
CY2011 CY2012
GA Families CMO 8.5% 7.3%
Fee For Service 6.2% 6.3%
HEDIS 50th Percentile 14.5%
0.0%
2.0%
4.0%
6.0%
8.0%
10.0%
12.0%
14.0%
16.0%
% T
reat
ed
Engagement of Alcohol and Other Drug Dependence Treatment

68
Title or Chapter Slide
(use as needed; feel free to delete)
Utilization

69
CY2010 CY2011 CY2012
Amerigroup CMO 58.1 55.4 59.9
Peach State CMO 54.7 52.5 57.1
WellCare CMO 61.7 59.3 63.8
State Target 58.5
HEDIS 50th Percentile 63.3
0.0
10.0
20.0
30.0
40.0
50.0
60.0
70.0
Nu
mb
er E
R V
isit
s p
er 1
000
Mem
ber
Mo
nth
s
Note: A Lower Rate is Better
Ambulatory Care: Emergency Room Visits

70
CY2010 CY2011 CY2012
GA Families CMO 58.7 54.0 58.1
Fee For Service 78.6 77.4 93.0
HEDIS 50th Percentile 63.3
0.0
10.0
20.0
30.0
40.0
50.0
60.0
70.0
80.0
90.0
100.0
Nu
mb
er E
R V
isit
s p
er 1
000
Mem
ber
Mo
nth
s
Note: A Lower Rate is Better
Ambulatory Care: Emergency Room Visits

71
Title or Chapter Slide
(use as needed; feel free to delete)
Medication Management

72
CY2011 CY2012
GA Families CMO 85.0% 87.5%
Fee For Service 84.6% 85.3%
HEDIS 50th Percentile 84.2%
82.0%
83.0%
84.0%
85.0%
86.0%
87.0%
88.0%
% M
on
ito
red
Annual Monitoring for Patients on Persistent Medications

73
Adult Child PCK
Rating of all health care 70.3% 82.6% 88.1%
Rating of personal doctor 78.1% 89.4% 89.6%
Rating of specialist seen most 76.9% 93.5% 84.8%
Rating of program 72.1% 84.9% 84.0%
CAHPS Survey Results
74
Questions