practical implementation of lrfd for geotechnical...
TRANSCRIPT

Practical Implementation of LRFD for
Geotechnical Engineering Features
Design and Construction of Driven Pile Foundations
Wednesday, June 22, 2011
PDCA Professors Workshop
By
Jerry A. DiMaggio, PE, D. GE, M. ASCE
E-Mail: [email protected]
1

ASCE LRFD Webinar Series
2
* Check ASCE website for latest information
# Topic 2009 2010 2011 2012
1 Fundamentals of LRFD – Part 1 1/16, 8/7 6/30 1/18, 10/13
2 Fundamentals of LRFD – Part 2 1/30, 9/8 7/15 2/4, 10/21
3 Subsurface Explorations 6/30, 11/5 4/15 2/17, 8/18 2/3
4 Shallow Foundations 7/24 1/6, 5/7, 11/8 5/20, 12/12
5 Deep Foundations – Piles 1/25, 6/1, 12/14 6/21, 11/7
6 Deep Foundations – Shafts 2/8, 6/11 1/7, 7/8 1/23
7 Deep Foundations – Micropiles 9/10 3/3, 7/29 1/12
8 Earth Retaining Structures – Fill 8/20 3/11, 9/12 3/9
9 Earth Retaining Structures – Cut 10/21 9/30 2/28
10 MSE Walls 4/4, 12/2
11 Ground Anchors 5/2 3/29

Presnetation Assumptions/References
• Basic knowledge of:
– LRFD (previous webinars)
– Basic Deep Foundation Design and Construction
• Primary References:
– Section 10 of AASHTO (2010, 5th Edition)
– List of other references provided at end
3

Driven Pile Foundations
Topic Slides
General (Section 3, Section 10.4, 10.7.1) 4 – 18
10.5 Limit States and Resistance Factors 19 – 22
10.7.2 Service Limit State 23 – 31
10.7.3 Strength Limit State 32 – 58
10.7.4 Extreme Event Limit State 59 – 65
10.7.5 Corrosion and Deterioration 66 – 69
10.7.8 Drivability Analysis 70 – 73
4

Section 10 Contents
Article Topic
10.1 Scope
10.2 Definitions
10.3 Notation
10.4 Soil and Rock Properties
10.5 Limit States and Resistance Factors
10.6 Spread Footings
10.7 Driven Piles
10.8 Drilled Shafts
10.9 Micropiles
Refer to Section 3 for Loads and Load Factors
5

Deep Foundation Types
Material Driven
Piles
Drilled
Shafts/
Micropiles
Jacked/
Special
Prestressed concrete X X
Post-tensioned concrete X X
Pre-cast concrete X
Cast-in-place concrete X X X
Steel X X X
Wood X
Specialty/Composites X X X
6

Section 10.7 Driven Piles
Article Topic
10.7.1 General
10.7.2 Service Limit State Design
10.7.3 Strength Limit State Design
10.7.4 Extreme Event Limit State Design
10.7.5 Corrosion and Deterioration
10.7.6 Minimum Pile Penetration
10.7.7 Driving Criteria for Bearing
10.7.8 Drivability Analysis
10.7.9 Test Piles
7

Professional Discipline Communication
• Geotechnical, Structural, Hydraulic, and Construction
specialists all play an important role and have
different responsibilities on deep foundation
projects.
• Project specific loads, extreme events, performance
requirements, scour, pile cap details, specifications,
plans construction, pile damage are ALL KEY issues
for a successful project!
• The Geotechnical Design Report is a key
communication tool.
8

10.7.1 GENERAL
• Consider spread footings first.
• Basic guidelines for driven pile configurations
– Minimum spacing 2.5 pile diameters or 30 inches.
– Minimum of 9 inches pile cap edge and be embedded 12
inches into the pile cap or if with strands or bars then the
pile embedment should be 6 inches.
– Piles through embankments should extend 10 ft into
original ground or refusal on rock. Maximum of 6 inch fill
size.
– Batter Piles: stiffness, don’t use in downdrag situations,
concern in seismic situations.
9

Comparison of LRFD and ASD approaches
for Deep Foundations
Same Different
• Determining resistance • Comparison of load and resistance
• Determining deflection • Separation of resistance and deflection
10

AASHTO Table 3.4.1-1
Load
Combination
Limit State
DC
DD
DW
EH
EV
ES
EL
PS
CR
SH
LL
IM
CE
BR
PL
LS WA WS WL FR TU TG SE
Use One of These at
a Time
EQ IC CT CV
STRENGTH
LIMIT
I γp 1.75 1.00 — — 1.00 0.50/1.20 γTG γSE — — — —
II γp 1.35 1.00 — — 1.00 0.50/1.20 γTG γSE — — — —
III γp — 1.00 1.40 — 1.00 0.50/1.20 γTG γSE — — — —
IV γp — 1.00 — — 1.00 0.50/1.20 — — — — — —
V γp 1.35 1.00 0.40 1.0 1.00 0.50/1.20 γTG γSE — — — —
EXTREME EVENT
I γp γEQ 1.00 — — 1.00 — — — 1.00 — — —
II γp 0.50 1.00 — — 1.00 — — — — 1.00 1.00 1.00
SERVICE LIMIT
I 1.00 1.00 1.00 0.30 1.0 1.00 1.00/1.20 γTG γSE — — — —
II 1.00 1.30 1.00 — — 1.00 1.00/1.20 — — — — — —
III 1.00 0.80 1.00 — — 1.00 1.00/1.20 γTG γSE — — — —
IV 1.00 — 1.00 0.70 — 1.00 1.00/1.20 — 1.0 — — — —
FATIGUE - LL, IM & CE only
I — 1.50 — — — — — — — — — — —
II — 0.75 — — — — — — — — — — —
11

Load
Combination
Limit State
DC
DD
DW
EH
EV
ES
EL
PS
CR
SH
LL
IM
CE
BR
PL
LS WA WS WL FR TU TG SE
Use One of These at
a Time
EQ IC CT CV
STRENGTH
LIMIT
I γp 1.75 1.00 — — 1.00 0.50/1.20 γTG γSE — — — —
II γp 1.35 1.00 — — 1.00 0.50/1.20 γTG γSE — — — —
III γp — 1.00 1.40 — 1.00 0.50/1.20 γTG γSE — — — —
IV γp — 1.00 — — 1.00 0.50/1.20 — — — — — —
V γp 1.35 1.00 0.40 1.0 1.00 0.50/1.20 γTG γSE — — — —
EXTREME EVENT
I γp γEQ 1.00 — — 1.00 — — — 1.00 — — —
II γp 0.50 1.00 — — 1.00 — — — — 1.00 1.00 1.00
SERVICE LIMIT
I 1.00 1.00 1.00 0.30 1.0 1.00 1.00/1.20 γTG γSE — — — —
II 1.00 1.30 1.00 — — 1.00 1.00/1.20 — — — — — —
III 1.00 0.80 1.00 — — 1.00 1.00/1.20 γTG γSE — — — —
IV 1.00 — 1.00 0.70 — 1.00 1.00/1.20 — 1.0 — — — —
FATIGUE - LL, IM & CE only
I — 1.50 — — — — — — — — — — —
II — 0.75 — — — — — — — — — — —
DC DW DW EH
EV
ES
LL
WA WA
EQ CT
DD
12

Load Factors for Permanent Loads, γp
Type of Load, Foundation Type, and
Method Used to Calculate Downdrag
Load Factor
Maximum Minimum
DC: Component and Attachments
DC: Strength IV only
1.25
1.50
0.90
0.90
DD: Downdrag Piles, α Tomlinson Method
Piles, λ Method
Drilled shafts, O’Neill and Reese (1999) Method
1.4
1.05
1.25
0.25
0.30
0.35
DW: Wearing Surfaces and Utilities 1.50 0.65
EH: Horizontal Earth Pressure
• Active
• At-Rest
• AEP for anchored walls
1.50
1.35
1.35
0.90
0.90
N/A
EL: Locked-in Construction Stresses 1.00 1.00
EV: Vertical Earth Pressure
• Overall Stability
• Retaining Walls and Abutments
• Rigid Buried Structure
• Rigid Frames
• Flexible Buried Structures other than Metal Box Culverts
• Flexible Metal Box Culverts and Structural Plate Culverts with Deep
Corrugations
1.00
1.35
1.30
1.35
1.95
1.50
N/A
1.00
0.90
0.90
0.90
0.90
ES: Earth Surcharge 1.50 0.75
AASHTO Table 3.4.1-2
13

Load Type and Direction
Structural Geotechnical
• Vertical or horizontal
• Permanent/Transient
• Vertical/Horizontal
• Downdrag/Setup/Relaxation
New
Fill
Bridge Deck
Soft Soil Consolidating
Due to Fill Weight
Bearing Stratum
New
Fill
New
Fill
Bridge Deck
Soft Soil Consolidating
Due to Fill Weight
Bearing Stratum
14

Downdrag
15
Design Method Load Factors
Maximum Minimum
Piles α-method 1.40 0.25
λ-method 1.05 0.30
Shafts Reese & O’Neill (1999) 1.25 0.35
• “Geotechnical” load
• Can be significant particularly given the max load factors
• Articles 3.4.1 and 3.11.8
New
Fill
Bridge Deck
Soft Soil Consolidating
Due to Fill Weight
Bearing Stratum
New
Fill
New
Fill
Bridge Deck
Soft Soil Consolidating
Due to Fill Weight
Bearing Stratum
15

AASHTO Section 10.4
Soil and Rock Properties
DISCUSSED IN PREVIOUS WEBINAR ON
SUBSURFACE INVESTIGATIONS – Next Offering
on August 18, 2011
Article Topic
10.4.1 Informational Needs
10.4.2 Subsurface Exploration
10.4.3 Laboratory Tests
10.4.4 In Situ Tests
10.4.5 Geophysical Tests
10.4.6 Selection of Design Properties
16

Deep Foundation Selection
• Method of support
• Bearing material depth
• Load type, direction and magnitude
• Constructability
• Cost
� Expressed in $/kip capacity
� Include all possible costs
17

Pile Types Based on Soil Displacement
During Driving
Low Displacement High Displacement
18

Driven Pile Foundations
Topic Slides
General (Section 3, Section 10.4, 10.7.1) 4 – 18
10.5 Limit States and Resistance Factors 19 – 22
10.7.2 Service Limit State 23 – 31
10.7.3 Strength Limit State 32 – 58
10.7.4 Extreme Event Limit State 59 – 65
10.7.5 Corrosion and Deterioration 66 – 69
10.7.8 Drivability Analysis 70 – 73
19

Strength Limit State Driven Piles
ARTICLE 10.5.3.3
• Axial compression resistance for single piles
• Pile group compression resistance
• Uplift resistance of single piles
• Uplift resistance of pile groups
• Pile punching failure in weaker stratum
• Single pile and pile group lateral resistance
• Constructability, including pile drivability
20

SPECIAL DESIGN CONSIDERATIONS
• Negative shaft resistance (downdrag)
• Lateral squeeze
• Scour
• Pile and soil heave
• Seismic considerations
21

10.5 LIMIT STATES AND RESISTANCE
• Strength Limit State (will be discussed later)
– Structural Resistance
– Geotechnical Resistance
– Driven Resistance
• Service Limit State
– Resistance Factor = 1.0 (except for global stability)
• Extreme Event Limit State
– Seismic, superflood, vessel, vehicle
– Use nominal resistance
22

Driven Pile Foundations
Topic Slides
General (Section 3, Section 10.4, 10.7.1) 4 – 18
10.5 Limit States and Resistance Factors 19 – 22
10.7.2 Service Limit State 23 – 31
10.7.3 Strength Limit State 32 – 61
10.7.4 Extreme Event Limit State 62 – 65
10.7.5 Corrosion and Deterioration 66 – 69
10.7.8 Drivability Analysis 70 – 73
23

Service Limit State Checks
Global Stability Vertical and
Horizontal
Displacements
24

Settlement of Pile Groups
Article 10.7.2.3.1 [Hannigan (2006)]
• Treat as
equivalent
footings
• Categorize
as one of
the 4 cases
shown
here
25

Fx
H1 H2
∆∆∆∆x ∆∆∆∆x
M1 M2
10.7.2.4 Horizontal Loads and Pile Moments
26

Horizontal Response
• Assumes nominal resistance is adequate
• No consideration of possible brittle response
of geomaterial
• LPILE type p-y model or Strain Wedge Method
Isolated Group
27
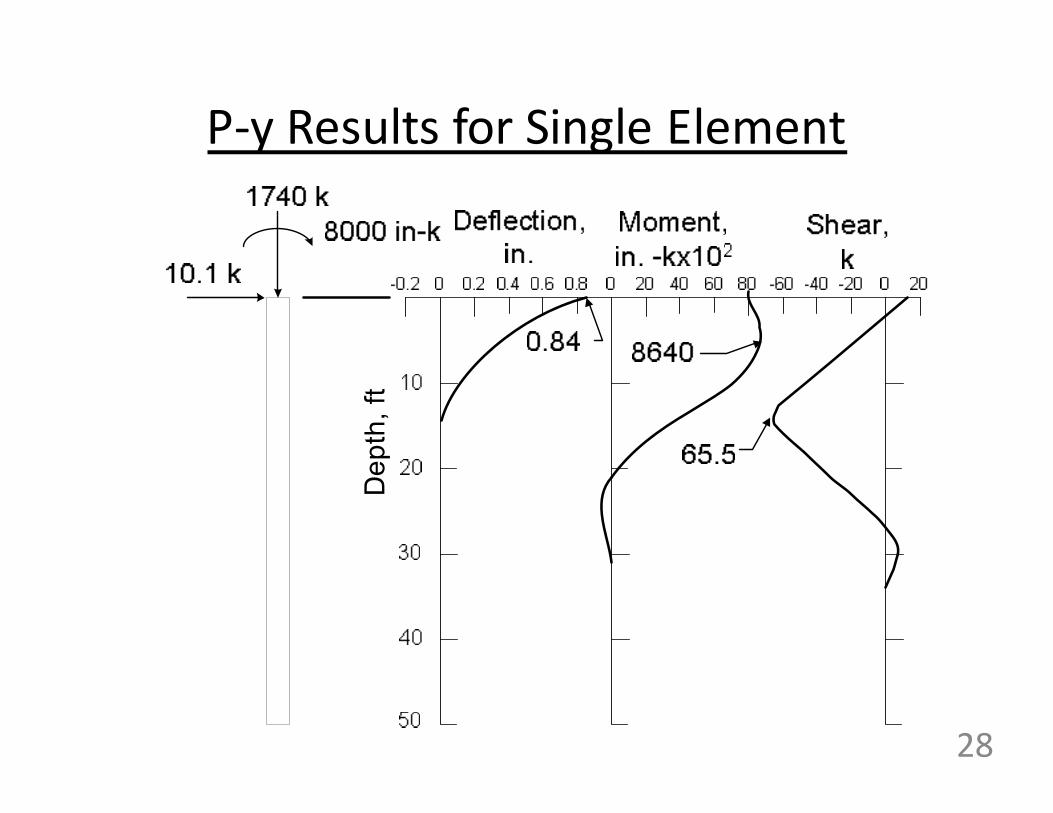
De
pth
, ft
P-y Results for Single Element
28

P-y Results for Pile Groups
Spacing (S) P-multiplier (Pm)
Row 1 Row 2 Row 3
3B 0.8 0.4 0.3
5B 1.00 0.85 0.7
Applied LoadB
Spacing
Row
3 or higher
Row
2
Row
1
Applied Load
Row
3 or higher
Row
2
Row
1
Spacing
Row 1
Applied Load
5B or less
Applied LoadB
SpacingSpacing
Row
3 or higher
Row
2
Row
1
Applied Load
Row
3 or higher
Row
2
Row
1
Spacing
Row 1
Applied Load
5B or less
AASHTO Figure 10.7.2.4-1
29

∆∆∆∆x ∆∆∆∆x
Moment Moment
Pile Head Fixity
30
30

Tolerable Movements and Movement
Criteria 10.5.2.2
• Service loads for settlements,
horizontal movements and
rotations.
• Omit transient loads for
cohesive soils
• Reference movements to the
top of the substructure unit.
• Angular Distortion (C10.5.2.2)
31

Driven Pile Foundations
Topic Slides
General (Section 3, Section 10.4, 10.7.1) 4 – 18
10.5 Limit States and Resistance Factors 19 – 22
10.7.2 Service Limit State 23 – 31
10.7.3 Strength Limit State 32 – 58
10.7.4 Extreme Event Limit State 59 – 65
10.7.5 Corrosion and Deterioration 66 – 69
10.7.8 Drivability Analysis 70 – 73
32

33
STRENGTH LIMIT STATES
Structural
Axial
Driven
(Assess Drivability)
Flexure
Shear
Geotechnical Axial
33

Axial compression
Combined axial and flexure
Shear
LRFD Specifications
Concrete – Section 5
Steel – Section 6
Wood – Section 8
Methods for Determining Structural
Resistance
34

Factors Affecting
Allowable Structural Pile Stresses
• Average section strength (Fy, fc’, wood crushing
strength)
• Defects (knots in timber)
• Section treatment (preservation for timber)
• Variation in materials
• Load factor (overloads or pile damage)
35

Concrete (5.5.4.2)
Axial Comp. = 0.75
Flexure = 0.9 (strain dependent)
Shear = 0.9
Steel (6.5.4.2)
Axial = 0.5-0.7
Combined
Axial= 0.7-0.8
Flexure = 1.0
Shear = 1.0
Timber (8.5.2.2 and .3)
Compression = 0.9
Tension = 0.8
Flexure = 0.85
Shear = 0.75
LRFD
Specifications
Structural Resistance Factors 10.7.3.13 Pile Structural Resistance
36

Field methods
� Static load test
� Dynamic load test (PDA)
� Driving Formulae
� Wave Equation Analysis
Static analysis methods
Determining Nominal Axial Geotechnical
Resistance of Piles
37

Geotechnical Safety Factors for Piles (ASD)
Basis for Design and Type
of Construction Control
Increasing Design/Construction
Control
Subsurface exploration X X X X X
Static analysis X X X X X
Dynamic formula X
Wave equation X X X X
CAPWAP analysis X X
Static load test X X
Factor of Safety (FS) 3.50 2.75 2.25 2.00 1.90
38

Pile Testing Methods
Analysis
Method
Resistance
Factor
(φφφφ) (AASHTO 2010)
Factor of
Safety
(FS)
Estimated Measured
Ca
pa
city
Stress
En
ergy
Ca
pa
city
Stress
En
ergy
Dynamic
formula
0.10 or
0.40 3.50 X
Wave
equation 0.50 2.75 X X X
Dynamic
testing
0.65 or
0.75 2.25 X X X
Static load
test
0.75 to
0.80 2.00 X
39

Geotechnical Nominal Resistance of Piles:
Static Load Tests ASTM D1143 (10.7.8.2)
Test Setup Results and Definition
of Failure
40

Dynamic Load Test (PDA) ASTM D4945 10.7.3.8.3
41

Wave Equation Driven Resistance
10.7.3.8.4
42

Wave Equation Applications
Item Use
Develop driving
criterion
• Blow count for a required nominal
resistance
• Blow count for nominal resistance as a
function of energy/stroke
Check drivability • Blow count vs penetration depth
• Driving stresses vs penetration depth
Determine optimal
driving equipment
• Driving time
Refined matching
analysis
• Adjust input values based on dynamic
measurements
43

68 blows / 0.25 m
GRLWEAP (TM) Version 2003FHWA - GRLWEAP EXAMPLE #1 GRLWEAP (TM) Version 2003FHWA - GRLWEAP EXAMPLE #1
Co
mp
ress
ive
Str
es
s (
MP
a)
0
50
100
150
200
250
Te
ns
ion
Str
es
s (
MP
a)
0
50
100
150
200
250
Blow Count (blows/.25m)
Ulti
ma
te C
ap
ac
ity (
kN
)
0.0 25.0 50.0 75.0 100.0 125.0 150.00
400
800
1200
1600
2000
Blow Count (blows/.25m)
Str
ok
e (
me
ter)
0.0 25.0 50.0 75.0 100.0 125.0 150.00.00
1.00
2.00
3.00
4.00
5.00
DELMAG D 12-42
Efficiency 0.800
Helmet 7.60 kNHammer Cushion 10535 kN/mm
Skin Quake 2.500 mmToe Quake 3.000 mmSkin Damping 0.160 sec/mToe Damping 0.500 sec/m
Pile Length mPile Penetration mPile Top Area cm2
20.00 19.00 86.51
Pile ModelSkin FrictionDistribution
Res. Shaft = 84 %(Proportional)
195 MPa
1480 kN
2.6 m
Wave Equation Results
44

Driving Formulas
(Article 10.7.3.8.5)
45

Pile Testing Methods
Analysis
Method
Resistance
Factor
(φφφφ) (AASHTO 2010)
Estimated Measured
Ca
pa
city
Stress
En
ergy
Ca
pa
city
Stress
En
ergy
Dynamic
formula 0.10 or 0.40 X
Wave
equation 0.50 X X X
Dynamic
testing 0.65 or 0.75 X X X
Static load
test 0.75 to 0.80 X
46

● Calculate pile length for loads
● Determine number of piles
● Determine most cost effective pile type
● Calculate foundation settlement
● Calculate performance under uplift and lateral loads
Static analysis methods and computer solutions
are used to:
47

Static Analysis Methods
• Primary use is for pile length estimation for
contract drawings and feasibility.
• Secondary use for estimation of downdrag,
uplift resistance and scour effects
• Should rarely be used as sole means of
determining pile resistance. ONLY IN SPECIAL
SITUATIONS!
48

Side Resistance
Tip Resistance
Total Resistance
A
B
C D
RP
RS
RR = φRn = φqpRp + φqsRs
Vertical Displacement
Resistance
Large Pile Diameter Resistance
49

Computation of Static Geotechnical Resistance
AASHTO 10.7.3.7.5-2 RP
RS
RR = φRn φRn = φqpRp + φqsRs
RP = AP qP
RS = AS qs
50

Nominal Resistance: Rn = Rs1 + Rs2 + Rs3 +Rt
Factored Resistance: RR = φRn= φ(Rs3 + Rt)
Soil Resistance
to Driving (SRD): SRD = Rs1 + Rs2 + Rs3 +Rt
EXAMPLE SOIL PROFILE
SRD = Rs1 + Rs2 / 2 + Rs3 +Rt
(with clay soil strength change)
((with no soil strength changes)
51

Static Analysis Methods
α method
β method
λ method
Nordlund -Thurman method
SPT-method
CPT-method
Driven Piles
52

Resistance Factors Static Analysis Methods AASHTO Table 10.5.5.2.3-1
Method Resistance Factor, φφφφ
Compression Tension
α- method 0.35 0.25
β- method 0.25 0.20
λ- method 0.40 0.30
Nordlund- Thurman 0.45 0.35
SPT 0.30 0.25
CPT 0.50 0.40
Group 0.60 0.50
53

Combining Geotechnical Resistance Factors
• C10.7.3.3 φdyn x Rn = φ stat x Rnstat
• The length predicted by this method may be
overly conservative and need to be adjusted
to reflect experience.
• Local experience replaces this suggested
relationship.
54

Driven Pile Time Dependent Effects
(Article 10.7.3.4)
Setup Relaxation
RP
RS
RP
RS
RP
RS
RP
RS
55

SOIL SETUP
• Soil setup is a time dependent increase in the static
pile resistance
• Large excess positive pore pressures are often
generated during pile driving
• Soil setup frequently occurs for piles driven in
saturated clays as well as loose to medium dense
silts and fine sands as the excess pore pressure
dissipate
• Magnitude of setup depends on soil characteristics
and pile material and type
56

Point Bearing on Rock
(Article 10.7.3.2)
• Soft rock that can be penetrated by pile driving may be treated similar to soils.
• Steel piles driven into soft rock may not require tip reinforcement.
• On hard rock the nominal resistance is controlled by the structural capacity. See Article 6.9.4.1 and the driving resistances in 6.5.4.2 and 6.15 for severe driving.
• PDA should be used when the nominal resistance exceeds 600 kips.
• C10.7.3.2.3 Provides qualitative guidance to minimize pile damage when driving piles on hard rock.
57

Pile Group Resistance 10.7.3.9 & 11
Static Geotechnical Resistance Figures 10.7.3.11-1 and -2 for group uplift resistance for cohesionless and
cohesive soils respectively.
Take lesser of
58

Driven Pile Foundations
Topic Slides
General (Section 3, Section 10.4, 10.7.1) 4 – 16
10.5 Limit States and Resistance Factors 17 – 20
10.7.2 Service Limit State 21 – 29
10.7.3 Strength Limit State 30 – 58
10.7.4 Extreme Event Limit State 59 – 65
10.7.5 Corrosion and Deterioration 66 – 69
10.7.8 Drivability Analysis 70 – 73
59

EXTREME EVENT LIMIT STATES
10.5.5.3
• Scour
• Vessel and Vehicle collision
• Seismic loading and site specific situations.
(Uplift Resistance should be 0.80 rather than
1.00 for all extreme checks.)
60

Piles Subject to Scour
10.5.5.3.2
61

Seismic – Articles 10.7.4, 10.5.5.3.3
• Liquefaction: Neglect axial resistance in
liquefiable zone
• Lateral Spreading: Either consider forces due
to lateral spreading or improve ground;
reduce P-y curve based on duration of strong
shaking and ability of the ground to fully
liquefy during strong shaking
• Downdrag: Do not combine “seismic”
downdrag with “static” downdrag
62

Driven Pile Foundations
Topic Slides
General (Section 3, Section 10.4, 10.7.1) 4 – 18
10.5 Limit States and Resistance Factors 19 – 22
10.7.2 Service Limit State 23 – 31
10.7.3 Strength Limit State 32 – 58
10.7.4 Extreme Event Limit State 59 – 62
10.7.5 Corrosion and Deterioration 63 – 66
10.7.8 Drivability Analysis 67 – 73
63

10.7.5 Corrosion and Deterioration
• Identified by soil resistivity & pH testing
• If pH < 4.5, design should be based on an aggressive environment
• Corrosion of steel pile foundations, particularly in fill soils, low pH soils and marine environments
• Sulfate, chloride, and acid attack of concrete pile foundations
• Decay of timber piles from wetting and drying cycles from insects and marine borers
64

Aggressive Subsurface Environments
• Resistivity < 2000 ohms-cm
• pH < 5.5
• pH between 5.5 and 8.5 in soils with high
organic content
• Sulfates > 1,000 ppm
• Landfills and cinder fills
• Soils subject to mine or industrial drainage
• Areas of mixed resistivity (high and low)
• Insects (wood piles)
65

Pile Driving Induced Vibrations
See Hannigan (2006)
• Vibration induced damage
• Vibration induced soil densification
66

Driven Pile Foundations
Topic Slides
General (Section 3, Section 10.4, 10.7.1) 4 – 18
10.5 Limit States and Resistance Factors 19 – 22
10.7.2 Service Limit State 23 – 31
10.7.3 Strength Limit State 32 – 58
10.7.4 Extreme Event Limit State 59 – 62
10.7.5 Corrosion and Deterioration 63 – 66
10.7.8 Drivability Analysis 67 – 73
67
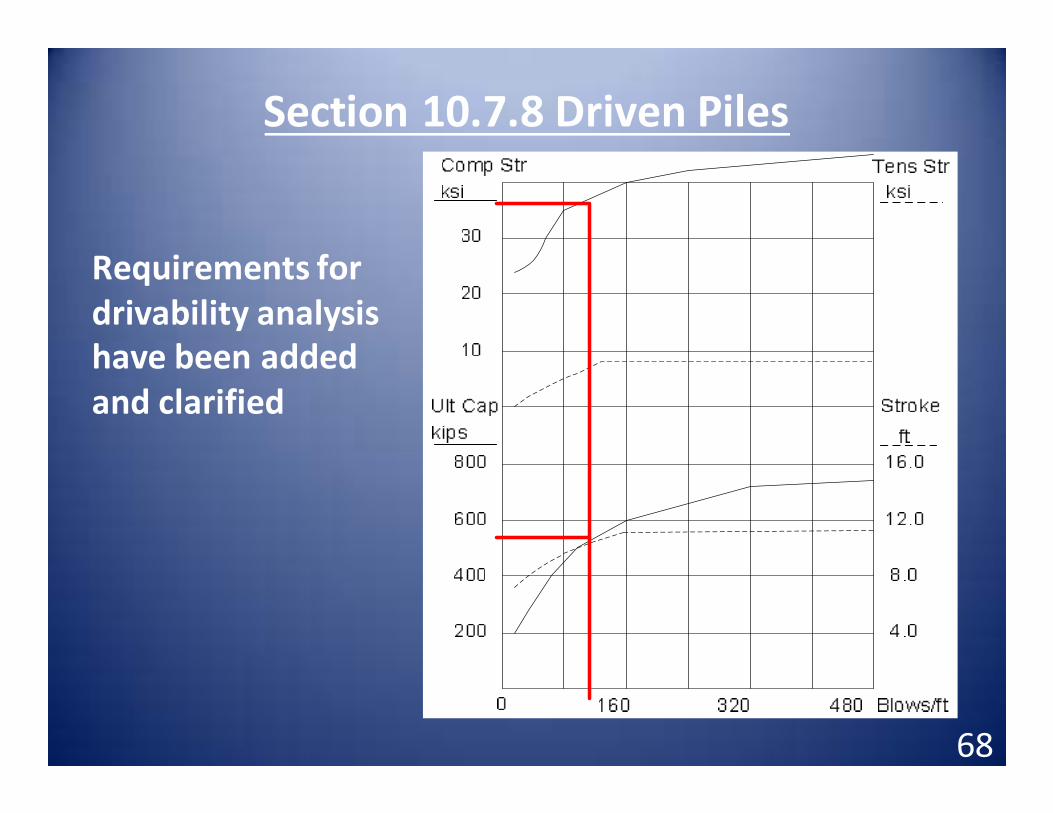
Section 10.7.8 Driven Piles
Requirements for
drivability analysis
have been added
and clarified
68

Pile TypePile TypePile TypePile Type Loading TypeLoading TypeLoading TypeLoading Type Limiting Driving StressLimiting Driving StressLimiting Driving StressLimiting Driving Stress
Steel Compression/Tension
Concrete Compression
Tension
Prestressed
Compression
Tension
Tension (in severe corrosion)
Timber Compression/Tension
)9.0( ydadr fφσ =
)f85.0( 'cdadr φ=σ
)f7.0( ydadr φ=σ
)ff85.0( pe'cdadr −φ=σ
)ff095.0( pe'cdadr −φ=σ
)f( pedadr φ=σ
)f( codadr φ=σ
69

Concrete piles, = 1.00
� AASHTO Article 5.5.4.2.1
Steel piles, = 1.00
� AASHTO Article 6.5.4.2
Timber piles, = 1.15
� AASHTO Article 8.5.2.2
Driven Resistance Factors
daφ
daφ
daφ
70

Driven Pile Foundations
Topic Slides
General (Section 3, Section 10.4, 10.7.1) 4 – 18
10.5 Limit States and Resistance Factors 19 – 22
10.7.2 Service Limit State 23 – 31
10.7.3 Strength Limit State 32 – 58
10.7.4 Extreme Event Limit State 59 – 62
10.7.5 Corrosion and Deterioration 63 – 66
10.7.8 Drivability Analysis 67 – 71
71

5th Edition 2010 Changes Sec 10.5
• Specification references to changes in resistance factors based on
pile group size moved to the commentary.
• The definition of foundation redundancy (in commentary) was
simplified.
• Tables relating resistance factor to site variability were removed from
the specifications and decisions were deferred to the engineer. The
site variability method was retained as an acceptable option to aid in
engineering judgment.
• Precaution for static analysis predictions for piles greater than 24“
was added.
• The resulting changes based on the above was a modest increase
for several resistance factors.
72

5th Edition 2010 Changes Sec 10.7
• Use of dynamic tests with signal matching to estimate side friction
were added as a reasonable alternative to static analysis methods or
load testing.
• Table 10.7.2.4-1, small adjustments in the p-multipliers for group
lateral load analysis.
• Provisions for piles driven to hard rock (Article 10.7.3.2) were made
more complete.
• Article 10.7.3.3 changed to clarify the use and potential pitfalls of the
approaches provided to estimate the pile length required.
• Article C10.7.3.4.3, guidance added regarding the length of time
needed for various soil conditions before a restrike should be
attempted.
73

Table 10.5.5.2.3-1
Resistance Factors for Driven Piles
• Static Load Test with Dynamic Tests – 0.80 (minimum test number 2 and minimum percentage 2% of tests)
• Static Load Test without Dynamic Tests – 0.75
• Dynamic Testing 100% production piles – 0.75
• Dynamic Tests – 0.65 (minimum test number 2 and
minimum percentage 2% of tests)
• Wave Equation – 0.50
74

For More Information on Driven Piles
75

REFERENCES • Allen, T. M. 2005. “Development of Geotechnical
Resistance Factors and Downdrag Load Factors for LRFD
Foundation Strength Limit State Design”, FHWA-NHI-05-
052, FHWA, Wash. DC.
• Barker, R. M. et al 1991. “Manuals for the Design of Bridge
Foundations” NCHRP Report 343. Transportation Research
Board, NRC, Wash., DC.
• Hannigan P.J. et al, 2005. “Design and Construction of Driven Pile Foundations”, FHWA-HI-05, FHWA, Wash. DC
• Paikowsky S. G. et al, 2004. “Load and Resistance Factor
Design (LRFD) for Deep Foundations”, NCHRP Report
507. Transportation Research Board, NRC, Wash. DC.
76

Practical Implementation of LRFD for
Geotechnical Engineering Features
Design and Construction of Driven Pile Foundations
Wednesday, June 22, 2011
PDCA Professors Workshop
By
Jerry A. DiMaggio, PE, D.GE, M. ASCE
E-Mail: [email protected]
77