practical leadership for improvement · practical leadership for improvement donald m. berwick, md...
TRANSCRIPT

Practical Leadership for Improvement
Donald M. Berwick, MD
President Emeritus and Senior Fellow
Institute for Healthcare Improvement
Derek Feeley, DBA
President and CEO
Institute for Healthcare Improvement
4th Annual Middle East Forum on Quality
and Safety in Health Care
Doha, Qatar
May 13, 2016
Format
1. The basics
2. The basics applied (Stories for Scotland)
3. Radical Redesign
2

The Basic Elements
Aim
Method
3

Institute of Medicine – 1999 & 2001
44,000 – 98,000 Deaths per Year
6 AIMS FOR IMPROVEMENT • Safety • Effectiveness • Patient-Centeredness • Timeliness • Efficiency • Equity
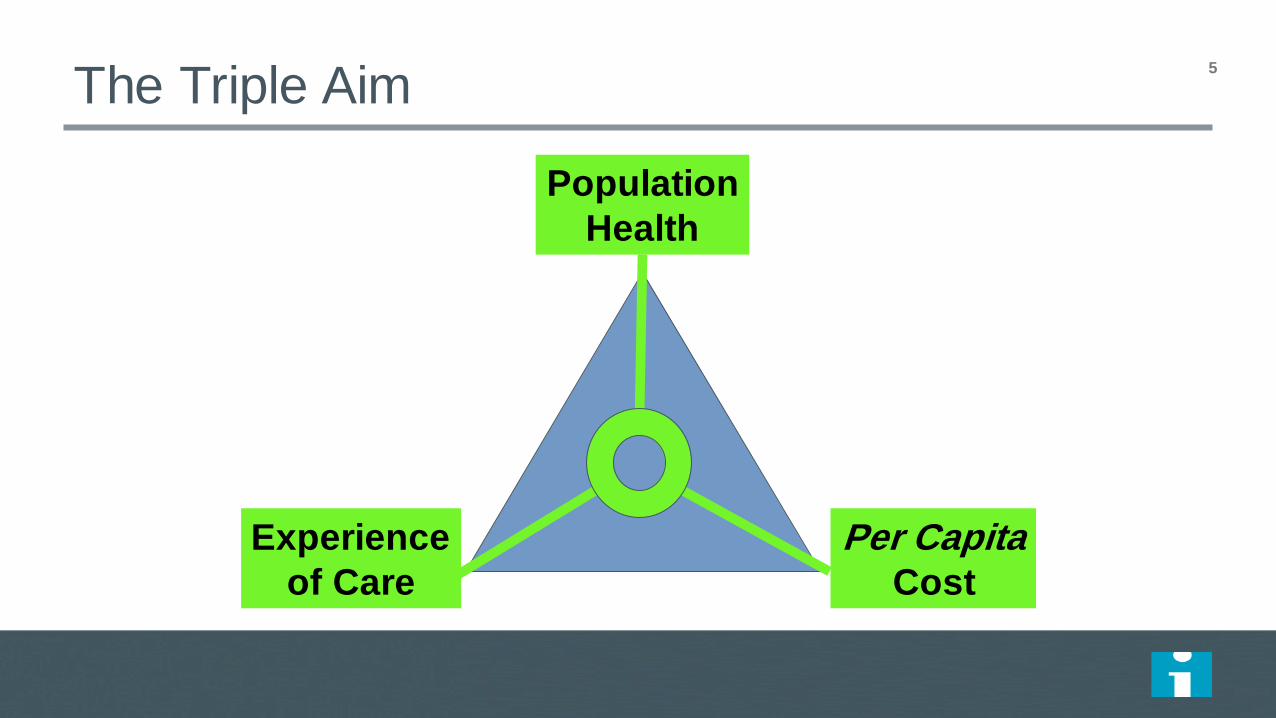
Population
Health
Experience
of Care
Per Capita Cost
The Triple Aim
5

Waste Category Annual Estimates
6
Category Cost to US Healthcare (2011 $B)
Overtreatment $158 to $226 Failures to Coordinate Care $25 to $45
Failures in Care Delivery $102 to $154 Excess Administrative Costs $107 to $389 Excessive Health Care Prices $84 to $178
Fraud and Abuse $82 to $272
2011 Total Waste $558 to $1263
% of Total Spending 21% to 47% (MED = 34%) 6

Model I: Bad Apples
The
Problem
Quality
Frequency

Model I: Bad Apples
The
Problem
Quality
Frequency
“Reliance on Inspection to Improve”
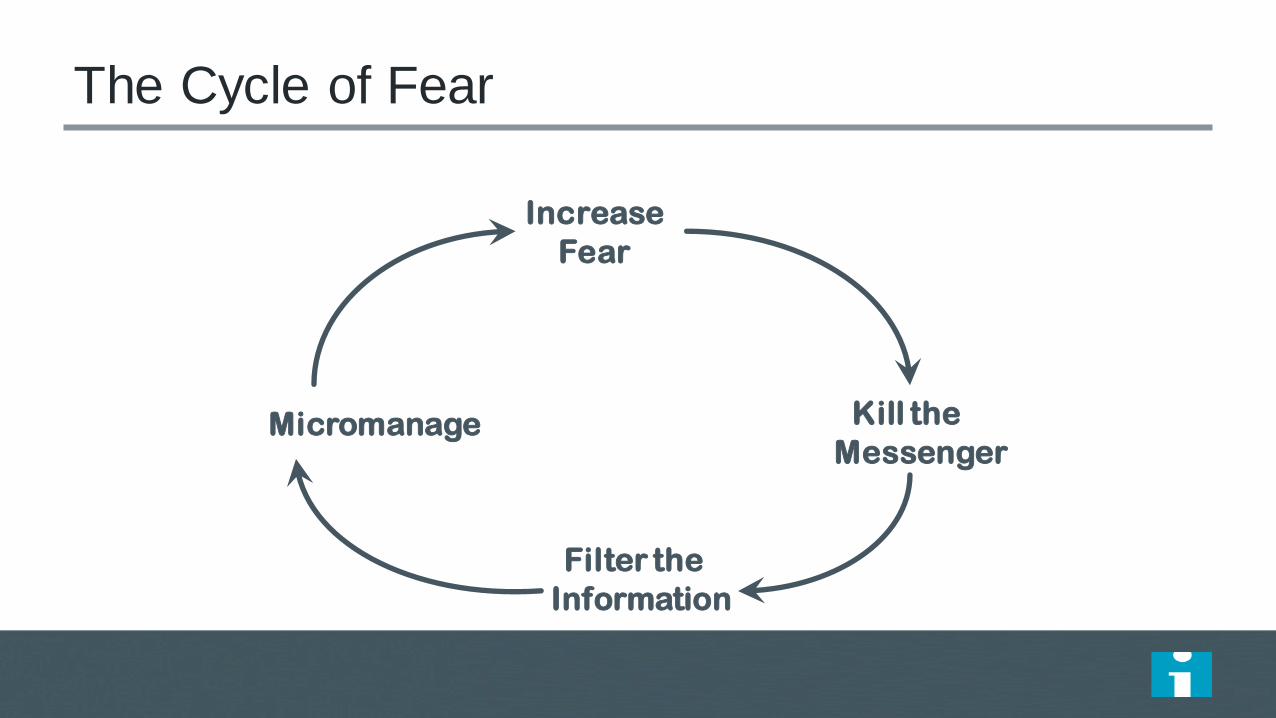
The Cycle of Fear
Increase
Fear
Micromanage Kill the
Messenger
Filter the
Information

Some Consequences of Reliance on Inspection
“Measurement” Has Gone Wild
“Accountability” Everywhere
“Skin in the Game” for Patients
“Standardization”
“Markets”
10
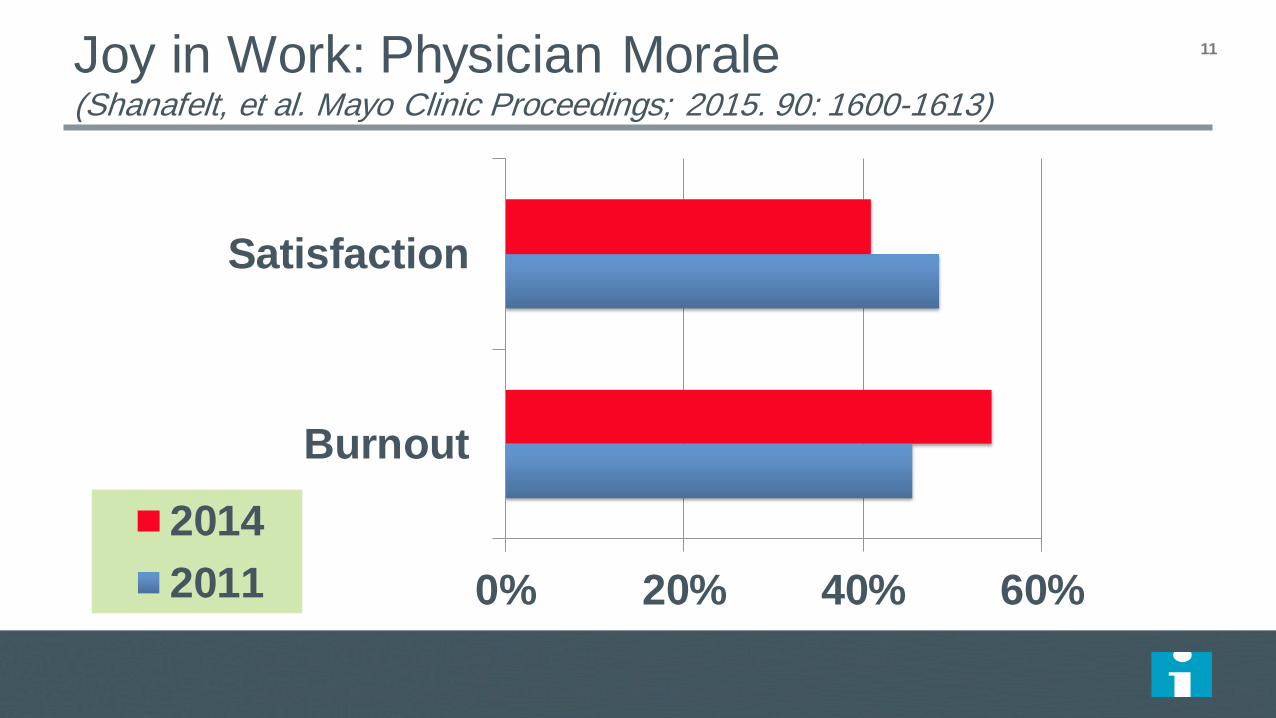
Joy in Work: Physician Morale (Shanafelt, et al. Mayo Clinic Proceedings; 2015. 90: 1600-1613)
0% 20% 40% 60%
Burnout
Satisfaction
2014
2011
11
Source: The Commonwealth Fund/Kaiser Family Foundation
2015 National Survey of Primary Care Providers
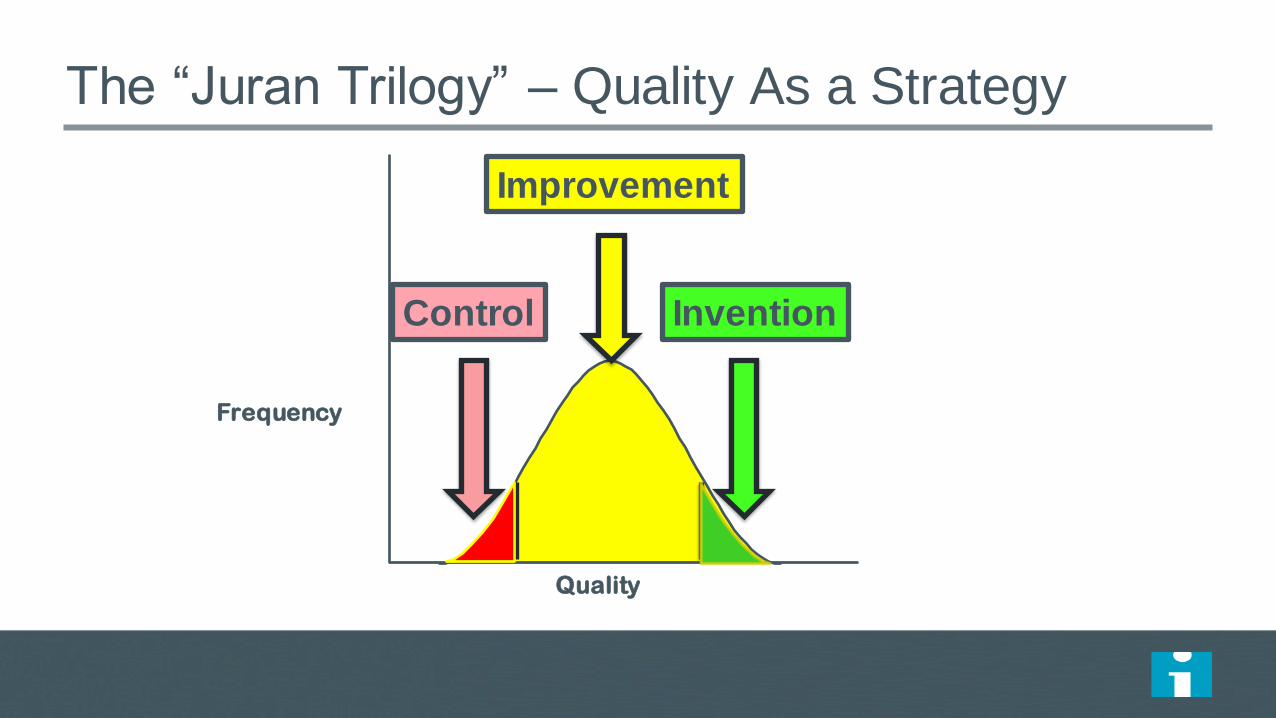
The “Juran Trilogy” – Quality As a Strategy
Quality
Frequency
Control Invention
Improvement

The Wrong Way
Quality
Frequency
Control
Invention
Improvement
“The First Law of Improvement”
Every system is
perfectly designed to
achieve exactly the
results it gets.

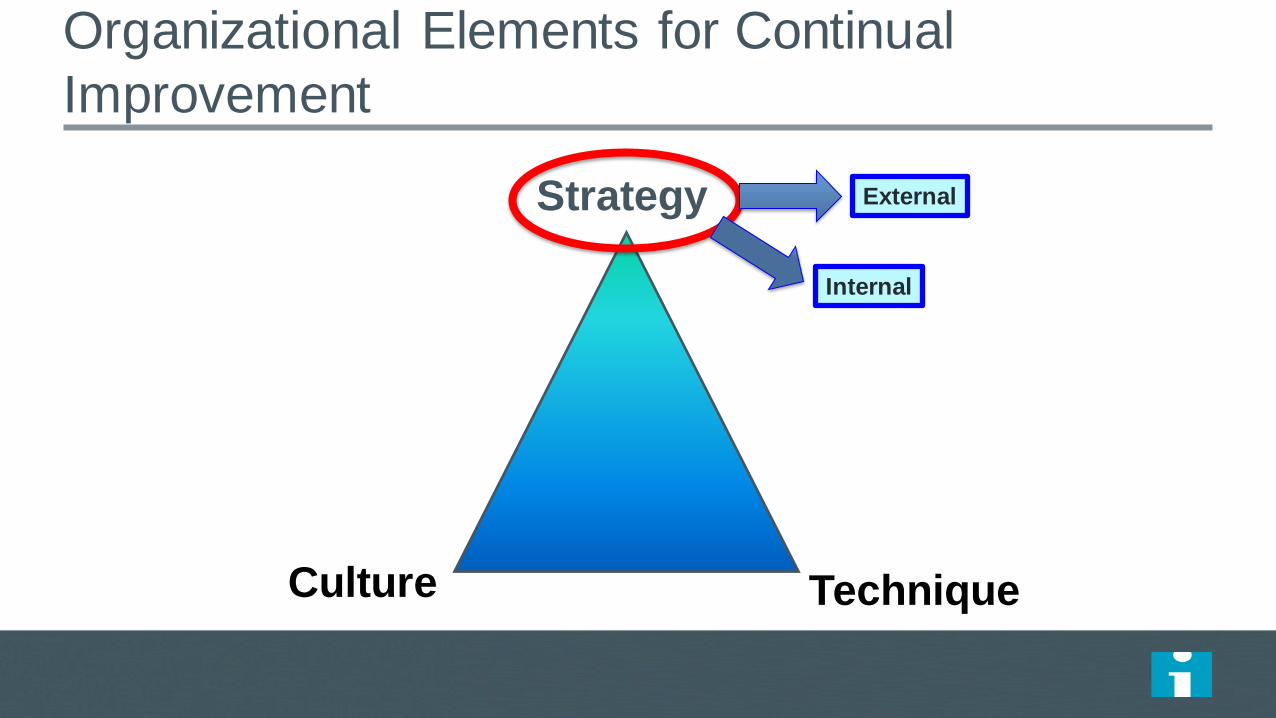
Organizational Elements for Continual
Improvement
Strategy
Culture Technique
Organizational Elements for Continual
Improvement
Strategy
Culture Technique
External
Internal

Population
Health
Experience
of Care
Per Capita Cost
The Triple Aim
17

New Rules for Radical
Redesign in Health Care
IHI’s “Leadership Alliance”

Radical Redesign Principles – IHI Leadership
Alliance 1. Change the Balance of Power
2. Standardize What Makes Sense
3. Customize to the Individual
4. Promote Wellbeing
5. Create Joy in Work
6. Make It Easy
7. Move Knowledge, Not People
8. Collaborate/Cooperate
9. Assume Abundance
10. Return the Money
19
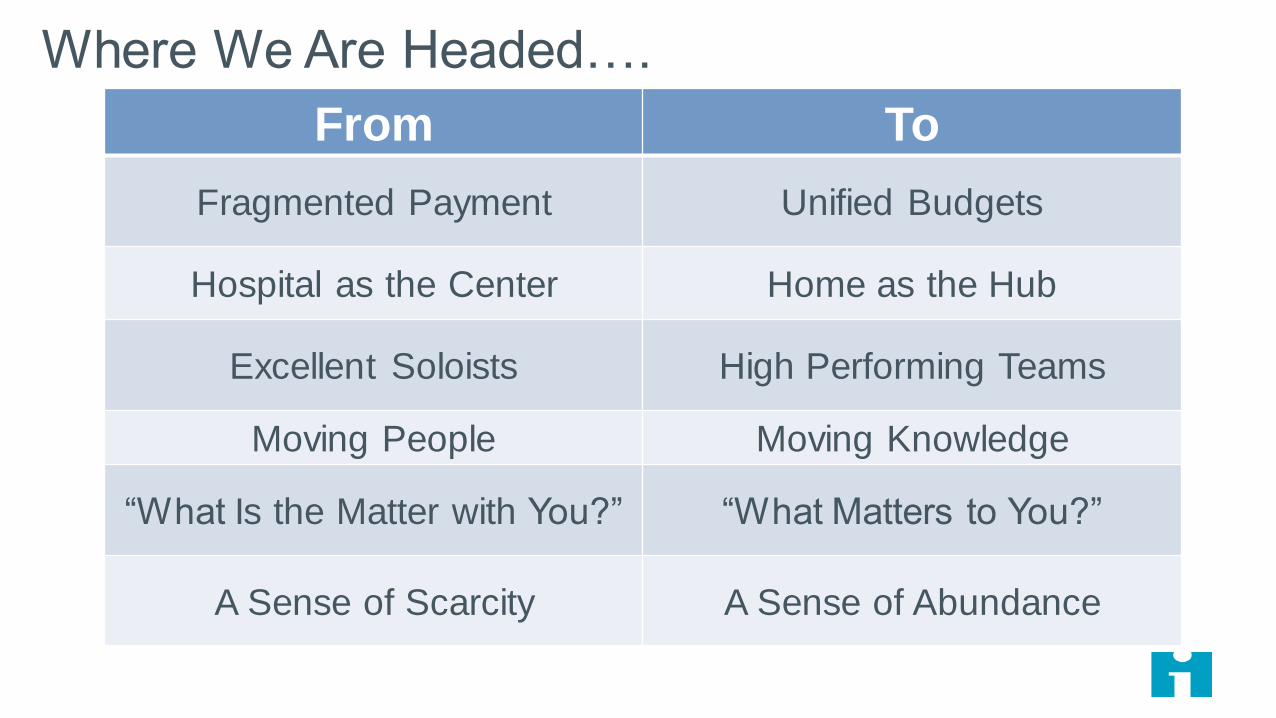
From To
Fragmented Payment Unified Budgets
Hospital as the Center Home as the Hub
Excellent Soloists High Performing Teams
Moving People Moving Knowledge
“What Is the Matter with You?” “What Matters to You?”
A Sense of Scarcity A Sense of Abundance
Where We Are Headed….

Organizational Elements for Continual
Improvement
Strategy
Culture Technique

Dr. Joseph M. Juran’s “Trilogy” 22
QUALITY
PLANNING
QUALITY
IMPROVEMENT
QUALITY
CONTROL

What does it mean?
Quality Planning: You develop a new process using the principles of reliability from the beginning.
Quality Control: You monitor the process to be certain that it is working as designed. Does it continue to deliver the outcome you want?
Quality Improvement: The process is not delivering the outcomes as designed so it must be improved.
23

Juran Trilogy 24
QUALITY CONTROL (DURING OPERATIONS)
0 0
40
20
CO
ST
OF
PO
OR
QU
ALIT
Y
Op
era
tio
ns
Be
gin
Chronic Waste (an opportunity for improvement)
TIME
LESSONS LEARNED
Sporadic Spike
Original Zone of Quality Control
New Zone of Quality Control
QUALITY
IMPROVEMENT

25
What are we trying to Accomplish?
How will we know that a change is an improvement?
What change can we make that will result in improvement?
The Model for Improvement
Act Plan
Study Do
When you
combine
the three
questions
with the…
…the Model
for
Improvement. PDSA cycle,
you get… A Model for Learning and
Change Source: The Improvement Guide p. 10

The Sequence of Improvement
Sustaining improvements and Spreading changes to other locations
Developing a change
Implementing a change
Testing a change Act Plan
Study Do
Theory and Prediction
Test under a variety of conditions
Make part of routine operations

Repeated Use of the PDSA Cycle for Testing
Hunches Theories Ideas
Changes That Result in Improvement
Very Small Scale Test
Follow-up Tests
Wide-Scale Tests of Change
Implementation of Change
What are we trying to accomplish?
How will we know that a change is an improvement?
What change can we make that will result in improvement?
Model for Improvement
Sequential building of knowledge
under a wide range of conditions
Spreading
AP D
S
A
P
D
S
AP
D S
A
P
D
S
APD
S
A
P
D
S
A P
DS
Sustaining the gains
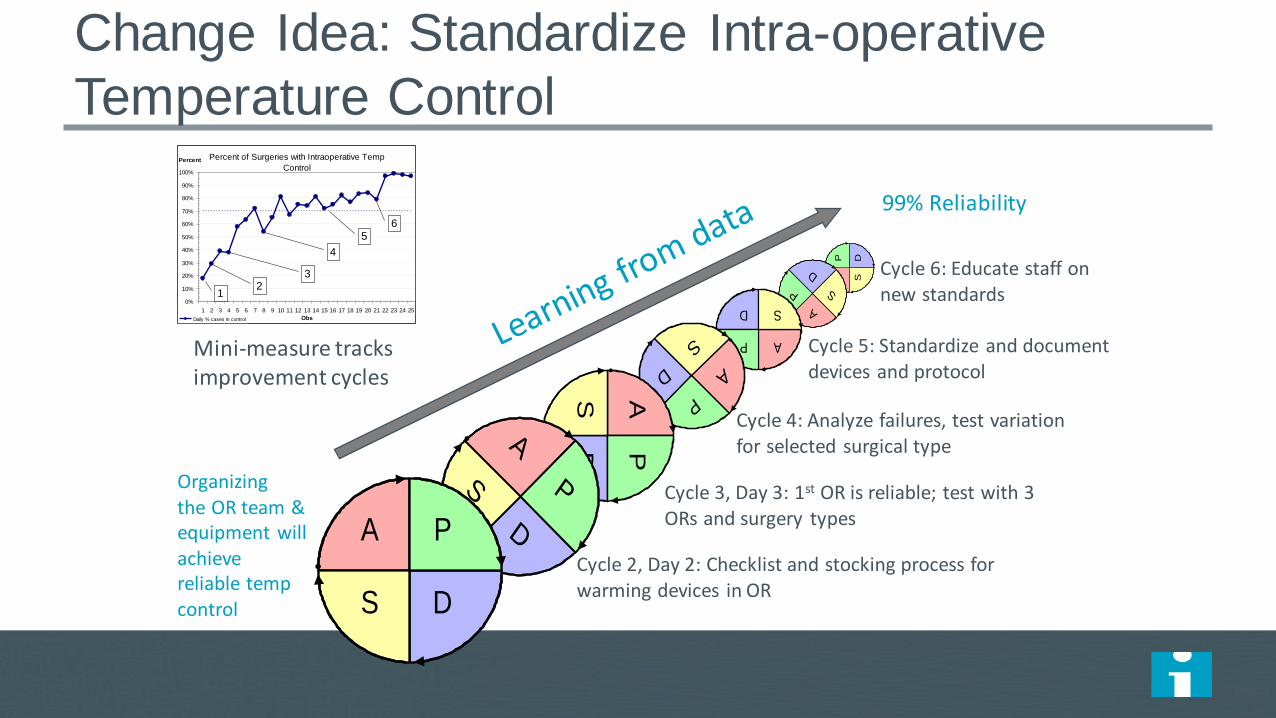
Change Idea: Standardize Intra-operative
Temperature Control
AP D
S
A
P
D
S
AP
D S
A
P
D
S
APD
S
A
P
D
S
A P
DS
Organizing the OR team & equipment will achieve reliable temp control
99% Reliability
Cycle 1, Day 1: With 1 OR team, assign responsibility for temp monitoring
Cycle 2, Day 2: Checklist and stocking process for warming devices in OR
Cycle 6: Educate staff on new standards
Cycle 5: Standardize and document devices and protocol
Percent of Surgeries with Intraoperative Temp
Control
0%
10%
20%
30%
40%
50%
60%
70%
80%
90%
100%
1 2 3 4 5 6 7 8 9 10 11 12 13 14 15 16 17 18 19 20 21 22 23 24 25
Obs
Percent
Daily % cases in control
12
3
4
56
Mini-measure tracks improvement cycles
Cycle 3, Day 3: 1st OR is reliable; test with 3 ORs and surgery types
Cycle 4: Analyze failures, test variation for selected surgical type

Monitor Temp
Stock supplies
Control Ambient Temp
Recovery Transfer
Working in Parallel on Multiple Change Ideas or
Drivers
A P
DS
A
P
D
S
APD
S
AP
DS
A P
DS
A
P
D
S
APD
S
AP
DS
A P
DS
A
P
D
S
APD
SA
P
DS
A P
DS
A
P
D
S
APD
S
AP
DS

Organizational Elements for Continual
Improvement
Strategy
Culture Technique

PULL
PUSH
1. Set Direction: 100% or Zero
Make the status quo uncomfortable
Make the future attractive
3. Build Will• Involve patients and families
• Understand the gap between
your current performance, the
best in class and the
theoretical ideal
• Use stories and data
• Go transparent
• Show courage
5. Execute Change• Establish accountability for
results
• Establish good oversight
process on “are we achieving
our aims?”
•Watch your own dots
•Weekly or monthly data
•25% Board time on quality
4. Generate Ideas• Read and Scan Widely, Learn
from other Industries &
Disciplines
• Benchmark to Find Ideas
• Listen to Customers
• Invest in Research &
Development
• Manage Knowledge
• Understand Organization as a
System
2. Establish the Foundation
• Quality education standards
for board
• Build a board culture of
healthy conversations
with MEC and
administration
• Establish Quality Committee
• Bring knowledgeable quality
leaders onto the board
Framework: Leadership for Improvement
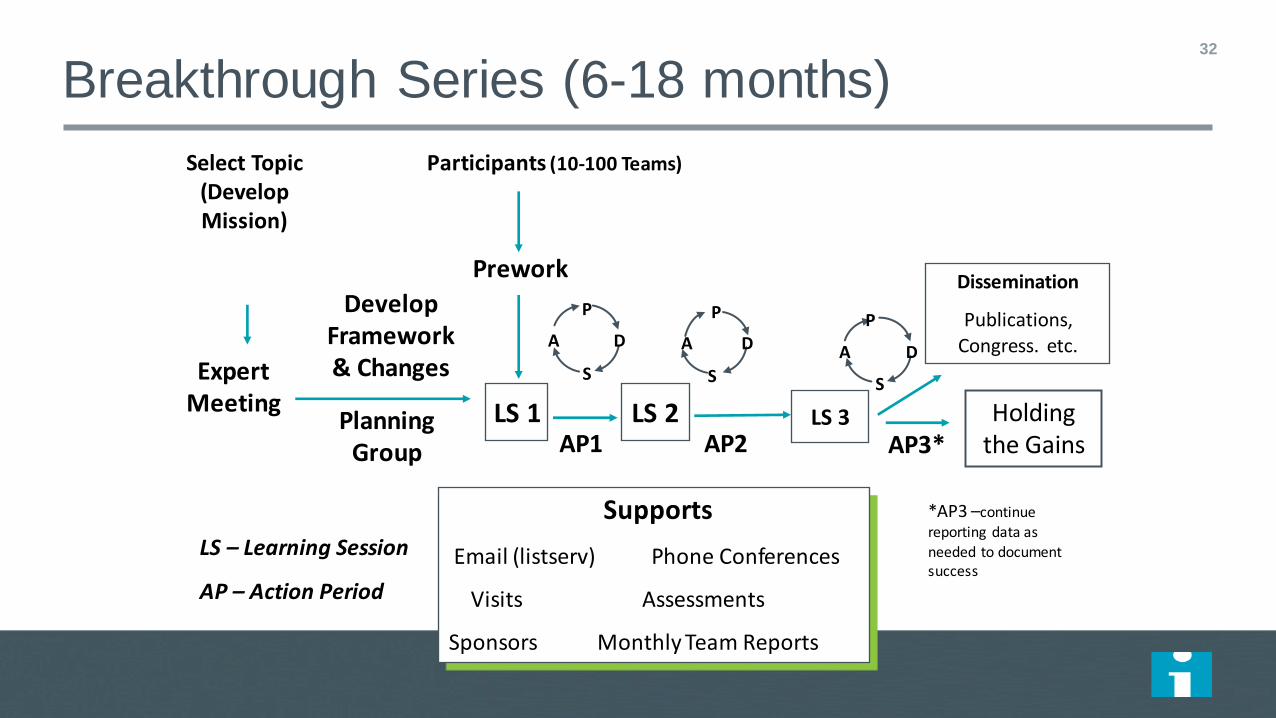
Breakthrough Series (6-18 months) 32
Select Topic (Develop Mission)
Planning Group
Develop Framework & Changes
Participants (10-100 Teams)
Prework
LS 1
P
S
A D
P
S
A D
LS 2
Supports
Email (listserv) Phone Conferences
Visits Assessments
Sponsors Monthly Team Reports
Expert Meeting
AP1 AP2
LS – Learning Session
AP – Action Period
*AP3 –continue
reporting data as
needed to document success
LS 3
Dissemination
Publications, Congress. etc. A D
P
S
AP3* Holding
the Gains


NHS Scotland Surgical Mortality

Ghana “Fives Alive” - Start Small, Scale Up
Rapidly with Change Package
Start-up: Months 1-8
Total Population:
Under 5 Population:
Nov 2007
Wave 1: Months 9-22
350,000
60,000
Jul 2008
Wave 2: Months 23-63
5 million
500,000
Sept 2009
Wave 1R: Months 58-89
11 million
1.7 million
Aug 2012
No of. QI Teams: 30 258 350 369 >1,046
Jan 2013
Wave 3: Months 24-89
11 million
1.7 million
Oct 2009
Wave 4: Months 63-89
22 million
3.3 million
*Referral project launch
41 Referral Teams
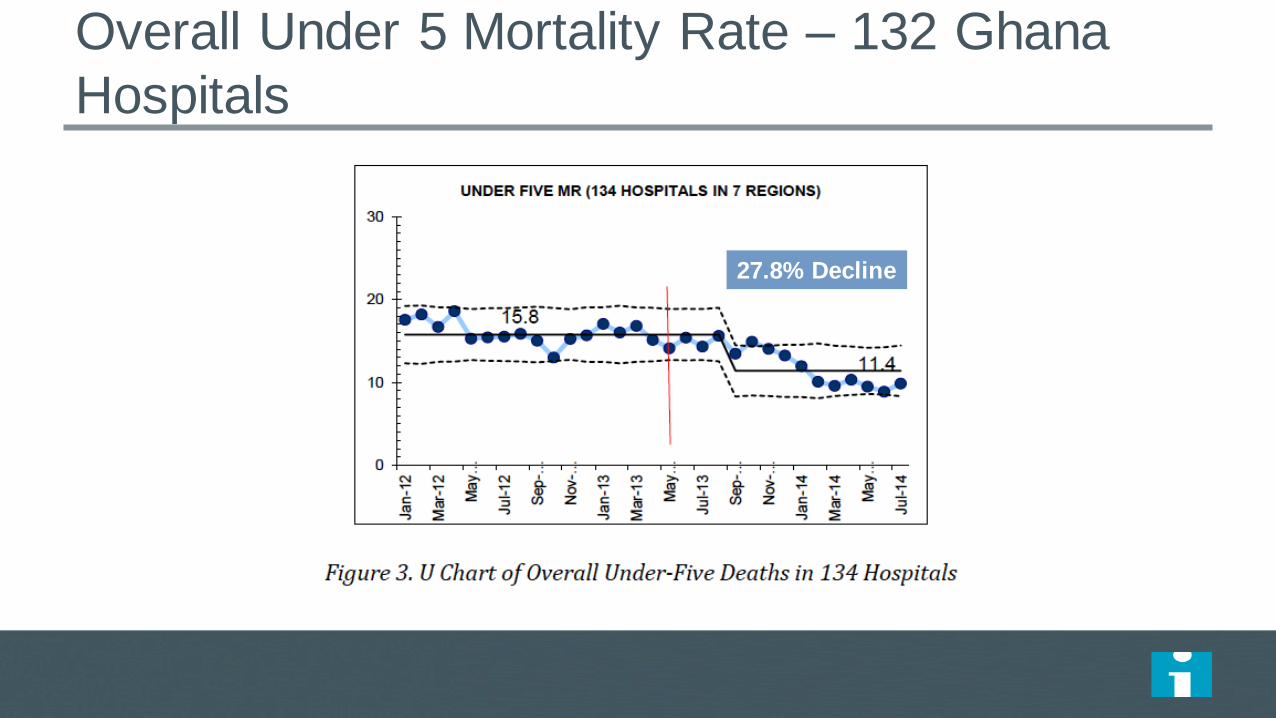
Overall Under 5 Mortality Rate – 132 Ghana
Hospitals
27.8% Decline

1.0
2.0
4.0
8.0
16.0
32.0
Apr-15 May-15 Jun-15 Jul-15 Aug-15 Sep-15 Oct-15 Nov-15 Dec-15 Jan-16 Feb-16 Mar-16
RRT & CPR Rate / 1000 Discharges
All HMC Facilities
CPR Code rate / 1000 dicharges median Code rate
QEWS go live on Paper format (HGH)
QEWS go live on Cerner for other HMC facilities

2.3
10.7
14.3
18.2 18.9
18.0
0.0
2.0
4.0
6.0
8.0
10.0
12.0
14.0
16.0
18.0
20.0
Oct-15 Nov-15 Dec-15 Jan-16 Feb-16 Mar-16
RRT Rate / 1000 Discharges
All HMC facilities
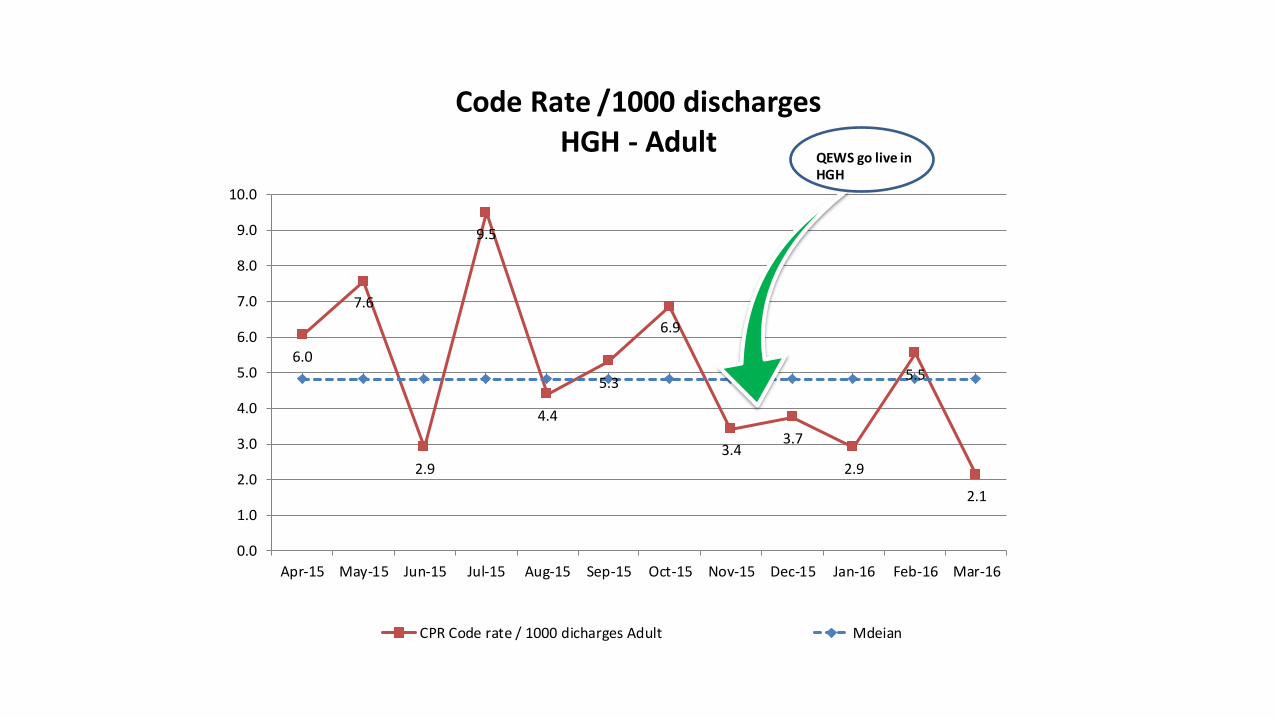
6.0
7.6
2.9
9.5
4.4
5.3
6.9
3.4 3.7
2.9
5.5
2.1
0.0
1.0
2.0
3.0
4.0
5.0
6.0
7.0
8.0
9.0
10.0
Apr-15 May-15 Jun-15 Jul-15 Aug-15 Sep-15 Oct-15 Nov-15 Dec-15 Jan-16 Feb-16 Mar-16
Code Rate /1000 discharges HGH - Adult
CPR Code rate / 1000 dicharges Adult Mdeian
QEWS go live in HGH

0.0 0.0 0.0 0.0 0.0 0.0 0.0
22.8
26.2 26.0
35.1
27.7
0.0
5.0
10.0
15.0
20.0
25.0
30.0
35.0
40.0
Apr-15 May-15 Jun-15 Jul-15 Aug-15 Sep-15 Oct-15 Nov-15 Dec-15 Jan-16 Feb-16 Mar-16
RRT Rate /1000 discharges HGH - Adult
RRT rate / 1000 dicharges Adult
QEWS go live in HGH

A Durable List of Elements… (from Paul Batalden – circa 1991)
Quality-Mindedness
Customer-Mindedness
Process-Mindedness
Employee-Mindedness
Supplier-Mindedness
Statistical-Mindedness
Continual Learning (PDSA)
Leadership
41

Deming’s “14 Points for Top Leaders” 42

Discussion Questions
• What method (or methods) of improvement do you see in
your organization?
• When you look at Deming’s 14 points, what are your
organizations strengths and weaknesses?
Practical Leadership for
Improvement
Scotland Case Study
@derekfeeleyihi
Derek Feeley President and CEO
Institute for Healthcare Improvement

Context

– 5 million people
– £12 billion
– 14 Health Boards
– 8 Support Boards
– Integrated delivery
– Moving towards social care integration

Multimorbidity is common in Scotland
More people have 2 or more conditions than only have 1


A burning platform

No shortage of analysis

Policy Options
Do what we’ve always done
Let’s get more data
Run a pilot project
Run a campaign
Let Boards and hospitals decide what to do
Run a mandatory national improvement programme

Policy Risks – do nothing (new)
We’ll always get what we always got.
There will continue to be avoidable harm (even more perhaps as care gets more complex).
The debate continues to be about reporting rather than improving.
Its not denial, I am just selective about the reality I accept. - Bill Waterson

Approach

“By what method?... only the method counts” W Edwards Deming

Our previous approach
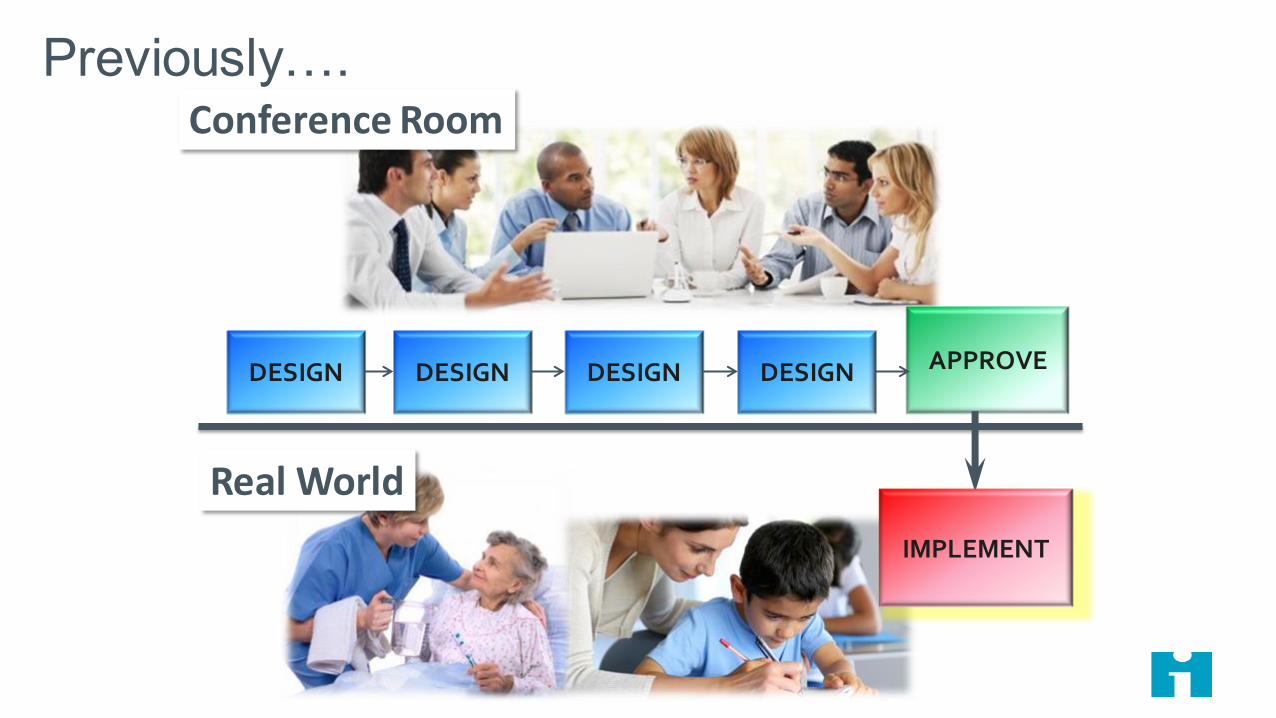
DESIGN DESIGN DESIGN DESIGN APPROVE
Conference Room
Real World
Previously….
IMPLEMENT

DESIGN
TEST & MODIFY
TEST & MODIFY
APPROVE IF NECESSARY
Conference Room
Real World TEST &
MODIFY
The Quality Improvement Way
START TO IMPLEMENT

We started to build
Execution
Ideas
Will

Path
We started in all acute hospitals

SPSP Outcome Aim Set in 2008
• Mortality aim amended to 20% by 2015
Mortality: 15%
reduction
• Ventilator Associated Pneumonia
• Central Line Bloodstream Infection • Blood Sugars w/in Range (ITU/HDU)
• MRSA Bloodstream Infection
• Crash Calls
Adverse Events: 30%
reduction
To be achieved across the nation by 2012

The SPSP Journey….
Compelling
vision
Common
goal
- aim high
Evidence-based
interventions
Model for
Improvement Knowledge & skills
Collaboration
Our change theory
A clear and stretch goal
A method
Predictive, iterative testing

Results

NHSScotland Surgical Safety Briefings

NHSScotland Surgical Mortality

NHSScotland Hospital Standardised Mortality Ratio
October 2006 to March 2015
0%
5%
10%
15%
20%
25%
30%
35%
40%
45%
Jan
09
Ap
r 0
9
Jul 0
9
Oct
09
Jan
10
Ap
r 1
0
Jul 1
0
Oct
10
Jan
11
Ap
r 1
1
Jul 1
1
Oct
11
Jan
12
Ap
r 1
2
Jul 1
2
Oct
12
Jan
13
Ap
r 1
3
Jul 1
3
Oct
13
Jan
14
Ap
r 1
4
Jul 1
4
Oct
14
Jan
15
Ap
r 1
5
% M
ort
ali
ty
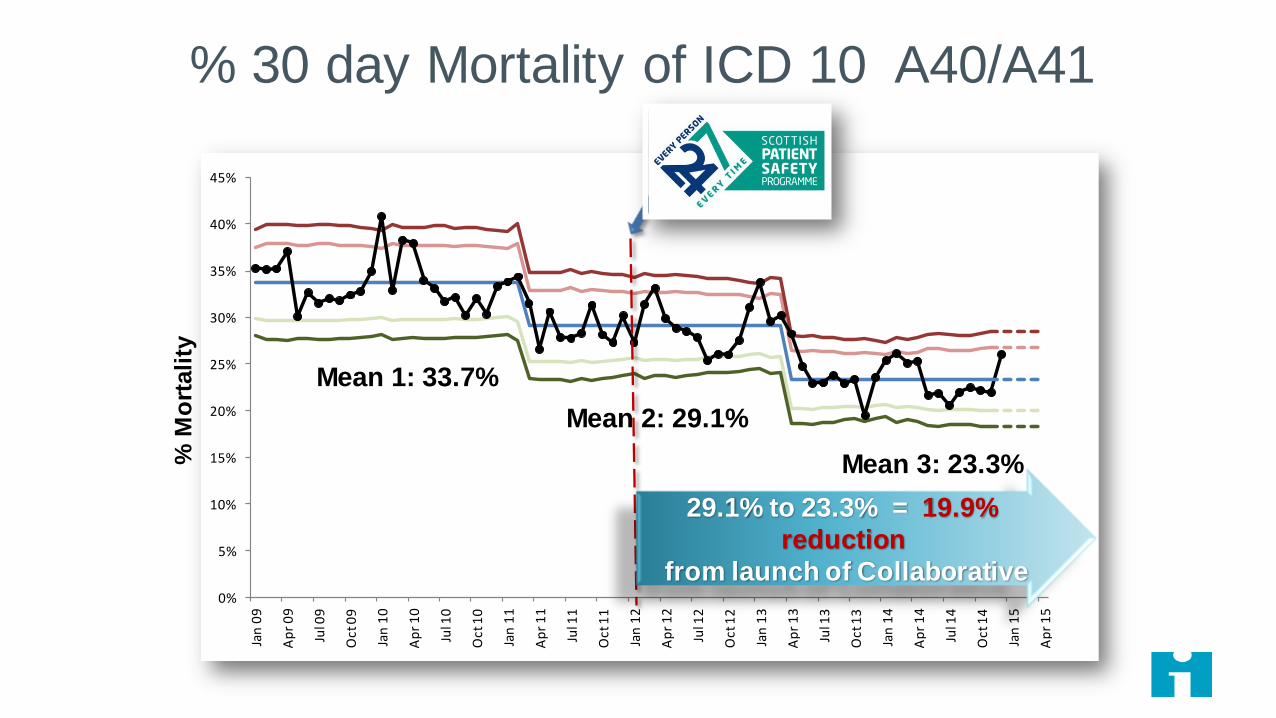
Mean 1: 33.7%
Mean 2: 29.1%
Mean 3: 23.3%
29.1% to 23.3% = 19.9%
reduction
from launch of Collaborative
% 30 day Mortality of ICD 10 A40/A41
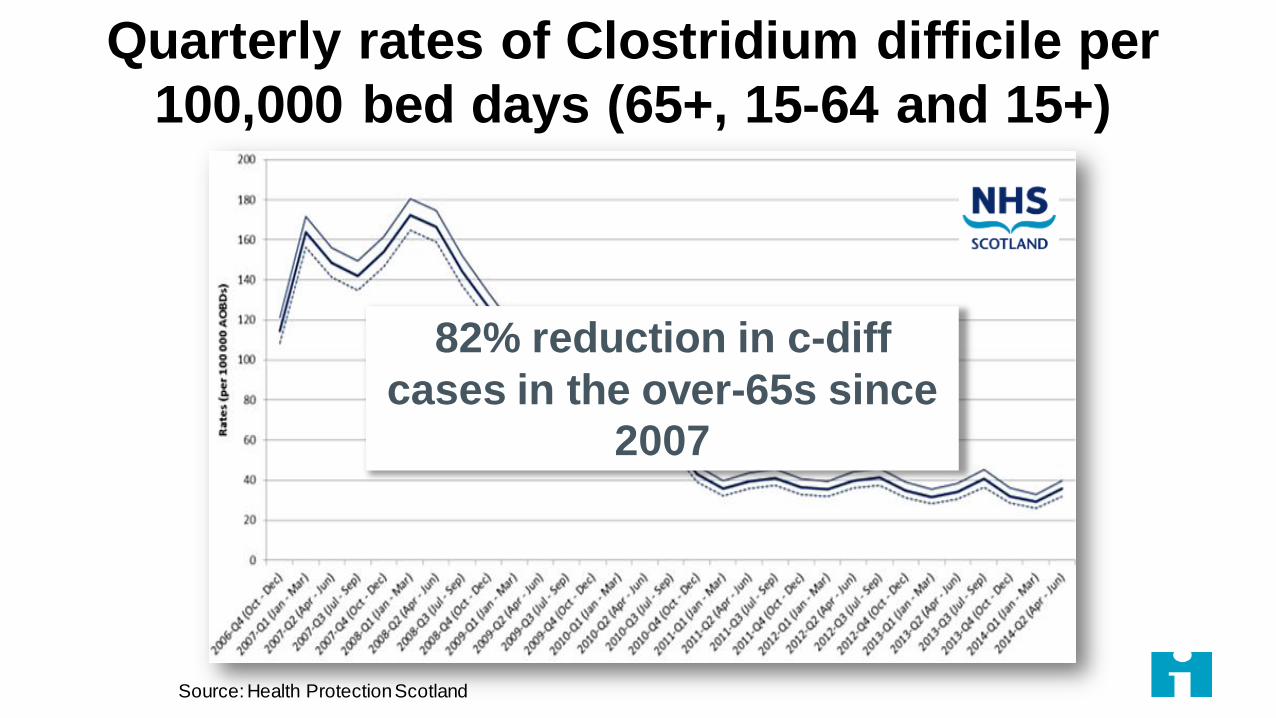
Quarterly rates of Clostridium difficile per
100,000 bed days (65+, 15-64 and 15+)
Source: Health Protection Scotland
82% reduction in c-diff
cases in the over-65s since
2007

General Medical Services
Pharmacy
Community Nursing
Dentistry

Scale and Spread

“Up to 70% of improvement projects never spread.”
Eccles R, Miller Perkins K, Serafeim G. How to Become a Sustainable Company. MIT Sloan Management Review 2012;
53(4): 43-50.
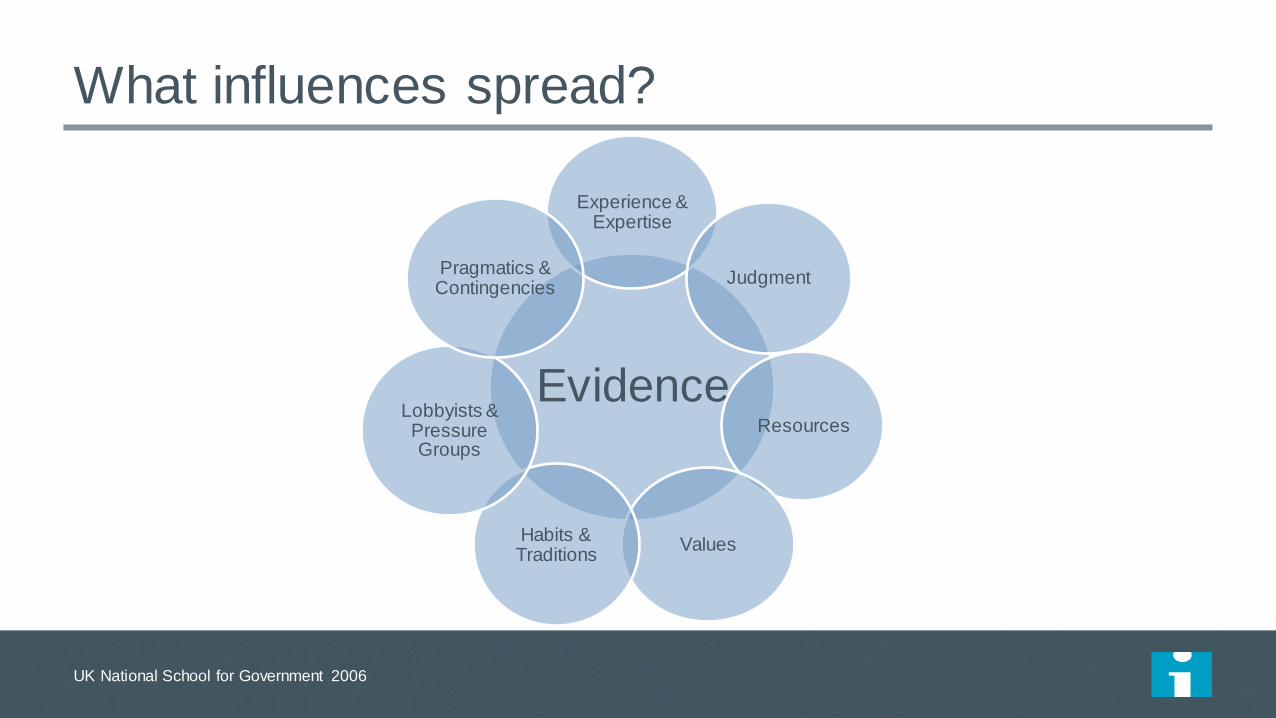
What influences spread?
UK National School for Government 2006
Evidence
Experience & Expertise
Judgment
Resources
Values Habits & Traditions
Lobbyists & Pressure Groups
Pragmatics & Contingencies
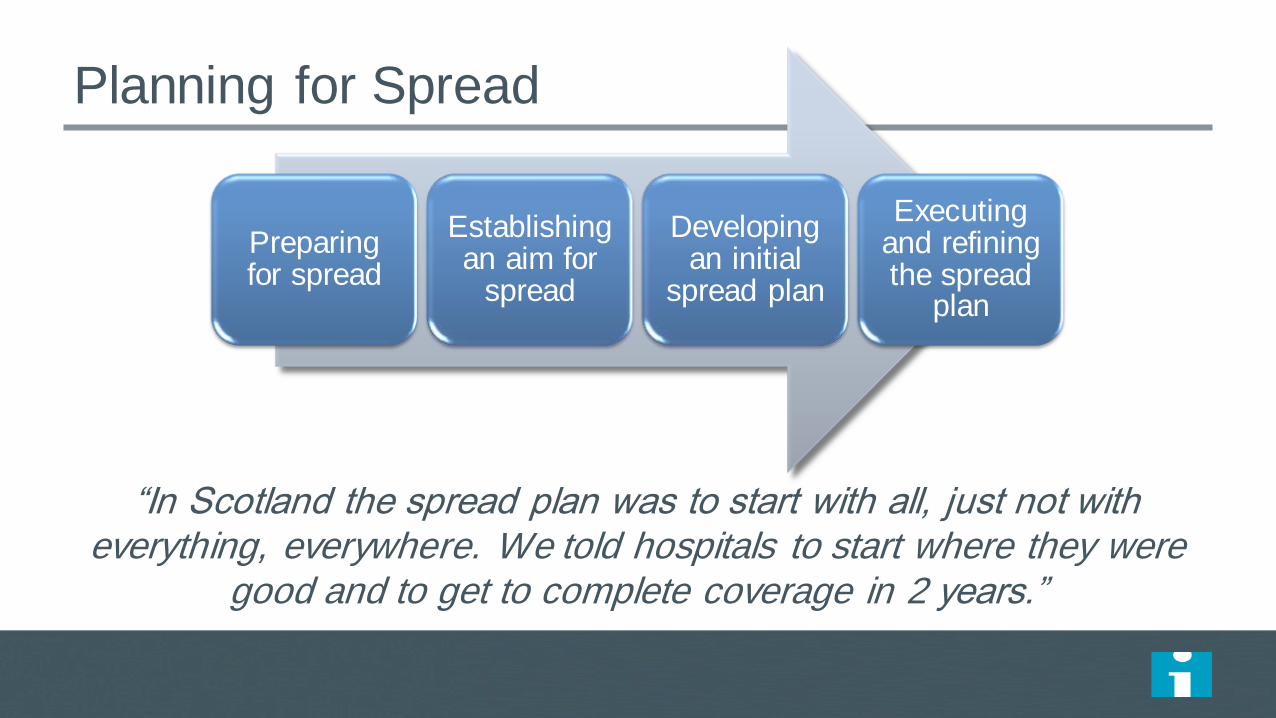
Planning for Spread
Preparing for spread
Establishing an aim for
spread
Developing an initial
spread plan
Executing and refining the spread
plan
“In Scotland the spread plan was to start with all, just not with everything, everywhere. We told hospitals to start where they were
good and to get to complete coverage in 2 years.”

Executive mandate
Emergency mobilization
Extension agency
Breakthrough Series Collaborative model
Campaign model
Fishbowl
Commercialization
Grassroots organizing (one-to-ones)
“Wedge and spread” (wave sequence)
“Broad and narrow”
And many more…
Methods for Spread

A Learning System for Getting to Full Scale
Set-up
Build Scalable Unit
Test Scale- Up
Go to Full-Scale
Phases of Scale-
up
Best Practice
exists
New Scale-up
Idea Adoption
Mechanisms
Support Systems
Leadership, communication, social networks, culture of urgency and persistence
Learning systems, data systems, infrastructure for scale-up, human capacity for scale-up, capability for scale-up,
sustainability

Typical v. Exceptional
Typical Exceptional
They invest in comprehensive strategy
development.
They have a bias toward starting.
They have general goals for adoption. They have explicit national and local aims.
(Aim Primacy)
Leadership creates standards. Leadership removes barriers.
They have “theory lock.” Improvisation is a virtue.
Data is for assessment. Data is for rapid adjustment.
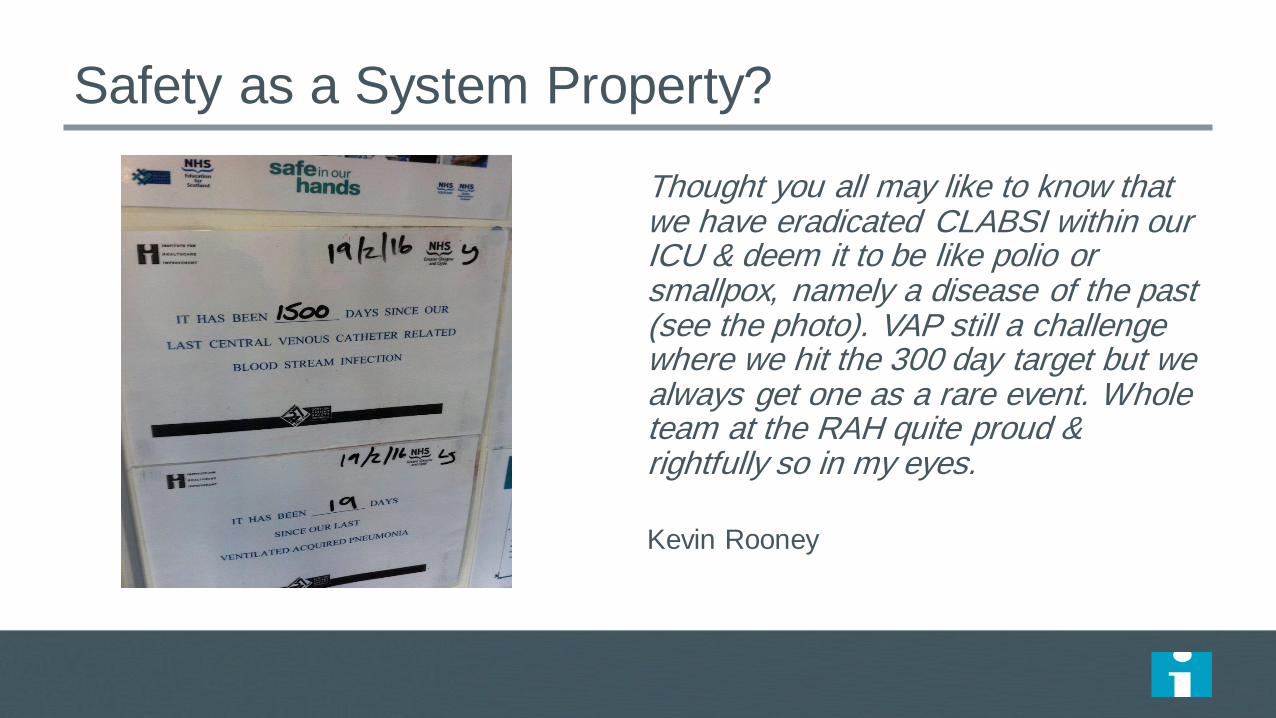
Safety as a System Property?
Thought you all may like to know that we have eradicated CLABSI within our ICU & deem it to be like polio or smallpox, namely a disease of the past (see the photo). VAP still a challenge where we hit the 300 day target but we always get one as a rare event. Whole team at the RAH quite proud & rightfully so in my eyes.
Kevin Rooney

Quality
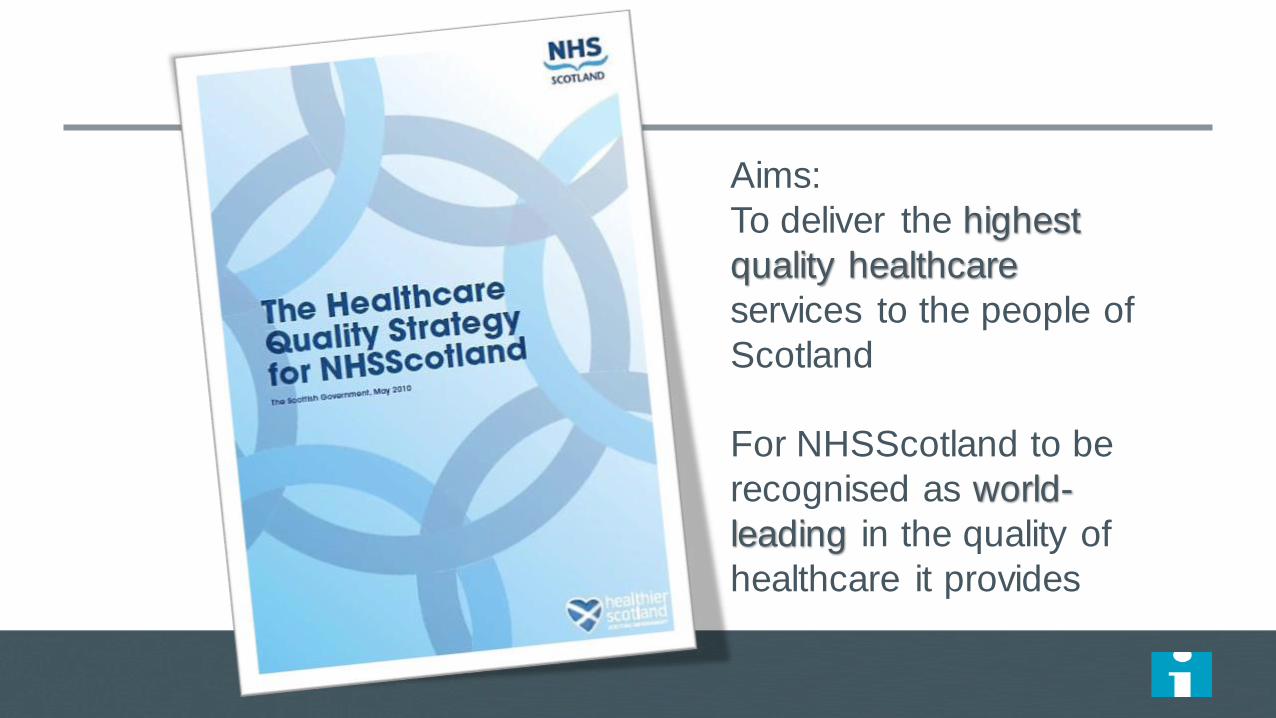
Aims:
To deliver the highest
quality healthcare
services to the people of
Scotland
For NHSScotland to be
recognised as world-
leading in the quality of
healthcare it provides

“Safe, effective and
person-centred
care which supports
people to live as
long as possible at
home or in a homely
setting.”

3 Quality Ambitions
No avoidable injury or harm from the healthcare they receive, and
that they are cared for in an appropriate, clean and safe
environment at all times.
The most appropriate treatments, interventions,
support and services will be provided at the right time to
everyone who will benefit, with no wasteful or harmful
variation.
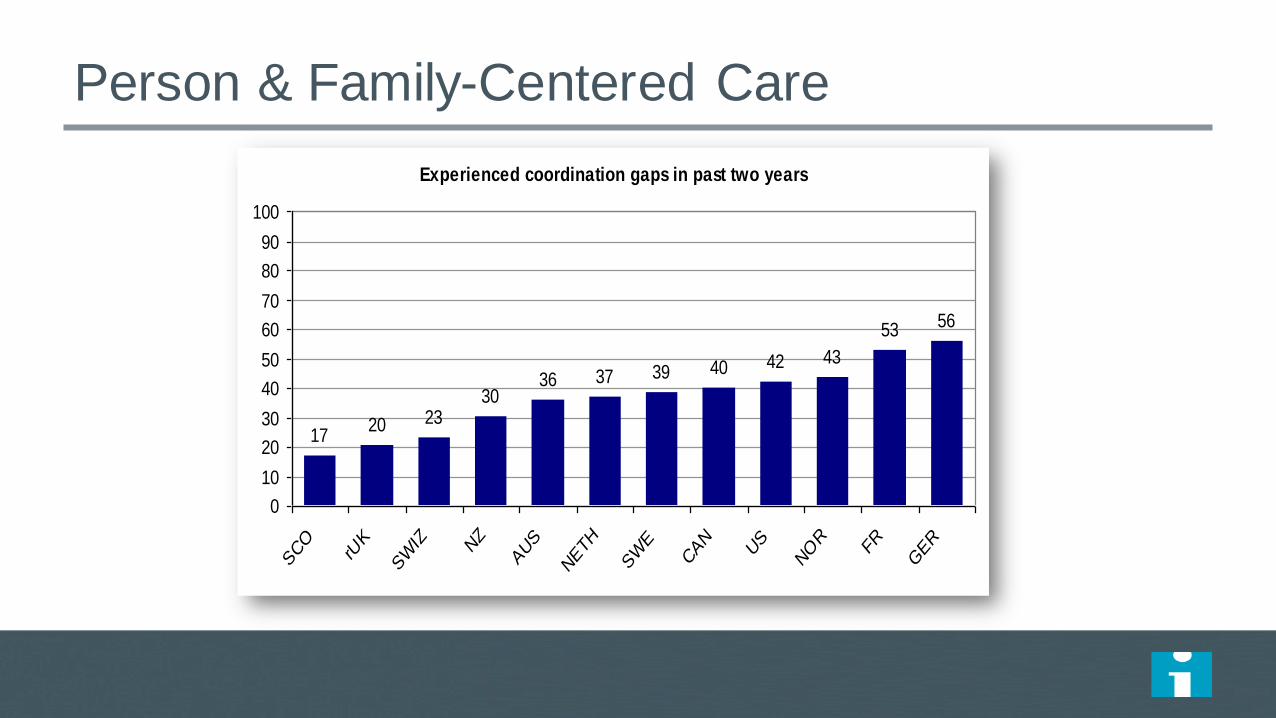
Person & Family-Centered Care
Experienced coordination gaps in past two years
1720 23
3036 37 39 40 42 43
53 56
0
10
20
30
40
50
60
70
80
90
100
SCO
rUK
SW
IZ NZ
AUS
NETH
SW
ECAN
US
NOR
FR
GER
Charts from 2011 Commonwealth Fund Survey of Sicker Adults

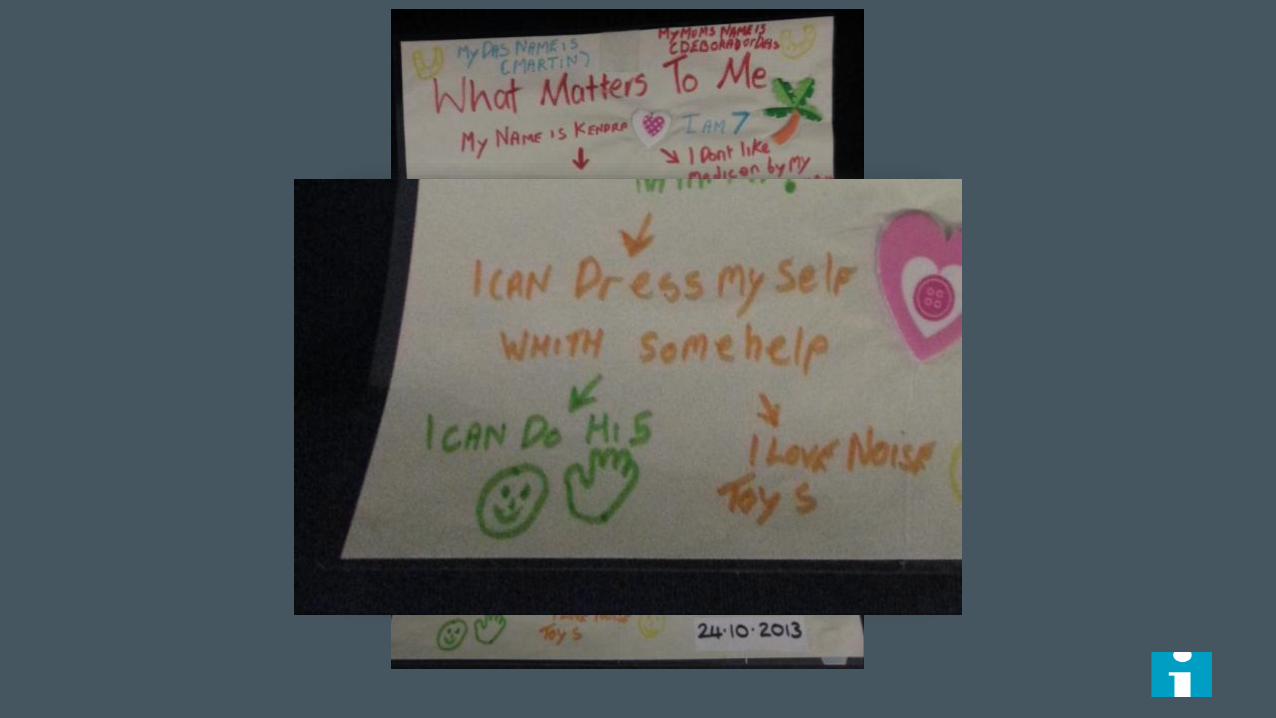
Person & Family-Centered Care

Person & Family-Centered Care
Quality Strategy built around patient priorities
Person Centered Care collaborative
Self management programme
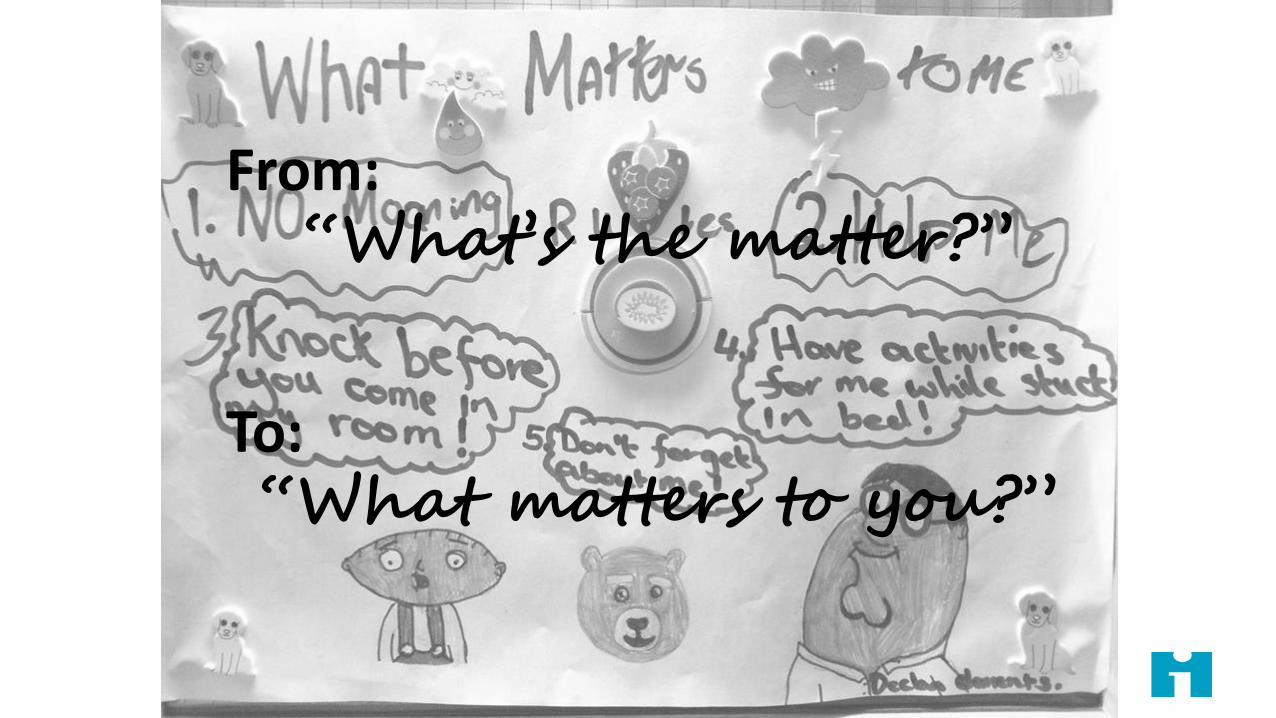
From: “What’s the matter?”
To: “What matters to you?”


Kendra 7 year old Severe autism

Kendra

Changing
culture

NEW PUBLIC
MANAGEMENT
Targets,
sanctions,
inspections
QUALITY
IMPROVEMENT
MOBILISING
SOCIAL ACTION Ou
tco
mes
Time
Getting to the Third Curve
Sharing power
Keeping power
Ceding power
PERFORMANCE MANAGEMENT
QUALITY IMPROVEMENT
CO-PRODUCTION
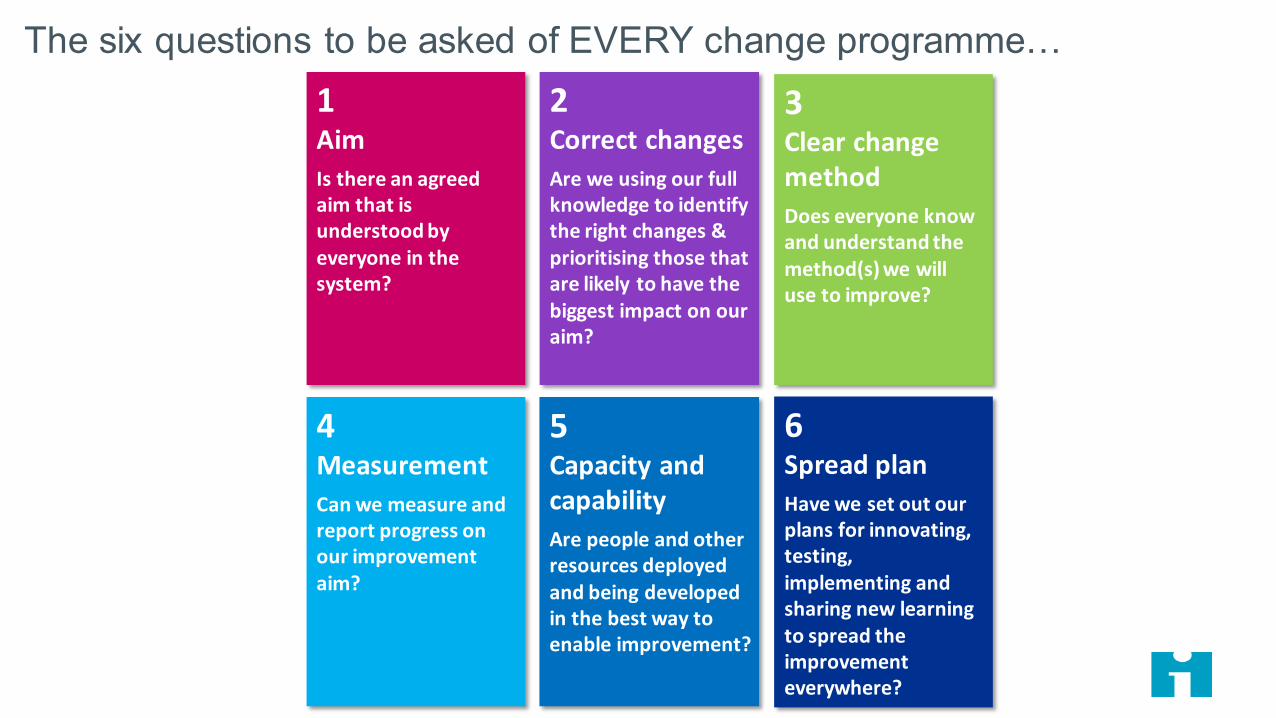
The six questions to be asked of EVERY change programme…
1 Aim
Is there an agreed aim that is understood by everyone in the system?
2 Correct changes
Are we using our full knowledge to identify the right changes & prioritising those that are likely to have the biggest impact on our aim?
3 Clear change method
Does everyone know and understand the method(s) we will use to improve?
4 Measurement
Can we measure and report progress on our improvement aim?
5 Capacity and capability
Are people and other resources deployed and being developed in the best way to enable improvement?
6 Spread plan
Have we set out our plans for innovating, testing, implementing and sharing new learning to spread the improvement everywhere?
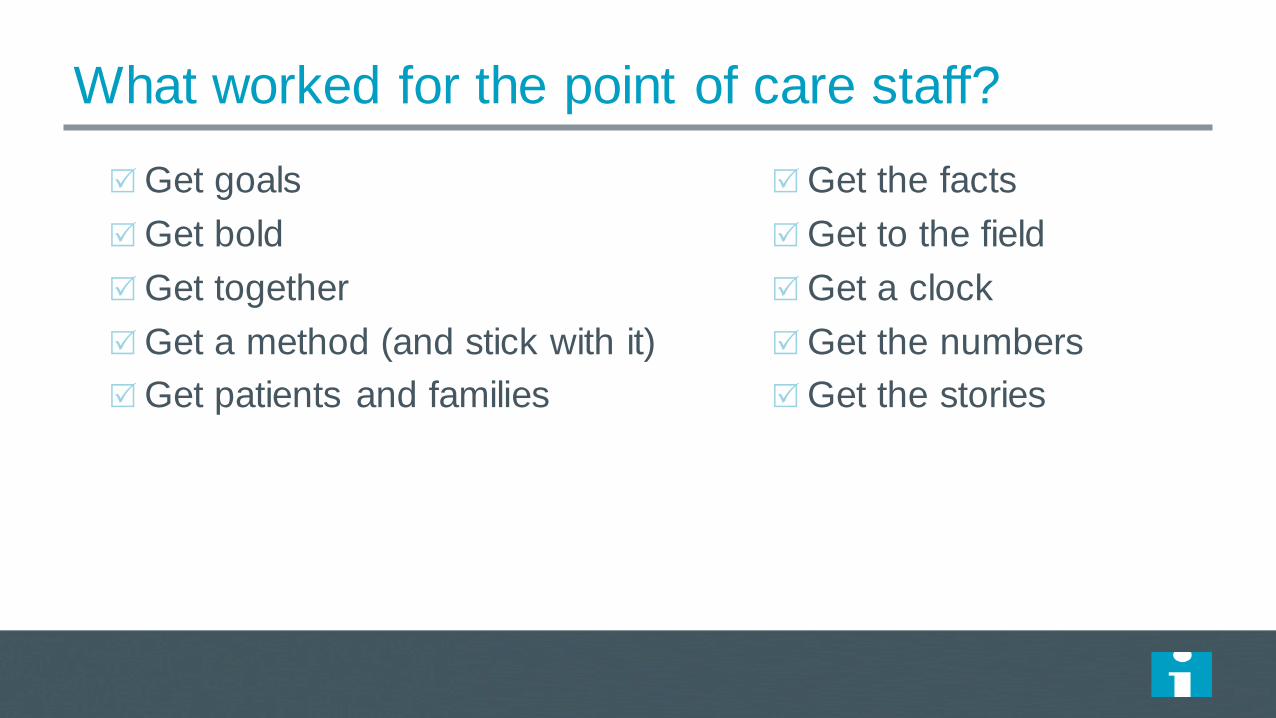
What worked for the point of care staff?
Get goals
Get bold
Get together
Get a method (and stick with it)
Get patients and families
Get the facts
Get to the field
Get a clock
Get the numbers
Get the stories

“The Scottish Patient Safety Programme
marks Scotland as leader,
second to no nation on earth,
in its commitment to reducing
harm to patients
dramatically and continually.”
Donald M Berwick

Discussion Questions
• What do you think were the keys to success in Scotland
and what could they have done differently (and better)?
• What elements of the Scottish approach might work in
your system?
New Rules for Radical
Redesign in Health Care
IHI’s “Leadership Alliance”

Radical Redesign Principles –
IHI Leadership Alliance
1. Change the Balance of Power
2. Standardize What Makes Sense
3. Customize to the Individual
4. Promote Wellbeing
5. Create Joy in Work
6. Make It Easy
7. Move Knowledge, Not People
8. Collaborate/Cooperate
9. Assume Abundance
10. Return the Money

Alaska Native People Shaping Health Care • SCF - 2011 Baldrige Winner • CEO 2004 McArthur Genius Winner
Copyright © 2011 Southcentral Foundation. All Rights Reserved. NOTICE: Unless otherwise indicated, this work represents copyrighted material protected by United States and international law. This work may not be used, reproduced, downloaded, disseminated, published, transferred or transmitted, in whole or in part, in any form or by any means, electronic or mechanical, including photocopying, recording or information storage and retrieval, except with the express written permission of the publisher. This work may not be edited, altered, or otherwise modified, in whole or in part, except with the express written permission of the publisher.
Design: Cooperate

“NUKA” CARE SYSTEM
Southcentral Foundation
Anchorage, Alaska, USA
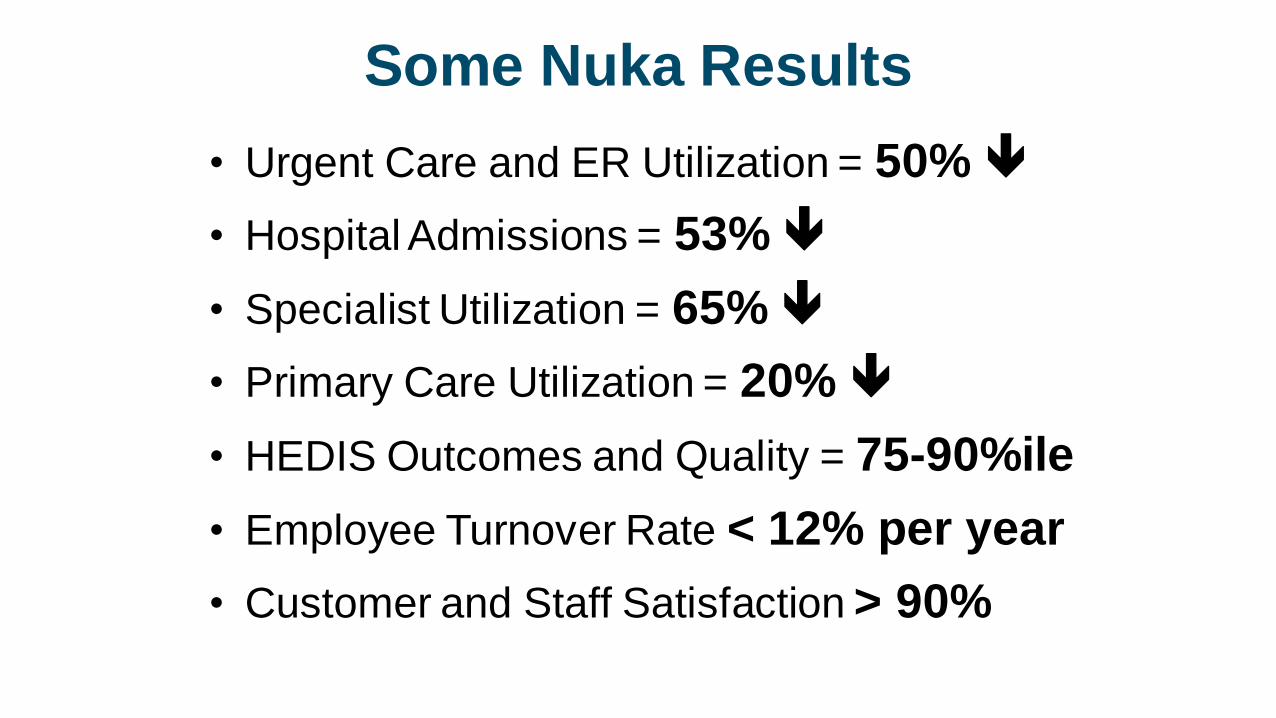
Some Nuka Results
• Urgent Care and ER Utilization = 50%
• Hospital Admissions = 53%
• Specialist Utilization = 65%
• Primary Care Utilization = 20%
• HEDIS Outcomes and Quality = 75-90%ile
• Employee Turnover Rate < 12% per year
• Customer and Staff Satisfaction > 90%

$144,258,912
$-
$20,000,000
$40,000,000
$60,000,000
$80,000,000
$100,000,000
$120,000,000
$140,000,000
$160,000,000
Jul-0
6A
ug
-06
Sep
-06
Oct-
06
Nov-0
6D
ec-0
6Jan-0
7F
eb-0
7M
ar-
07
Apr-
07
Ma
y-07
Jun-0
7Jul-0
7A
ug
-07
Sep
-07
Oct-
07
Nov-0
7D
ec-0
7Jan-0
8F
eb-0
8M
ar-
08
Apr-
08
Ma
y-08
Jun-0
8Jul-0
8A
ug
-08
Sep
-08
Oct-
08
Nov-0
8D
ec-0
8Jan-0
9F
eb-0
9M
ar-
09
Apr-
09
Ma
y-09
Jun-0
9Jul-0
9A
ug
-09
Sep
-09
Oct-
09
Nov-0
9D
ec-0
9Jan-1
0F
eb-1
0M
ar-
10
Apr-
10
Ma
y-10
Jun-1
0Jul-1
0A
ug
-10
Sep
-10
Oct-
10
Nov-1
0D
ec-1
0Jan-1
1F
eb-1
1M
ar-
11
Apr-
11
Ma
y-11
Jun-1
1Jul-1
1A
ug
-11
Sep
-11
Oct-
11
Nov-1
1D
ec-1
1
RIE + Blackbelt Combined Total Financial Benefit Trend Cumulative Through December 31, 2011 Design: Standardize What Makes Sense
Denver Health
Lean Production Results:
$180 Million Saved

105
Denver Health
Outcomes: #1 IN UHC

NEJM : 364: 23, June 9-2011, Arora S, Thornton K, Murata G
Design: Move Knowledge, Not People
Project ECHO

Project ECHO

ECHO Treatment Outcomes:
Equal to University Medical Center
Hepatitis C Outcome ECHO UNMH P-value
N=261 N=146
Minority 68% 49% P<0.01
SVR (Cure) Genotype 1 50% 46% NS
SVR (Cure) Genotype 2/3 70% 71% NS
SVR=sustained viral response
Arora S, Thornton K, Murata G. NEJM 2011; 364:23
Project ECHO

PEEK:
Telemedicine
at Scale
Design: Move Knowledge, Not People

PEEK: 10,000
Children Screened
per Week by
Teachers in Kenya
Design: Assume Abundance

DHAT Program:
Could Meet All Dental Health
Needs in Alaska’s Villages
with 70 DHAT’s
Alaska Dental Health AideTherapists - “DHAT” 111
Design: Assume Abundance

Introducing Christian
The Old Way
• Ryhov Hospital, Jönköping, Sweden had traditional
hemodialysis and peritoneal dialysis center.
• In 2005, a patient, Christian, asked about doing it himself.
Design: Change the Balance of Power

Co-Design of Dialysis Care
113
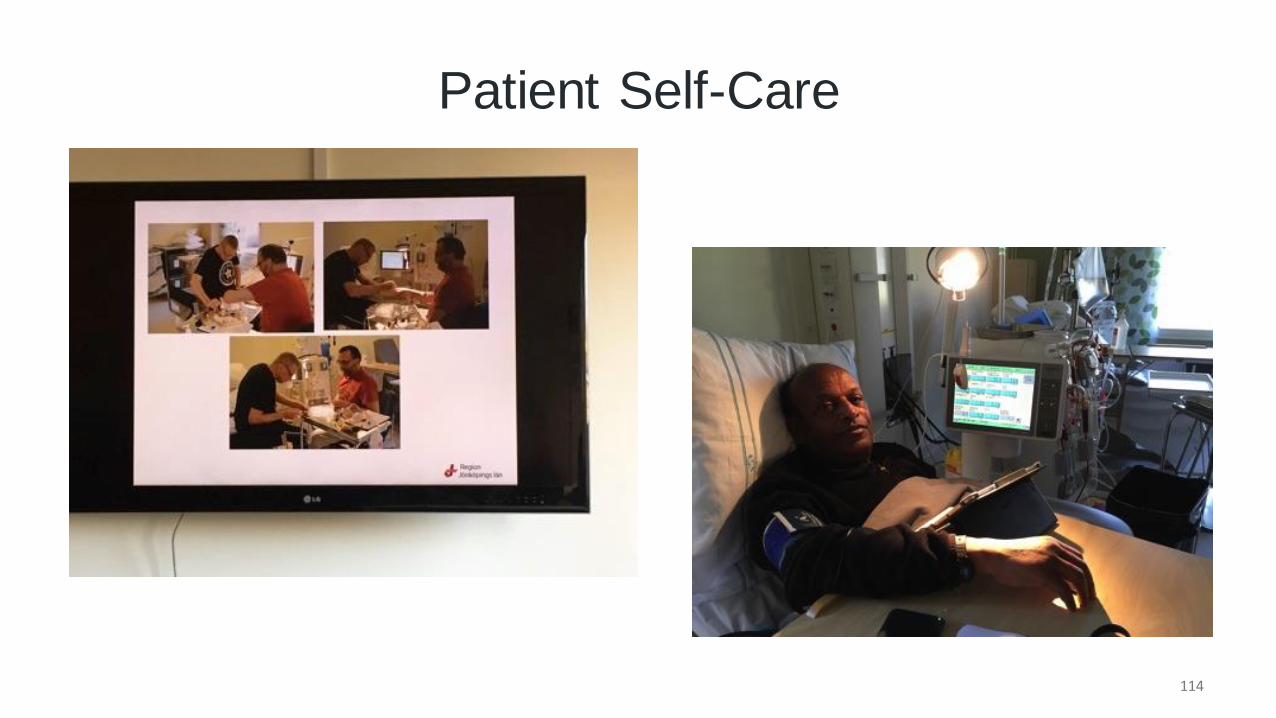
Patient Self-Care
114

How Far Can We Go?
115

Self-Dialysis
• Now 60% of Ryhov Hospital dialysis patients are
on self-dialysis
• Their aim: 75% of patients
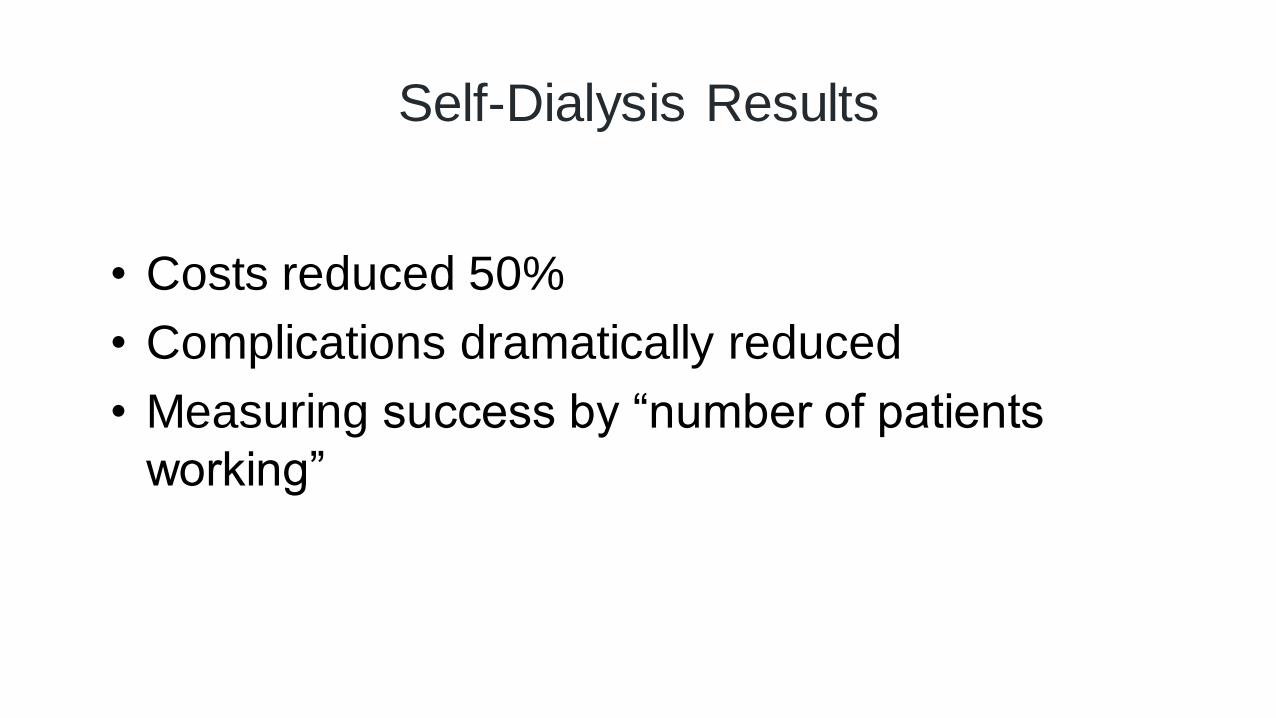
Self-Dialysis Results
• Costs reduced 50%
• Complications dramatically reduced
• Measuring success by “number of patients
working”

420 Students:
20% of pupils in deciles 1-3
35% of pupils in deciles 4-7
45% of pupils in deciles 8 and 10
St Ninian’s Primary School Stirling, Scotland
At the Start:
45% of Pupils
Were Overweight
Design: Promote Wellbeing

“Fit to play, fit to learn”
St Ninians Primary School
Stirling Scotland
Ms Elaine Wyllie [email protected]
“The Daily Mile”
Three years later,
and, of 57 Primary
One children, not
one is overweight

2. Understand unique impediments to joy
locally
3. Commit to share responsibility at all levels
4. Use validated approaches to improve joy
1. Ask providers “What Matters to you?”
Outcome: ↑ Patient experience
↑ Organizational performance
↓ Staff burnout
Design: Joy in Work

Design: Joy in Work
70%
80%
90%
100%
Ma
y-1
4
Ju
l-1
4
Se
p-1
4
Nov-1
4
Ja
n-1
5
Ma
r-15
Ma
y-1
5
Ju
l-1
5
Se
p-1
5
Nov-1
5
Ja
n-1
6
Ma
r-16
Ma
y-1
6
Ju
l-1
6
Se
p-1
6
Nov-1
6
Ja
n-1
7
Ma
r-17
Agree + Strongly agree

Radical Redesign (from the inside out)
Discussion Questions
• What radical redesign do you need in your system?
• What might be the redesign priorities?