(practical) perspectives on health systems performance...
TRANSCRIPT

(Practical) Perspectives on Health Systems
Performance Assessment
Josep Figueras Marina Karanikolos Jon Cylus Oslo, 14th March 2018
Policy Uses or Abuses? Norwegian HS in a Comparative Perspective

The European Observatory on Health Systems and Policies
The European Observatory is a three-way partnership building
bridges both across borders and between policy makers and
researchers.
International Agencies
WHO Europe (host)
European Commission
World Bank
National and Regional Authorities
Austria Belgium Finland Ireland Norway Slovenia Sweden
Switzerland
United Kingdom
Veneto Region of Italy
French Union of Health Insurance
Funds
Academia
London School of Economics and
Political Science (LSE)
London School of Hygiene & Tropical Medicine (LSHTM)
(Technical University Berlin
- TUB) *
(* ) Hub

Functions
3
Country monitoring
• Health Systems in Transtion (HiT) series
• Health systems Policy Monitor (HSPM)
Policy analysis
• Studies (OSS, OUP, CUP)
• Policy briefs
• Eurohealth
• Health Policy
• BMJ etc.
Performance assessment
• Methodology
• Health Systems Performance Asessment (HSPA)
Dissemination
• Publishing
• Web
• e-newsletter
• Policy dialogues
• Summer School
Engaging with policy-makers Knowledge Brokering

What is the best health system?
Depends who is measuring & how?

European Observatory on Health Systems and Policies
Outline
• HSPA objectives and framework
– For what? The holy grail? Reaching consensus?
• HSPA in practice
– Key questions
– Policy Uses (and abuses)
• The Norwegian health system: a comparative view
• Some key lessons for comparative HSPA

European Observatory on Health Systems and Policies
Outline
• HSPA objectives and framework
–Who? For what? Holy grail? Consensus?
• HSPA in practice
– Key questions
– Policy Uses (and abuses)
• The Norwegian health system: a comparative view
• Some key lessons for comparative HSPA

European Observatory on Health Systems and Policies
HSPA: in search of the holy grail
European Observatory on Health Systems and Policies
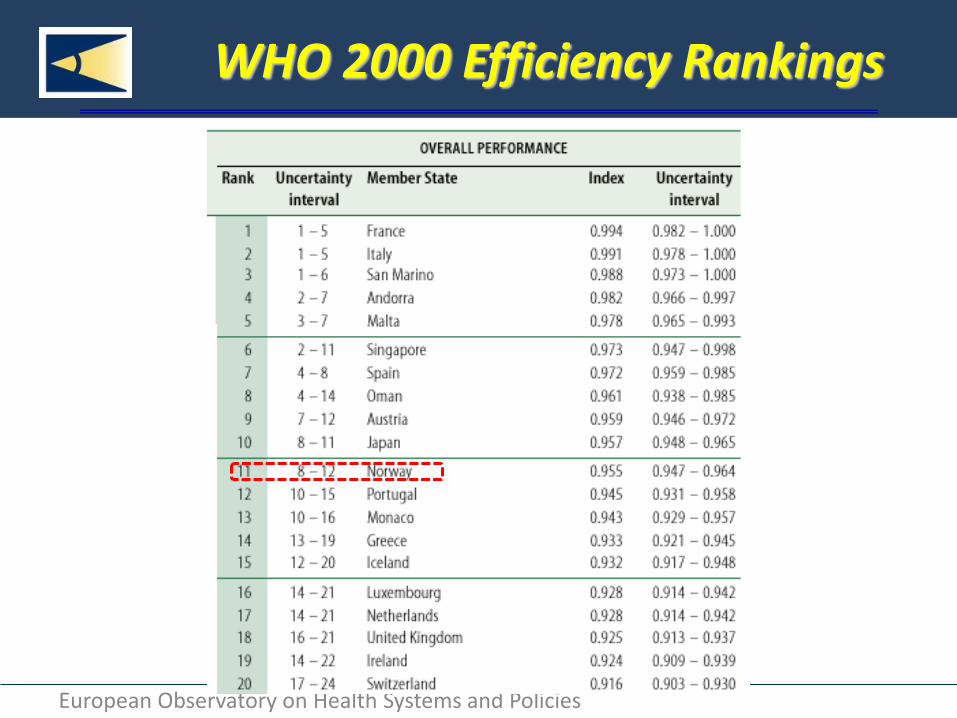
WHO 2000 Efficiency Rankings

Health
Health care system performance How does the health system perform?
What is the level of quality of care and access to services? What does this performance cost?
Non-medical determinants of health
Demographic, economic and social context
Health care resources and activities
Quality Access Cost/expenditure

Stated objectives
Financial protection and equity
User experience and access
Health and health service outcomes and quality
Efficiency
Transparency & accountability
Access
Effectiveness
Resilience

www.hspm.org
11
• An international network of prestigious national institutions
• Monitoring online health reforms and policy developments at national level
• Comparing key aspects of health systems

European Observatory on Health Systems and Policies
Outline
• HSPA objectives and framework
– For what? The holy grail? Reaching consensus?
• HSPA in practice
– Key questions
– Policy Uses (and abuses)
• The Norwegian health system: a comparative view
• Some key lessons for comparative HSPA

European Observatory on Health Systems and Policies
HSPA in practice: key questions
1. What do we want to measure?
Phenomenon / domain under assessment
2. Are these the right indicators?
Are we measuring them well?
Does the indicator measure the domain under assessment?
Conceptual clarity? Role of values & ‘trade offs’?
Data quality (validity, reliability) and availability?
Methodological approach (e.g.)?
Risk adjustment, composite indicators (weighting?)
Absolute vs relative levels of performance (against resources)?

European Observatory on Health Systems and Policies
HSPA in practice: key questions
3. What do the differences mean?
Policy interpretation / causal attribution (e.g.)?
Role of health determinants?
Accountability relationship?
4. What can we do about it?
Policy intervention (e.g.)?
PHC, Hospitals, Governance. Access,…
Policy levers (e.g.)
Public reporting / benchmarking
Incentives e.g. financial, payment
Regulatory tools e.g. targets
Consumer choice

European Observatory on Health Systems and Policies 15
European Health Consumer Index Total Scores 2016
Assessing Performance Beware of Bias & Vested Interests

European Observatory on Health Systems and Policies
European Health Consumer Index
Cylus et al., BMJ (2016) on EHCI 2015:
• Arbitrary scores are given to indicators
• The point system does not reflect what matters to citizens
• There is no apparent basis for selecting the indicators
“We should just ignore the findings of the EuroHealth Consumer Index”

European Observatory on Health Systems and Policies
Assessing Performance Beware of Methodological Complexities
European Observatory on Health Systems and Policies
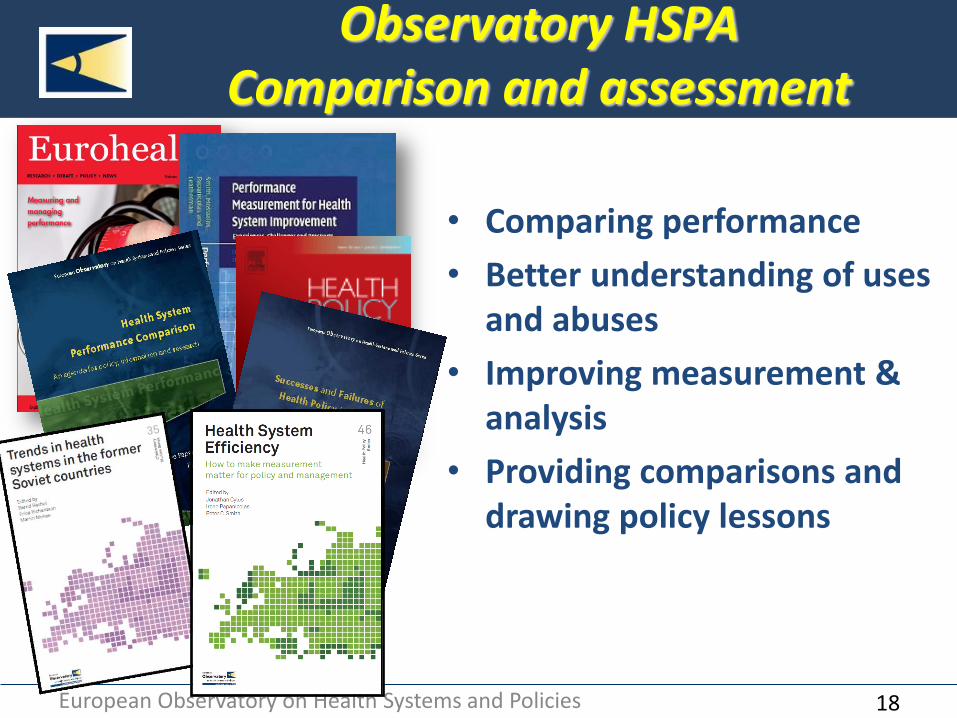
Observatory HSPA Comparison and assessment
18
• Comparing performance
• Better understanding of uses and abuses
• Improving measurement & analysis
• Providing comparisons and drawing policy lessons

European Observatory on Health Systems and Policies 19
• Performance measurement for health system improvement (2009)
• Health systems performance comparison – an agenda for policy, information and research (2012)
• Successes and Failures of Health Policy in Europe. Four decades of divergent trends and converging challenges (2013)
• Methodological papers in Health Policy (2013)
• Health systems comparative trends NIS (2014)
• Health Systems Efficiency – How to make measurement matter for policy and management (2017)
• Health system comparative trends in EU/EFTA
• Comparing Population health outcomes
Observatory HSPA Comparison and assessment


European Observatory on Health Systems and Policies
Outline
• HSPA objectives and framework
– For what? The holy grail? Reaching consensus?
• HSPA in practice
– Key questions
– Policy Uses (and abuses)
• The Norwegian health system: a comparative view
• Some key lessons for comparative HSPA
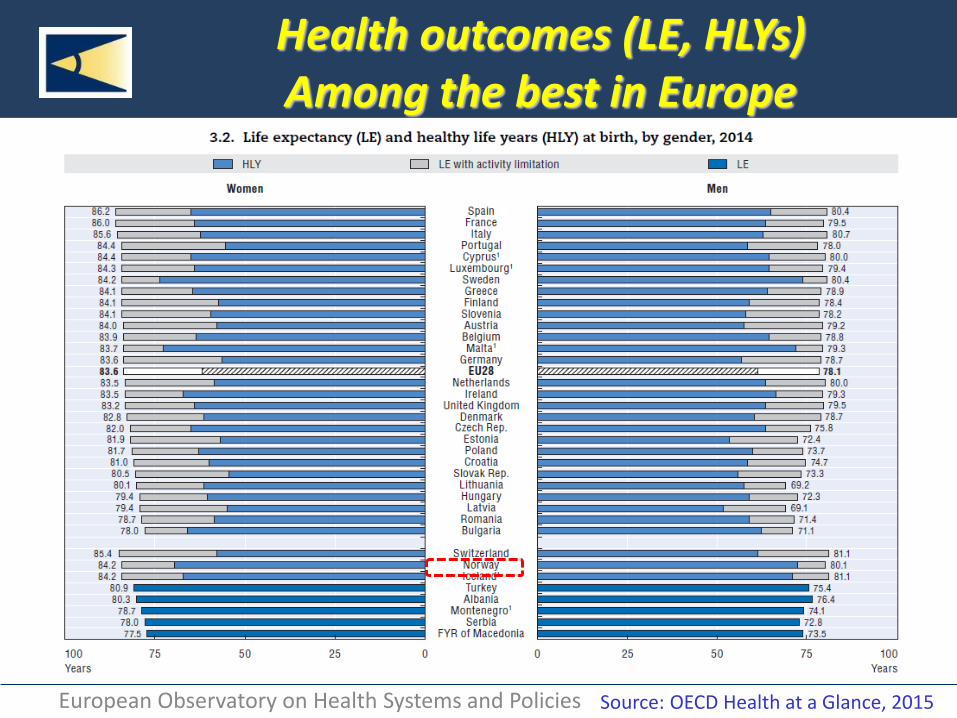
European Observatory on Health Systems and Policies Source: OECD Health at a Glance, 2015
Health outcomes (LE, HLYs) Among the best in Europe

European Observatory on Health Systems and Policies 19/03/2018 24
Burden of disease
IHME, Global Burden of Disease study 2016
24

European Observatory on Health Systems and Policies 19/03/2018 25
Change in selected causes
25
0
500
1000
1500
2000
2500
3000
3500
4000
4500
5000
19
90
19
91
19
92
19
93
19
94
19
95
19
96
19
97
19
98
19
99
20
00
20
01
20
02
20
03
20
04
20
05
20
06
20
07
20
08
20
09
20
10
20
11
20
12
20
13
20
14
20
15
20
16
DA
LYs
per
10
0,0
00
Change in DALYs, 1990-2016, Norway (Source: GBD 2016)
Alzheimer and other dementias IHD Stroke Lung cancer
IHME, Global Burden of Disease study 2016

European Observatory on Health Systems and Policies 19/03/2018 26
Burden of behavioural risk factors
26 IHME, Global Burden of Disease study 2016

www.healthobservatory.eu 27
Act on Health Determinants Global Burden of Disease by Risk Factors
• IHME, Global Burden of Disease study 2016

European Observatory on Health Systems and Policies
0 100 200 300 400
SwitzerlandFrance
NorwayIceland
SpainLuxembourg
ItalyNetherlands
SwedenBelgium
CyprusDenmark
AustriaFinlandIreland
MaltaUnited Kingdom
GermanyPortugalSlovenia
GreeceEU average
PolandCzech Republic
CroatiaEstonia
SlovakiaHungary
LithuaniaLatvia
BulgariaRomania
Amenable mortality, DSR per 100,000, 2000 and 2015 (or latest)
2000
2015
0 50 100 150 200
SwedenMalta
CyprusNorwayIceland
SwitzerlandItaly
PortugalIreland
LuxembourgSpain
United KingdomNetherlands
FinlandFrance
GermanyAustria
DenmarkEU average
GreeceBelgium
Czech RepublicLatvia
SloveniaEstonia
BulgariaSlovakia
LithuaniaPolandCroatia
RomaniaHungary
Preventable mortality, DSR per 100,000, 2000 and 2015 (or latest)
2000
2015
Health outcomes (AM, PM) Among the best in Europe
Calculations by European Observatory, 2017

European Observatory on Health Systems and Policies
Unmet need for health services is low with negligible inequalities
Source: Eurostat (2014), EU-SILC

European Observatory on Health Systems and Policies 30
Source: OECD 2013
Private out-of-pocket is relatively low

European Observatory on Health Systems and Policies
But ….spending levels Among the highest in Europe
0 1000 2000 3000 4000 5000 6000 7000 8000
Western EuropeSwitzerland
LuxembourgNorwayAndorra
GermanyIreland
NetherlandsSwedenAustria
DenmarkBelgium
FranceUnited Kingdom
IcelandFinland
San MarinoMalta
MonacoItaly
SpainIsrael
PortugalGreeceCyprusTurkey
Central and south-eastern EuropeSlovenia
Czech RepublicSlovakiaHungaryEstonia
LithuaniaPolandCroatia
BulgariaLatviaSerbia
Bosnia and HerzegovinaRomania
MontenegroThe former Yugoslav Republic of Macedonia
Albania
Current Health Expenditure (CHE) per Capita in PPP
Source: WHO Euro (2014) HFA
European Observatory on Health Systems and Policies 19/03/2018 32
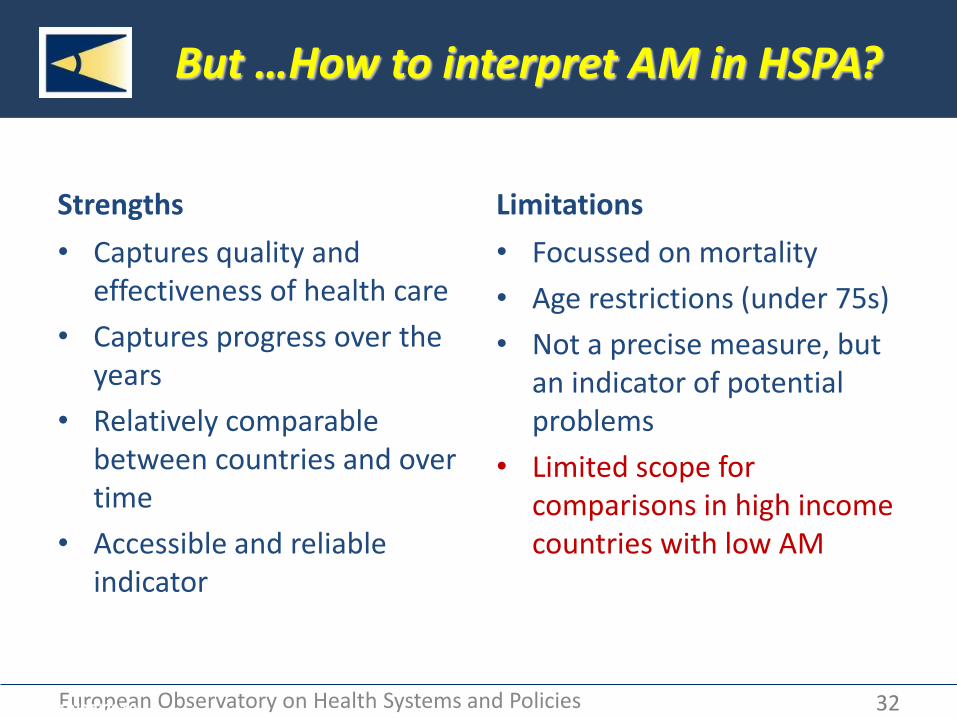
But …How to interpret AM in HSPA?
Strengths
• Captures quality and effectiveness of health care
• Captures progress over the years
• Relatively comparable between countries and over time
• Accessible and reliable indicator
Limitations
• Focussed on mortality
• Age restrictions (under 75s)
• Not a precise measure, but an indicator of potential problems
• Limited scope for comparisons in high income countries with low AM
32

European Observatory on Health Systems and Policies
While Unmet need is low… Waiting times are fairly high for elective surgeries

European Observatory on Health Systems and Policies 34
34
65
45
6266
7278
45
57
93
70
57
0
25
50
75
100
AU
S
CA
N
FR
GE
R
NE
TH
NZ
NO
R
SW
E
SW
IZ UK
US
Percent*
14
33
17 16
5 5
28 25
28
19
AU
S
CA
N
FR
GE
R
NE
TH
NZ
NO
R
SW
E
SW
IZ UK
US
Same- or next-day appointment
Waited six days or more
Source: 2010 Commonwealth Fund International Health Policy Survey in Eleven Countries.
And waiting time for doctors or nurses when sick or needing care is fairly high

European Observatory on Health Systems and Policies
There are some challenges with Patient Experience
35
0 10 20 30 40 50 60 70 80 90 100
Japan¹
Poland¹ ²
Sweden²
Korea¹
Norway²
Canada²
United States²
OECD18
France²
United Kingdom²
Israel¹
Germany²
Switzerland²
Estonia¹
New Zealand²
Portugal¹
Australia²
Netherlands²
Belgium¹
Doctor spending enough time with patient (%), 2016 or latest
Source: OECD Health Statistics 2017

European Observatory on Health Systems and Policies
FR
NO
0
500
1,000
1,500
2,000
2,500
3,000
3,500
4,000
4,500
5,000
0 50 100 150 200 250 300
CH
E (P
PP
per
cap
ita)
Amenable mortality (ASR per 100,000)
Health expenditure (CHE) vs Amenable mortality (2015), EU + EEA
Norway spends a lot more on health than other countries with similar amenable mortality rates
Are we getting value for money? Amenable Mortality vs Expenditure
Calculations by OBS, source: Eurostat 2018

European Observatory on Health Systems and Policies 37
Are we getting value for money? HAQ Index 2015
Source: Barber et al 2017

European Observatory on Health Systems and Policies 38
Are we getting value for money? HAQ Index (Observed vs ‘Frontier’)
Healthcare Access and Quality (HAQ) Index, GBD 2015
Graph shows the gap between what countries could have achieved given their development level vs. what they did achieve in 2015
Should Norway have better outcomes given its level of development (and spending)?
Source: Barber et al 2017

European Observatory on Health Systems and Policies

European Observatory on Health Systems and Policies
Why might a country appear (in)efficient?
Lowest health expenditure of all OECD countries
Life expectancy in 2010 of 74.3 years…
Model predicts around 70 years
Among the highest AMI and stroke mortality in hospital
Cervical screening rates are among lowest
Cylus et al, 2017

European Observatory on Health Systems and Policies
Primary Health Care Large variation in Effectivness
Source: Kringos et al 2013

European Observatory on Health Systems and Policies Source: Health at a Glance OECD (2016)
Avoidable Admissions for Chronic Ambulatory Care Sensitive Conditions 2013
Primary Health Care Large variation in Effectivness

European Observatory on Health Systems and Policies
43
* Or nearest year; data from 2012 in Switzerland, US and New Zealand. Data from 2011 in Netherlands. Data are for individuals aged 15 years and older, reflecting age- and sex-adjusted rates. ‘OECD median’ reflects the median of 33 OECD countries.
Source: OECD Health Data 2017.
COPD Hospital Admissions in Adults, 2013*
101 120
164
192 213 217 222
243 245
324 326
0
50
100
150
200
250
300
350
SWIZ FRA NETH SWE UK US NOR CAN GER AUS NZ
Age-sex standardized rates per 100,000
OECD MEDIAN

European Observatory on Health Systems and Policies
Proportion of patients who visited an emergency department because primary care was not available, 2011-13
Source: OECD, QUALICOPC

European Observatory on Health Systems and Policies
45
Human resources (Source: OECD Health Statistics 2017)
AT
DK
FI DE
GR
NL
NO
SE
CH
TUR
UK
0
2
4
6
8
10
12
14
16
18
20
0 1 2 3 4 5 6 7
Pra
ctic
ing
nu
rses
Practicing physicians
Nurses vs physicians per 1,000 population (2015 or latest), OECD

European Observatory on Health Systems and Policies
Low number of consultations per doctor (OECD Health statistics 2017)
46
7140
5385
4651
3810
3414
3303
3179
3024
3010
2526
2416
2407
2360
2295
2254
2101
2028
2020
2000
1995
1983
1870
1845
1744
1682
1624
1619
1487
1363
1310
1295
1230
1147
1071
1000
996
976
692
0
1000
2000
3000
4000
5000
6000
7000
8000
Annual consultations per doctor

European Observatory on Health Systems and Policies
Outpatient contacts per person relatively low (OECD Health statistics 2017)
0 2 4 6 8 10 12
DEU
TUR
NLD
ESP
BEL
ITA
AUT
FRA
ISR
ISL
LUX
IRL
GBR
DNK
NOR
FIN
PRT
GRC
CHE
SWE
CYP
Outpatient contacts per person per year

European Observatory on Health Systems and Policies
48
*2014 data; **2012 data; ***2010 data. Length of inpatient stays reflect all hospitals, except for Canada and the Netherlands, data for which reflect curative care average length of stay (excluding rehabilitative care, long-term care and palliative care). Discharges reflect total number for all causes.
Source: OECD Health Data 2017.
Hospital length of stay is falling but discharge rates are high, 2000-2015*
0
50
100
150
200
250
300
2000 2005 2010 2015
GER (255)
AUS (174*)
SWIZ (170)
NOR (168)
FR (163)
SWE (153)
NZ (150*)
UK (128)
US (126***)
NETH (119**)
CAN (84)
Discharges
0
2
4
6
8
10
12
14
2000 2005 2010 2015
FRA (10.1*)
GER (9.0)
SWIZ (8.4)
CAN (7.4)
UK (7.0)
NZ (6.8*)
NOR (6.7)
NETH (6.2)
US (6.1*)
SWE (5.9)
AUS (5.5*)
Average Length of Inpatient Stay
Days Per 1,000 2015 data: 2015 data:

European Observatory on Health Systems and Policies
Curative care occupancy rates high
0
10
20
30
40
50
60
70
80
90
100N
eth
erla
nd
s
FYR
M
Liec
hte
nst
ein
Turk
ey
Slo
ven
ia
Slo
vaki
a
Esto
nia
Latv
ia
Luxe
mb
ou
rg
Hu
nga
ry
Cro
atia
Gre
ece
Lith
uan
ia
Cyp
rus
Cze
ch R
epu
blic
Fran
ce
Spai
n
Po
rtu
gal
Ital
y
Bel
giu
m
Ger
man
y
No
rway
Swit
zerl
and
Au
stri
a
Un
ited
Kin
gdo
m
Irel
and
(OECD Health statistics 2017)

European Observatory on Health Systems and Policies
Is Norway’s health system inefficient? The production process in hospital care
(Cylus et al 2017)

European Observatory on Health Systems and Policies
Is there evidence of an allocative efficiency problem?
• Data suggest possible poor use (overuse?) of hospital resources, but is it true?
• If so, is it:
– Due to specialists primarily being in urban areas?
– Due to GP copayments?
– Due to geographic dispersion (e.g. fewer visits per physician)?
– Other reasons?

European Observatory on Health Systems and Policies
52
* Or nearest year; 2014 data for Netherlands, Germany; 2012 data for Switzerland; 2011 data for Canada.
^ OECD median based on data for 28 OECD countries (26 countries based on program data; 2 based on survey data).
Note: US, Switzerland, based on survey data; all other countries based on program data. No data for Sweden.
Source: OECD Health Data 2017.
Breast Cancer Screening Rates, 2015*
Among women 50-69 years
80 79 75 75
72
55 54 52 49 47
0
20
40
60
80
100
US NETH NOR UK NZ AUS GER FR CAN SWIZ
Percent (%) screened
OECD MEDIAN ^

European Observatory on Health Systems and Policies
53
* Or nearest year; data from 2014 for Canada and Australia. No recent data available for New Zealand (since 2007). Current expenditures on pharmaceuticals (prescribed and over-the-counter medicines) and other medical non-durables, per capita, adjusted for current US$ PPPs), representing retail spending of pharmaceuticals delivered outside provider settings. ‘OECD median’ reflects the median of 35 OECD countries.
Source: OECD Health Data 2017.
Pharmaceutical Spending per Capita, 2015*
Adjusted for Differences in Cost of Living
417 474 497 519
617 668
766 786
1,056
1,162
0
100
200
300
400
500
600
700
800
900
1,000
1,100
1,200
NETH NOR UK SWE AUS FR GER CAN SWIZ US
Dollars ($US)
OECD
MEDIAN

European Observatory on Health Systems and Policies
Many other indicators to explore
(Cylus et al 2017)
European Observatory on Health Systems and Policies
• Health outcomes overall are good
• Unmet need is low, equitable access
• Unclear that Norway gets value for money
– Is it to do with poor PHC?
– Is it inevitable given dispersed population?
– Role for telemedicine?
• Could allocative efficiency be improved?
• Could patient experience be better?
In Sum ….

European Observatory on Health Systems and Policies
Value of international HSPA comparisons
• Particularly within wider context of pressures to increase
transparency and accountability to payers/citizens
Measurement Challenges
• Political and ethical
• Conceptual clarity / consensus: domains & frameworks
• Common indicators e.g. efficiency & patient experience
• Methodological comparability: data, quality, validity,..
In Sum ….
European Observatory on Health Systems and Policies
Policy Interpretation and Applicability
• Ensure health systems contextualization
• HSPA measures as screening tools
• Focus on tracer conditions
• Embed with levers of policy improvement
‘To Benchmark or Not To Benchmark that is the question’
Agreeing on a European Approach to HSPA
• Dream or Reality?
In Sum ….

European Observatory on Health Systems and Policies 58
In Sum ….

European Observatory on Health Systems and Policies 59
Objectivity / Neutrality / Facilitation
X

www.healthobservatory.eu 60
www.healthobservatory.eu