practice test - claiborne countyweb.claibornecountyschools.com/math/files/2012/10/... · grade 8...
TRANSCRIPT
Tennessee Comprehensive Assessment Program
TCAP
TNReady — Grade 8 Math Part II
PRACTICE TEST
Student Name
Teacher Name
Tennessee Department of Education
Grade 8 Math, Part II, Subtest 1 Practice Test
1
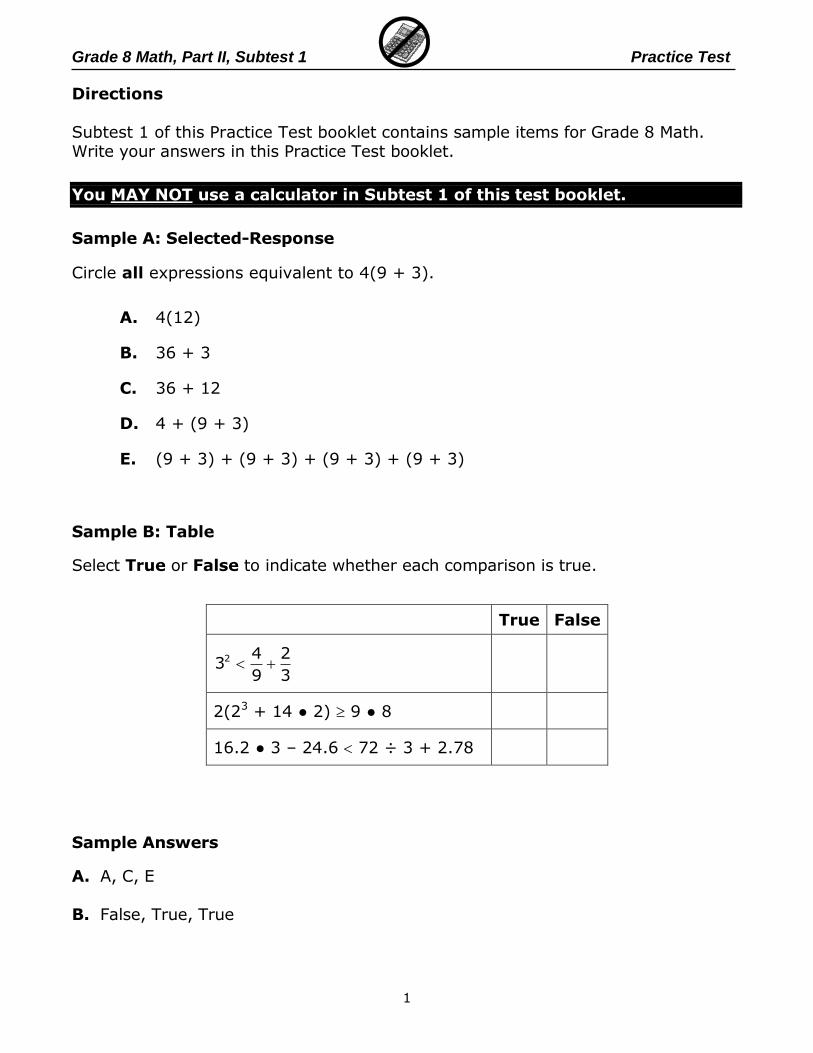
Directions Subtest 1 of this Practice Test booklet contains sample items for Grade 8 Math. Write your answers in this Practice Test booklet.
You MAY NOT use a calculator in Subtest 1 of this test booklet.
Sample A: Selected-Response
Circle all expressions equivalent to 4(9 + 3).
A. 4(12)
B. 36 + 3
C. 36 + 12
D. 4 + (9 + 3)
E. (9 + 3) + (9 + 3) + (9 + 3) + (9 + 3)
Sample B: Table
Select True or False to indicate whether each comparison is true.
True False
2 4 23
9 3
2(23 + 14 ● 2) 9 ● 8
16.2 ● 3 – 24.6 72 ÷ 3 + 2.78
Sample Answers
A. A, C, E B. False, True, True
Grade 8 Math, Part II, Subtest 1 Practice Test
2
110
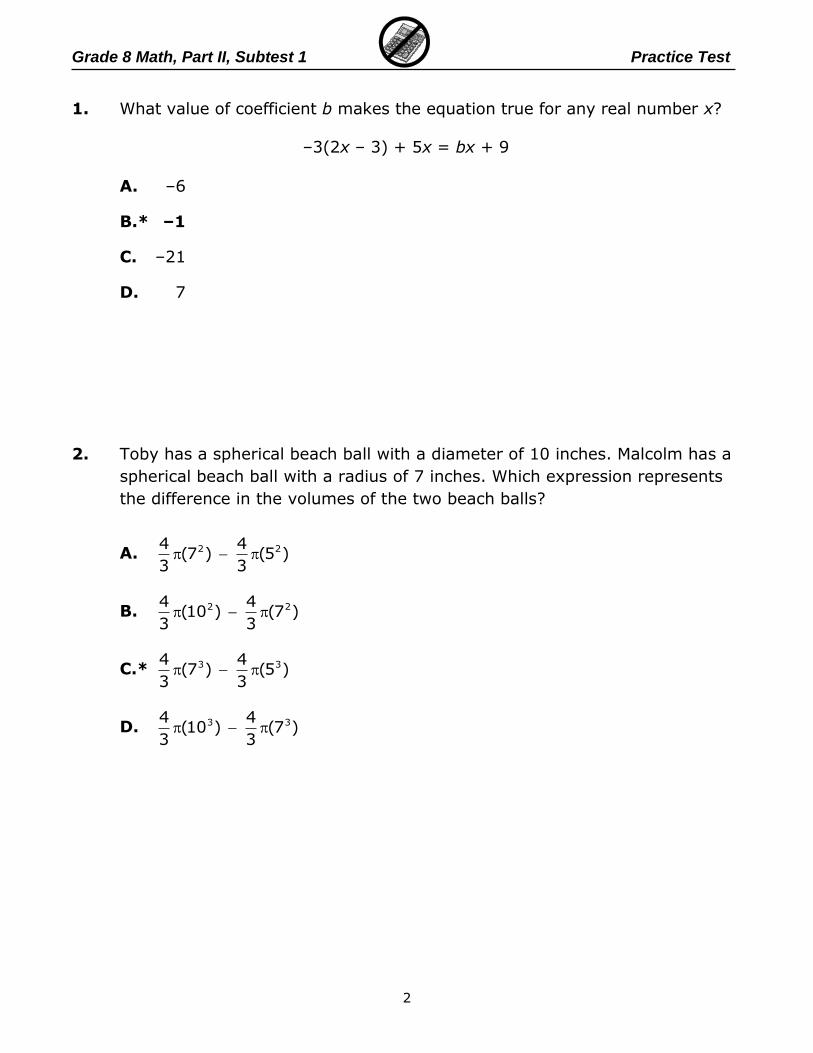
1. What value of coefficient b makes the equation true for any real number x?
–3(2x – 3) + 5x = bx + 9
A. –6
B.* –1
C. –21
D. 7
2073
2. Toby has a spherical beach ball with a diameter of 10 inches. Malcolm has a
spherical beach ball with a radius of 7 inches. Which expression represents
the difference in the volumes of the two beach balls?
A. 2 24 4(7 ) (5 )
3 3
B. 2 24 4(10 ) (7 )
3 3
C.* 3 34 4(7 ) (5 )
3 3
D. 3 34 4(10 ) (7 )
3 3
Grade 8 Math, Part II, Subtest 1 Practice Test
3
1210
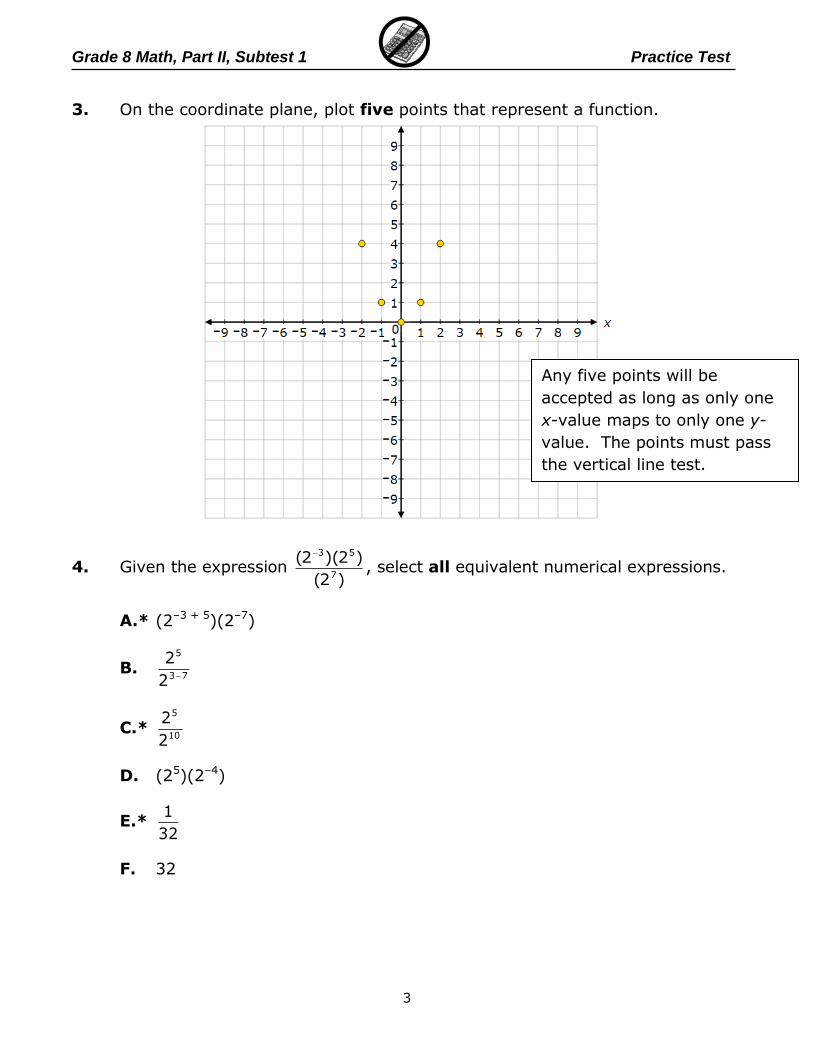
3. On the coordinate plane, plot five points that represent a function.
794
4. Given the expression 3 5
7
(2 )(2 )
(2 )
, select all equivalent numerical expressions.
A.* (2–3 + 5)(2–7)
B. 5
3 7
2
2
C.* 5
10
2
2
D. (25)(2–4)
E.* 1
32
F. 32
Any five points will be
accepted as long as only one
x-value maps to only one y-
value. The points must pass
the vertical line test.
Grade 8 Math, Part II, Subtest 1 Practice Test
4
124
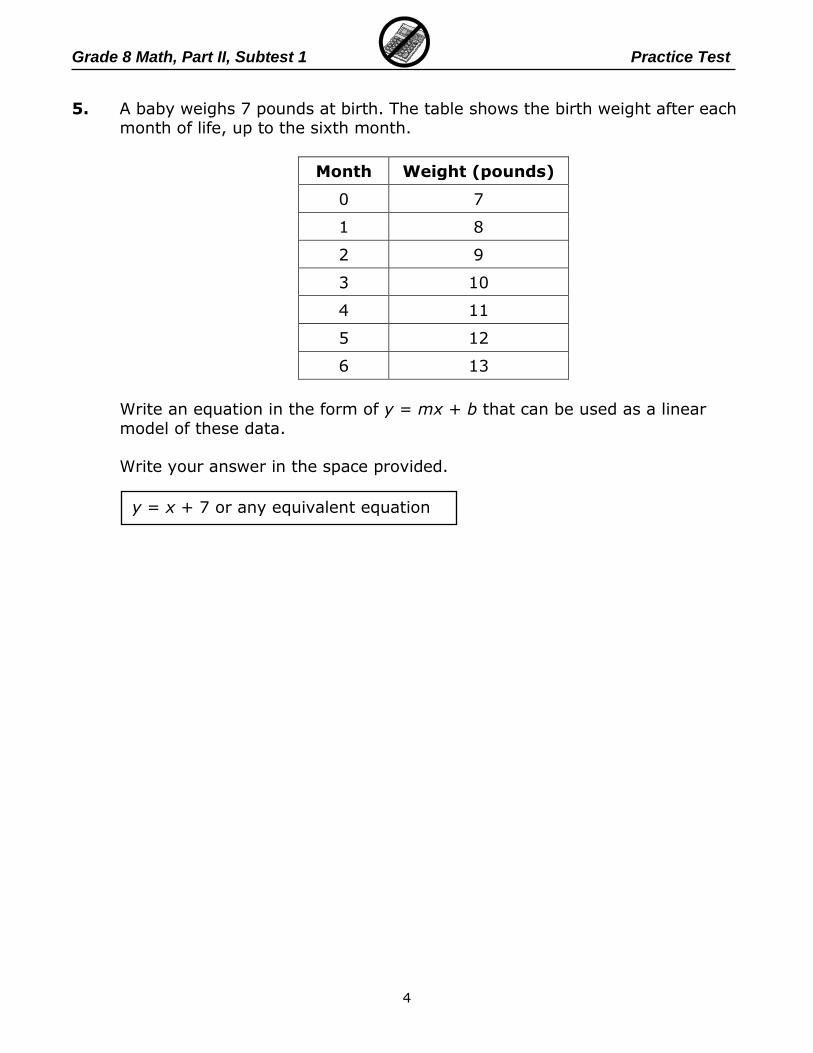
5. A baby weighs 7 pounds at birth. The table shows the birth weight after each month of life, up to the sixth month.
Month Weight (pounds)
0 7
1 8
2 9
3 10
4 11
5 12
6 13
Write an equation in the form of y = mx + b that can be used as a linear model of these data.
Write your answer in the space provided.
y = x + 7 or any equivalent equation
Grade 8 Math, Part II, Subtest 1 Practice Test
5
620
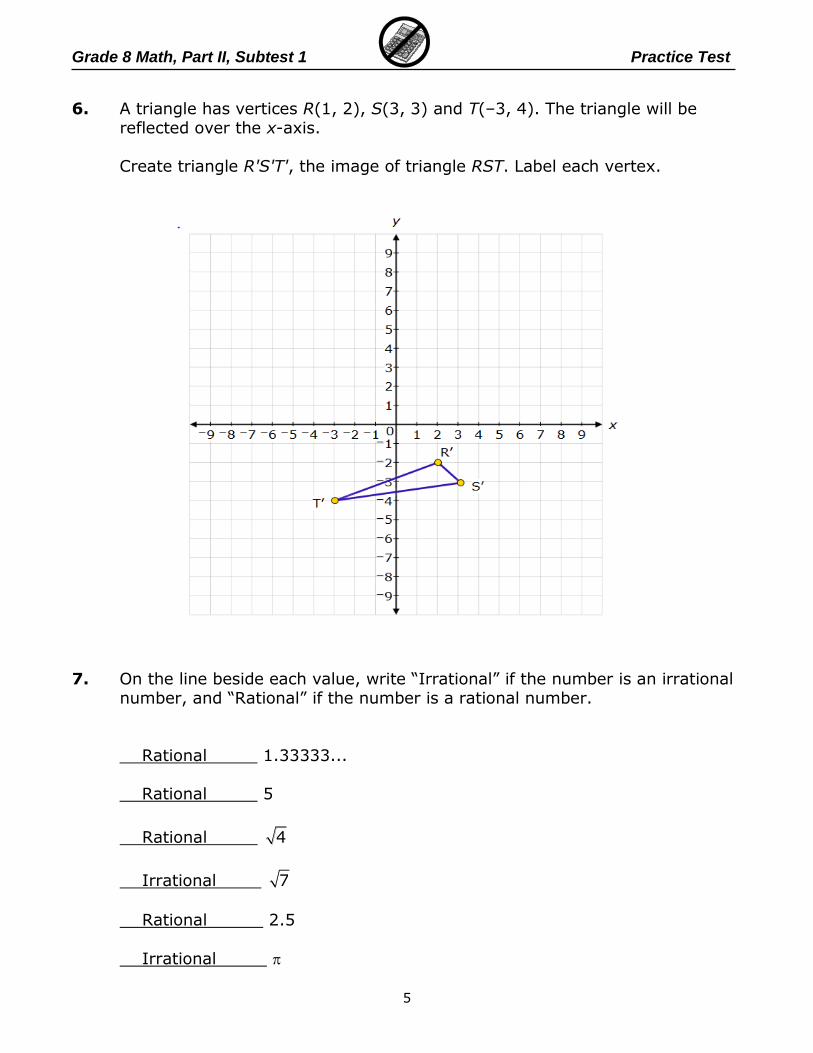
6. A triangle has vertices R(1, 2), S(3, 3) and T(–3, 4). The triangle will be reflected over the x-axis.
Create triangle R'S'T', the image of triangle RST. Label each vertex.
111
7. On the line beside each value, write “Irrational” if the number is an irrational number, and “Rational” if the number is a rational number.
Rational 1.33333... Rational 5
Rational 4
Irrational 7
Rational 2.5
Irrational

Grade 8 Math, Part II, Subtest 1 Practice Test
6
542
8. On the line beside each irrational expression, write the closest approximate value from the “Values” box.
Irrational Expression Approximate Value
226
3 3.40
3 5 6.71
1.75 5.50
111
2 5.27
Values
6.71
3.40
5.27
5.50

Grade 8 Math, Part II, Subtest 1 Practice Test
7
2067
9. Toby has created a map of his neighborhood. When he drew the map he
noticed his house, his friend’s house, and the playground formed a right
triangle.
Which expression represents the distance, in inches, between Toby’s friend’s
house and the playground?
A. 2.5 1.2
B.* 2 22.5 1.2
C. 2.5 1.2
D. 2 22.5 1.2

Grade 8 Math, Part II, Subtest 1 Practice Test
8
604
10. The system of linear equations shown is graphed on the coordinate plane.
What is the approximate solution for the system of linear equations?
A. (1, –3)
B. (–3, 1.3)
C.* (1.3, –3)
D. (–3, 1)
574
11. The value of an irrational number expression is estimated to be between 18
and 19. Which could be the expression?
A. 9
2
B. 5
3
C. 3
6
D.* 3
7

Grade 8 Math, Part II, Subtest 2 Practice Test
9
Directions Subtest 2 of this Practice Test booklet contains sample items for Grade 8 Math. Write your answers in this Practice Test booklet.
You MAY use a calculator in Subtest 2 of this test booklet.
322
12. The graph displays a linear function.
Write the equation of the linear function in the form y = mx + b.
Write your answer in the space provided.
𝑦 = –2
3𝑥

Grade 8 Math, Part II, Subtest 2 Practice Test
10
577
13. Kari plays a certain number of notes in a set amount of time on the piano.
She rests for an equal amount of time, then plays fewer notes in the same
amount of time it took her to play the first set of notes. Which graph can be
used to represent the situation?
A. C.
B.* D.

Grade 8 Math, Part II, Subtest 2 Practice Test
11
2319
14. • Three towns, A, B, and C, can be considered as the vertices of a triangle.
• The distance from town A to town B is 224 miles.
• The distance from town B to town C is 260 miles.
• The distance from town A to town C is 132 miles.
Circle one choice from the box below each sentence to correctly complete
the sentence.
If the three towns are the vertices of a right triangle, then the
length of the hypotenuse is A miles.
If the three towns are the vertices of a right triangle, then
B .
Therefore, the three towns C the vertices of a right
triangle.
Box A
132
224
*260
Box B
*1322 + 2242 = 2602
2242 – 1322 = 2602
1322 + 2602 = 2242
Box C
*are
are not

Grade 8 Math, Part II, Subtest 2 Practice Test
12
588
15. A car dealership polled customers on their preferred type of vehicle, car or
truck, and recorded the results based on the gender of the customer.
Is there an association between type of preferred vehicle and gender?
A. No; 53% of all customers preferred cars and 47% preferred trucks, so the percentages are roughly the same.
B.* No; 53% of men preferred cars and 47% preferred trucks. The
percentages for women are roughly the same.
C. Yes; 30% of all customers were men who preferred cars, while 23%
were women who preferred cars.
D. Yes; 57% of the customers were men, which is a higher percentage
than the 43% of the customers who were women.
324
16. Presley fills a cup in the shape of a cone with water. The cup has a diameter
of 3.6 inches and a height of 6 inches. What is the volume, in cubic inches,
of water Presley will use to completely fill the cup?
Write your answer in the space provided.
Type of Preferred Vehicle
Car Truck Total
Gender Male 45 40 85
Female 35 30 65
Accept answers in the range 20.34 - 20.4
Grade 8 Math, Part II, Subtest 2 Practice Test
13
2380
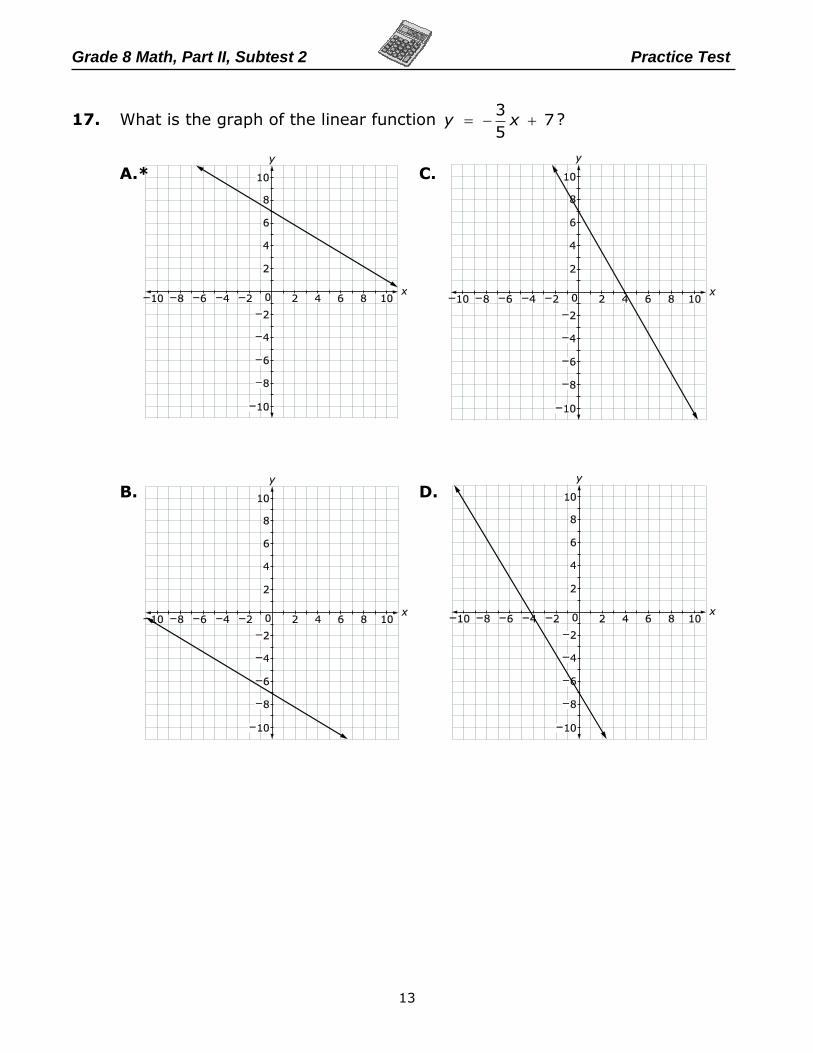
17. What is the graph of the linear function 3
75
y x ?
A.* C.
B. D.
Grade 8 Math, Part II, Subtest 2 Practice Test
14
795
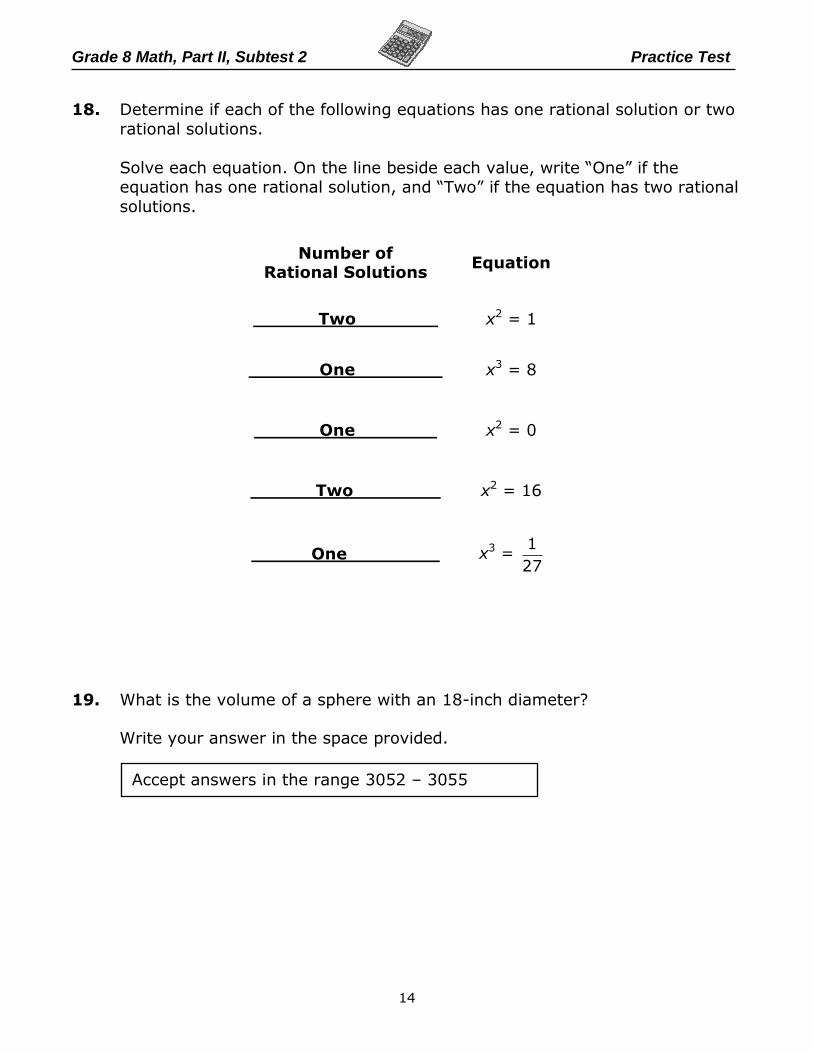
18. Determine if each of the following equations has one rational solution or two
rational solutions.
Solve each equation. On the line beside each value, write “One” if the equation has one rational solution, and “Two” if the equation has two rational
solutions.
787
19. What is the volume of a sphere with an 18-inch diameter? Write your answer in the space provided.
Number of Rational Solutions
Equation
Two x2 = 1
One x3 = 8
One x2 = 0
Two x2 = 16
One x3 = 1
27
Accept answers in the range 3052 – 3055
Grade 8 Math, Part II, Subtest 2 Practice Test
15
631
20. For $1200, a business can post an advertisement for 30 days. For $1500,
the advertisement will be posted for 60 days. The relationship comparing cost to days is linear. Which function can be used to model the relationship
between cost, y, and the number of days, x, that an advertisement will be posted?
A. y = 300x + 1200
B. y = 1200x + 300
C.* y = 10x + 900
D. y = 900x + 10

Grade 8 Math, Part II, Subtest 2 Practice Test
16
597
21. Quadrilateral QRST and its image, Q'R'S'T', are shown.
What is the sequence of transformations that results in quadrilateral QRST
being mapped onto quadrilateral Q'R'S'T'?
A. * reflection over the x-axis, followed by a dilation about the origin by a scale factor of 2
B. 90° clockwise rotation about the origin, followed by a dilation about the origin by a scale factor of 2
C. dilation about the origin by a scale factor of 2, followed by a
translation 2 units right and then 2 units down
D. 270° counterclockwise rotation about the origin, followed by a dilation about the origin by a scale factor of 2
Grade 8 Math, Part II, Subtest 2 Practice Test
17
1215
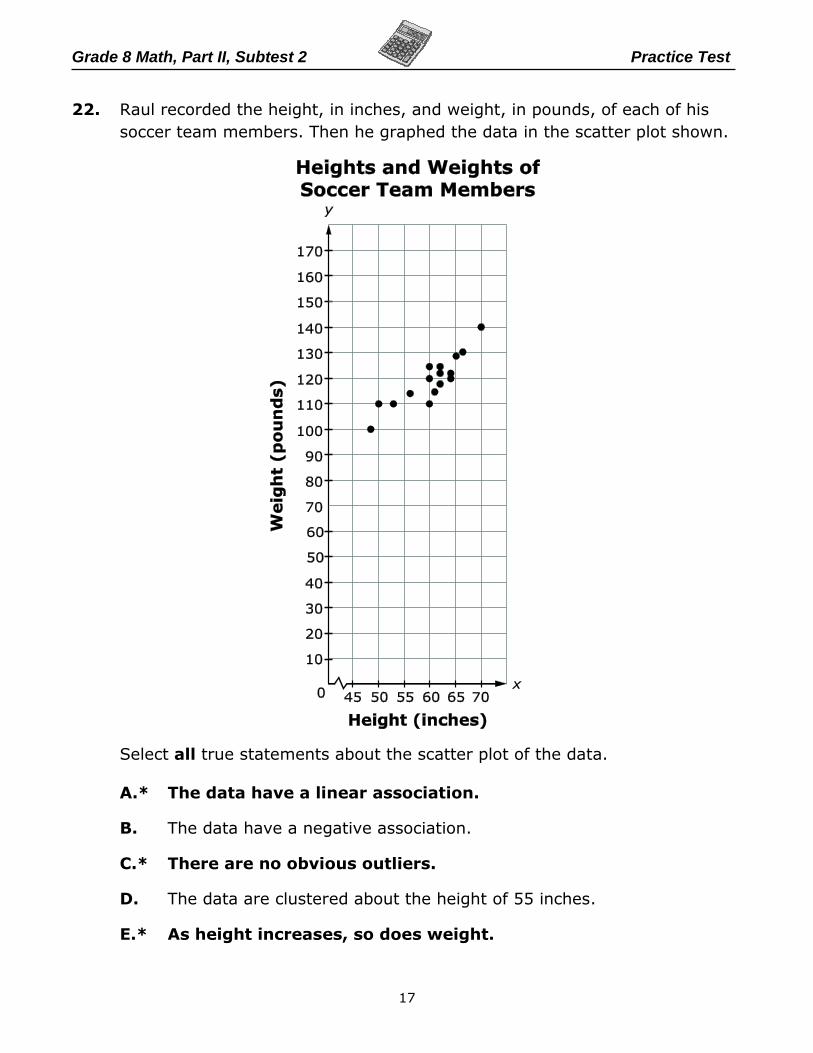
22. Raul recorded the height, in inches, and weight, in pounds, of each of his
soccer team members. Then he graphed the data in the scatter plot shown.
Select all true statements about the scatter plot of the data.
A.* The data have a linear association.
B. The data have a negative association.
C.* There are no obvious outliers.
D. The data are clustered about the height of 55 inches.
E.* As height increases, so does weight.
Grade 8 Math, Part II, Subtest 2 Practice Test
18
273
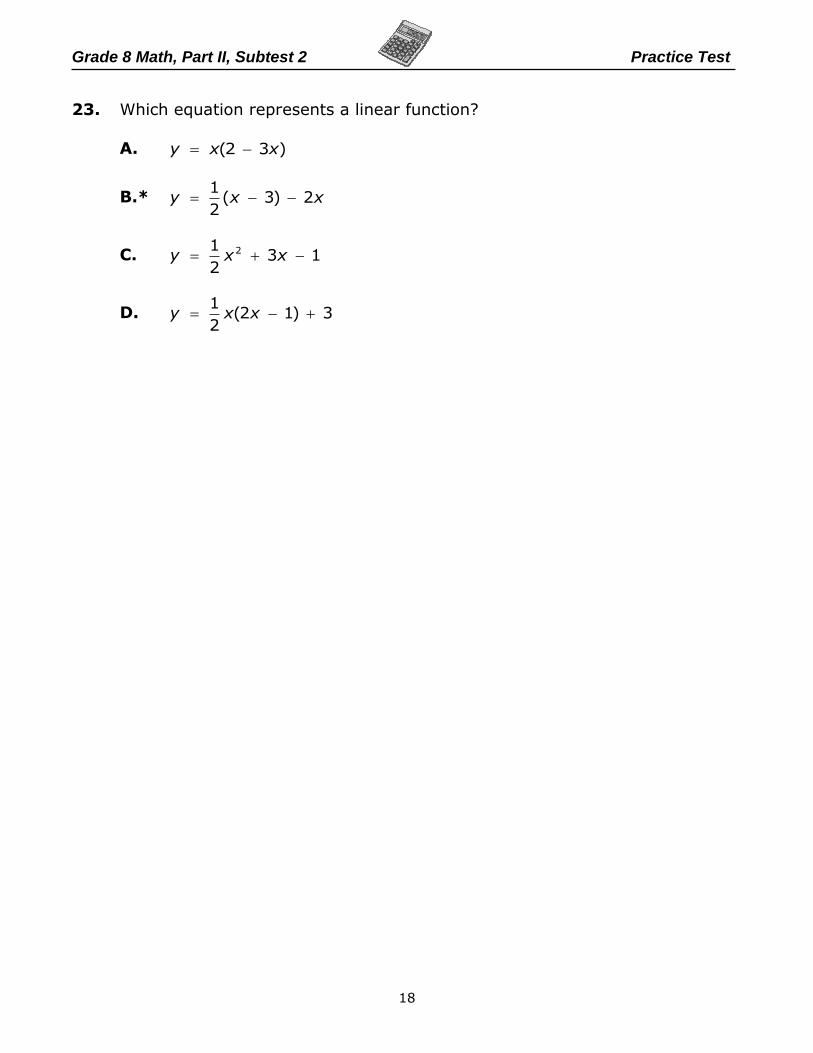
23. Which equation represents a linear function?
A. (2 3 )y x x
B.* 1
( 3) 22
y x x
C. 213 1
2y x x
D. 1
(2 1) 32
y x x