practitioner diversion awareness conferencerecords and daily workflow at the point of care . 2 &...
TRANSCRIPT

Practitioner Diversion Awareness Conference
Drugs of Abuse and Trends
Antonio R. Guzman, Associate Section Chief
Liaison Section
The following presentation was accompanied by an oral presentation on October 21 - 22, 2019, and does not purport to establish legal standards that are not contained in statutes, regulations, or other competent law. Statements contained in this presentation that are not embodied in the law are not binding on DEA. Summaries of statutory and regulatory provisions that are summarized in this presentation do not purport to state the full extent of the statutory and regulatory requirements of the cited statutes and regulations. I have no financial relationships to disclose.
LEGAL DISCLAIMER
U.S. Drug Enforcement Administration
Diversion Control Division

This presentation is for educational purposes only. This presentation may not be further copied or used, with the embedded images and videos, without an independent analysis of the application of the Fair Use doctrine.
Fair Use
Under section 107 of the Copyright Act of 1976, allowance is made for “Fair Use” for purposes such as criticism, comment, news reporting, teaching, scholarship, education and research.
Fair Use is a use permitted by the copyright statute that might otherwise be infringing. Any potentially copyrighted material used in this presentation has been reviewed and found to be used in a manner consistent with Fair Use. A completed Fair Use checklist is attached.
Fair Use Act Disclaimer
U.S. Drug Enforcement Administration
Diversion Control Division

CDC Preliminary Data 2018
4.6 % drop in opioid deaths
7% decline in prescription opioid deaths
11 % increase in deaths from illicit fentanyl
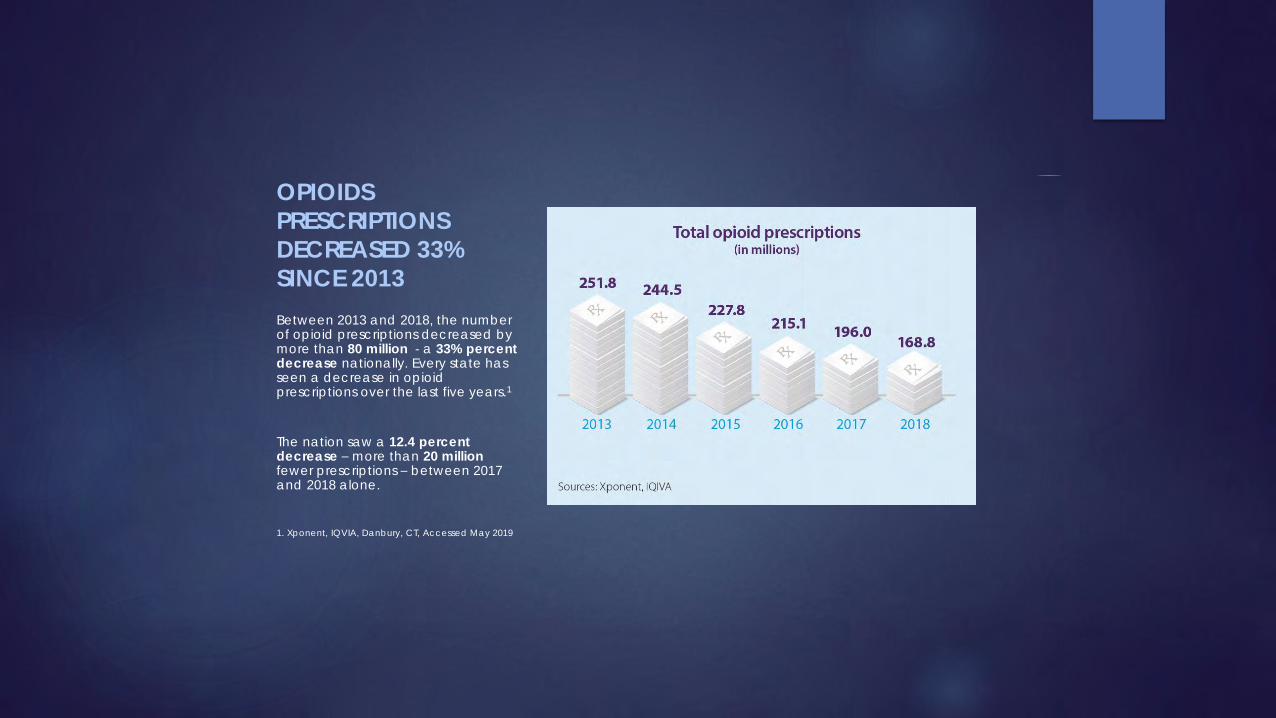
OPIOIDS
PRESCRIPTIONS
DECREASED 33%
SINCE 2013
Between 2013 and 2018, the number of opioid prescriptions decreased by more than 80 million - a 33% percent decrease nationally. Every state has seen a decrease in opioid prescriptions over the last five years.1
The nation saw a 12.4 percent decrease – more than 20 million fewer prescriptions – between 2017 and 2018 alone.
1. Xponent, IQVIA, Danbury, CT, Accessed May 2019
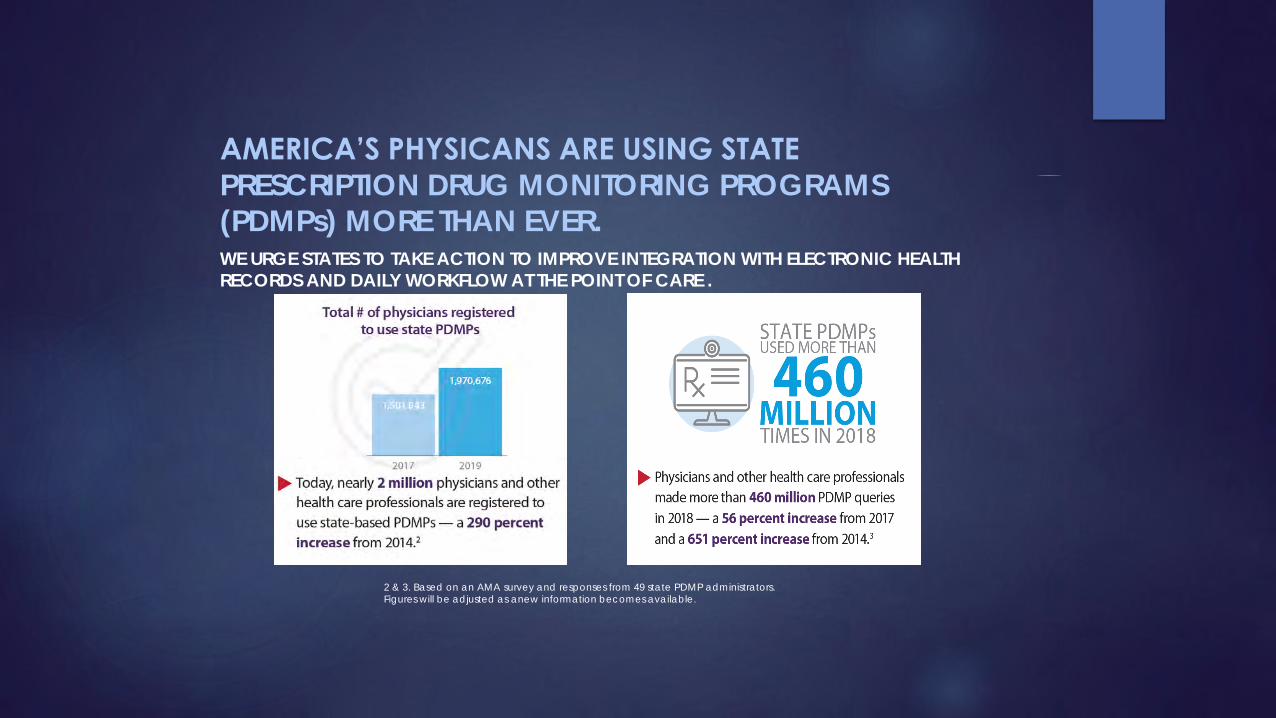
AMERICA’S PHYSICANS ARE USING STATE PRESCRIPTION DRUG MONITORING PROGRAMS (PDMPs) MORE THAN EVER.WE URGE STATES TO TAKE ACTION TO IMPROVE INTEGRATION WITH ELECTRONIC HEALTH RECORDS AND DAILY WORKFLOW AT THE POINT OF CARE .
2 & 3. Based on an AMA survey and responses from 49 state PDMP administrators. Figures will be adjusted as anew information becomes available.
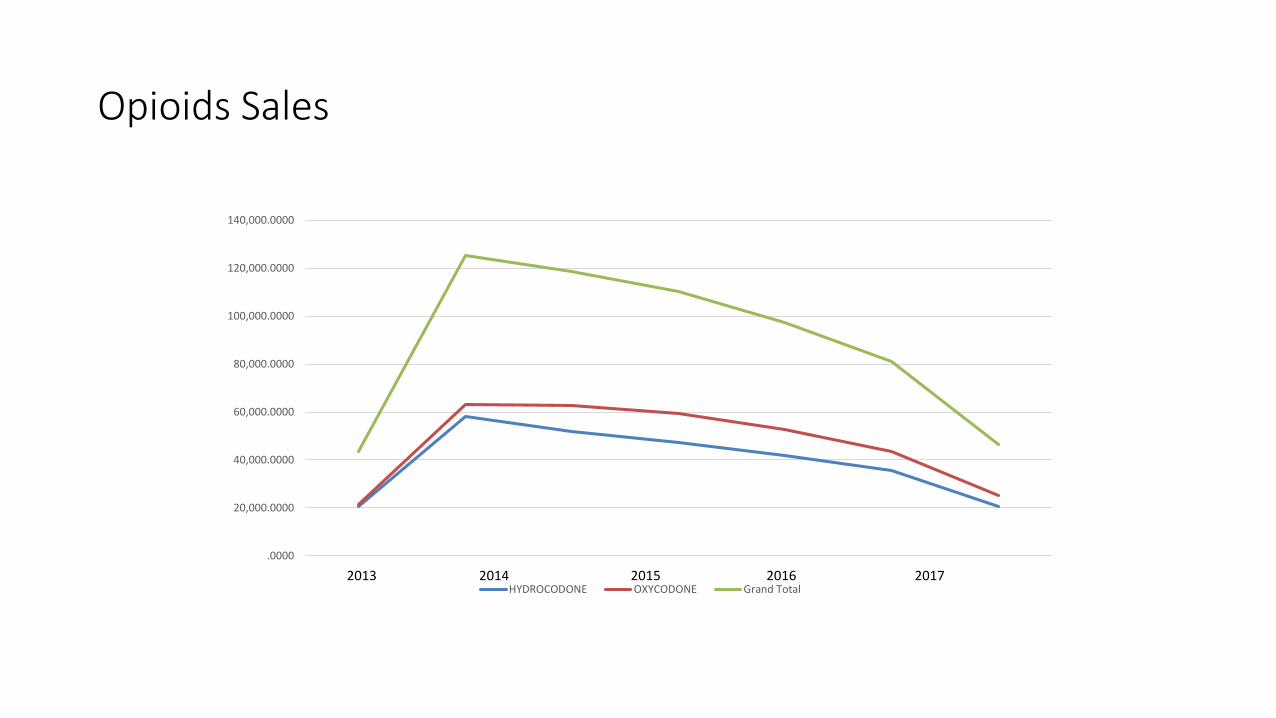
Opioids Sales
.0000
20,000.0000
40,000.0000
60,000.0000
80,000.0000
100,000.0000
120,000.0000
140,000.0000
HYDROCODONE OXYCODONE Grand Total2013 2014 2015 2016 2017
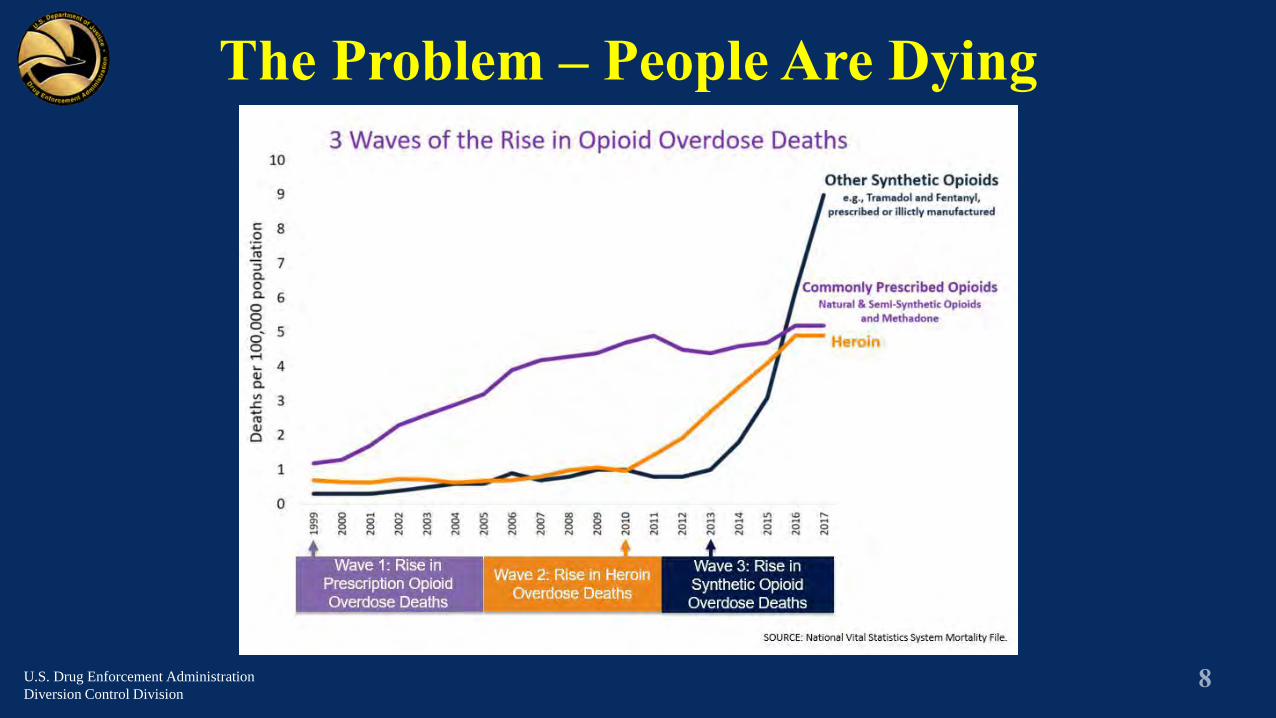
The Problem – People Are Dying
U.S. Drug Enforcement Administration
Diversion Control Division

U.S. Drug Enforcement Administration
Diversion Control Division
The Problem – People Are Dying

Discuss the Public Health Epidemic.
Review the common drugs of abuse.
Discuss the relationship between pharmaceutical controlled substances and heroin.
Course Objectives
U.S. Drug Enforcement Administration
Diversion Control Division

Discuss the violence related to controlled substance prescribing and dispensing.
Review key research and studies involving the impact of indiscriminate prescribing of controlled substances.
Course Objectives
U.S. Drug Enforcement Administration
Diversion Control Division
At the completion of this block of instruction you will be able to answer the following questions:
1. Which country, per million population, has the largest amount of drug induced deaths ages 15-64?
2. Where does Louisiana rate in the United States in the amount of Hydrocodone dispensed?
Questions to Discuss
U.S. Drug Enforcement Administration
Diversion Control Division

3. What percentage of the world’s hydrocodone production does the United States consume?
4. What is the most misused prescription controlled substance pain reliever in the United States?
5. What percent of heroin users began their addictions with prescribed pain relievers?
Questions to Discuss
U.S. Drug Enforcement Administration
Diversion Control Division
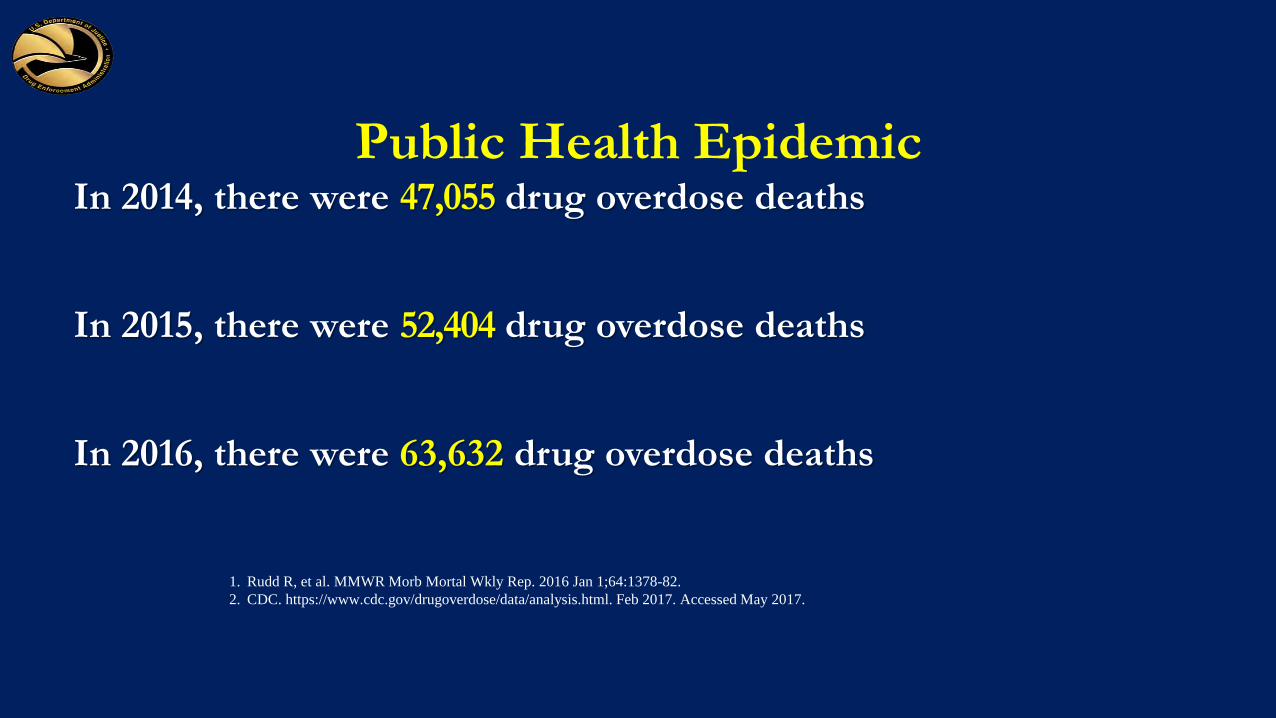
Public Health EpidemicIn 2014, there were 47,055 drug overdose deaths
In 2015, there were 52,404 drug overdose deaths
In 2016, there were 63,632 drug overdose deaths
1. Rudd R, et al. MMWR Morb Mortal Wkly Rep. 2016 Jan 1;64:1378-82.
2. CDC. https://www.cdc.gov/drugoverdose/data/analysis.html. Feb 2017. Accessed May 2017.

Public Health Epidemic
In 2017, there were 70,237 drug overdose deaths,
…one death every 7.5 minutes,
…approximately 192 per day,
…28,466 were due to fentanyl and other synthetic
analogs, other than methadone.
National Institute on Drug Abuse. https://www.drugabuse.gov/related-topics/trends-statistics/overdose-death-
rates

US Mortality Rates
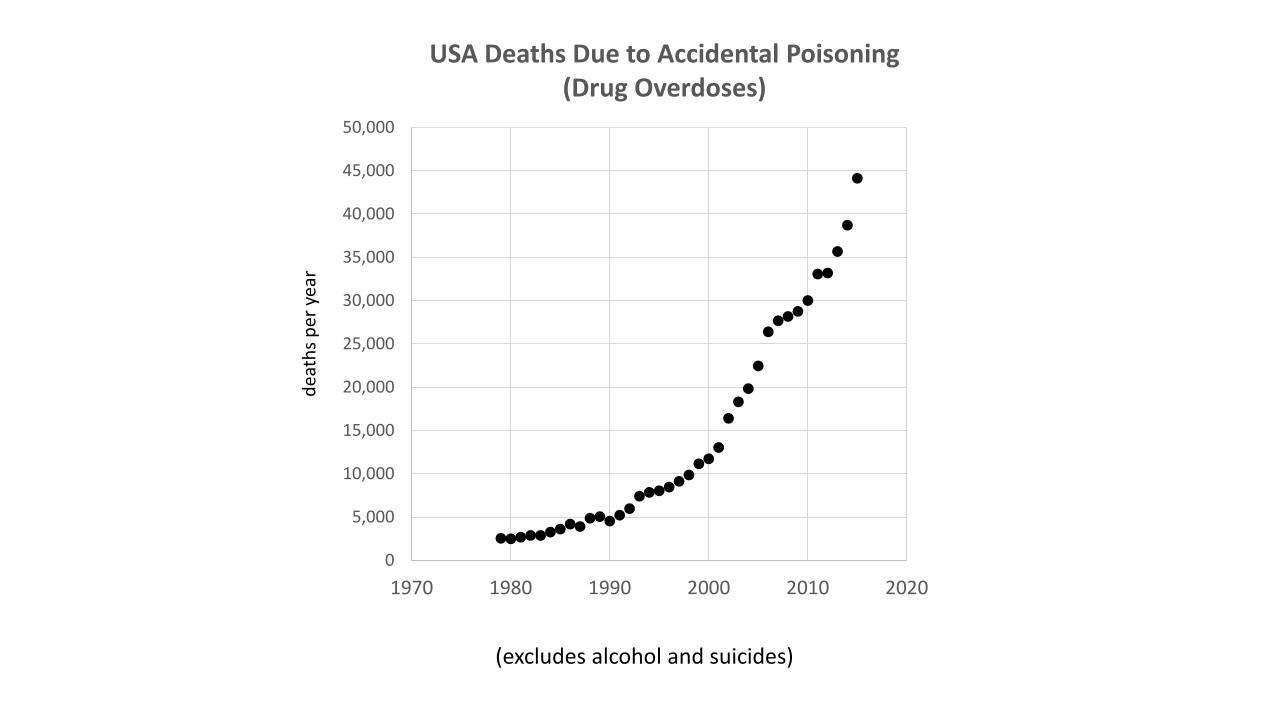
How Long have mortality rates due to drugs been increasing?
A. 7 years
B. 10 years
C. 12 years
D. 15 +years
National Institute on Drug Abuse. https://www.drugabuse.gov/related-topics/trends-statistics/overdose-death-rates
0
5,000
10,000
15,000
20,000
25,000
30,000
35,000
40,000
45,000
50,000
1970 1980 1990 2000 2010 2020
dea
ths
per
yea
r
(excludes alcohol and suicides)
USA Deaths Due to Accidental Poisoning (Drug Overdoses)

3
3.2
3.4
3.6
3.8
4
4.2
4.4
4.6
4.8
5
1975 1980 1985 1990 1995 2000 2005 2010 2015 2020 2025
USA Deaths Due to Accidental Poisoning, Re-plotted on a logarithmic scale
Log
10
dea
ths
/ ye
ar
“Exponential Growth Of The USA Overdose Epidemic”
R2 = .99

0
5,000
10,000
15,000
20,000
25,000
30,000
35,000
40,000
45,000
50,000
1970 1980 1990 2000 2010 2020
dea
ths
per
yea
r
?
“Exponential Growth Of The USA Overdose Epidemic”
Will the epidemic curve follow this remarkable exponential growth pattern into the future?

Mortality from individual drugs
• The epidemic of overdose deaths in the USA has been growing, inexorably andexponentially, for four decades.
• Paradoxically, this overall long term smooth epidemic curve is a composite ofmultiple heterogeneous sub-epidemics which differ according location, age,drugs used, gender, race, and urbanicity. The mechanism(s) whereby these sub-epidemics seamlessly merge into a single smooth curve is unknown.
• Without effective new interventions, this overall pattern of predictableexponential growth is likely to continue into the future.
• Data analytics and modeling are valuable tools to understand and forecast theepidemic trajectory, and to guide and evaluate policies.
Conclusions

The top 5 distributed scheduled controlled substances in the United States:
1. Hydrocodone (e.g. Vicodin, Lorcet)2. Oxycodone (e.g. Percocet, Roxicodone)3. Amphetamines (e.g. Adderall, Dexedrine)4. Methylphenidate (e.g. Ritalin, Concerta)5. Morphine (e.g. MS Contin, Oramorph)
Drugs of Abuse
U.S. Drug Enforcement Administration
Diversion Control Division

ADHD IMS Sales
Molecule2013
KG2014
KG2015
KG2016
KG2017
KG2018
KG2019
KG
AMPHETAMINE 5,044.5389 13,163.5883 14,556.2456 15,161.4036 15,645.002 16,004.8904 9,278.1342
DEXTROAMPHETAMINE 5,332.6418 13,837.4792 15,219.9872 15,796.7813 16,249.5469 16,595.879 9,600.9465
LISDEXAMFETAMINE 6,156.486 14,970.0844 15,947.0114 16,381.8074 16,512.4236 16,223.3032 9,278.1766
METHYLPHENIDATE 8,095.7899 19,426.5148 19,351.6846 18,489.5126 17,644.7643 16,547.7673 9,356.9582
Grand Total 24,629.4566 61,397.6667 65,074.9288 65,829.505 66,051.7369 65,371.8399 37,514.2155
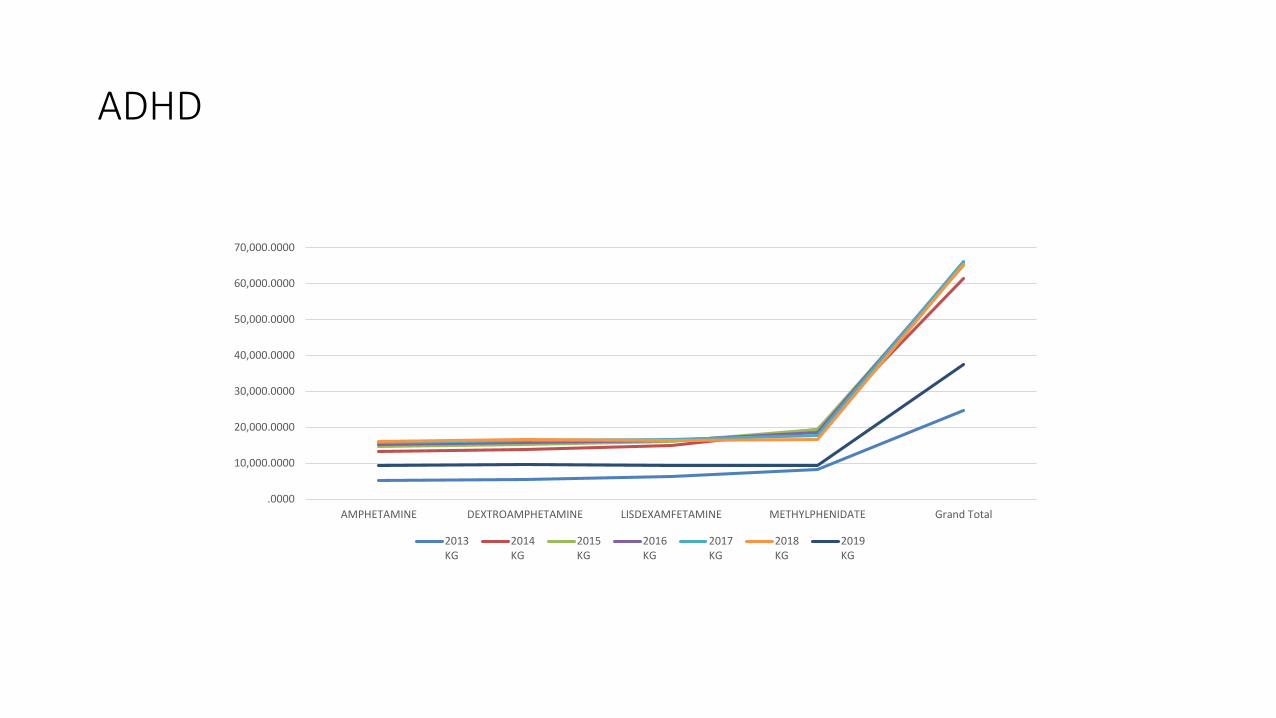
ADHD
.0000
10,000.0000
20,000.0000
30,000.0000
40,000.0000
50,000.0000
60,000.0000
70,000.0000
AMPHETAMINE DEXTROAMPHETAMINE LISDEXAMFETAMINE METHYLPHENIDATE Grand Total
2013KG
2014KG
2015KG
2016KG
2017KG
2018KG
2019KG
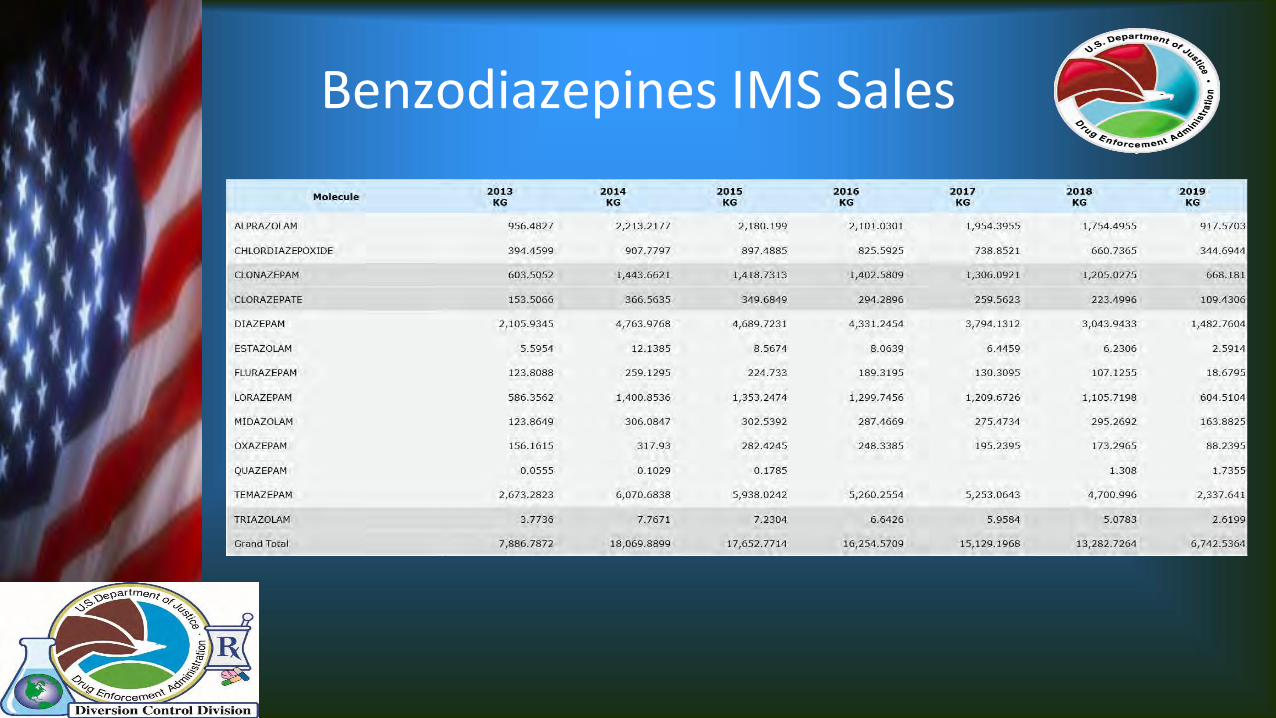
Benzodiazepines IMS Sales

Benzodiazepines
.0000
2000.0000
4000.0000
6000.0000
8000.0000
10000.0000
12000.0000
14000.0000
16000.0000
18000.0000
20000.0000
2013KG
2014KG
2015KG
2016KG
2017KG
2018KG
2019KG
U.S. Drug Enforcement Administration
Office of Diversion Control
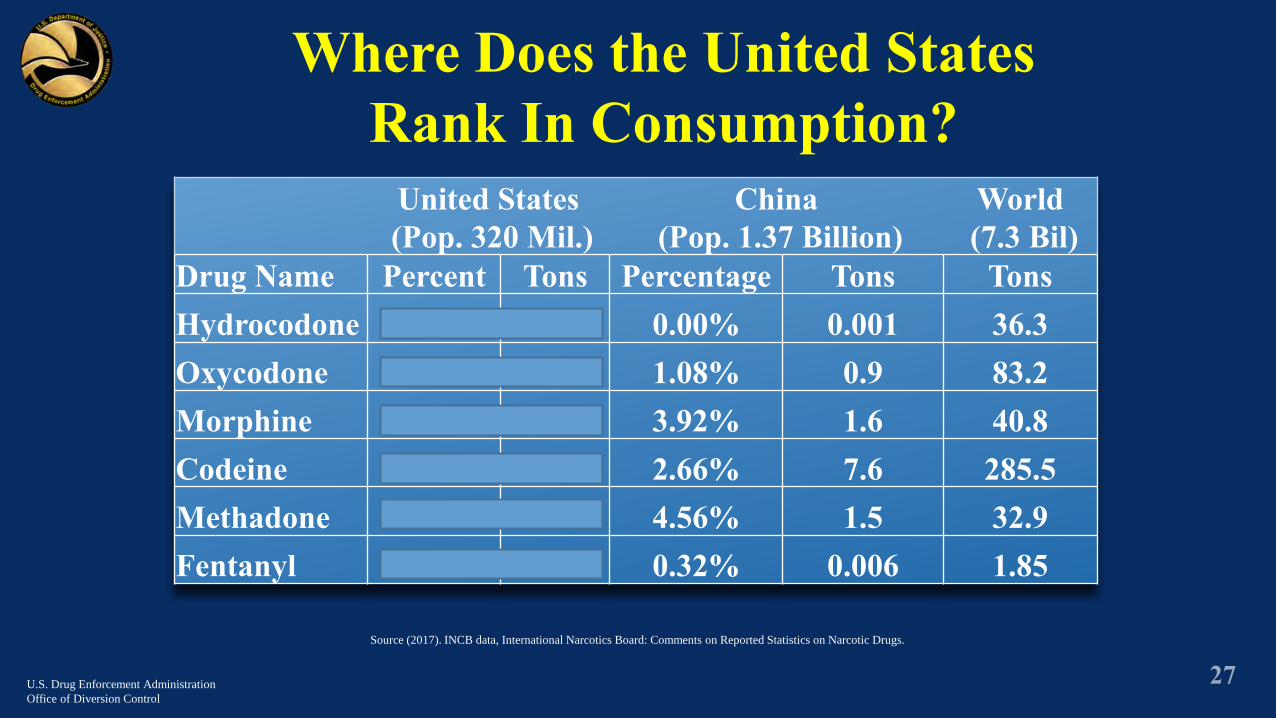
Source (2017). INCB data, International Narcotics Board: Comments on Reported Statistics on Narcotic Drugs.
United States(Pop. 320 Mil.)
China(Pop. 1.37 Billion)
World(7.3 Bil)
Drug Name Percent Tons Percentage Tons TonsHydrocodone 99.72% 36.2 0.00% 0.001 36.3Oxycodone 75.12% 62.5 1.08% 0.9 83.2Morphine 48.04% 19.6 3.92% 1.6 40.8Codeine 12.50% 35.7 2.66% 7.6 285.5Methadone 47.11% 15.5 4.56% 1.5 32.9Fentanyl 29.19% 0.54 0.32% 0.006 1.85
Where Does the United States Rank In Consumption?

Hydrocodone / Acetaminophen (toxicity)
Similarities:
Structurally related to codeine
Equal to morphine in producing opiate-like effects
Brand Names: Vicodin®, Lortab®, Lorcet®
Hydrocodone
U.S. Drug Enforcement Administration
Diversion Control Division

October 6, 2014 moved to SCHEDULE II
Street prices: $2 to $10 per tablet depending on strength & region
Hydrocodone
U.S. Drug Enforcement Administration
Diversion Control Division
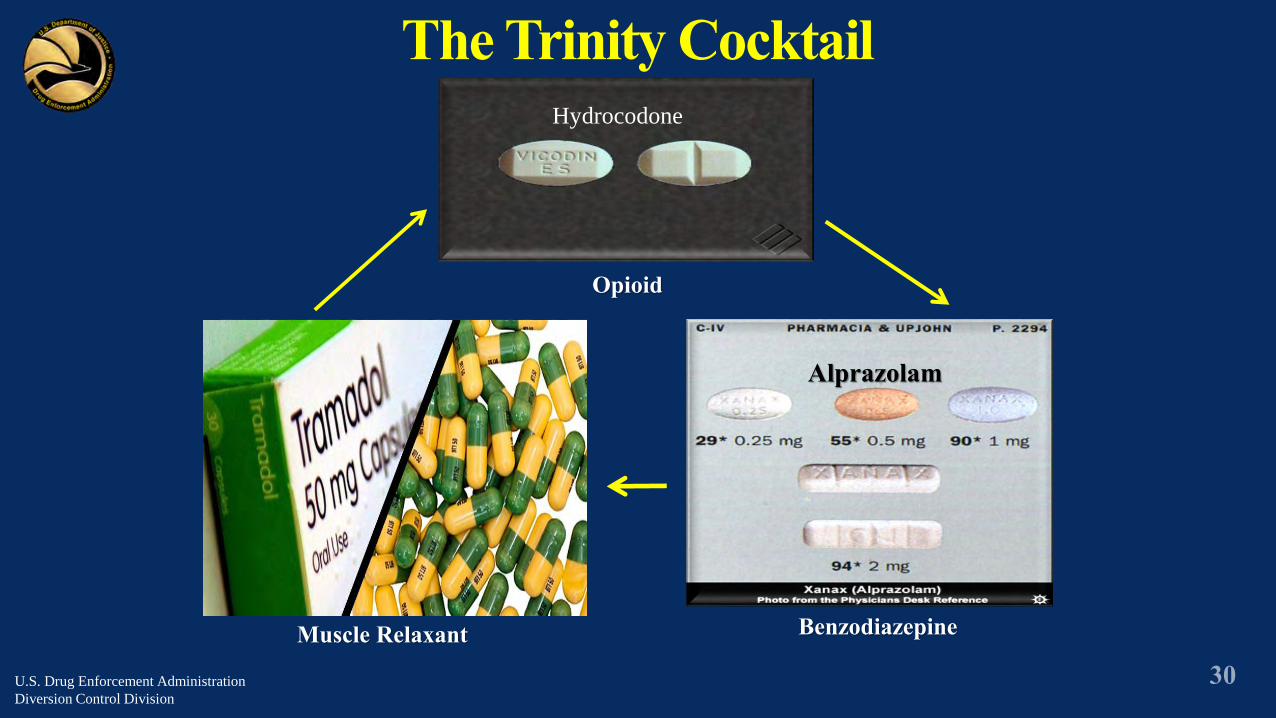
Carisoprodol
C-IV as of 1/11/2012
Benzodiazepine
Alprazolam
Muscle Relaxant
Hydrocodone
Opioid
The Trinity Cocktail
Aka: Soma
U.S. Drug Enforcement Administration
Diversion Control Division

Hydrocodone Distribution
2014 - 2018 U.S. Totals
Drug Enforcement Administration, Diversion Control DivisionPharmaceutical Investigations Section, Targeting and Analysis Unit
Source: ARCOS Date Prepared: 07/16/2019
U.S. Drug Enforcement Administration
Diversion Control Division
TO
TA
LD
OS
AG
ES
0
500,000,000
1,000,000,000
1,500,000,000
2,000,000,000
2,500,000,000
Sche
dule
Cha
nge

NY
WA
ORMT
IDWY
ND
SDMN
IANE
WI MI
CO KS MOIL INUTNV
CA
AZ NM OK
TXAK
AR
LA
TNKY
MS AL GASC
NC
OHVA
PA
MEVT
NJ
MD
RI
DC
DE
HI
VW
FL
HN
PR
U.S. Average: 54,332 Dosages UnitsAbove Average = 67,916 Dosage Units or more
Average = 40,749 – 67,915 Dosage Units
Below Average = 40,748 Dosage Units or less
Zero Dosage Units
Drug Enforcement Administration, Diversion Control Division, Pharmaceutical Investigations Section, Targeting and Analysis Unit
Source: ARCOS
Date Prepared: 07/16/2019
Purchases of Hydrocodone for January - December 2018
U.S. Drug Enforcement Administration
Diversion Control Division

Hydrocodone DistributionRetail Pharmacies
U.S. Drug Enforcement Administration
Diversion Control Division
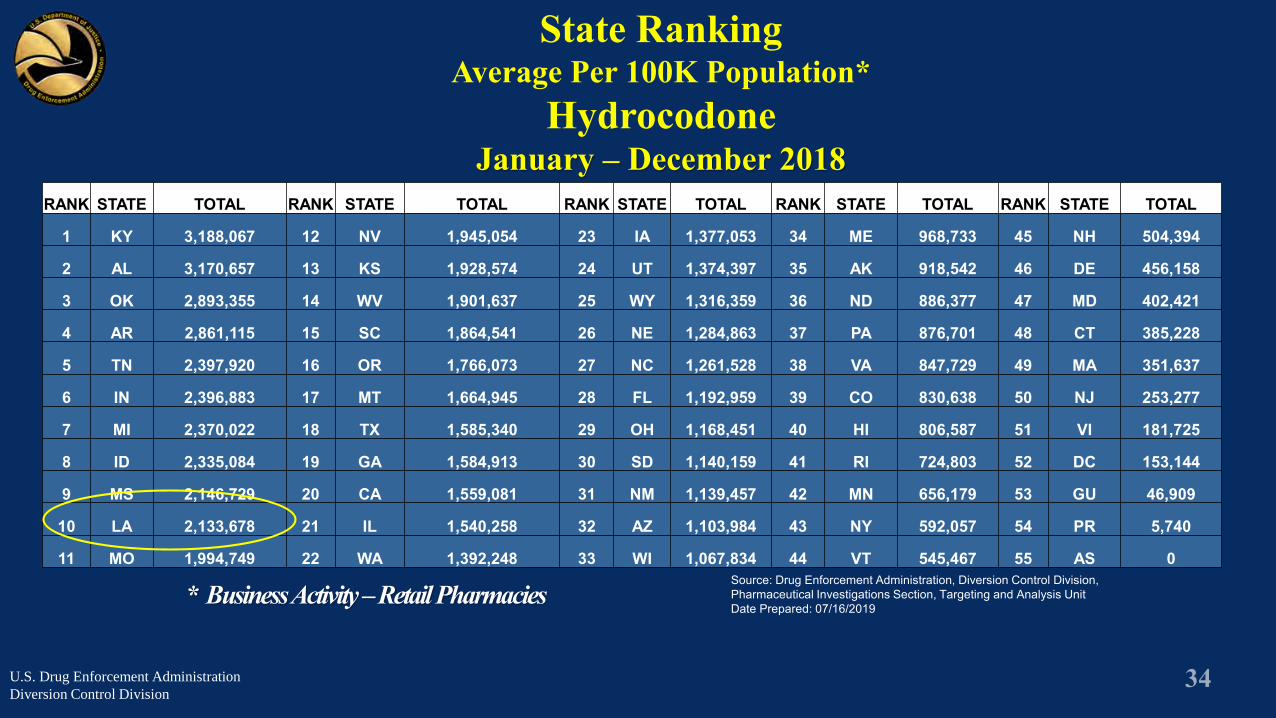
* Business Activity –Retail Pharmacies
State Ranking Average Per 100K Population*
HydrocodoneJanuary – December 2018
Source: Drug Enforcement Administration, Diversion Control Division, Pharmaceutical Investigations Section, Targeting and Analysis Unit Date Prepared: 07/16/2019
U.S. Drug Enforcement Administration
Diversion Control Division
RANK STATE TOTAL RANK STATE TOTAL RANK STATE TOTAL RANK STATE TOTAL RANK STATE TOTAL
1 KY 3,188,067 12 NV 1,945,054 23 IA 1,377,053 34 ME 968,733 45 NH 504,394
2 AL 3,170,657 13 KS 1,928,574 24 UT 1,374,397 35 AK 918,542 46 DE 456,158
3 OK 2,893,355 14 WV 1,901,637 25 WY 1,316,359 36 ND 886,377 47 MD 402,421
4 AR 2,861,115 15 SC 1,864,541 26 NE 1,284,863 37 PA 876,701 48 CT 385,228
5 TN 2,397,920 16 OR 1,766,073 27 NC 1,261,528 38 VA 847,729 49 MA 351,637
6 IN 2,396,883 17 MT 1,664,945 28 FL 1,192,959 39 CO 830,638 50 NJ 253,277
7 MI 2,370,022 18 TX 1,585,340 29 OH 1,168,451 40 HI 806,587 51 VI 181,725
8 ID 2,335,084 19 GA 1,584,913 30 SD 1,140,159 41 RI 724,803 52 DC 153,144
9 MS 2,146,729 20 CA 1,559,081 31 NM 1,139,457 42 MN 656,179 53 GU 46,909
10 LA 2,133,678 21 IL 1,540,258 32 AZ 1,103,984 43 NY 592,057 54 PR 5,740
11 MO 1,994,749 22 WA 1,392,248 33 WI 1,067,834 44 VT 545,467 55 AS 0
Hydrocodone DistributionPractitioner’s Office
U.S. Drug Enforcement Administration
Diversion Control Division
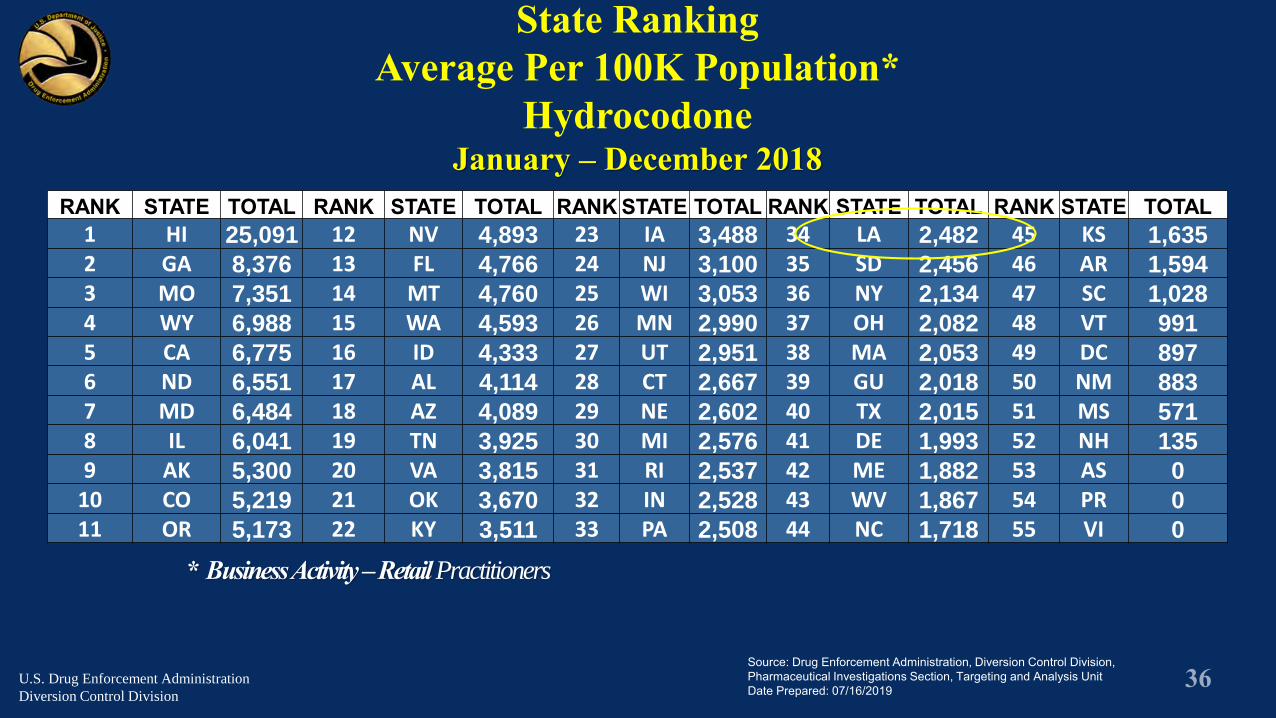
* Business Activity –Retail Practitioners
Source: Drug Enforcement Administration, Diversion Control Division, Pharmaceutical Investigations Section, Targeting and Analysis Unit Date Prepared: 07/16/2019
State Ranking Average Per 100K Population*
HydrocodoneJanuary – December 2018
U.S. Drug Enforcement Administration
Diversion Control Division
RANK STATE TOTAL RANK STATE TOTAL RANK STATE TOTAL RANK STATE TOTAL RANK STATE TOTAL1 HI 25,091 12 NV 4,893 23 IA 3,488 34 LA 2,482 45 KS 1,635
2 GA 8,376 13 FL 4,766 24 NJ 3,100 35 SD 2,456 46 AR 1,594
3 MO 7,351 14 MT 4,760 25 WI 3,053 36 NY 2,134 47 SC 1,028
4 WY 6,988 15 WA 4,593 26 MN 2,990 37 OH 2,082 48 VT 991
5 CA 6,775 16 ID 4,333 27 UT 2,951 38 MA 2,053 49 DC 897
6 ND 6,551 17 AL 4,114 28 CT 2,667 39 GU 2,018 50 NM 883
7 MD 6,484 18 AZ 4,089 29 NE 2,602 40 TX 2,015 51 MS 571
8 IL 6,041 19 TN 3,925 30 MI 2,576 41 DE 1,993 52 NH 135
9 AK 5,300 20 VA 3,815 31 RI 2,537 42 ME 1,882 53 AS 0
10 CO 5,219 21 OK 3,670 32 IN 2,528 43 WV 1,867 54 PR 0
11 OR 5,173 22 KY 3,511 33 PA 2,508 44 NC 1,718 55 VI 0

The1990s
OxyContin®
U.S. Drug Enforcement Administration
Diversion Control Division

OxyContin®
OxyContin® controlled release formulation of Schedule II oxycodone:
The controlled release method of delivery allowed for a longer duration of drug action and contained much larger doses of oxycodone.
Abusers easily compromised the controlled release formulation by crushing the tablets for a powerful morphine-like high.
10, 20, 40, 80mg available.
U.S. Drug Enforcement Administration
Diversion Control Division
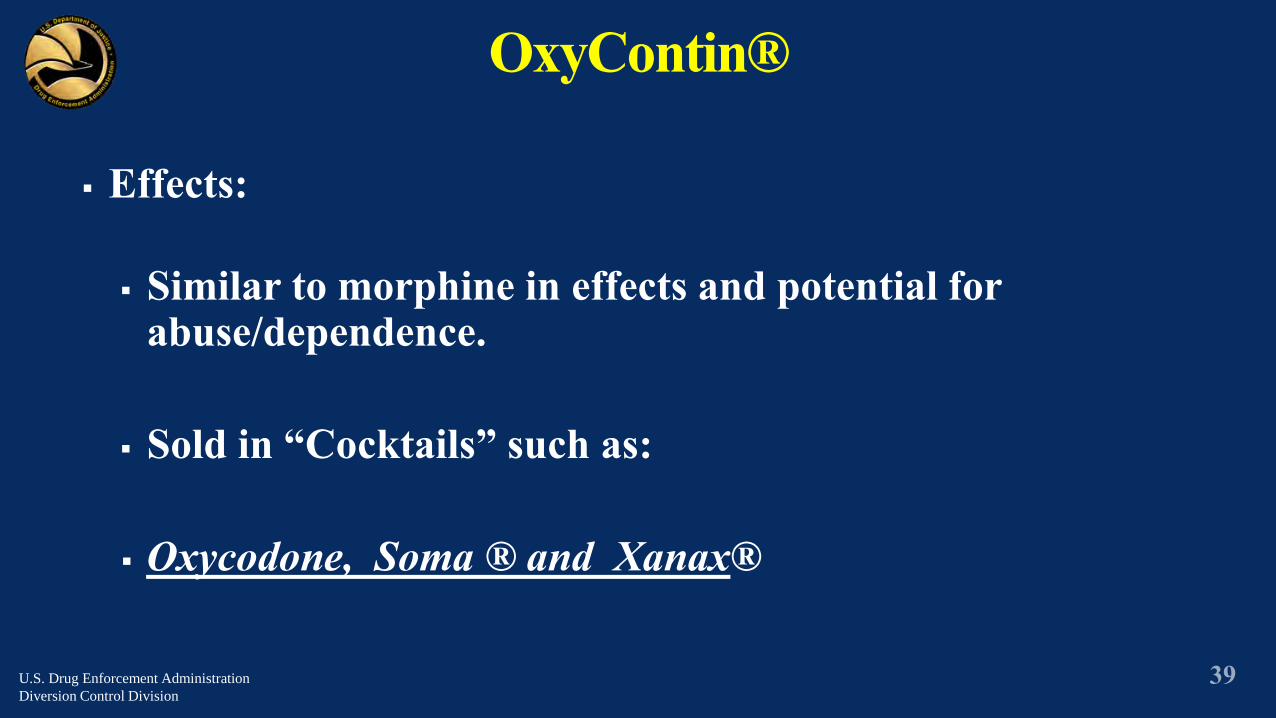
Effects:
Similar to morphine in effects and potential for abuse/dependence.
Sold in “Cocktails” such as:
Oxycodone, Soma ® and Xanax®
OxyContin®
U.S. Drug Enforcement Administration
Diversion Control Division

OxyContin®
U.S. Drug Enforcement Administration
Diversion Control Division
• Street price: Approx. $80 per 80mg tablet
• 90 tabs prescribed a month =
• $7200 a month income.
• $85,400 year.
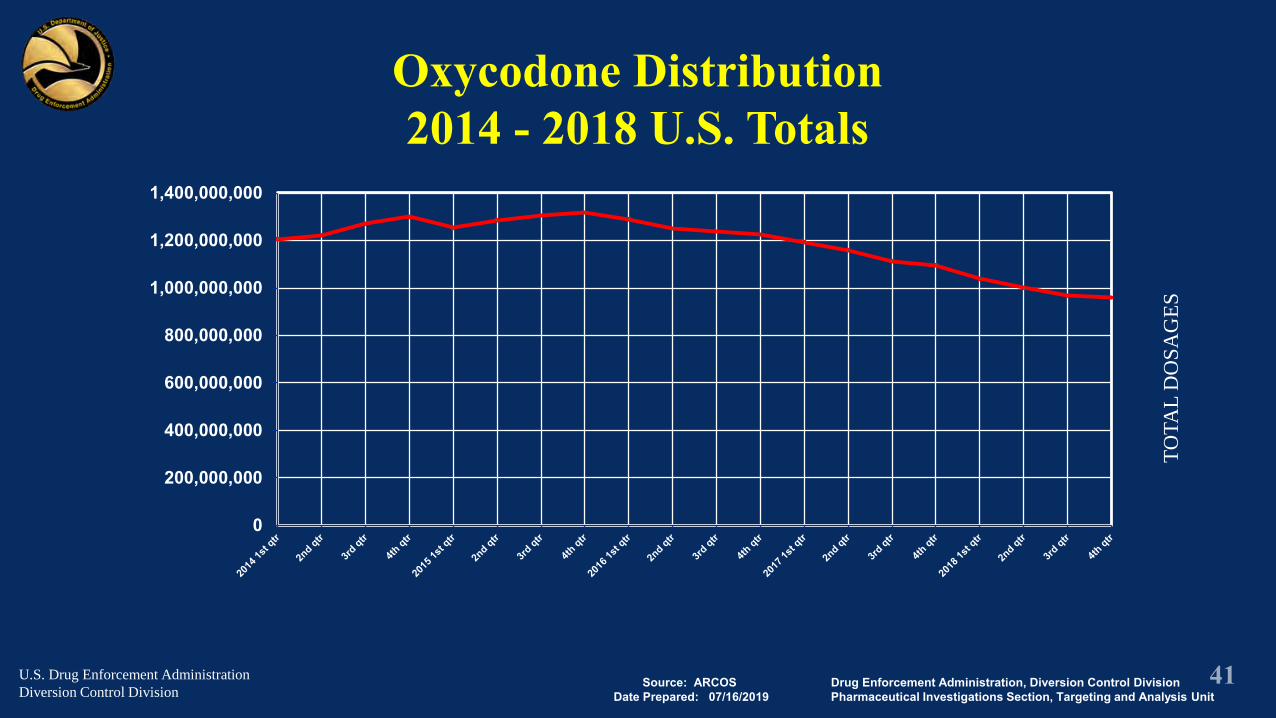
Oxycodone Distribution2014 - 2018 U.S. Totals
TO
TA
L D
OS
AG
ES
U.S. Drug Enforcement Administration
Diversion Control Division
0
200,000,000
400,000,000
600,000,000
800,000,000
1,000,000,000
1,200,000,000
1,400,000,000
Drug Enforcement Administration, Diversion Control DivisionPharmaceutical Investigations Section, Targeting and Analysis Unit
Source: ARCOS Date Prepared: 07/16/2019

NY
WA
ORMT
ID WY
ND
SDMN
IANE
WI MI
CO KS MOIL INUTNV
CA
AZ NM OK
TXAK
AR
LA
TNKY
MS AL GASC
NC
OHVA
PA
MEVT
NJ
MD
RI
DC
DE
HI
VW
FL
HN
PR
U.S. Average: 51,511 Dosages Units
Above Average = 64,390 Dosage Units or moreAverage = 38,633 – 64,389Dosage UnitsBelow Average = 38,632 Dosage Units or lessZero Dosage UnitsDrug Enforcement Administration, Diversion Control Division
Pharmaceutical Investigations Section, Targeting and Analysis UnitSource: ARCOS
Date Prepared: 07/16/2019
Purchases of Oxycodone for January - December 2018

Oxycodone DistributionRetail Pharmacies
U.S. Drug Enforcement Administration
Diversion Control Division

* Business Activity –Retail Pharmacies
State Ranking Average Per 100K Population*
OxycodoneJanuary – December 2018
Source: Drug Enforcement Administration, Diversion Control Division, Pharmaceutical Investigations Section, Targeting and Analysis Unit Date Prepared: 07/16/2019
U.S. Drug Enforcement Administration
Diversion Control Division
RANK STATE TOTAL RANK STATE TOTAL RANK STATE TOTAL RANK STATE TOTAL RANK STATE TOTAL1 TN 2,210,000 12 OK 1,612,469 23 ME 1,351,121 34 VA 1,154,898 45 MI 745,202
2 DE 2,184,853 13 FL 1,573,010 24 CO 1,340,700 35 IN 1,145,469 46 ND 719,122
3 AZ 1,981,541 14 OH 1,522,968 25 KS 1,339,171 36 WI 1,144,344 47 SD 657,859
4 NC 1,952,249 15 SC 1,522,007 26 CT 1,331,781 37 RI 1,109,030 48 CA 611,674
5 OR 1,815,155 16 AL 1,484,259 27 AR 1,306,212 38 VT 1,095,364 49 IA 604,770
6 UT 1,789,318 17 NJ 1,451,008 28 WV 1,290,420 39 NY 1,075,752 50 IL 345,035
7 NV 1,785,517 18 MO 1,421,093 29 MA 1,263,347 40 MS 1,070,969 51 TX 327,842
8 MD 1,713,608 19 WY 1,420,181 30 AK 1,260,635 41 MN 1,028,595 52 PR 194,453
9 KY 1,688,158 20 GA 1,383,768 31 LA 1,245,386 42 HI 914,721 53 VI 194,309
10 PA 1,659,693 21 NH 1,381,153 32 ID 1,231,659 43 DC 829,225 54 GU 186,292
11 WA 1,620,092 22 NM 1,372,984 33 MT 1,188,490 44 NE 795,049 55 AS 0

Oxycodone DistributionPractitioner’s Office
U.S. Drug Enforcement Administration
Diversion Control Division
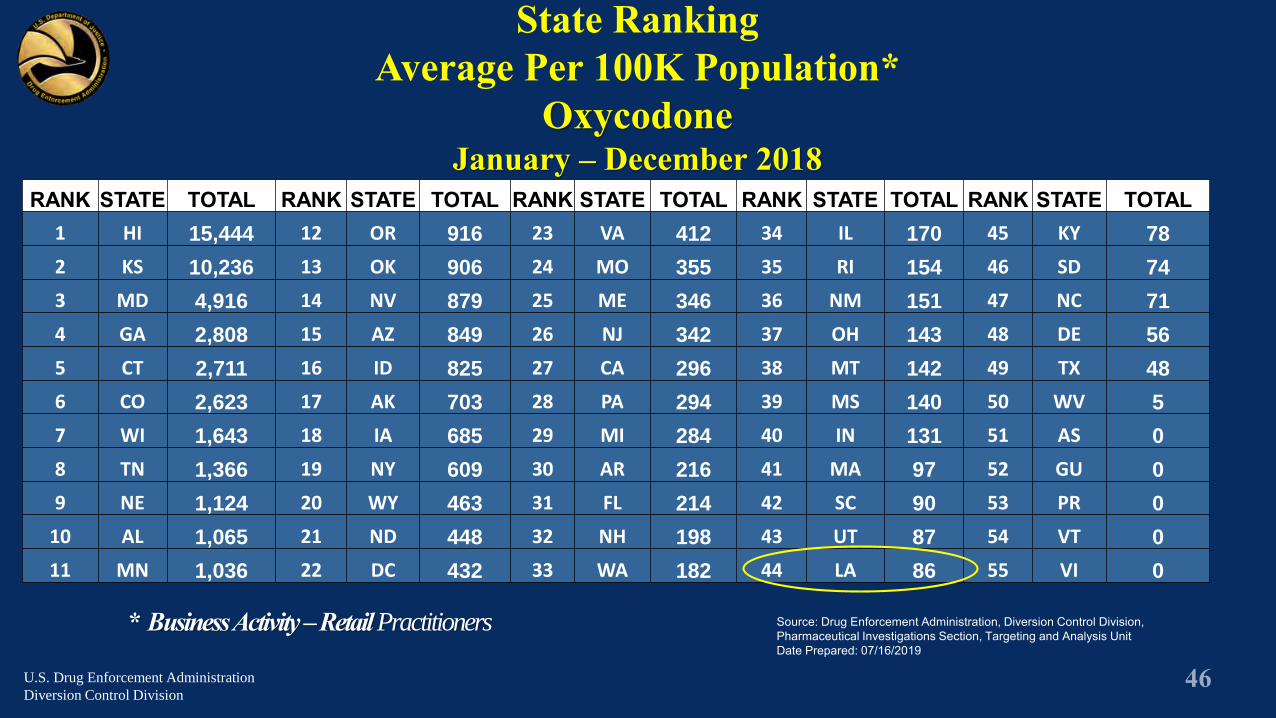
* Business Activity –Retail Practitioners Source: Drug Enforcement Administration, Diversion Control Division, Pharmaceutical Investigations Section, Targeting and Analysis Unit Date Prepared: 07/16/2019
State Ranking Average Per 100K Population*
OxycodoneJanuary – December 2018
U.S. Drug Enforcement Administration
Diversion Control Division
RANK STATE TOTAL RANK STATE TOTAL RANK STATE TOTAL RANK STATE TOTAL RANK STATE TOTAL1 HI 15,444 12 OR 916 23 VA 412 34 IL 170 45 KY 78
2 KS 10,236 13 OK 906 24 MO 355 35 RI 154 46 SD 74
3 MD 4,916 14 NV 879 25 ME 346 36 NM 151 47 NC 71
4 GA 2,808 15 AZ 849 26 NJ 342 37 OH 143 48 DE 56
5 CT 2,711 16 ID 825 27 CA 296 38 MT 142 49 TX 48
6 CO 2,623 17 AK 703 28 PA 294 39 MS 140 50 WV 5
7 WI 1,643 18 IA 685 29 MI 284 40 IN 131 51 AS 0
8 TN 1,366 19 NY 609 30 AR 216 41 MA 97 52 GU 0
9 NE 1,124 20 WY 463 31 FL 214 42 SC 90 53 PR 0
10 AL 1,065 21 ND 448 32 NH 198 43 UT 87 54 VT 0
11 MN 1,036 22 DC 432 33 WA 182 44 LA 86 55 VI 0

Amphetamines Distribution
2014 - 2018 U.S. Totals
TO
TA
L D
OS
AG
ES
Source: ARCOS Date Prepared: 07/16/2019
U.S. Drug Enforcement Administration
Diversion Control Division
0
50,000,000
100,000,000
150,000,000
200,000,000
250,000,000
300,000,000
350,000,000
400,000,000
450,000,000
500,000,000
Drug Enforcement Administration, Diversion Control Division, Pharmaceutical Investigations Section, Targeting and Analysis Unit

NY
WA
ORMT
ID WY
ND
SDMN
IANE
WI MI
CO KS MOIL INUTNV
CA
AZ NM OK
TXAK
AR
LA
TNKY
MS AL GASC
NC
OHVA
PA
MEVT
NJ
MD
RI
DC
DE
HI
VW
FL
HN
PR
U.S. Average: 26,493 Dosages Units
Above Average = 33,117 Dosage Units or moreAverage = 19,870 – 33,116 Dosage UnitsBelow Average = 19,869 Dosage Units or lessZero Dosage UnitsDrug Enforcement Administration, Diversion Control Division
Pharmaceutical Investigations Section, Targeting and Analysis UnitSource: ARCOS
Date Prepared: 07/16/2019
Purchases of Amphetamines for January - December 2018
Amphetamines DistributionRetail Pharmacies
U.S. Drug Enforcement Administration
Diversion Control Division

* Business Activity –Retail Pharmacies
State Ranking Average Per 100K Population*
AmphetaminesJanuary – December 2018
Source: Drug Enforcement Administration, Diversion Control Division, Pharmaceutical Investigations Section, Targeting and Analysis Unit Date Prepared: 07/16/2019
U.S. Drug Enforcement Administration
Diversion Control Division
RANK STATE TOTAL RANK STATE TOTAL RANK STATE TOTAL RANK STATE TOTAL RANK STATE TOTAL1 RI 1,191,940 12 NC 719,758 23 SD 612,973 34 TX 530,221 45 NJ 418,290
2 LA 1,079,340 13 MN 716,808 24 WA 610,713 35 CO 520,885 46 WY 394,904
3 UT 1,016,629 14 WI 705,671 25 OH 599,556 36 IL 516,243 47 AK 351,557
4 NH 988,010 15 DE 699,196 26 ID 592,077 37 FL 516,009 48 NV 325,983
5 SC 931,252 16 KS 691,400 27 IA 578,211 38 NE 495,366 49 CA 291,193
6 MA 907,900 17 IN 661,094 28 PA 572,313 39 AZ 486,822 50 NM 246,956
7 AL 878,939 18 TN 660,160 29 MD 565,747 40 MT 479,641 51 HI 234,139
8 MO 784,789 19 GA 652,631 30 VT 564,045 41 OK 469,517 52 VI 99,140
9 MI 776,803 20 OR 627,744 31 AR 561,727 42 NY 461,670 53 PR 98,178
10 DC 756,591 21 MS 621,665 32 KY 543,709 43 ND 434,543 54 GU 55,148
11 VA 740,182 22 ME 614,970 33 CT 540,753 44 WV 425,873 55 AS 0
Amphetamines DistributionPractitioner’s Office
U.S. Drug Enforcement Administration
Diversion Control Division
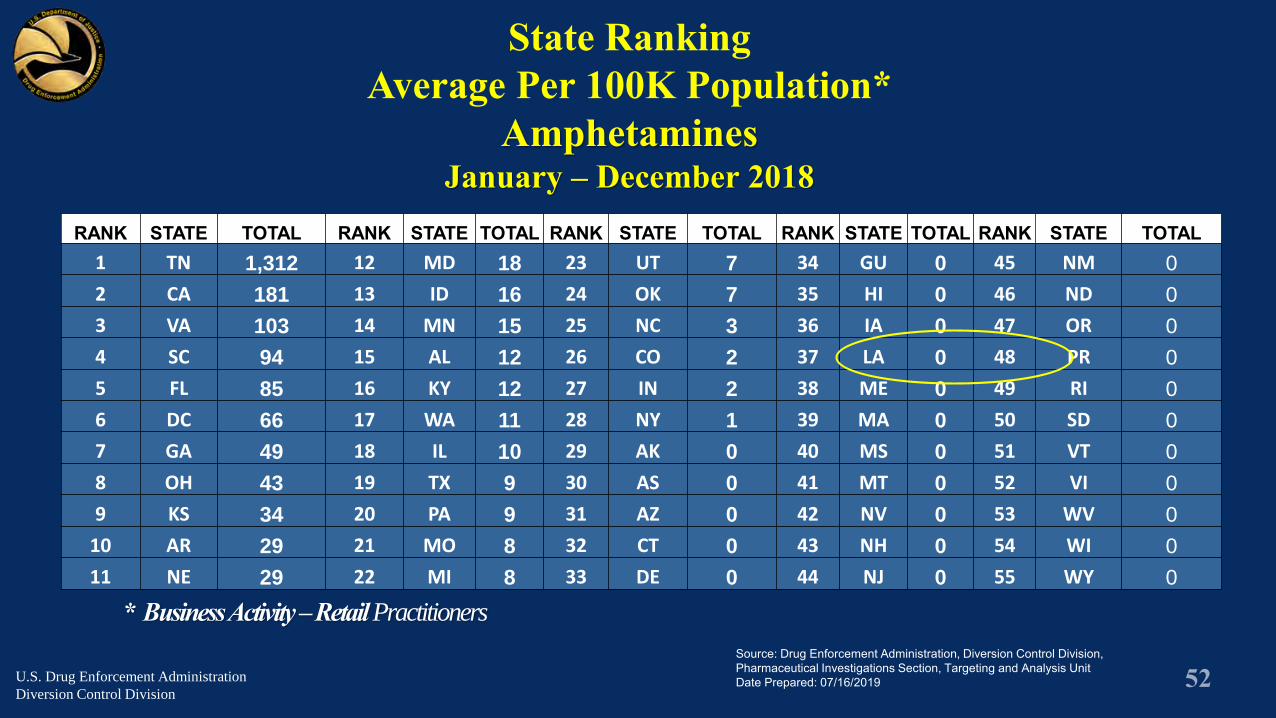
* Business Activity –Retail Practitioners
Source: Drug Enforcement Administration, Diversion Control Division, Pharmaceutical Investigations Section, Targeting and Analysis Unit Date Prepared: 07/16/2019
State Ranking Average Per 100K Population*
AmphetaminesJanuary – December 2018
U.S. Drug Enforcement Administration
Diversion Control Division
RANK STATE TOTAL RANK STATE TOTAL RANK STATE TOTAL RANK STATE TOTAL RANK STATE TOTAL1 TN 1,312 12 MD 18 23 UT 7 34 GU 0 45 NM 0
2 CA 181 13 ID 16 24 OK 7 35 HI 0 46 ND 0
3 VA 103 14 MN 15 25 NC 3 36 IA 0 47 OR 0
4 SC 94 15 AL 12 26 CO 2 37 LA 0 48 PR 0
5 FL 85 16 KY 12 27 IN 2 38 ME 0 49 RI 0
6 DC 66 17 WA 11 28 NY 1 39 MA 0 50 SD 0
7 GA 49 18 IL 10 29 AK 0 40 MS 0 51 VT 0
8 OH 43 19 TX 9 30 AS 0 41 MT 0 52 VI 0
9 KS 34 20 PA 9 31 AZ 0 42 NV 0 53 WV 0
10 AR 29 21 MO 8 32 CT 0 43 NH 0 54 WI 0
11 NE 29 22 MI 8 33 DE 0 44 NJ 0 55 WY 0

Methylphenidate Distribution2014-2018 U.S. Totals
TO
TA
L D
OS
AG
ES
Source: ARCOS Date Prepared: 07/19/2018
U.S. Drug Enforcement Administration
Diversion Control Division
0
1,000,000
2,000,000
3,000,000
4,000,000
5,000,000
6,000,000
Source: ARCOS Date Prepared: 05/28/2019
Drug Enforcement Administration, Diversion Control DivisionPharmaceutical Investigations Section, Targeting and Analysis Unit

NY
WA
ORMT
ID WY
ND
SDMN
IANE
WI MI
CO KS MOIL INUTNV
CA
AZ NM OK
TXAK
AR
LA
TNKY
MS AL GASC
NC
OHVA
PA
MEVT
NJ
MD
RI
DC
DE
HI
VW
FL
HN
PR
U.S. Average: 13,107 Dosages Units
Above Average = 16,385 Dosage Units or moreAverage = 9,830 – 16,384 Dosage UnitsBelow Average = 9,829 Dosage Units or lessZero Dosage UnitsDrug Enforcement Administration, Diversion Control Division
Pharmaceutical Investigations Section, Targeting and Analysis UnitSource: ARCOS
Date Prepared: 07/16/2019
Purchases of Methylphenidate for January - December 2018

Methylphenidate DistributionRetail Pharmacies
U.S. Drug Enforcement Administration
Diversion Control Division

* Business Activity –Retail Pharmacies
State Ranking Average Per 100K Population*
MethylphenidateJanuary – December 2018
Source: Drug Enforcement Administration, Diversion Control Division, Pharmaceutical Investigations Section, Targeting and Analysis Unit Date Prepared: 07/16/2019
U.S. Drug Enforcement Administration
Diversion Control Division
RANK STATE TOTAL RANK STATE TOTAL RANK STATE TOTAL RANK STATE TOTAL RANK STATE TOTAL1 VT 631,987 12 WI 370,580 23 MT 334,250 34 CT 306,889 45 NJ 202,963
2 ME 595,452 13 RI 369,390 24 PA 334,030 35 IL 293,133 46 FL 200,623
3 NH 513,415 14 NC 354,920 25 KS 330,245 36 MS 265,711 47 AK 192,701
4 IA 512,097 15 SC 353,820 26 WA 329,525 37 DC 264,241 48 NM 167,152
5 SD 462,150 16 OR 353,491 27 KY 324,285 38 OK 258,510 49 HI 145,973
6 MA 428,531 17 MI 349,432 28 AL 323,278 39 WY 256,903 50 CA 143,192
7 MO 420,737 18 WV 345,126 29 AR 320,587 40 TN 256,659 51 PR 119,902
8 ND 409,617 19 ID 341,584 30 UT 320,000 41 TX 253,988 52 NV 106,171
9 DE 393,215 20 OH 339,801 31 LA 319,097 42 AZ 253,266 53 VI 28,955
10 NE 378,170 21 IN 338,624 32 GA 317,033 43 NY 230,533 54 GU 25,439
11 MN 373,777 22 MD 335,895 33 VA 309,486 44 CO 214,766 55 AS 0

Methylphenidate DistributionPractitioner’s Office
U.S. Drug Enforcement Administration
Diversion Control Division
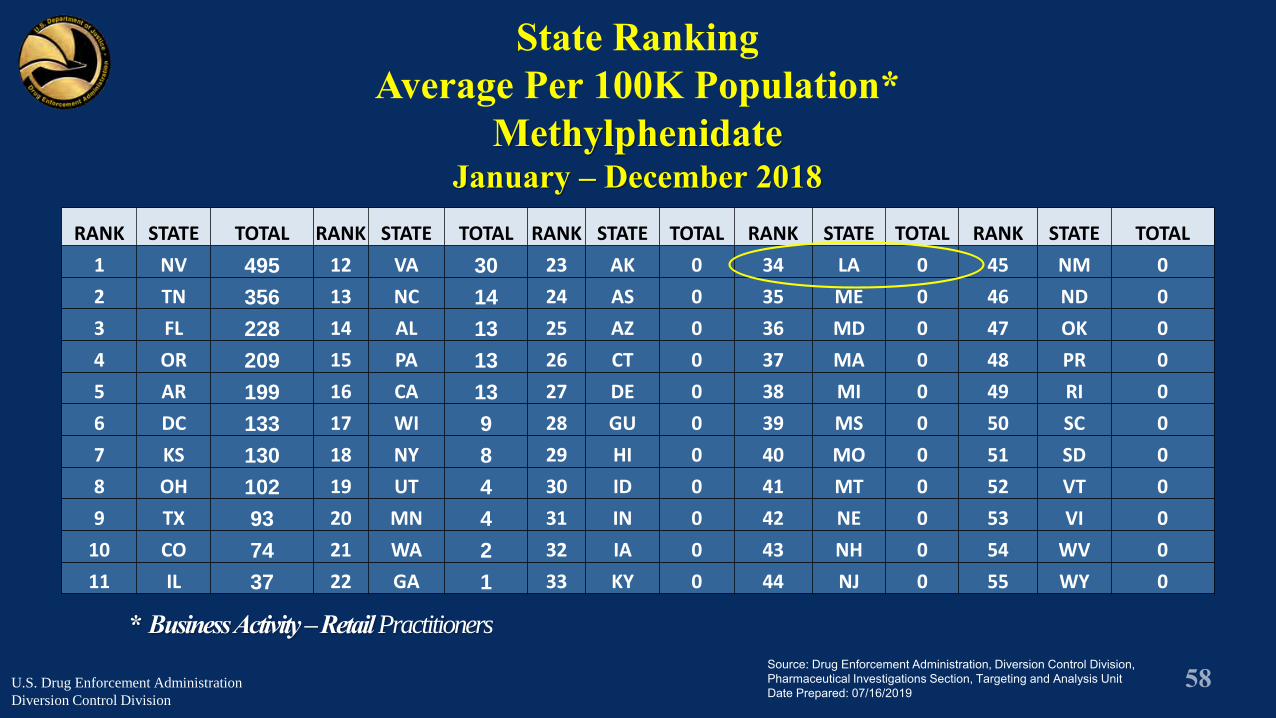
* Business Activity –Retail Practitioners
Source: Drug Enforcement Administration, Diversion Control Division, Pharmaceutical Investigations Section, Targeting and Analysis Unit Date Prepared: 07/16/2019
State Ranking Average Per 100K Population*
MethylphenidateJanuary – December 2018
U.S. Drug Enforcement Administration
Diversion Control Division
RANK STATE TOTAL RANK STATE TOTAL RANK STATE TOTAL RANK STATE TOTAL RANK STATE TOTAL
1 NV 495 12 VA 30 23 AK 0 34 LA 0 45 NM 0
2 TN 356 13 NC 14 24 AS 0 35 ME 0 46 ND 0
3 FL 228 14 AL 13 25 AZ 0 36 MD 0 47 OK 0
4 OR 209 15 PA 13 26 CT 0 37 MA 0 48 PR 0
5 AR 199 16 CA 13 27 DE 0 38 MI 0 49 RI 0
6 DC 133 17 WI 9 28 GU 0 39 MS 0 50 SC 0
7 KS 130 18 NY 8 29 HI 0 40 MO 0 51 SD 0
8 OH 102 19 UT 4 30 ID 0 41 MT 0 52 VT 0
9 TX 93 20 MN 4 31 IN 0 42 NE 0 53 VI 0
10 CO 74 21 WA 2 32 IA 0 43 NH 0 54 WV 0
11 IL 37 22 GA 1 33 KY 0 44 NJ 0 55 WY 0

Morphine Distribution2014 - 2018 U.S. Totals
TO
TA
L D
OS
AG
ES
Source: ARCOS Date Prepared: 07/16/2018
U.S. Drug Enforcement Administration
Diversion Control Division
0
50,000,000
100,000,000
150,000,000
200,000,000
250,000,000
Drug Enforcement Administration, Diversion Control Division, Pharmaceutical Investigations Section, Targeting and Analysis Unit

NY
WA
ORMT
ID WY
ND
SDMN
IANE
WI MI
CO KS MOIL INUTNV
CA
AZ NM OK
TXAK
AR
LA
TNKY
MS AL GASC
NC
OHVA
PA
MEVT
NJ
MD
RI
DC
DE
HI
VW
FL
HN
PR
U.S. Average: 7,991 Dosages
Above Average = 9,990 Dosage Units or moreAverage = 5,993 – 9,989 Dosage UnitsBelow Average = 5,992 Dosage Units or lessZero Dosage Units
Drug Enforcement Administration, Diversion Control DivisionPharmaceutical Investigations Section, Targeting and Analysis Unit
Source: ARCOS Date Prepared: 07/16/2019
Purchases of Morphine for January - December 2018
Morphine DistributionRetail Pharmacies
U.S. Drug Enforcement Administration
Diversion Control Division
* Business Activity –Retail Pharmacies
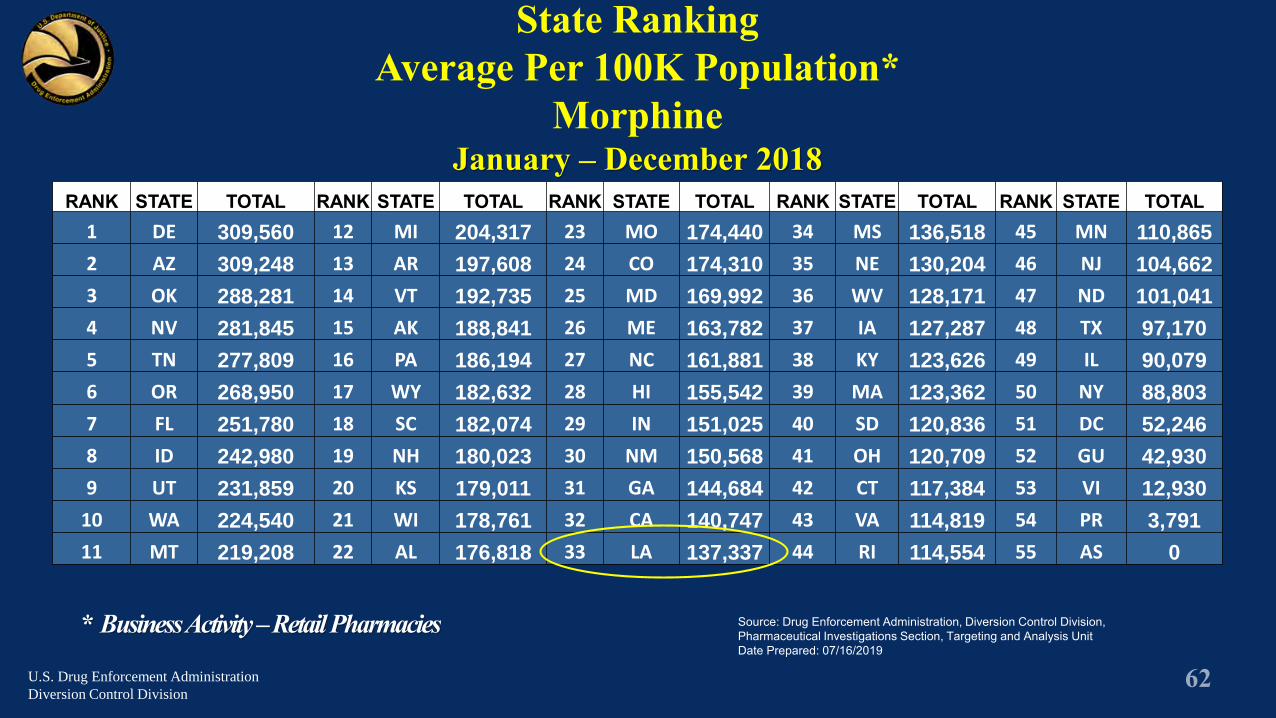
State Ranking Average Per 100K Population*
MorphineJanuary – December 2018
Source: Drug Enforcement Administration, Diversion Control Division, Pharmaceutical Investigations Section, Targeting and Analysis Unit Date Prepared: 07/16/2019
U.S. Drug Enforcement Administration
Diversion Control Division
RANK STATE TOTAL RANK STATE TOTAL RANK STATE TOTAL RANK STATE TOTAL RANK STATE TOTAL1 DE 309,560 12 MI 204,317 23 MO 174,440 34 MS 136,518 45 MN 110,865
2 AZ 309,248 13 AR 197,608 24 CO 174,310 35 NE 130,204 46 NJ 104,662
3 OK 288,281 14 VT 192,735 25 MD 169,992 36 WV 128,171 47 ND 101,041
4 NV 281,845 15 AK 188,841 26 ME 163,782 37 IA 127,287 48 TX 97,170
5 TN 277,809 16 PA 186,194 27 NC 161,881 38 KY 123,626 49 IL 90,079
6 OR 268,950 17 WY 182,632 28 HI 155,542 39 MA 123,362 50 NY 88,803
7 FL 251,780 18 SC 182,074 29 IN 151,025 40 SD 120,836 51 DC 52,246
8 ID 242,980 19 NH 180,023 30 NM 150,568 41 OH 120,709 52 GU 42,930
9 UT 231,859 20 KS 179,011 31 GA 144,684 42 CT 117,384 53 VI 12,930
10 WA 224,540 21 WI 178,761 32 CA 140,747 43 VA 114,819 54 PR 3,791
11 MT 219,208 22 AL 176,818 33 LA 137,337 44 RI 114,554 55 AS 0

Morphine DistributionPractitioner’s Office
U.S. Drug Enforcement Administration
Diversion Control Division
* Business Activity –Retail Practitioners Source: Drug Enforcement Administration, Diversion Control Division, Pharmaceutical Investigations Section, Targeting and Analysis Unit Date Prepared: 07/16/2019
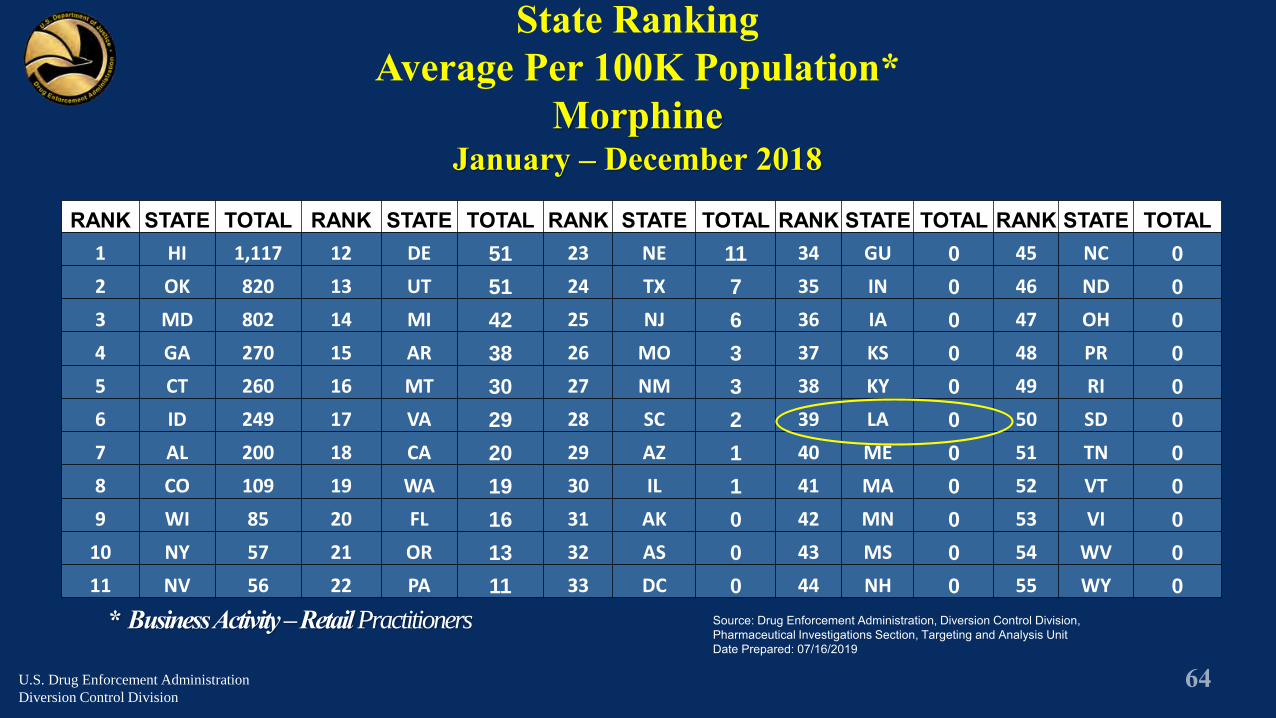
State Ranking Average Per 100K Population*
MorphineJanuary – December 2018
U.S. Drug Enforcement Administration
Diversion Control Division
RANK STATE TOTAL RANK STATE TOTAL RANK STATE TOTAL RANK STATE TOTAL RANK STATE TOTAL1 HI 1,117 12 DE 51 23 NE 11 34 GU 0 45 NC 0
2 OK 820 13 UT 51 24 TX 7 35 IN 0 46 ND 0
3 MD 802 14 MI 42 25 NJ 6 36 IA 0 47 OH 0
4 GA 270 15 AR 38 26 MO 3 37 KS 0 48 PR 0
5 CT 260 16 MT 30 27 NM 3 38 KY 0 49 RI 0
6 ID 249 17 VA 29 28 SC 2 39 LA 0 50 SD 0
7 AL 200 18 CA 20 29 AZ 1 40 ME 0 51 TN 0
8 CO 109 19 WA 19 30 IL 1 41 MA 0 52 VT 0
9 WI 85 20 FL 16 31 AK 0 42 MN 0 53 VI 0
10 NY 57 21 OR 13 32 AS 0 43 MS 0 54 WV 0
11 NV 56 22 PA 11 33 DC 0 44 NH 0 55 WY 0

Drug Trends
U.S. Drug Enforcement Administration
Diversion Control Division

Heroin and Fentanyl
U.S. Drug Enforcement Administration
Diversion Control Division

Heroin• The raw material (opium) to manufacture heroin comes from
the poppy plant.
• The raw material (opium) comes from outside of the U.S. –Asia, Pakistan, Afghanistan.
• Heroin comes in through different drug routes – primarily through Mexico.
• Heroin use has increased in the last 5 years.
U.S. Drug Enforcement Administration
Diversion Control Division

Fentanyl Fentanyl is a synthetic opioid.
Fentanyl is very powerful (50-100 times more potent than heroin).
Dealers are combining Fentanyl with Heroin, pills, marijuana, counterfeit pills, etc.
Carfentanil (100 times more potent than Fentanyl).
Carfentanil is obtained illicitly.
U.S. Drug Enforcement Administration
Diversion Control Division

Fentanyl Is purchased from China and shipped directly to the United States or
smuggled through Mexico.
May 2015 Chinese Customs
seized 46 Kilos of Fentanyl
and 26 Kilos of acetyl
fentanyl.
6 customs officers became ill
1 in a coma after handling
U.S. Drug Enforcement Administration
Diversion Control Division

Lethal Dose
Fentanyl
Heroin Fentanyl Carfentanil
U.S. Drug Enforcement Administration
Diversion Control Division
Be cautious when inventorying personal items in ED or the hospital.
Be cautious when touching patients.
Be cautions when going through a patient’s personal items.
Don’t ever take back a patient’s medications.
Fentanyl Dangers to Practitioners
U.S. Drug Enforcement Administration
Diversion Control Division

From Pills to Heroin
U.S. Drug Enforcement Administration
Diversion Control Division

75% of heroin users switched after first using
controlled substance prescription pain relievers.
Heroin is much cheaper than prescription drugs.
Deck: 1 small bag of heroin ($8 to $10)
Bundle: 10 bags of heroin
From Pills to Heroin
U.S. Drug Enforcement Administration
Diversion Control Division

Prescription Drug Abuse Trends
U.S. Drug Enforcement Administration
Diversion Control Division

Prescription Drug Abuse
Is Driven By-
Indiscriminate Prescribing AndCriminal Activity
U.S. Drug Enforcement Administration
Diversion Control Division

Hydrocodone, 41%
Oxycodone,
23%
Codeine, 16%
Tramadol, 10%
Buprenorphine, 4%
Morphine, 3%Methadone, 2% Fentanyl, 1%
Prescription Pain Reliever Misuse(Age 12 and Older)(2016)
Source: National Survey On Drug Use and Health (2016)
Total past year
abusers: 11,517,000
U.S. Drug Enforcement Administration
Diversion Control Division

Practitioners, 36%
Friend or Relative, 54%
Drug Dealer, Stranger, 5% Other, 5%
Where Do They Come From?
U.S. Drug Enforcement Administration
Office of Diversion Control
Source: Department of Health and Human Services

Many Patients Share Prescribed Controlled Substances
University of Pennsylvania Dental School Study:
*More than half of the narcotics prescribed for wisdom teeth removal go unused…findings suggest that more than 100 million pills prescribed go unused… leaving the door open for possible misuse or abuse.
Source: https://www.pennmedicine.org/news/news-releases/2016/september/100-million-prescription-opioid https://www.nlm.nih.gov/medlineplus/news/fullstory_159336.html
U.S. Drug Enforcement Administration
Diversion Control Division
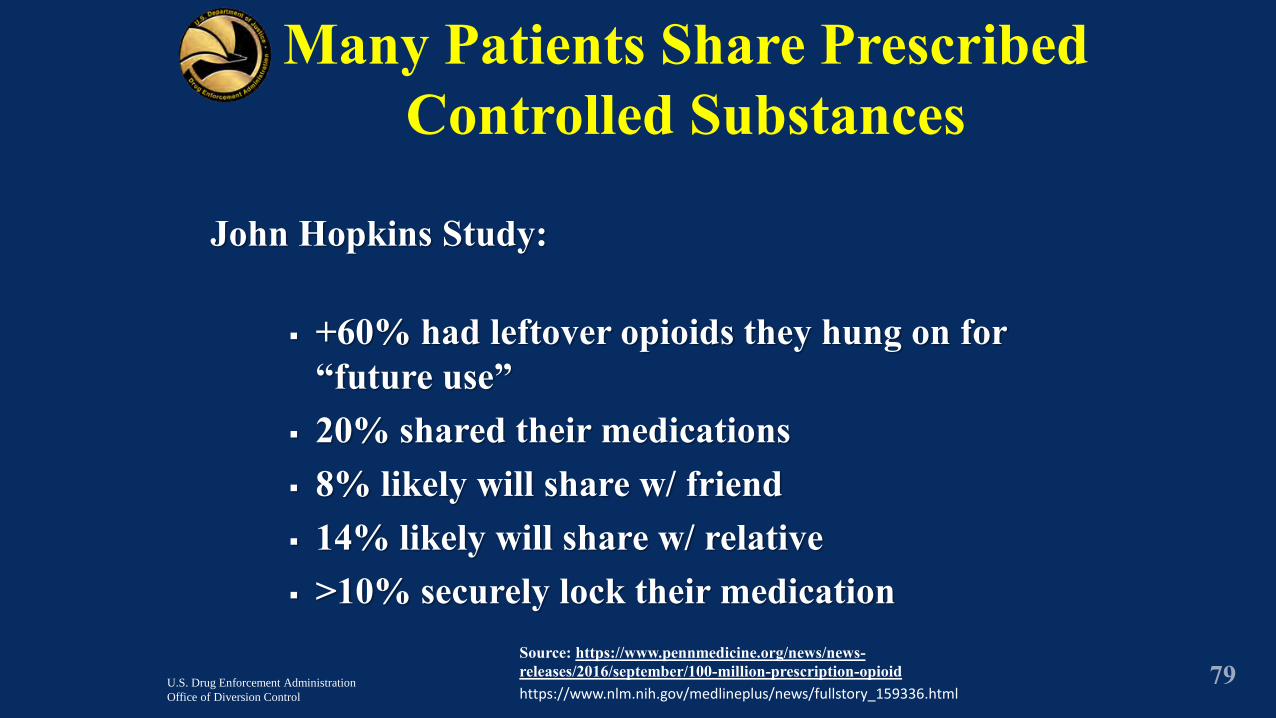
John Hopkins Study:
+60% had leftover opioids they hung on for “future use”
20% shared their medications 8% likely will share w/ friend 14% likely will share w/ relative >10% securely lock their medication
Source: https://www.pennmedicine.org/news/news-releases/2016/september/100-million-prescription-opioid https://www.nlm.nih.gov/medlineplus/news/fullstory_159336.html
Many Patients Share Prescribed Controlled Substances
U.S. Drug Enforcement Administration
Office of Diversion Control
John Hopkins Study:
The study further explored adult attitudes towards controlled substances and found:
73 percent of adults agreed that children can overdose on opioids more easily than adults.
Source: https://www.pennmedicine.org/news/news-releases/2016/september/100-million-prescription-opioid https://www.nlm.nih.gov/medlineplus/news/fullstory_159336.html
Many Patients Share Prescribed Controlled Substances
U.S. Drug Enforcement Administration
Office of Diversion Control

John Hopkins Study:
Yet found that 13% of the respondents “worry” about their children accessing their opioid medications.
With parents of older children reporting that they were significantly less likely to worry about children accessing medications than parents of younger children.
Source: https://www.pennmedicine.org/news/news-releases/2016/september/100-million-prescription-opioid https://www.nlm.nih.gov/medlineplus/news/fullstory_159336.html
Many Patients Share Prescribed Controlled Substances
U.S. Drug Enforcement Administration
Office of Diversion Control

Violence
U.S. Drug Enforcement Administration
Diversion Control Division

Violence AssociatedWith Opiates
Communities undergo:
Drug related crimesa. Robberiesb. Burglaries/break insc. Drug thefts
Abuse and neglect of children
Domestic violence in the home
Increase of arrestsU.S. Drug Enforcement Administration
Diversion Control Division

56.0% 32.7%
4.8%4.5%
Lost in Transit237 Thefts
Break-In/Burglary257 Thefts
Nationwide Practitioner TheftsJanuary 1, 2014 – December 31, 2018
Other2,974 Thefts
Employee Pilferage1,736 Thefts
Customer Theft100 Thefts – 1.9%
Robbery5 Thefts - 0.1%
Drug Enforcement Administration, Diversion Control Division, Targeting & Special Projects Section, Reports Analysis UnitSource: ARCOS
Date Prepared: 10/18/2019
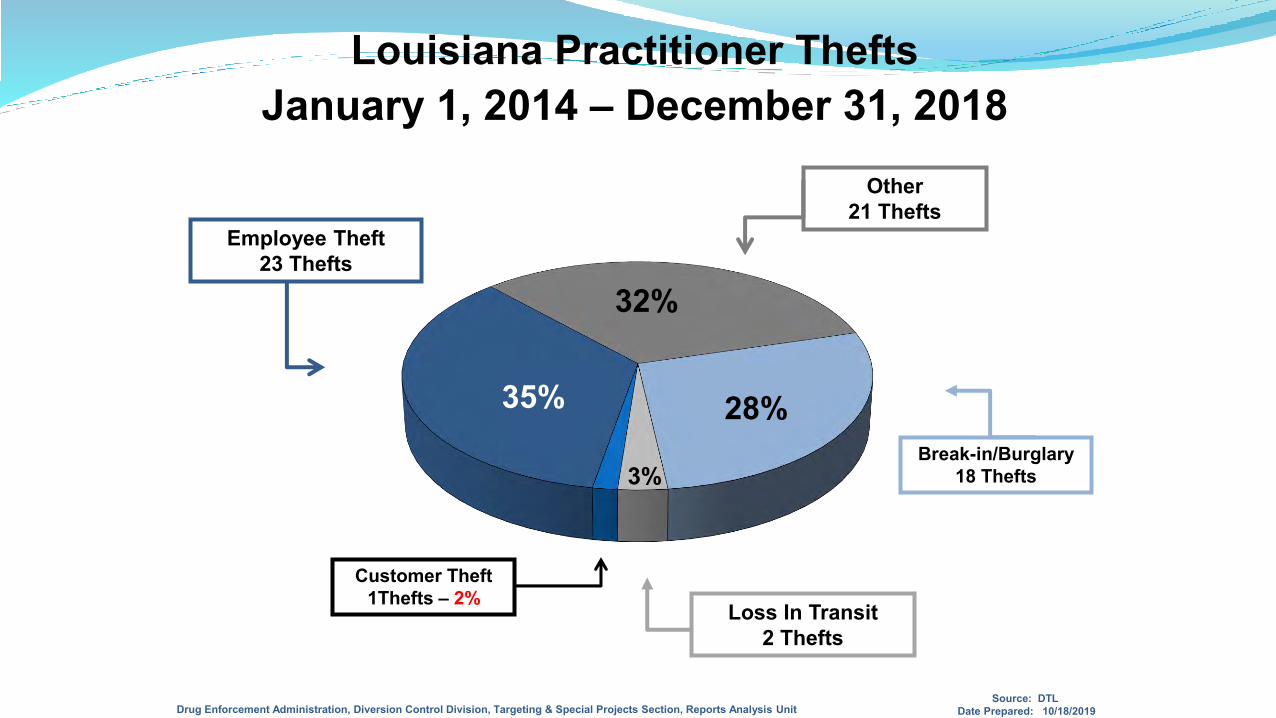
35%
32%
28%
3%
Louisiana Practitioner TheftsJanuary 1, 2014 – December 31, 2018
Break-in/Burglary18 Thefts
Employee Theft23 Thefts
Other21 Thefts
Loss In Transit2 Thefts
Drug Enforcement Administration, Diversion Control Division, Targeting & Special Projects Section, Reports Analysis UnitSource: DTL
Date Prepared: 10/18/2019
Customer Theft1Thefts – 2%
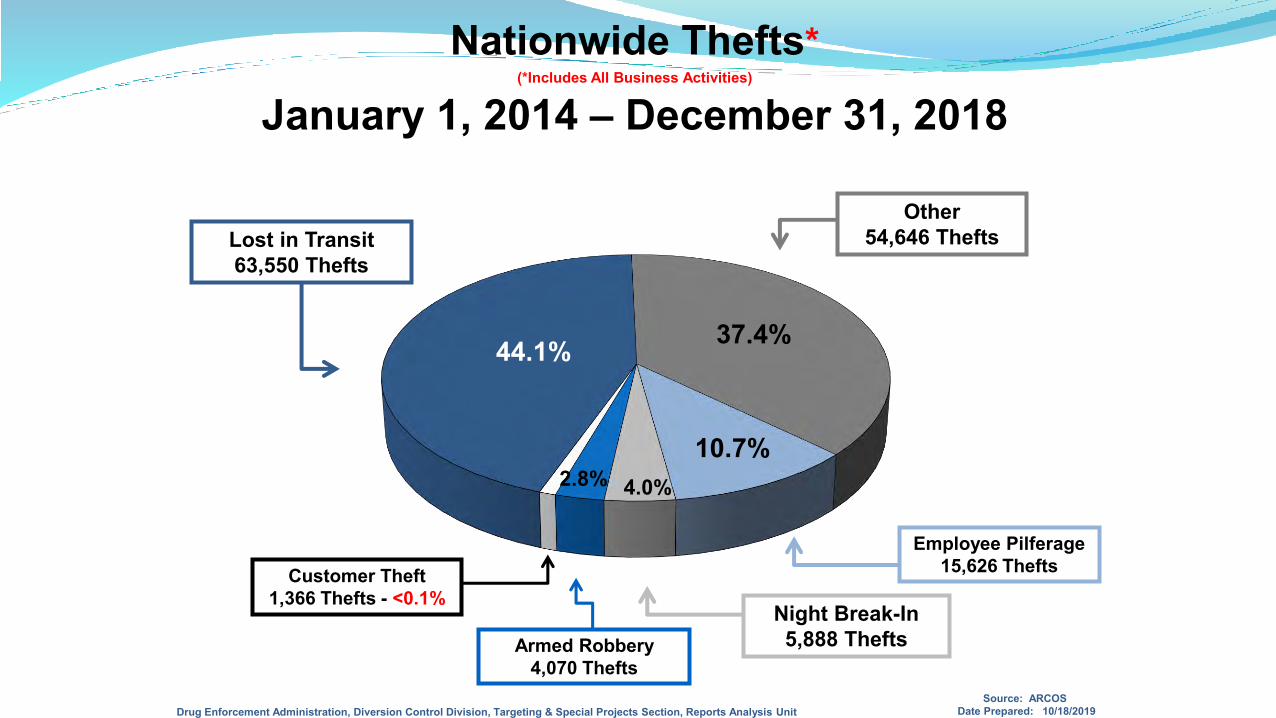
44.1% 37.4%
10.7%4.0%2.8%
Night Break-In5,888 Thefts
Employee Pilferage 15,626 Thefts
Nationwide Thefts*(*Includes All Business Activities)
January 1, 2014 – December 31, 2018
Lost in Transit 63,550 Thefts
Other54,646 Thefts
Armed Robbery4,070 Thefts
Customer Theft1,366 Thefts - <0.1%
Drug Enforcement Administration, Diversion Control Division, Targeting & Special Projects Section, Reports Analysis UnitSource: ARCOS
Date Prepared: 10/18/2019

50.6%16.7%
14.9%
9.5%7.7%
Robbery486 Thefts
Other 759 Thefts
Louisiana Thefts*(*Includes All Business Activities)
January 1, 2014 – December 31, 2018Break-In/Burglary
2,582 TheftsEmployee Theft
853 Thefts
Lost in Transit395 Thefts – 0.4%
Customer Theft19 Thefts – 0.1%
Drug Enforcement Administration, Diversion Control Division, Targeting & Special Projects Section, Reports Analysis UnitSource: ARCOS
Date Prepared: 10/18/2019
Packaging Discrepancy 5 Theft - 0.1%

CDC Guidelines Prescribing Opioids for Chronic Pain
Clinical Reminders:
Opioids are not first-line or routine therapy for chronic pain.
Establish and measure goals for pain and function.
Discuss benefits, risks and availability of non opioid therapies with patients.
Source: CDC Morbidity & Mortality Weekly Report CDC Guideline for Prescribing Opioids for Chronic Pain —
United States, 2016, March 15, 2016 www.cdc.gov/drugoverdose/prescribing/guideline.html
U.S. Drug Enforcement Administration
Diversion Control Division

Clinical Reminders:
Use immediate-release opioids when starting.
Start low and go slow.
When opioids are needed for acute pain, prescribe no more than needed.
CDC Guidelines Prescribing Opioids for Chronic Pain
Source: CDC Morbidity & Mortality Weekly Report CDC Guideline for Prescribing Opioids for Chronic Pain —
United States, 2016, March 15, 2016 www.cdc.gov/drugoverdose/prescribing/guideline.html
U.S. Drug Enforcement Administration
Diversion Control Division

Clinical Reminders:
Do not prescribe ER/LA opioids for acute pain.
Follow-up and re-evaluate risk of harm; reduce dose or taper and discontinue if needed.
Evaluate risk factors for opioid-related harms.
CDC Guidelines Prescribing Opioids for Chronic Pain
Source: CDC Morbidity & Mortality Weekly Report CDC Guideline for Prescribing Opioids for Chronic Pain —
United States, 2016, March 15, 2016 www.cdc.gov/drugoverdose/prescribing/guideline.html
U.S. Drug Enforcement Administration
Diversion Control Division

Clinical Reminders:
Check PDMP for higher dosages and prescriptions from other providers.
Use urine drug testing to identify prescribed substances and undisclosed use.
Avoid concurrent benzodiazepine and opioid prescribing.
Arrange treatment for opioid use disorder if needed.
CDC Guidelines Prescribing Opioids for Chronic Pain
Source: CDC Morbidity & Mortality Weekly Report CDC Guideline for Prescribing Opioids for Chronic Pain —
United States, 2016, March 15, 2016 www.cdc.gov/drugoverdose/prescribing/guideline.html
U.S. Drug Enforcement Administration
Diversion Control Division
Survey of Long-Term Painkiller Users
Majority say their doctor talked about possibility of addiction or dependence – 61% say there was no discussion about plan to get them off.
Majority say they used the drugs to relieve pain. Other major reasons for taking them: 20% - ‘for fun or get high” 14% - “to deal with day-to-day stress” 10% - “to relax or relieve tension”
Source: Washington Post/Kaiser Family Foundation Survey of Long-Term Prescription Painkiller Users and Their Household Members, December 2016
U.S. Drug Enforcement Administration
Diversion Control Division

Survey of Long-Term Painkiller Users
Other Findings: 34% admit being dependent or addicted. 17% have taken painkillers that were not specifically prescribed
for them. 14% have given their painkillers to a family member or friend. 20% know or suspect someone was using, taking or selling their
painkillers.
Source: Washington Post/Kaiser Family Foundation Survey of Long-Term Prescription Painkiller Users and Their Household Members, December 2016
U.S. Drug Enforcement Administration
Diversion Control Division

• HHS Guide for Clinicians on the Appropriate Dosage Reduction or Discontinuation of Long-Term Opioid Analgesics Oct. 2019
Risks of Rapid Opioid Taper
• Opioids should not be tapered rapidly or discontinued suddenly due to the risks of significant opioid withdrawal.
• Risks of rapid tapering or sudden discontinuation of opioids in physically dependent patients include acute withdrawal symptoms, exacerbation of pain, serious psychological distress, and thoughts of suicide. Patients may seek other sources of opioids, potentially including illicit opioids, as a way to treat their pain or withdrawal symptoms.
• HHS Guide for Clinicians on the Appropriate Dosage Reduction or Discontinuation of Long-Term Opioid Analgesics Oct. 2019

• HHS Guide for Clinicians on the Appropriate Dosage Reduction or Discontinuation of Long-Term Opioid Analgesics Oct. 2019
Risks of Rapid Opioid Taper (cont’d)
• Unless there are indications of a life-threatening issue, such as warning signs of impending overdose, HHS does not recommend abrupt opioid dose reduction or discontinuation.

1. Which country, per million population, has the largest amount of drug induced deaths ages 15-64?
A. SwedenB. GermanyC. United StatesD. RussiaE. China
Post Questions
U.S. Drug Enforcement Administration
Diversion Control Division

2. Where does Louisiana rate in the United States in the amount of hydrocodone dispensed?
A. 15thB. 48thC. 10thD. 1st
Post Questions
U.S. Drug Enforcement Administration
Diversion Control Division

3. What percentage of the world’s hydrocodone production does the United States consume?
A. Less than 10%B. 34%C. 50%D. More than 70%
Post Questions
U.S. Drug Enforcement Administration
Diversion Control Division

4. What is the most misused prescription controlled substance pain reliever in the United States?
A. OxycodoneB. MorphineC. HydrocodoneD. Codeine
Post Questions
U.S. Drug Enforcement Administration
Diversion Control Division

5. What percent of heroin users began their addictions with prescribed pain relievers?
A. 15%B. 40%C. 75%D. 90%E. 99%
Post Questions
U.S. Drug Enforcement Administration
Diversion Control Division