practitioners’ judgment and deferred tax dis- closure: a...
TRANSCRIPT
WU International Taxation Research Paper Series
No. 2014 - 07
Practitioners’ Judgment and Deferred Tax Dis-closure: A Case for Materiality
Eva Eberhartinger Nadia Genest Soojin Lee
Editors:
Eva Eberhartinger, Michael Lang, Rupert Sausgruber and Martin Zagler (Vienna University of Economics and Business), and Erich Kirchler (University of Vienna)
Correspondence Address: Eva Eberhartinger and Nadia Genest, WU Vienna University of Economics and Business Department of Finance, Accounting and Statistics, Tax Management Group, Welthandelsplatz 1, A – 1020 Vienna, Austria; Soojin Lee, Rietlandpark 301, 1019 DW Amsterdam, The NetherlandsE-mail: [email protected]; [email protected]; [email protected]
Practitioners’ Judgment and Deferred Tax Disclosure: A Case for
Materiality
Eva Eberhartinger*, Nadia Genest*, Soojin Lee**
* WU Vienna University of Economics and Business, Department of Finance, Accounting and
Statistics, Austria, ** International Bureau of Fiscal Documentation (IBFD), The Netherlands
The authors would like to thank Matthias Petutschnig, Caren Sureth-Sloane, two anonymous
reviewers of VHB Jahrestagung 2014, and the participants and discussants of the WU Accounting
Research Seminar, and of the EAA, AAA and CAAA annual congresses. Financial support from the
Austrian Science Fund (FWF): W 1235-G16 is gratefully acknowledged.

Practitioners’ Judgment and Deferred Tax Disclosure: A Case for Materiality
Abstract
Against the background of increasing tension between the need for additional
disclosure and an information overload in financial statements, this study investigates
the relevance of specific tax accounting information in an experimental setting.
Participants make judgments on the financial performance, investment attractiveness
and tax position of the firm, in absence or in presence of detailed tax information in the
other comprehensive income statement. Our results do not support the notion that such
deferred tax information has an effect on the judgment of experts, as long as the
amounts of deferred tax are normal. However, when the detailed amounts of deferred
tax are abnormally high, judgment differs significantly. Our result is important for
standard setters, as they may consider further developing guidance in standards (such
as IAS 1 and IAS 12) and in the Practice Statement for how to judge materiality of
information, in accordance with the materiality principle set forth in IAS 1.31. By
doing so, the risk of information overload can be reduced. Our study thus contributes to
the current debate on the extent of disclosure. Our results are novel and the method
used allows for the isolation of effects and the identification of causal relationships.
Keywords: deferred taxes; other comprehensive income; income tax disclosure;
information processing

2
Practitioners’ Judgment and Deferred Tax Disclosure: A Case for
Materiality
1. Introduction
One of the main purposes of financial statements is to provide information and insight into the
financial and economic state of a firm. Indeed, enhancing transparency is one of the drivers of
financial reporting. According to the principal-agent theory, additional disclosure will reduce
information asymmetry, lower transaction costs and thus decrease the cost of capital and enhance the
firm’s market value. Hence, disclosure requirements have increased considerably in recent years. As a
reaction to ever increasing disclosure requirements, complaints of an information overload have arisen,
claiming that too much disclosure may obscure true transparency (EFRAG, 2011; PwC, 2011; KPMG,
2011; ESSEC, 2013; Raedy, Seidman & Shackelford, 2011; Groves, 1994). Such complaints relate to
cognitive biases: amongst a multitude of information, where the difference between material and
immaterial items of information is blurred, information processing – by financial statement users, in
our case – is flawed (Schroder, Driver & Streufert, 1967; Agnew & Szykman, 2005). The tension
between more detailed disclosure in order to reduce information asymmetry, and less but material
disclosure in order to avoid an information overload, is reflected in accounting rules which demands
detailed disclosure only when the information is material.1
To better understand the effect of cognitive biases in relation to financial statement disclosure,
1 In December 2014 IAS 1.31 was amended to provide as follows: “Some IFRSs specify information that is required to be included in the financial statements, which include the notes. An entity need not provide a specific disclosure required by an IFRS if the information resulting from that disclosure is not material. This is the case even if the IFRS contains a list of specific requirements or describes them as minimum requirements. An entity shall also consider whether to provide additional disclosures when compliance with the specific requirements in IFRS is insufficient to enable users of financial statements to understand the impact of particular transactions, other events and conditions on the entity’s financial position and financial performance”.

3
we test the effect of disclosure on the judgment of financial statement users on the firm in an
experimental setting. Based on cognitive theory, we attempt to answer the questions as to whether
disclosure per se (as compared to non-disclosure), and whether the amounts which are disclosed
(abnormally high as compared to normal), have an effect on users’ judgment of the economic state of
the firm. We find that users’ judgment is affected only in those cases where amounts are abnormally
high.
We use the example of tax information in other comprehensive income (OCI). To test the
effect of disclosure of tax information on separate OCI line items, we use an experimental setting
which allows us to ceteris paribus manipulate tax information only and identify causal relation
between such information and users’ judgment. We present the participants (172 accounting experts,
mostly practitioners) of the different treatment groups with anonymized financial statements of a
listed multinational corporation (MNC). The financial statements in each treatment group varies with
respect to the detailed tax information presented on the OCI. The tax information is either not
available (all figures are presented on a net-of-tax-basis, after deduction of the normal amount of
deferred tax: Group A receives Case A “Net-of-Tax”), or separately disclosed for each line item
(Group B receives Case B “Tax detail”), or abnormally high amounts of tax information is separately
disclosed for each line item (Group C receives Case C “Tax detail x3”2). In each of the treatment
groups, participants make judgments on the financial performance, investment attractiveness and tax
position of the firm based on the financial statement information they receive.
Our results show no significant difference in judgment between two treatments in a normal
setting (Case A “Net-of-Tax” versus Case B “Tax Detail”). However, we do observe a significant
difference in judgment for Case C (Case B “Tax Detail” versus Case C “Tax Detail x3”) where the
amounts of deferred tax information are abnormally high (tripled) while the OCI total remains
2 The pre-tax OCI line item is adapted accordingly, so that the net-of-tax OCI line item and the OCI total remain unchanged.
4
unchanged. Our results confirm that tax information in OCI has a significant impact on the judgment
of practitioners in the case of information which is perceived as abnormal, and which therefore
deviates from expectations.
The International Accounting Standard Board (IASB) is well aware of the importance of the
materiality principle. Its disclosure initiative (IASB, 2013d) results from a survey which points to the
concept of materiality as one major cause of the “disclosure problem”, i.e. too little relevant
information and too much irrelevant information (IASB, 2013a). Consequently, IAS 1 was amended
in 2014 to clarify that an entity is not required to disclose information which is immaterial to enabling
preparers’ use of judgment. The IASB is currently working on a Materiality Practice Statement
project, and on a Definition of Materiality project. Our research connects to the IASB’s focus on the
materiality principle and provides further insight on information processing by financial statement
users.
In this study, we specifically focus on the disclosure of deferred tax on items of OCI required
by IAS 12 Accounting for Income Taxes. The standard requires an entity to separately disclose
deferred taxes on OCI line items, either on the face of the OCI statement or in the notes. Deferred tax
in OCI is particularly well suited for our research question, as it reflects the tension between the need
for disclosure and the possible information overload. On the one hand, the recent public and political
debate has shown a particular concern for the tax position of multinationals. Calls for even more
disclosure on tax, for example public country-by-country reporting (OECD, 2015), indicate that tax
disclosure is considered highly relevant. On the other hand, the usefulness of OCI is in doubt, and
users seem to have little confidence in OCI statements (Black, 2016; Dhaliwal, Subramanyam and
Trezevant, 1999). The IASB takes the view that disclosing taxes on OCI line items would improve the
clarity and transparency of OCI: "Users of financial statements often requested further information on
tax amounts relating to components of other comprehensive income, because tax rates often differed
from those applied to profit or loss” (IAS 1, BC 68). However, there are opposing views asserting that
allocating taxes to each OCI component can be arbitrary and may involve a high degree of
5
subjectivity due to undefined tax rates (IAS 1, BC 67). Consequently, deferred tax information in OCI
is particularly useful for our analysis.
To our knowledge, this is the first paper that focuses on the cognitive limits of financial statement
disclosure in connection with the materiality principle. Existing studies rather explore the impact of
cognitive limits of financial statement disclosures in relation with the presentation format of
accounting information (e.g. Novak, 2016) or with decision quality (e.g. Iselin, 1988). Our paper
contributes to the stream of literature about information overload in accounting (Eppler & Mengis,
2004) by providing insights into how the concept of information overload interacts with the
materiality principle. Additionally, it contributes to the current debate on the extent of disclosure
(IASB, 2013d) and sheds light on the quantitative aspects of materiality.3 Thus, our result is important
for both preparers of financial statements and standards setters. Accordingly, our paper responds to a
call for research on the value relevance of tax information given in OCI (Black, 2016). Our results
further question the real impact from the IASB’s recent initiatives toward detailed tax disclosure, as
its effects can be unnoticeable in a real-life setting.
This paper proceeds as follows: section 2. studies the background in literature and presents
the hypothesis; section 3. presents the research design; section 4. analyses the results; section 5.
discusses the results and section 6. concludes.
2. Theory, Literature and Hypotheses
2.1. OCI and Tax Disclosure
According to the agency theory, additional disclosure will reduce information asymmetry, lower
transaction costs and thus decrease the cost of capital and enhance the firm’s market value (for
example Botosan & Plumlee, 2002). As such, most of the existing capital market studies show price
3 Thus, this study does not investigate the qualitative aspect of materiality.
6
relevance as well as return relevance of OCI and specific OCI items (Dhaliwal et al., 1999;
Goncharov & Hodgson, 2011; also Cahan, Courtenay, Gronewoller & Upton, 2000; Kanagaretnam,
Mathieu & Shehata, 2009; Biddle & Choi, 2006).
Literature on the relevance of tax disclosure assume that accounting information in general,
and tax disclosure specifically, is considered to be value relevant to equity investors (Barth, Beaver &
Landsman 2001). For instance, McAnally, McGuire and Weaver (2010) and Atwood, Cao, Drake and
Myers (2011) find future-oriented value relevance of tax information, which is highly utilized by
equity investors and reflects current earnings power. In this respect, Lev and Nissim (2004)
empirically test contemporary earnings impacts by showing a stronger association between the tax-to-
book income ratios with current earnings-price ratios. With a particular concern for deferred taxes,
empirical studies find a positive association of deferred tax accounts with firm value (Ayers, 1998)
and with the value of equity in terms of stock returns (Givoly & Hayn, 1992). Yet, a negative relation
between deferred taxes and common stock value is also documented (Chandra & Ro, 1997; Chaney &
Jeter, 1992). Although the directions of the correlations differ, past studies support the informative
attributes of deferred tax information, which is taken into account by investors through the market’s
perception of deferred tax assets and liabilities as real assets and liabilities (Chang, Herbohn &
Tutticci, 2009).
On the other hand, there is a stream of research severely doubting the value-relevance of tax
disclosure. For bond raters’ judgments, the studies of Huss and Zhao (1991) and Chattopadhyay,
Arcelus and Srinivasan (1997) investigate whether the existence of deferred taxes would influence the
corporate bond rating. Both studies show no difference in bond ratings resulting from different
treatment of deferred taxes. With respect to the detailed book-tax difference, Raedy et al. (2011) find
little evidence that equity market prices differ, and conclude that such detailed tax disclosures matter
less to the equity market. Such observations support the view that investors do not perceive deferred
taxes as decision-relevant information and are thus less likely to incorporate deferred taxes in
assessing the firm value (Chludek, 2011).
7
Equally significant, tax disclosure can also include misleading contents that undermine its
relevance. Overesch and Schreiber (2006) show that the relevance of tax information under IAS 12
depends on the respective type of tax planning a firm engages. Limits of effective tax rate disclosure
are also shown by Wilkie and Limberg (1993) and Dunbar and Sansing (2002), who suggest that
effective tax rate is not strongly related to a firm’s performance or tax preferences, and thus effective
tax rate is not able to explain a firm’s tax planning practices. Deficiency in financial reporting of
income taxes is also identified by Bauman, Bauman and Halsey (2001), who find that earnings
management effects of the deferred tax assets allowance cannot be determined solely from the
financial disclosure, and suggest that financial disclosures still need to improve.
In line with principal-agent theory and with the majority of the literature – which shows that
OCI, in itself, as well as disclosure on deferred tax is relevant to users, we propose the following
hypothesis.
H1: Information in OCI, which includes tax information, affects financial statement
users’ perception of the firm’s economic state.
2.2. Cognitive Biases
According to cognitive theory, limited attention stems from restricted capacity to process the
mass of information in the environment. Since cognitive capacity is limited, attention must be
selective and necessitates effort (Kahneman, 1973). Consequently, as generating conscious thoughts
such as judgments on a firm’s economic position requires a focus on particular ideas or memories at
the price of others, differential processing cost arises. Such process implies that some inputs are more
easily perceived than other. The prominence or the level of contrast with others in its context is what
makes a particular item of information more salient (Fiske & Taylor, 1991).
Some researchers suggest that the perception of such information depends on prior user’s
expectations (Hand, 1990; Schrand & Walther, 2000). For instance, large gap between expected

8
amounts and actual amounts in accounting makes information more prominent, which leads to easier
information processing for the user, and to more influence of such information on users’ judgment of
the economic state of the firm.
According to availability heuristic, the way in which attention is directed in conscious thought
is based on possibly recalling related examples (Tversky & Kahneman, 1973), which can lead to
biased thought or judgment. Therefore, when dealing with unfamiliar or complex information, users’
judgment is restricted by cognitive limitations (Hirst & Hopkins, 1998). The theory of bounded
rationality, as developed by Simon (1955; 1956), suggests that human cognition is also limited by
practical boundaries. Constraining factors such as time lead to a simplification of the human decision-
making process. Therefore, in a complex setting, human rationality is limited and does not necessarily
lead to optimal outcomes (Simon, 1991). As such, large amount of information can be viewed as a
complex setting. Accordingly, research from various disciplines show that the quality of decision of
an individual is positively correlated with the amount of information received only up to a certain
point (Agnew & Szykman, 2005; Schroder et al., 1967). Beyond this point, additional information
cannot be processed anymore, and information overload happens (O’Reilly, 1980), which blurs the
individual decision-making process (Schick et al., 1990).
In this regard, Chen, Danielson and Schoderbek (2003) find that the complexity and
unfamiliarity of the deferred tax adjustments disclosure leads to analysts’ misinterpretation of the one-
time items of deferred tax adjustments to tax rate changes. Similar findings are observed by Amir and
Sougiannis (1999), who document that analysts fail to fully capture the implications of tax carry-
forwards on future earnings, and analysts tend to be less precise and biased (i.e. more optimistic) in
forecasting earnings of firms with tax carry-forwards. Given the high complexity of book-tax
differences, Weber (2007) concludes that mispricing is the result of misinterpretation of predictable
future returns which are related to book-to-tax differences.
In summary, the findings from prior literature indicate that the relevance of tax information

9
and its usefulness are evaluated differently in different settings. Although the theoretical aim of
(value-) relevance of (deferred) taxes is set out by principle, its practical effects appear to be rather
mixed, as shown in the findings from prior empirical and behavioural studies. These findings indicate
that the contents of tax disclosure are not necessarily relevant to users. Some favourable views on tax-
relevance seem to be undermined by information overload that users have to deal with.
Based on theory and prior studies, we therefore propose the following hypotheses.
H2: Tax information in OCI affects financial statement users’ perception of the
firm’s economic state, if displayed on the face of the statement.
H3: Abnormal tax information in OCI affects financial statement users’ perception
of the firm’s economic state, if displayed on the face of the statement.
3. Research Design
3.1. Structure
We structure the experiment along the lines of Anandarajan, Belzile, Curatola and Viger (2008), who
use a similar approach to study whether the presentation format of stock-option reporting matters. Our
participants receive an identical set of financial statements, including balance sheet, comprehensive
income statement, cash flow statement and statement of changes in equity. The statement of other
comprehensive income is manipulated: three different groups receive different versions with regard to
the quality of the information on deferred tax. Through a questionnaire that includes a set of 7
questions in total, participants are asked to judge the economic state of the firm.
3.2. Participants
172 individuals participated in the experiment. The participants are a mix of practitioners and students.
10
Practitioners include experts in the field of accounting, auditing or tax. Approximately one third (36%)
of all participants are certified tax advisors4 and/or certified public accountants. Approximately two
thirds (63%) of all participants are employed by a tax consulting/audit firm at the time of the
experiment. Not all participants have International Financial Reporting Standards (IFRS) experience,
but all have a strong accounting background. Participants also include students in the Master Program
in Tax and Accounting at ### University. As previous education includes financial reporting and
international accounting, these participants have considerable knowledge and a good understanding of
the field. Almost half of the students (46 %) also work (at least) part-time in tax/accounting practice,
and usually seek a professional career in accounting, auditing or tax.
[Insert Table 1 about here]
Given the overlap between practitioners and students (some practitioners also study;
approximately half of the students also work in practice), and to further support the external validity
of the experiment, we form two categories of participants (see Table 2, discussed in section 3.4): 89
“practitioners” include participants with over one year of tax/accounting work experience (also
students with respective work experience); 83 “non-practitioners” include those with nil or up to one
year of experience (mostly students).
Participants were recruited during two tax and accounting conferences that were held at the
### University5. They were invited to stay after the end of the conference and contribute to a research
project. Further, student data were collected during a class in international taxation and another in
4 In ###country###, certified tax advisors possess a university degree, at least three years of practice and hey must have passed an extensive exam on tax and accounting (financial, managerial). They can be considered expert not only in tax but also in financial reporting. 5 Data collection was carried out in two steps; first in 2013 with Cases A and B to test whether there is a difference in users’ perception of the firm with normal amounts of tax information in OCI (in such a case, there would have been no need for the second step) and then in 2015 with Case C to include a comparison with overstated amounts of tax information in OCI.
11
international accounting.6 All 172 participants were told nothing other than that the project is related
to IFRS reporting.
3.3. Test instrument and questionnaire
Our test instrument is the financial statements of a model corporation, including balance sheet;
comprehensive income statement; statement of changes in equity; and cash flow statement. We did
not include notes, statement on corporate governance, management report, etc.
The financial statements given to participants are based on the model financial statement of
an actual MNC after thorough screening. The criteria for choosing the respective MNC were: listing
on an active market (in our case, the German prime market DAX), IFRS reporting (non-industry
specific) and detailed disclosure of deferred tax on OCI on a per-item basis. Furthermore, we chose a
model statement where amounts of deferred tax per line item are average or above the DAX 30
companies, to ensure that amounts are representative but not negligible. To this end, we assume that
items of deferred tax were considered as being material from the firm’s perspective. A one-sample t-
test was run to compare our test instrument’s relative deferred tax figures per OCI line item to the
DAX 30 companies in 2013. The test instrument’s relative deferred tax is not significantly higher
(left-sided t-test, p > 0.05) for any of the line items.7
To eliminate the possibility that participants may be able to identify the model company and
thus might be biased in their judgment, we divided the amounts of the model financial statements by
two, thus maintaining the internal consistency of the statements, and we modified the reporting year.
The statements were distributed in a neutral format to participants. We did not provide any company-
specific information, except clarification that it is a multinational public corporation named “ABC
Group”.
6 Neither co-author was involved in teaching or grading the class. 7 The Mann-Whitney U test gives two line items with a significant (p < 0.05) difference.

12
3.4. Tax information
We manipulate tax in OCI in three ways. In Case A “Net-of-Tax” the line items of OCI were
presented net-of-tax, without any explicit information or mention of deferred tax. In Case B “Tax
Detail”, line items of OCI were presented in gross figure (before tax), followed immediately by the
line “deferred tax” and the net amount. Cases A and B therefore reflect a normal setting, as the
numbers are derived directly from our model statement, i.e. “real life”. Our third manipulation Case C
“Tax Detail x3” represents abnormally high amounts of deferred tax: the nominal deferred tax figures
from Case B were tripled, and the before-tax line items were adapted accordingly.8 In all three
manipulations, the figures of OCI line items after tax and of total OCI after tax are identical.
The manipulation allows us to test our hypotheses. Case A “Net-of-Tax” versus Case B “Tax
Detail” shows the effect of absence versus presence of tax information on judgment (H2) in a normal,
i.e. realistic setting. Case A “Net-of-Tax” versus Case C “Tax Detail x3” shows the effect of
providing versus not providing tax information on judgment in a setting where amounts are
abnormally high (H3).
Contrasting Case B “Tax Detail” versus Case C “Tax Detail x3” allows a more
comprehensive view: the cases not only vary with regard to tax detail, but also with regard to the pre-
tax line items. Any variation in judgment between the two treatments reflects users´ different
perception of both informations (pre-tax line item and tax) and therefore allows to reflect on the
question, whether OCI in itself is deemed relevant for judgment (H1).
Table 2 describes the allocation of participants among the three cases:
[Insert Table 2 about here]
8 A one-sided t-test shows significance (p < 0.05) for the relative deferred tax for three out of five line items compared to the DAX 30 in 2013. Means are largely driven by divergent reclassification to the profit and loss statement. The Mann Whitney U test gives three line items with a significant (p < 0.05) difference.

13
3.5. Judgment
For the questionnaire, we mainly refer to the list of questions used in the study of Anandarajan et al.
(2008), which we modified moderately according to our focus on tax. The questionnaire is composed
of three parts: judgment questions, demographic data and manipulation check. The judgment
questions enquire as to the participants’ perceptions of the firm’s overall financial performance (three
questions), investment appeal (three questions) and tax position (one question), generally using a
nine-point Likert scale, with 1 being “the most favourable and positive opinion” and 9 being “the
most unfavourable and negative opinion”.9 To determine financial performance, three questions on the
financial condition (Q1), on the ability of the group to meet its payments obligations in a timely
manner (Q3) and on its profitability (Q5) are used. Investment appeal is tested by asking about the
riskiness of investing in shares of the firm (Q2), on future growth perspective (Q4) and on the
attractiveness of an investment in shares of the firm (Q6). Finally, the perception of the tax burden of
the firm (very low to very high) is tested (Q7).
By requesting demographic data and professional background information, we collected,
among other information, each participant’s occupation, field of profession, education level and
experience with IFRS.
Finally, one last question tests the participants’ acknowledgement of the (non-)disclosure of
deferred tax information in the comprehensive income statement. This manipulation check allows us
to determine whether the participants recognize the presence or absence of deferred tax information
correctly, in other words, whether they even noticed our specific item of interest.
9 Only regarding profitability (Question 5) are respondents asked to rate the future profitability of the company by using a three-point scale, where 1 is “decrease”, 2 is ”remain” and 3 is “increase”, in order to avoid arbitrary answers.

14
Given that the first language of all participants is ###, all questions and financial statements
are prepared in that language to eliminate any possibility of misinterpretation or misunderstanding.
Before running the experiment, the questionnaires and financial statements were cross-checked by
two other independent ### native speakers. The experiment underwent a pilot test with participants
who are knowledgeable of IFRS reporting.
3.6. Test procedure
In the experiment, we carried out test procedures in three steps. First, we randomly and anonymously
allocated participants to Group A or B (respectively related to Case A “Net-of-Tax” and Case B “Tax
Detail”) for the first round, and Group A or C (respectively related to Case A “Net-of-Tax” and Case
C “Tax Detail x3”) for the second round of data collection. Second, we distributed instructions and
explained that there is no right or wrong answer for this experiment, while not revealing our intentions.
After verifying participants’ understanding of the instructions, we distributed the two sets of
questionnaires for demographic data and judgment questions, and provided the respective financial
statements. Participants were allowed to use as much time as they deemed necessary to complete the
questionnaires, which generally took around 15 minutes. Third, after having collected questionnaires
and financial statements from the participants, we distributed the final manipulation check.
Given that there is no “better” or “more successful” way to answer the questionnaire, and
given that, in particular for fully employed practitioners, any kind of compensation could be only
symbolic, compensation was not offered to participants.10
In brief, Figure 1 below presents the framework and process of our experiment.
10 The question arises as to whether the lack of compensation to subjects reduces external validity, as subjects may not put the same effort into the task when not being rewarded. At least for the professionals group, this assumption is weak, given that the selection procedure ensured the intrinsic motivation of subjects. Furthermore, adequate compensation for professionals (opportunity cost) is precluded by budgetary constraints. We do not believe that for the student group validity is limited. Irrespective, tests of practitioners only suffice to confirm the results and provide external validity.
15
[Insert Figure 1 about here]
4. Results
4.1. Analysis
Participants, as described above, were allocated randomly to the three groups. Randomization among
all participants was in general successful. Only in Group C, significantly (p < 0.05) higher experience
and age, but lower levels of education11 can be observed. The main analysis includes all participants,
while a subsequent analysis focuses exclusively on the subset of practitioners providing better
randomization and higher external validity. The majority of participants (82%) passed the
manipulation check, i.e. correctly identified whether or not detailed information on deferred taxes in
OCI was available (practitioners only: 81%).
Due to the non-normal distribution of data, we use the Kruskal-Wallis Rank-Sum test to
compare results from Cases A “Net-of-Tax”, B “Tax Detail” and C “Tax Detail x3” altogether,
followed by a Mann-Whitney U test for more detailed bilateral results. The Kruskal-Wallis result for
all participants, presented in Table 3, shows that judgment of investment risk (Q2, p = 0.002) and
timeliness of payments (Q3, p = 0.076) significantly differs among the three groups.
[Insert Table 3 about here]
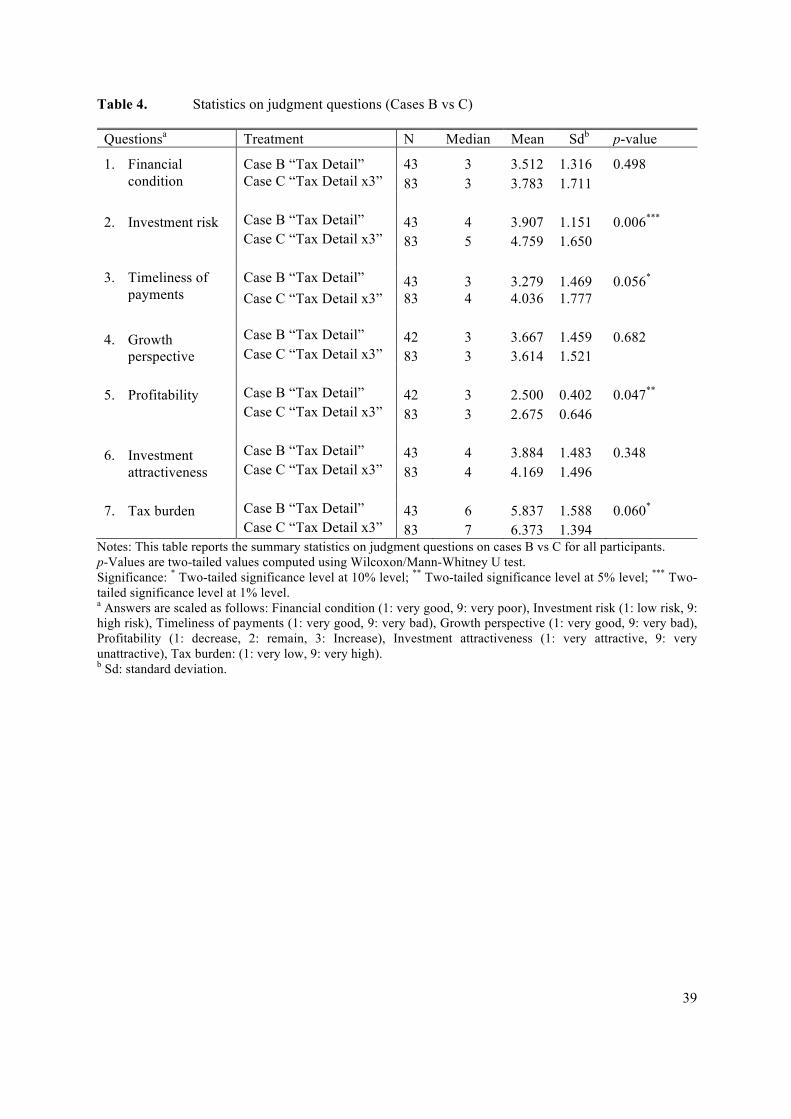
For a more detailed view, and to test our first hypothesis, which states that information in OCI
affects users’ perception, we use the Mann-Whitney U test for Case B “Tax Detail” versus Case C
“Tax Detail x3” (Table 4). The results show that judgments on investment risk (Q2, p = 0.006),
timeliness of payments (Q3, p = 0.056), profitability (Q5, p = 0.047) and tax burden (Q7, p = 0.06)
11 Levels of education are, from highest to lowest: doctoral degree, master’s degree, bachelor’s degree and high school.
16
differ significantly, depending on whether normal amounts, or abnormally high amounts of pre-tax
OCI line items and deferred taxes were disclosed. Therefore, when there is a change in both the
amounts of tax information and OCI items, differences in users’ judgment are significant.
[Insert Table 4 about here]
Testing the subsample of practitioners only (not tabulated), Case B “Tax Detail” versus Case
C “Tax Detail x3” reveals significant difference in judgments on investment risk (Q2, p = 0.054) and
on timeliness of payments (Q3, p = 0.075). This result confirms the assumption that users value OCI
information in general, especially when they are less experienced. We therefore find support for our
first hypothesis (H1). In other words, OCI matters.
Our second hypothesis is specifically directed to normal tax information. For Case A “Net-of-
Tax” versus Case B “Tax Detail”, judgment does not differ significantly. More precisely, the results
from the Mann-Whitney U test reveal that the null hypothesis cannot be rejected for any of our seven
questions (Table 5, p > 0.1 for Q1 – Q7). Therefore, as long as the tax information in OCI is normal
and matches the user’s expectations in so far as it does not deviate significantly from average amounts,
such information does not affect users’ judgment of the firm, H2 is not supported.
To test our third hypothesis, which posits that abnormal tax information (in our case:
abnormally high amounts) matter, we contrast Case A “Net-of-Tax” versus Case C “Tax Detail x3”.
Table 5 confirms that judgments on investment risk (Q2, p = 0.002) and timeliness of payments (Q3,
p = 0.06) differ significantly. In other words, only when tax amounts are abnormally high the
participants’ judgment differ. Our results confirm that tax information in OCI significantly affects
users’ judgment of a firm’s economic state in case of abnormal information, which (possibly) deviates
from expectations (H3).
[Insert Table 5 about here]
Our results hold when testing practitioners only. Again, Case A “Net-of-Tax” versus Case B

17
“Tax Detail” does not show any significant difference in judgment, whereas abnormally high amounts
lead to significantly different judgment of investment risk and timeliness of payments (not tabulated;
Q2 and Q3: p < 0.05).
However, the answers to Q7 regarding the firm’s level of the tax burden do not differ
significantly (p = 0.12). Thus, while we do find that abnormal tax information matters for judging the
firm from a general perspective, we find no confirmation that the judgment of specifically the firm’s
tax burden is based on OCI – in spite of the information being recognized and used for other judgment
questions. It seems that rather, the tax burden is judged without referring to OCI, judgment instead is
based upon information from the income statement and balance sheet, which we do not manipulate
and which therefore does not vary among the three cases. This result is in line with the view that tax
information in OCI may be arbitrary and subjective (IAS1, BC 67) and therefore not appropriate to
specifically be included in tax burden analyses.
In addition to the non-parametric analyses, confirmation and further information can be given
by ordered Logit and Tobit regressions (not tabulated),12 which include demographic variables. Most
importantly, the treatment (with or without normal detailed tax information; Cases A “Net-of-Tax”
and B “Tax Detail”) does not lead to significant results, whereas including the abnormally high
amounts of detailed tax information (Case C “Tax Detail x3”) in the regressions leads to more
significant results.13
12 Further supported by ordered Probit; tables available upon request. 13 For questions Q1 on the 10 %, for Q3 and Q6 on the 5% level and for Q2 on the 1% level; regressions on Cases A “Net-of-Tax”, B “Tax Detail” and C “Tax Detail x3”. For questions Q1 on the 10 % level and for Q2 on the 5% level; regressions on Cases A “Net-of-Tax” and C “Tax Detail x3”. For questions Q6 and Q7 on the 10% level, for Q1 and Q3on the 5% level and for Q2 on the 1% level; regression on Cases B “Tax Detail” and C “Tax Detail x3”. The control variables used are: passing of the manipulation check (yes/no); years of experience; education; IFRS experience; number of consolidated annual statements of listed corporations reviewed during the past three years; age; and gender. Of these, one specific aspect of prior professional experience shows some significance in the normal scenario (Cases A “Net-of-Tax” and B “Tax Detail”), namely the number of consolidated annual statements of listed corporations reviewed during the past three years. For questions Q1 and Q3 on the 10% level, and for Q6 on the 5% level; further, age is significant for Q2 on the 1%
18
To summarize, our results support our first and third hypothesis, i.e. different (tax and non-tax)
information in OCI affects users’ judgment of the firm, and abnormal tax information in OCI affects
users’ judgment on the economic state of the firm. In contrast, our second hypothesis is not supported:
We do not find that revealing normal tax information in OCI affects judgment. These results are in
line with the theory of processing information and support the reasoning according to which
information that is beyond expectations is more salient and is consequently more likely to influence
users’ judgment.
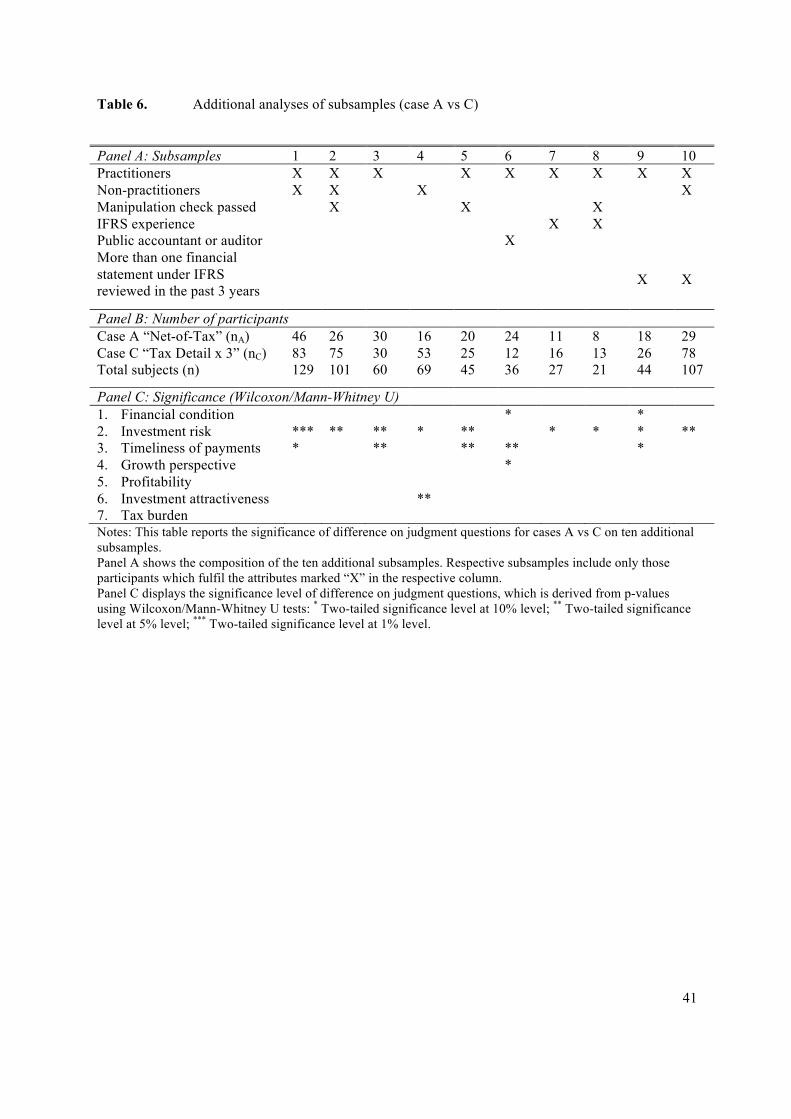
4.2. Robustness
To further strengthen our results for all participants and for practitioners only, as described in the
previous section, we perform several additional analyses of subsamples. One very straightforward
confirmation is that in any of the subsamples (manipulation check passed / not passed; practitioners /
non-practitioners; level of IFRS-experience; accounting profession; and any combination of these)
Case A “Net-of-Tax” versus Case B “Tax Detail” shows no significantly different judgment (not
tabulated). We can thus rule out that our results originate from insufficient IFRS knowledge or
experience, or other lack of insight. In cases where the deferred tax information meets expectations,
our participants judge the firm not differently. We cannot reject the assumption that detailed
disclosure of tax in OCI makes no difference when participants are exposed to the normal setting.
Also the results of Case A “Net-of-Tax” versus Case C “Tax Detail x3” can be confirmed in
our sample splits. Q2 on investment risk yields significantly different judgment for participants who
passed the manipulation check, for practitioners only, and for practitioners who passed the
manipulation check.14 Q3 on timeliness of meeting payments obligations shows significantly lower
judgment for Case C “Tax Detail x3”, when the sample is reduced to practitioners and further to
level. Judgment does not differ significantly depending on the passing of the manipulation check. 14 In addition, the results on Q2 hold for participants who failed the manipulation check, for non-practitioners, and for non-practitioners who failed the manipulation check.
19
practitioners who passed the manipulation check.
Table 6 illustrates our subsamples and the respective levels of significance, which we found
for all seven judgment questions.15
[Insert Table 6 about here]
5. Discussion
Our experiment and the statistical analyses provide three main results: First, they show that disclosure
of normal tax information (Cases A “Net-of-Tax” versus B “Tax Detail”) does not affects users’
judgment of the firm in any way. Indeed, it appears that average tax information meets users’
expectations, which draws no attention. This result is in line with cognitive theory on limited attention
and differential processing cost, as well as availability heuristic. As the disclosed tax information does
not deviate from expectations, no particular focus is needed to process it and users rather pay attention
to other pieces of information to build their judgment. Thus, results from testing Cases A “Net-of-Tax”
versus B “Tax Detail” do not enable us to reject the null hypothesis (H20) according to which
disclosing tax information on the face of financial statement does not lead to different users’ judgment
about a firm’s economic state.
Second, our results show that disclosing of abnormally high amounts of deferred taxes (Case
A “Net-of-Tax” versus Case C “Tax Detail x3”) attract users’ attention, as their judgment
significantly differs for some of the questions regarding the firms’ economic position. Judgment,
differs in particular regarding the investment risk (Q2) and the timeliness of payments (Q3).
Participants judge the risk of investing in the shares of the company significantly higher, when
15 A group size of less than 10 participants reduces reliability of results; nevertheless, results also of small groups give an indication and are therefore tabulated.
20
deferred tax in OCI is abnormally high. Equally, they judge the ability of the firm to meet its payment
obligations in a timely manner significantly worse. It is surprising that judgment of the tax burden of
the firm (Q7) does not differ significantly. It seems that when judging the tax burden of the firm, users
rather rely on information found in the income statement and balance sheet, instead of considering
OCI information. Nonetheless, results from testing Cases A “Net-of-Tax” versus C “Tax Detail x3”
permit the rejection of the null hypothesis (H30), and supports the notion that disclosing abnormally
high tax amounts leads to different users’ judgments about the firms’ economic position, in particular
with regard to investment risk and timeliness of payments.
Third, we find that comparing judgments from disclosures of normal tax information and
abnormally high amounts of tax information (Case B “Tax Detail” versus Case C “Tax Detail x3”)
also leads to significant differences in users’ judgment. However, in this particular case, not only tax
information changed, but also OCI information in general – OCI pre-tax line items had to be adjusted
to take into account tripled tax information in such way that net amounts of OCI line items and OCI
total remained unchanged. Thus, we can infer that OCI information (tax and non-tax) is relevant for
users of financial statements. It is noteworthy that users’ judgments on investment risk (Q2),
timeliness of payments (Q3), profitability (Q5) and tax burden (Q7) differ when all participants (i.e.
practitioners and non-practitioners) are included in the sample, while it is only significant for
judgment of investment risk (Q2) and timeliness of payments (Q3) when testing exclusively
practitioners. Consequently, this result shows that more experienced users (practitioners) perceive less
relevance in OCI information than less experienced ones. Nonetheless, testing Cases B “Tax detail”
versus C “Tax Detail x3” supports the first hypothesis H1, meaning that information included in OCI
seems to be relevant to users of financial statements.
6. Conclusions
Disclosure in financial reporting in general, and in tax accounting in particular, has become

21
more comprehensive, which is justified by the need for transparency and for relevant information.
These are also the main reasons for recent amendments of IAS 12 and IAS 1, which increase the
requirements for disaggregated disclosure on tax in the financial statements. This study attempts to
evaluate whether doubts regarding the benefits of additional disclosure are well founded. We
investigate whether one specific issue of tax disclosure, deferred taxes in OCI, is relevant to users. To
the best of our knowledge, this is the first paper that focuses on tax in OCI. Other studies, in particular
on the decision usefulness of OCI or on the decision usefulness of (deferred) tax accounting, do not
focus on information processing of the actual users and perceptions of income tax disclosures.
Our results demonstrate that there is no significant difference between two treatments of tax
information in OCI in a normal, i.e. realistic, setting; we therefore cannot confirm that detailed
information on deferred tax on a per-item basis is relevant to the judgment of financial statement users
regarding the financial performance, investment appeal and tax position of the model firm.
Given that empirical evidence supports the informative role of OCI (Fernández & Arana,
2010) and highlights the benefits by disclosing more disaggregated contents in OCI (Pinto, 2005;
Mitra & Hossain, 2009; Kubota, Suda and Takehara 2011), our results indicate that tax information in
OCI has significant impact on the judgment of financial statement users in the case of abnormal, i.e.
overstated, figures. In other words, while we cannot find any support for relevance of normal tax
information in OCI, we do find such support when facing abnormally (unexpected) high amounts of
tax information.
Our study informs the current debate on the materiality principle. Given our results, two
approaches are conceivable. Either “material” is understood as “abnormal”, in which case, firms
should be asked to disclose detailed information only if beyond expectations; or “material” is
understood as “important to know whether abnormal or not”. In the latter case, any normal or
abnormal (tax) information should be disclosed that would potentially affects users’ judgment, if it
were abnormal. Such interpretation of “materiality” supports information overload. The IASB has

22
placed some emphasis on the disclosure of tax information in OCI, and has given only little weight to
doubts that were brought forward during the due process, such as possible arbitrary tax allocation and
lack of availability of data. The trust that the IASB has placed in the relevance of such information in
a “normal” setting, however, cannot be supported.
23
References
Aboody, D. (1996). Recognition versus Disclosure in Oil and Gas Industry. Journal of Accounting
Research, 34 (Supplement), 21-32. https://doi.org/10.2307/2491423
Agnew, J. R., & Szykman, L. R. (2005). Asset Allocation and Information Overload: The Influence of
Information Display, Asset Choice, and Investor Experience. Journal of Behavioral Finance,
6(2), 57–70. https://doi.org/10.1207/s15427579jpfm0602_2
Ahmed, A. S., Kilic, E., & Lobo, G. J. (2006). Does Recognition versus Disclosure Matter? Evidence
from Value-Relevance of Banks’ Recognized and Disclosed Derivative Financial Instruments.
The Accounting Review, 81(3), 567-588. https://doi.org/10.2308/accr.2006.81.3.567
Al Jifri, K., & Citron, D. (2009). The Value Relevance of Financial Statement Recognition versus
Note Disclosure: Evidence from Goodwill Accounting. European Accounting Review, 18(4),
123-140. https://doi.org/10.1080/09638180802324351
Amir, E., & Sougiannis, T. (1999). Analysts’ Interpretation and Investors’ Valuation of Tax
Carryforwards*. Contemporary Accounting Research, 16(1), 1–33.
https://doi.org/10.1111/j.1911-3846.1999.tb00572.x
Anandarajan, A., Belzile, R., Curatola, A. P. & Viger, C. (2008). Disclosure versus Recognition in
Stock-Option Reporting: Are Sophisticated Users’ Perceptions and Judgments Influenced by the
Reporting Format? In Advances in Accounting Behavioral Research (Vol. 11, pp. 31–57).
Emerald Group Publishing Limited. https://doi.org/10.1016/S1475-1488(08)11002-X
Atwood, T. J., Drake, M. S., Myers, J. N., & Myers, L. A. (2011). Do earnings reported under IFRS
tell us more about future earnings and cash flows? Journal of Accounting and Public Policy,
30(2), 103–121. https://doi.org/10.1016/j.jaccpubpol.2010.10.001

24
Ayers, B. C. (1998). Deferred Tax Accounting under SFAS No. 109: An Empirical Investigation of
Its Incremental Value-Relevance Relative to APB No. 11. The Accounting Review, 73(2), 195–
212.
Barth, M. E., Beaver, W. H., & Landsman, W. R. (2001). The relevance of the value relevance
literature for financial accounting standard setting: another view. Journal of Accounting and
Economics, 31(1–3), 77–104. https://doi.org/10.1016/S0165-4101(01)00019-2
Bauman, C. C., Bauman, M. P., & Halsey, R. F. (2001). Do Firms Use the Deferred Tax Asset
Valuation Allowance to Manage Earnings? The Journal of the American Taxation Association,
23(s-1), 27–48. https://doi.org/10.2308/jata.2001.23.s-1.27
Bernard, V., & Schipper, K. (1994). Recognition and Disclosure in Financial Reporting (Unpublished
dissertation). University of Michigan, Ann Arbor, MI.
Biddle, G. C., & Choi, J.-H. (2006). Is Comprehensive Income Useful? Journal of Contemporary
Accounting & Economics, 2(1), 1–32. https://doi.org/10.1016/S1815-5669(10)70015-1
Black, D. E. (2016). Other comprehensive income: a review and directions for future research.
Accounting & Finance, 56(1), 9–45. https://doi.org/10.1111/acfi.12186
Blouin, J. and Robinson, L. (2012). Academic Research on FIN 48: What Have We Learned?
Prepared for the Financial Accounting Foundations’ Post-Implementation Review of
Financial Accounting Standards Board Interpretation No. 48.
http://ssrn.com/abstract=2191137 (accessed 6 October 2013).
Botosan, C. A., & Plumlee, M. A. (2002). A Re-examination of Disclosure Level and the Expected
Cost of Equity Capital. Journal of Accounting Research, 40(1), 21–40. https://doi.org/10.1111/
1475-679X.00037
Bratten, B., Choudhary, P., & Schipper, K. (2013). Evidence that Market Participants Assess
25
Recognized and Disclosed Items Similarly When Reliability Is Not an Issue. Accounting
Review, 88(4), pp. 1179-1210. https://doi.org/10.2308/accr-50421
Cahan, S. F., Courtenay, S. M., Gronnewoller, P. L., & Upton, D. R. (2000). Value Relevance of
Mandated Comprehensive Income Disclosures. Journal of Business Finance & Accounting,
27(9–10), 1233–1265. https://doi.org/10.1111/1468-5957.00356
Chambers, D., Linsmeier, T. J., Shakespeare, C., & Sougiannis, T. (2007). An evaluation of SFAS
No. 130 comprehensive income disclosures. Review of Accounting Studies, 12(4), 557–593.
https://doi.org/10.1007/s11142-007-9043-2
Chandra, U., & Ro, B. T. (1997). The association between deferred taxes and common stock risk.
Journal of Accounting and Public Policy, 16(3), 311–333. https://doi.org/10.1016/S0278-
4254(97)00021-5
Chaney, P. K., & Jeter, D. C. (1994). The Effect of Deferred Taxes on Security Prices. Journal of
Accounting, Auditing & Finance, 9(1), 91–116. https://doi.org/10.1177/0148558X9400900106
Chang, C., Herbohn, K., & Tutticci, I. (2009). Market’s perception of deferred tax accruals.
Accounting & Finance, 49(4), 645–673. https://doi.org/10.1111/j.1467-629X.2009.00307.x
Chattopadhyay, S., Arcelus, F. j., & Srinivasan, G. (1997). Deferred Taxes and Bond Ratings: A
Canadian Case. Journal of Business Finance & Accounting, 24(3), 541–557.
https://doi.org/10.1111/1468-5957.00120
Chen, K. C. W., Danielson, M. G., & Schoderbek, M. P. (2003). Analysts’ Interpretation of Transitory
Earnings Components: Evidence from Forecast Revisions after Disclosure of the 1993 Deferred
Tax Adjustment. Journal of Accounting, Auditing & Finance, 18(3), 333–353.
https://doi.org/10.1177/0148558X0301800303

26
Cheng, C. S. A., Cheung, J. K., & Gopalakrishnan, V. (1993). On the Usefulness of Operating
Income, Net Income and Comprehensive Income in Explaining Security Returns. Accounting
and Business Research, 23(91), 195–203. https://doi.org/10.1080/00014788.1993.9729879
Chludek, A. K. (2011). Perceived versus Actual Cash Flow Implications of Deferred Taxes: An
Analysis of Value Relevance and Reversal under IFRS. Journal of International Accounting
Research, 10(1), pp. 1-25.
Christensen, T. E., Paik, G. H. and Stice, E. K. (2008). Creating a Bigger Bath Using the Deferred
Tax Valuation Allowance. Journal of Business Finance and Accounting, 35(5-6), pp. 601-625.
Davis-Friday, P. Y., Folani, L. B., Liu, C. S., & Mittelstaedt, H. F. (1999). The Value Relevance of
Financial Statement Recognition vs. Disclosure: Evidence from SFAS no. 106. The
Accounting Review, 74(4), 403-423. https://doi.org/10.2308/accr.1999.74.4.403.
Davis-Friday, P. Y., Liu, C. S., & Mittelstaedt, H. F. (2004). Recognition and Disclosure Reliability:
Evidence from SFAS no. 106. Contemporary Accounting Research, 21(2), 399-429.
https://doi.org/10.1506/T0VC-Q15Y-W5QV-4UKQ
Dhaliwal, D., Subramanyam, K. R., & Trezevant, R. (1999). Is comprehensive income superior to net
income as a measure of firm performance?1. Journal of Accounting and Economics, 26(1–3),
43–67. https://doi.org/10.1016/S0165-4101(98)00033-0
Dunbar, A. E., & Sansing, R. C. (2002). Measuring Corporate Tax Preferences. The Journal of the
American Taxation Association, 24(2), 1–17. https://doi.org/10.2308/jata.2002.24.2.1
Emrick, C., Wasden, M. and Young, R. (2006). Moody’s Approach to Other Comprehensive Income
Items When Calculating Effective Leverage for Finance Companies,
http://ssrn.com/abstract=959014 (accessed 5 March 2013).
ESSEC Knowledge (2013). Cracking Down on Tax Avoidance: Are Financial Reporting Disclosures

27
Out of Control? ESSEC Business School, http://www.essec.edu/news-faculty/faculty-news-
detail/article/sevir-contre-levasion-fiscale-les-publications-dinformation-financiere-sont-elles-
hors-de-c.html (accessed 20 June 2014).
EY (2014). Improving Disclosure Effectiveness, http://www.ey.com/Publication/vwLUAssets/
Applying IFRS: Improving disclosure effectiveness/$FILE/Applying-DisclEffectiveness-
July%202014.pdf (accessed 20 March 2017).
Eppler, Martin J. & Mengis, Jeanne (2004). The Concept of Information Overload: A Review of
Literature from Organization Science, Accounting, Marketing, MIS, and Related Disciplines.
The Information Society, 20:5, 325-344, DOI: 10.1080/01972240490507974
The European Financial Reporting Advisory Group (2011). Improving the Financial Reporting of
Income Tax. (Discussion Paper) Retrieved from the Financial Reporting Council website:
https://www.frc.org.uk/Our-Work/Publications/ASB/Improving-the-Financial-Reporting-of-
Income-Tax.pdf
Fernández, F. S. & Arana, M. M. C. (2010). Effects of Comprehensive Income on ROE in a Context
of Crisis: Empirical Evidence for IBEX-35 Listed Companies (2004-2008). International
Business & Economics Research Journal, 9(1), pp. 117-128. Retrieved from https://www.
cluteinstitute.com/ojs/index.php/IBER/article/view/513
Financial Times (2011). Lex column: Fairyland Value Accounting, 24 Oct. 2011.
Fiske, S.T. (1995). Social Cognition, in Tesser, A. (Ed.), Advanced Social Psychology (pp. 149-194).
New York: McGraw-Hill.
Fiske, S., Taylor, S. (1991). Social Cognition, (2nd Ed.). New York: McGraw-Hill.
Givoly, D., & Hayn, C. (1992). The Valuation of the Deferred Tax Liability: Evidence from the Stock
Market. The Accounting Review, 67(2), 394–410.

28
Goncharov, I., & Hodgson, A. (2011). Measuring and Reporting Income in Europe. Journal of
International Accounting Research, 10(1), 27–59. https://doi.org/10.2308/jiar.2011.10.1.27
Gopalakrishnan, V. (1994). The Effect of Recognition vs. Disclosure on Investor Valuation: The Case
of Pension Accounting. Review of Quantitative Finance and Accounting, 4, pp. 83-396.
https://doi.org/10.1007/BF01078805.
Gordon, E. A. & Joos, P. R. (2004). Unrecognized Deferred Taxes: Evidence from the UK. The
Accounting Review, 79(1) pp. 97-124.
Groves, R. J. (1994). Financial Disclosure: When More Is Not Better. Financial Executive, 10(3),
pp.11-14.
Guthrie, J. (2011). Barclays’ Lucas is a Counter-Intuitive Credit Crusader. Financial Times, 15
November 2011.
Hand, J.R.M. (1990). A Test of the Extended Functional Fixation Hypothesis. Accounting Review
65(4), pp. 740-763.
Hirshleifer, D., & Teoh, S. H. (2003). Limited attention, information disclosure, and financial
reporting. Journal of Accounting and Economics, 36(1-3), pp. 337-386.
https://doi.org/10.1016/j.jacceco.2003.10.002
Hirst, D. E., & Hopkins, P. E. (1998). Comprehensive Income Reporting and Analysts’ Valuation
Judgments. Journal of Accounting Research, 36, 47–75. https://doi.org/10.2307/2491306
Huss, H. F., & Zhao, J. (1991). An Investigation of Alternative Treatments of Deferred Taxes in Bond
Raters’ Judgments. Journal of Accounting, Auditing & Finance, 6(1), 53–68.
https://doi.org/10.1177/0148558X9100600105
International Accounting Standard Board (IASB) (2012). Hans Hoogervorst speech, Korea, April
29
2012, http://www.ifrs.org/Alerts/Conference/Documents/HansHoogervorstApril2012Korea.
pdf (accessed 12 August 2013).
International Accounting Standard Board (IASB) (2010). The Conceptual Framework for Financial
Reporting, London: International Accounting Standards Board.
International Accounting Standard Board (IASB) (2013a). Discussion forum: Financial Reporting
Disclosure Feedback Statement, London: International Accounting Standards Board.
International Accounting Standard Board (IASB) (2013b). A Review of the Conceptual Framework
for Financial Reporting, London: International Accounting Standards Board.
International Accounting Standard Board (IASB) (2013c). Joint Effort Needed to Tackle Disclosure
Problem, London: International Accounting Standards Board.
International Accounting Standard Board (IASB) (2013d). Disclosure Initiative, London:
International Accounting Standards Board, http://www.ifrs.org/Current-Projects/IASB-
Projects/Disclosure-Initiative/Pages/Disclosure-Initiative.aspx (accessed 2 March 2017).
Iselin, E. R. (1988). The effects of information load and information diversity on decision quality in a
structured decision task. Accounting, Organizations and Society, 13(2), 147–164.
https://doi.org/10.1016/0361-3682(88)90041-4
Israeli, D. (2015). Recognition versus Disclosure: Evidence from Fair Value of Investment Property.
Review of Accounting Studies, 20(4), pp. 1457-1503. https://doi.org/10.1007/s11142-015-
9335-x.
Kahneman, D., (1973). Attention and Effort. Englewood Cliffs, NJ: Prentice-Hall.

30
Kanagaretnam, K., Mathieu, R., & Shehata, M. (2009). Usefulness of comprehensive income
reporting in Canada. Journal of Accounting and Public Policy, 28(4), 349–365.
https://doi.org/10.1016/j.jaccpubpol.2009.06.004
KPMG. (2011). Disclosure Overload and Complexity: Hidden in Plain Sight
http://www.kpmg.com/US/en/IssuesAndInsights/ArticlesPublications/Documents/disclosure-
overload-complexity.pdf (Accessed 20 June 2013)
Kubota, K., Suda, K., & Takehara, H. (2011). Information Content of Other Comprehensive Income
and Net Income: Evidence for Japanese Firms. Asia-Pacific Journal of Accounting &
Economics, 18(2), 145–168. https://doi.org/10.1080/16081625.2011.9720879
Kubota, K., Suda, K., & Takehara, H. (2011). Information Content of Other Comprehensive Income
and Net Income: Evidence for Japanese Firms. Asia-Pacific Journal of Accounting &
Economics, 18(2), 145–168. https://doi.org/10.1080/16081625.2011.9720879
Landsman, W. R., Miller, B. L., Peasnell, K., & Yeh, S. (2011). Do Investors Understand Really Dirty
Surplus? The Accounting Review, 86(1), 237–258. https://doi.org/10.2308/accr.00000014
Lev, B., & Nissim, D. (2004). Taxable Income, Future Earnings, and Equity Values. The Accounting
Review, 79(4), 1039–1074. https://doi.org/10.2308/accr.2004.79.4.1039
Lisowsky, P., Robinson, L., & Schmidt, A. (2013). Do Publicly Disclosed Tax Reserves Tell Us
About Privately Disclosed Tax Shelter Activity? Journal of Accounting Research, 51(3), 583–
629. https://doi.org/10.1111/joar.12003
Maines, L. A., & McDaniel, L. S. (2000). Effects of Comprehensive-Income Characteristics on
Nonprofessional Investors’ Judgments: The Role of Financial-Statement Presentation Format.
The Accounting Review, 75(2), 179–207.
31
McAnally, M. L., McGuire, S. T., & Weaver, C. D. (2010). Assessing the Financial Reporting
Consequences of Conversion to IFRS: The Case of Equity-Based Compensation. Accounting
Horizons, 24(4), 589–621. https://doi.org/10.2308/acch.2010.24.4.589
Mitra, S., & Hossain, M. (2009). Value-relevance of pension transition adjustments and other
comprehensive income components in the adoption year of SFAS No. 158. Review of
Quantitative Finance and Accounting, 33(3), 279–301. https://doi.org/10.1007/s11156-009-
0112-4
Nisbett, R. E., Zukier, H., & Lemley, R. E. (1981). The Dilution Effect: Nondiagnostic Information
Weakens the Implications of Diagnostic Information. Cognitive Psychology, 13(2), pp. 248-
277. https://doi.org/10.1016/0010-0285(81)90010-4.
Novak, A. (2016). Issues in the Recognition versus Disclosure of Financial Information Debate. Naše
Gospodarstvo/Our Economy, 62(4), 52–61. https://doi.org/10.1515/ngoe-2016-0024
OECD (2015). Transfer Pricing Documentation and Country-by-Country Reporting, Action 13 - 2015
Final Report. Paris: OECD Publishing. http://dx.doi.org/10.1787/9789264241480-en.
O’Hanlon, J. F., & Pope, P. F. (1999). The Value-Relevance of UK Dirty Surplus Accounting Flows.
The British Accounting Review, 31(4), 459–482. https://doi.org/10.1006/bare.1999.0116
O’Reilly, C. A. (1980). Individuals and Information Overload in Organizations: Is More Necessarily
Better? The Academy of Management Journal, 23(4), 684–696. https://doi.org/10.2307/255556
Overesch, M. and Schreiber, U. (2006). Does Accounting for Taxes on Income Provide Information
About Tax Planning Performance?: Evidence from German Multinationals (Discussion Paper
No. 06-072). Retrieved from ZEW – Centre for European Economic Research website:
ftp://ftp.zew.de/pub/zew-docs/dp/dp06072.pdf.
32
Phillips, J. D., Pincus, M., Rego, S. O., & Wan, H. (2004). Decomposing Changes in Deferred Tax
Assets and Liabilities to Isolate Earnings Management Activities. The Journal of the American
Taxation Association, 26(s-1), 43–66. https://doi.org/10.2308/jata.2004.26.s-1.43
Phillips, J., Pincus, M., & Rego, S. O. (2003). Earnings Management: New Evidence Based on
Deferred Tax Expense. The Accounting Review, 78(2), 491–521.
Pinto, J. A. (2005). How Comprehensive is Comprehensive Income? The Value Relevance of Foreign
Currency Translation Adjustments. Journal of International Financial Management &
Accounting, 16(2), 97–122. https://doi.org/10.1111/j.1467-646X.2005.00113.x
Plumlee, M. A. (2003). The Effect of Information Complexity on Analysts’ Use of That Information.
The Accounting Review, 78(1), 275–296.
Poterba, J., Rao, N., & Seidman, J. (2007). Deferred Tax Positions and Incentives for Corporate
Behavior Around Corporate Tax Changes (Working Paper No. 12923). National Bureau of
Economic Research. https://doi.org/10.3386/w12923
PricewaterhouseCoopers (PwC) (2011). Investor View: Improving Income Tax Disclosures,
http://www.pwc.com/en_GX/gx/audit-services/corporate-reporting/publications/investor-
view/pdf/pwc-improving-income-tax-disclosures.pdf (accessed 8 September 2014).
Raedy, J. S., Seidman, J. K., & Shackelford, D. A. (2011). Is There Information Content in the Tax
Footnote? (SSRN Scholarly Paper No. ID 1759266). Rochester, NY: Social Science Research
Network. Retrieved from https://papers.ssrn.com/abstract=1759266
Rapoport, M. (2011, February 7). “Toxic” Assets Still Lurking at Banks. Wall Street Journal.
Retrieved from http://www.wsj.com/articles/SB1000142405274870457010457612470114
4189910

33
Schick, A. G., Gordon, L. A., & Haka, S. (1990). Information overload: A temporal approach.
Accounting, Organizations and Society, 15(3), 199–220. https://doi.org/10.1016/0361-
3682(90)90005-F
Schrand, C. M., & Walther, B. R. (2000). Strategic Benchmarks in Earnings Announcements: The
Selective Disclosure of Prior-Period Earnings Components. The Accounting Review, 75(2),
151–177.
Schrand, C. M., & Wong, M. H. F. (2003). Earnings Management Using the Valuation Allowance for
Deferred Tax Assets under SFAS No. 109*. Contemporary Accounting Research, 20(3), 579–
611. https://doi.org/10.1506/480D-098U-607R-5D9W
Schroder, H. M., M. J. Driver, & S. Streufert (1967). Human Information Processing. New York, NY:
Holt, Rinehart, & Winston.
Simon, H. A. (1955). A Behavioral Model of Rational Choice. The Quarterly Journal of Economics,
69(1), 99–118. https://doi.org/10.2307/1884852
Simon, H. A. (1956). Rational Choice and the Structure of the Environment. Psychological Review,
63(2), p. 129. https://doi.org/10.1037/h0042769
Simon, H. A. (1991). Bounded Rationality and Organizational Learning. Organization Science, 2(1),
125–134.
Tversky, A., & Kahneman, D. (1973). Availability: A heuristic for judging frequency and probability.
Cognitive Psychology, 5(2), 207–232. https://doi.org/10.1016/0010-0285(73)90033-9
Weber, D. P. (2009). Do Analysts and Investors Fully Appreciate the Implications of Book-Tax
Differences for Future Earnings?. Contemporary Accounting Research, 26(4), 1175–1206.
https://doi.org/10.1506/car.26.4.7

34
Wilkie, P. & Limberg, S. (1993) Measuring Explicit Tax (Dis) Advantage for Corporate Taxpayers:
An Alternative to Average Effective Tax Rates. The Journal of the American Taxation
Association, 15, 46-71.

35
Figures
Fig. 1. Framework for the effects of the presence of deferred tax details in OCI
Financial statements including: Balance sheet
Comprehensive income statement Cash flow statement
Statement of changes in equity
TREATMENT
Case A “Net-of-Tax” Case B “Tax Detail” Case C “Tax Detail x3” Deferred taxes on OCI are netted against each OCI item and thus not shown in the comprehensive income statement (nor elsewhere in the statements)
Deferred taxes are allocated to each OCI item, details of deferred tax effects are shown in the comprehensive income statement.
Deferred taxes are allocated to each OCI item, details of deferred tax effects are shown in the comprehensive income statement and multiplied by three.
INFORMATION PROCESSING
Limited attention + differential processing cost: Does information meet expectation?
Manipulation Check:
Does ABC Group report deferred taxes in its comprehensive income statement? (Yes/No)
JUDGMENT
Financial performance • Financial condition • Payment obligation • Profitability
Investment appeal
• Growth perspective • Investment risk • Investment attractiveness
Tax position
• Tax burden

36
Tables
Table 1. Descriptive statistics on demographic variables
All participants = 172 N Mean SD Min P25 Median P75 Max
No. of years of experience 167 6.056 9.244 0.000 0.000 1.500 8.000 43.000
Education level 171 2.632 0.583 1.000 2.000 3.000 3.000 4.000
Age 170 31.006 11.045 22.000 24.000 25.000 37.000 72.000
Experience with IFRS 172 0.645 0.480 0.000 0.000 1.000 1.000 1.000
No. of financial statements under IFRS reviewed in the past 3 years
170 8.982 22.339 0.000 1.000 3.000 10.000 220.000
Gender 172 97 male
75 female Notes: This table reports descriptive statistics for the demographic variables used in our study for all participants. Definition of variables: No. of years of experience, number of years of relevant professional experience according to participants; Education level, the highest level of education reached, measured as: Doctoral degree (=1), Master’s degree (=2), Bachelor’s degree (=3) and High school (=4); Experience with IFRS, experience in reviewing the annual or consolidated financial statements according to IFRS, measured as: Yes (=0) or No (=1); No. of financial statements under IFRS reviewed in the past 3 years, number of consolidated financial statements of publicly traded corporations reviewed during the past 3 years.

37
Table 2. Composition of participants
Practitionera Non-Practitionerb Total Case A “Net-of-Tax”c 30 16 46 Case B “Tax Detail”d 29 14 43 Case C “Tax Detail x3”e 30 53 84 Total 89 83 172 Notes: This table describes the composition of our experiment’s participants. a Practitioner refers to participants with over one year of tax/accounting work experience. b Non-Practitioner refers to participants with no or up to one year of experience. c Case A “Net-of-Tax” refers to the case in which line items of OCI were presented net-of-tax, without any explicit information or mention of deferred tax. d Case B “Tax detail” refers to the case in which line items of OCI were given before tax, followed immediately by the line “deferred tax” and the net amount. e Case C “Tax detail x3” refers to the case presenting abnormally high amounts of deferred tax: the nominal deferred tax figures from Case B were tripled, and the before-tax line items were adapted accordingly.

38
Table 3. Statistics on judgment questions (Cases A, B and C)
Questionsa Treatment N Median Mean Sdb p-values 1. Financial
condition Case A “Net-of-Tax” 46 3 3.652 1.418 0.799 Case B “Tax Detail” 43 3 3.512 1.316 Case C “Tax Detail x3” 83 3 3.783 1.711
2. Investment risk Case A “Net-of-Tax” 46 3 3.804 1.327 0.002*** Case B “Tax Detail” 43 4 3.907 1.151 Case C “Tax Detail x3” 83 5 4.759 1.650 3. Timeliness of
payments Case A “Net-of-Tax” 46 3 3.400 1.606 0.076* Case B “Tax Detail” 43 3 3.279 1.469
Case C “Tax Detail x3” 83 4 4.036 1.777 4. Growth
perspective Case A “Net-of-Tax” 44 3 3.477 1.210 0.883 Case B “Tax Detail” 42 3 3.667 1.459
Case C “Tax Detail x3” 83 3 3.614 1.521 5. Profitability Case A “Net-of-Tax” 44 3 2.614 0.689 0.283 Case B “Tax Detail” 42 3 2.500 0.402 Case C “Tax Detail x3” 83 3 2.675 0.646 6. Investment
attractiveness Case A “Net-of-Tax” 45 3 3.778 1.278 0.357 Case B “Tax Detail” 43 4 3.884 1.483
Case C “Tax Detail x3” 83 4 4.169 1.496 7. Tax burden Case A “Net-of-Tax” 46 6 5.935 1.421 0.122 Case B “Tax Detail” 43 6 5.837 1.588 Case C “Tax Detail x3” 83 7 6.373 1.394
Notes: This table reports the summary statistics on judgment questions on cases A, B and C for all participants. p-Values are two-tailed values computed using Kruskal-Wallis Rank-Sum test. Significance: * Two-tailed significance level at 10% level; *** Two-tailed significance level at 1% level. a Answers are scaled as follows: Financial condition (1: very good, 9: very poor), Investment risk (1: low risk, 9: high risk), Timeliness of payments (1: very good, 9: very bad), Growth perspective (1: very good, 9: very bad), Profitability (1: decrease, 2: remain, 3: Increase), Investment attractiveness (1: very attractive, 9: very unattractive), Tax burden: (1: very low, 9: very high). b Sd: standard deviation.
39
Table 4. Statistics on judgment questions (Cases B vs C)
Questionsa Treatment N Median Mean Sdb p-value
1. Financial condition
Case B “Tax Detail” 43 3 3.512 1.316 0.498 Case C “Tax Detail x3” 83 3 3.783 1.711
2. Investment risk Case B “Tax Detail” 43 4 3.907 1.151 0.006*** Case C “Tax Detail x3” 83 5 4.759 1.650 3. Timeliness of
payments
Case B “Tax Detail” 43 3 3.279 1.469 0.056* Case C “Tax Detail x3” 83 4 4.036 1.777
4. Growth perspective
Case B “Tax Detail” 42 3 3.667 1.459 0.682 Case C “Tax Detail x3” 83 3 3.614 1.521
5. Profitability Case B “Tax Detail” 42 3 2.500 0.402 0.047** Case C “Tax Detail x3” 83 3 2.675 0.646 6. Investment
attractiveness Case B “Tax Detail” 43 4 3.884 1.483 0.348 Case C “Tax Detail x3” 83 4 4.169 1.496
7. Tax burden Case B “Tax Detail” 43 6 5.837 1.588 0.060* Case C “Tax Detail x3” 83 7 6.373 1.394
Notes: This table reports the summary statistics on judgment questions on cases B vs C for all participants. p-Values are two-tailed values computed using Wilcoxon/Mann-Whitney U test. Significance: * Two-tailed significance level at 10% level; ** Two-tailed significance level at 5% level; *** Two-tailed significance level at 1% level. a Answers are scaled as follows: Financial condition (1: very good, 9: very poor), Investment risk (1: low risk, 9: high risk), Timeliness of payments (1: very good, 9: very bad), Growth perspective (1: very good, 9: very bad), Profitability (1: decrease, 2: remain, 3: Increase), Investment attractiveness (1: very attractive, 9: very unattractive), Tax burden: (1: very low, 9: very high). b Sd: standard deviation.

40
Table 5. Statistics on judgment questions (cases A vs B and A vs C)
Notes: This table reports the summary statistics on judgment questions on cases A vs B and A vs C for all participants. p-Values are two-tailed values computed using Wilcoxon/Mann-Whitney U tests. Significance: * Two-tailed significance level at 10% level; *** Two-tailed significance level at 1% level. a Answers are scaled as follows: Financial condition (1: very good, 9: very poor), Investment risk (1: low risk, 9: high risk), Timeliness of payments (1: very good, 9: very bad), Growth perspective (1: very good, 9: very bad), Profitability (1: decrease, 2: remain, 3: Increase), Investment attractiveness (1: very attractive, 9: very unattractive), Tax burden: (1: very low, 9: very high). b Sd: standard deviation.
Questionsa Treatment N Median Mean Sdb p-values
1. Financial condition
Case A “Net-of-Tax” 46 3 3.652 1.418 0.611 Case B “Tax Detail” 43 3 3.512 1.316
Case A “Net-of-Tax” 46 3 3.652 1.418 0.917 Case C “Tax Detail x3” 83 3 3.783 1.711
2. Investment risk
Case A “Net-of-Tax” 46 3 3.804 1.327 0.487 Case B “Tax Detail” 43 4 3.907 1.151
Case A “Net-of-Tax” 46 3 3.804 1.327 0.002*** Case C “Tax Detail x3” 83 5 4.759 1.650
3. Timeliness of payments
Case A “Net-of-Tax” 46 3 3.400 1.606 0.953 Case B “Tax Detail” 43 3 3.279 1.469
Case A “Net-of-Tax” 46 3 3.400 1.606 0.060* Case C “Tax Detail x3” 83 4 4.036 1.777
4. Growth perspective
Case A “Net-of-Tax” 44 3 3.477 1.210 0.609 Case B “Tax Detail” 42 3 3.667 1.459
Case A “Net-of-Tax” 44 3 3.477 1.210 0.910 Case C “Tax Detail x3” 83 3 3.667 1.521
5. Profitability
Case A “Net-of-Tax” 44 3 2.614 0.689 0.229 Case B “Tax Detail” 42 3 2.500 0.402
Case A “Net-of-Tax” 44 3 2.614 0.689 0.592 Case C “Tax Detail x3” 83 3 2.675 0.646
6. Investment attractiveness
Case A “Net-of-Tax” 45 3 3.778 1.278 0.752 Case B “Tax Detail” 43 4 3.884 1.483
Case A “Net-of-Tax” 45 3 3.778 1.278 0.156 Case C “Tax Detail x3” 83 4 4.169 1.496
7. Tax burden
Case A “Net-of-Tax” 46 6 5.935 1.421 0.797 Case B “Tax Detail” 43 6 5.837 1.588
Case A “Net-of-Tax” 46 6 5.935 1.421 0.120 Case C “Tax Detail x3” 83 7 6.373 1.394
41
Table 6. Additional analyses of subsamples (case A vs C)
Panel A: Subsamples 1 2 3 4 5 6 7 8 9 10 Practitioners X X X X X X X X X Non-practitioners X X X X Manipulation check passed X X X IFRS experience X X Public accountant or auditor X More than one financial statement under IFRS reviewed in the past 3 years
X X
Panel B: Number of participants Case A “Net-of-Tax” (nA) 46 26 30 16 20 24 11 8 18 29 Case C “Tax Detail x 3” (nC) 83 75 30 53 25 12 16 13 26 78 Total subjects (n) 129 101 60 69 45 36 27 21 44 107
Panel C: Significance (Wilcoxon/Mann-Whitney U) 1. Financial condition * * 2. Investment risk *** ** ** * ** * * * ** 3. Timeliness of payments * ** ** ** * 4. Growth perspective * 5. Profitability 6. Investment attractiveness ** 7. Tax burden Notes: This table reports the significance of difference on judgment questions for cases A vs C on ten additional subsamples. Panel A shows the composition of the ten additional subsamples. Respective subsamples include only those participants which fulfil the attributes marked “X” in the respective column. Panel C displays the significance level of difference on judgment questions, which is derived from p-values using Wilcoxon/Mann-Whitney U tests: * Two-tailed significance level at 10% level; ** Two-tailed significance level at 5% level; *** Two-tailed significance level at 1% level.

42
Annex
[Allsubsequentpagesnotintendedforpublication.]
43
<Instruction>
ABC Group
Instructions
This survey is part of a research project of the Department for ### of the ### University. It involves the use of information of IFRS consolidated financial statements by practitioners with relevant expertise.
For this purpose, we distribute a set of financial statements of ABC Group (balance sheet, income statement, statement of comprehensive income, statement of cash flows and statement of changes in equity). The questionnaire asks for your professional opinion on certain aspects of assets and liabilities, financial position and profitability of the group. The questionnaire will be used exclusively for this study.
For the company in question the following is assumed:
- it is not a financial institution nor an insurance corporation
- it is a publicly traded company
Completing the questionnaire takes 20-30 minutes.
Confidentiality
The survey is anonymous. The results will be used exclusively for our research project. Therefore, your answers will be treated confidentially. Any information you give about the interpretation of the consolidated financial statements and your professional judgment
- will not be used in any other way that is not related to the research project
- will not be attributed to the organization for which you are professionally active.
If you are interested in the outcome of the research project, you are invited to leave your business card in a bowl. It is thereby ensured that no link can be made to their questionnaire. We will then send you the research results.
A1IDNumber
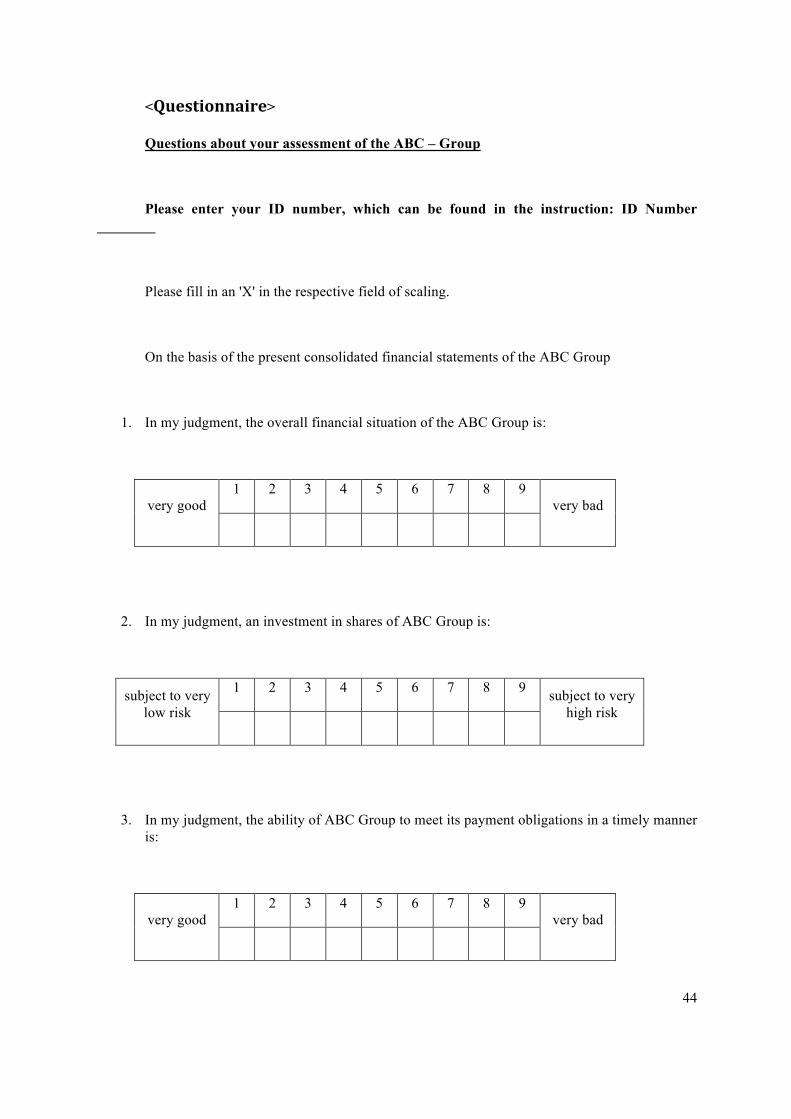
44
<Questionnaire>
Questions about your assessment of the ABC – Group
Please enter your ID number, which can be found in the instruction: ID Number ________
Please fill in an 'X' in the respective field of scaling.
On the basis of the present consolidated financial statements of the ABC Group
1. In my judgment, the overall financial situation of the ABC Group is:
very good 1 2 3 4 5 6 7 8 9
very bad
2. In my judgment, an investment in shares of ABC Group is:
subject to very low risk
1 2 3 4 5 6 7 8 9 subject to very high risk
3. In my judgment, the ability of ABC Group to meet its payment obligations in a timely manner is:
very good 1 2 3 4 5 6 7 8 9
very bad

45
4. In my judgment, the perspective for further growth of the ABC Group is:
very good 1 2 3 4 5 6 7 8 9
very bad
5. In my judgment, the future profit of the ABC Group will
□ decrease □ remain □ increase
6. In my judgment, investment in shares of ABC Group is:
very attractive
1 2 3 4 5 6 7 8 9 very unattractive
7. In my judgment, the tax burden of ABC Group is
very low 1 2 3 4 5 6 7 8 9
very high
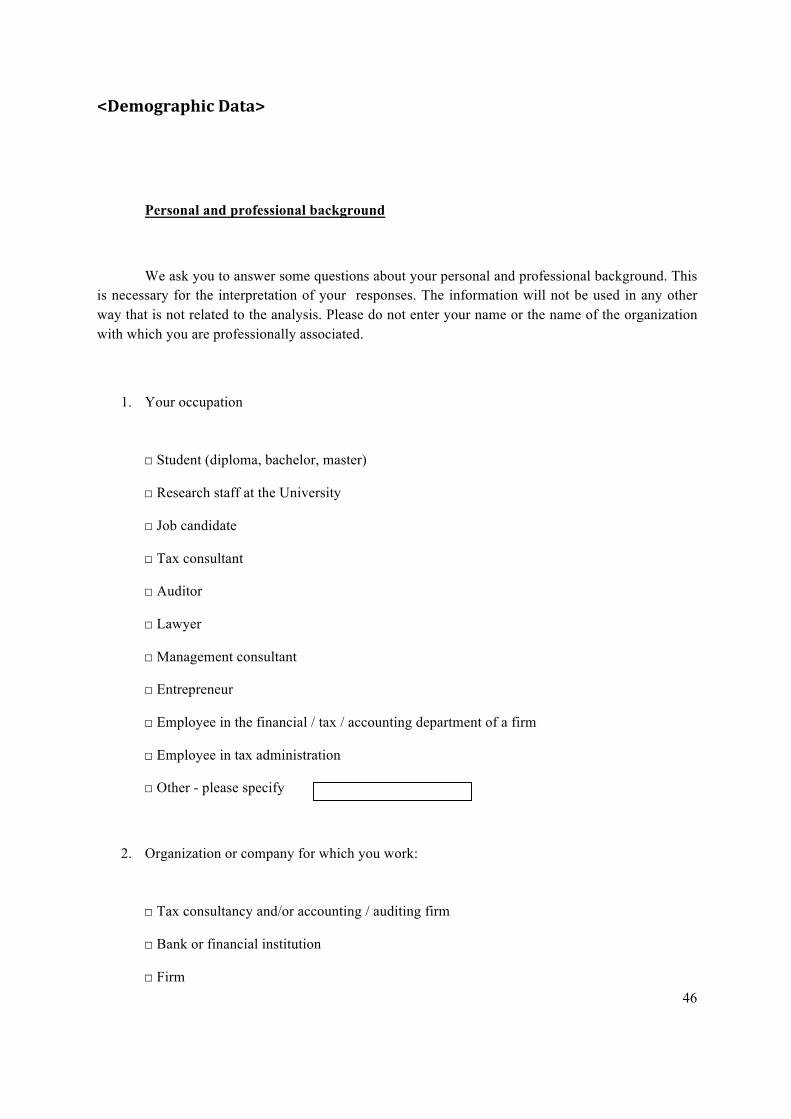
46
<DemographicData>
Personal and professional background
We ask you to answer some questions about your personal and professional background. This is necessary for the interpretation of your responses. The information will not be used in any other way that is not related to the analysis. Please do not enter your name or the name of the organization with which you are professionally associated.
1. Your occupation
□ Student (diploma, bachelor, master)
□ Research staff at the University
□ Job candidate
□ Tax consultant
□ Auditor
□ Lawyer
□ Management consultant
□ Entrepreneur
□ Employee in the financial / tax / accounting department of a firm
□ Employee in tax administration
□ Other - please specify
2. Organization or company for which you work:
□ Tax consultancy and/or accounting / auditing firm
□ Bank or financial institution
□ Firm
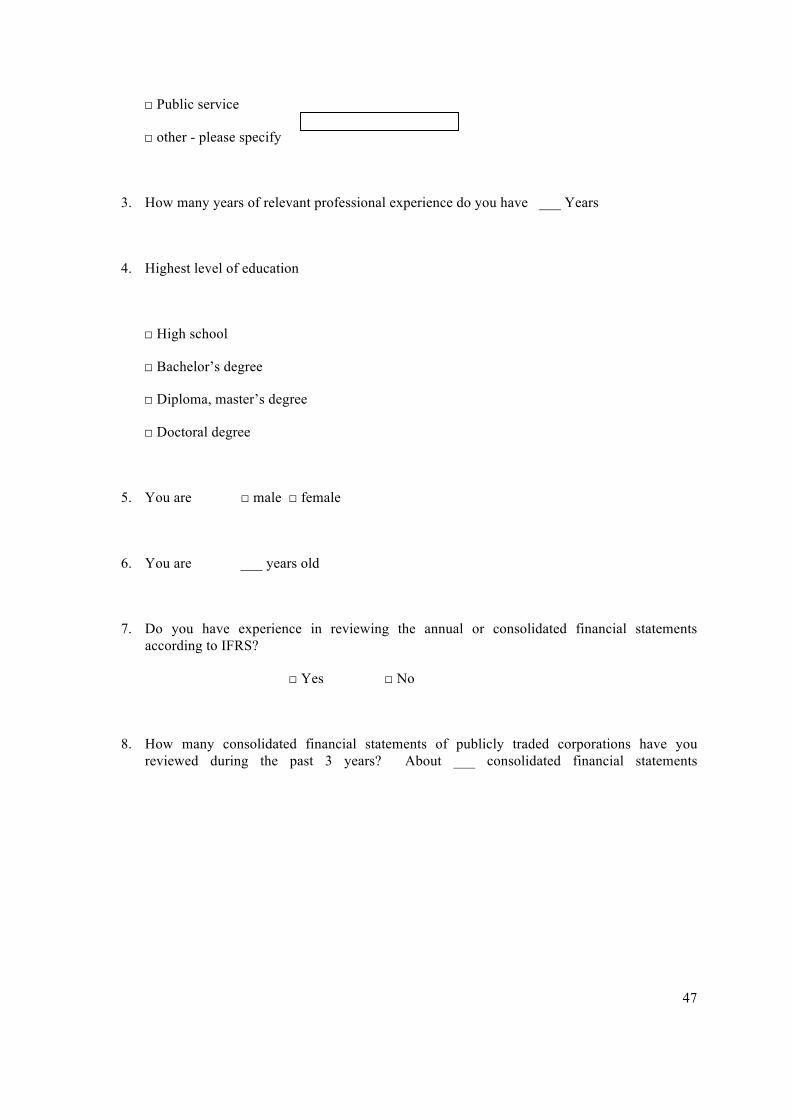
47
□ Public service
□ other - please specify
3. How many years of relevant professional experience do you have ___ Years
4. Highest level of education
□ High school
□ Bachelor’s degree
□ Diploma, master’s degree
□ Doctoral degree
5. You are □ male □ female
6. You are ___ years old
7. Do you have experience in reviewing the annual or consolidated financial statements according to IFRS?
□ Yes □ No
8. How many consolidated financial statements of publicly traded corporations have you reviewed during the past 3 years? About ___ consolidated financial statements

48
<ManipulationCheck>
Final question
Please enter your ID number, which can be found in the instruction: ID Number ________
1. Has the ABC Group explicitly stated deferred taxes in its statement of comprehensive income?
□ Yes □ No

49
Treatment A "Net-of-Tax"
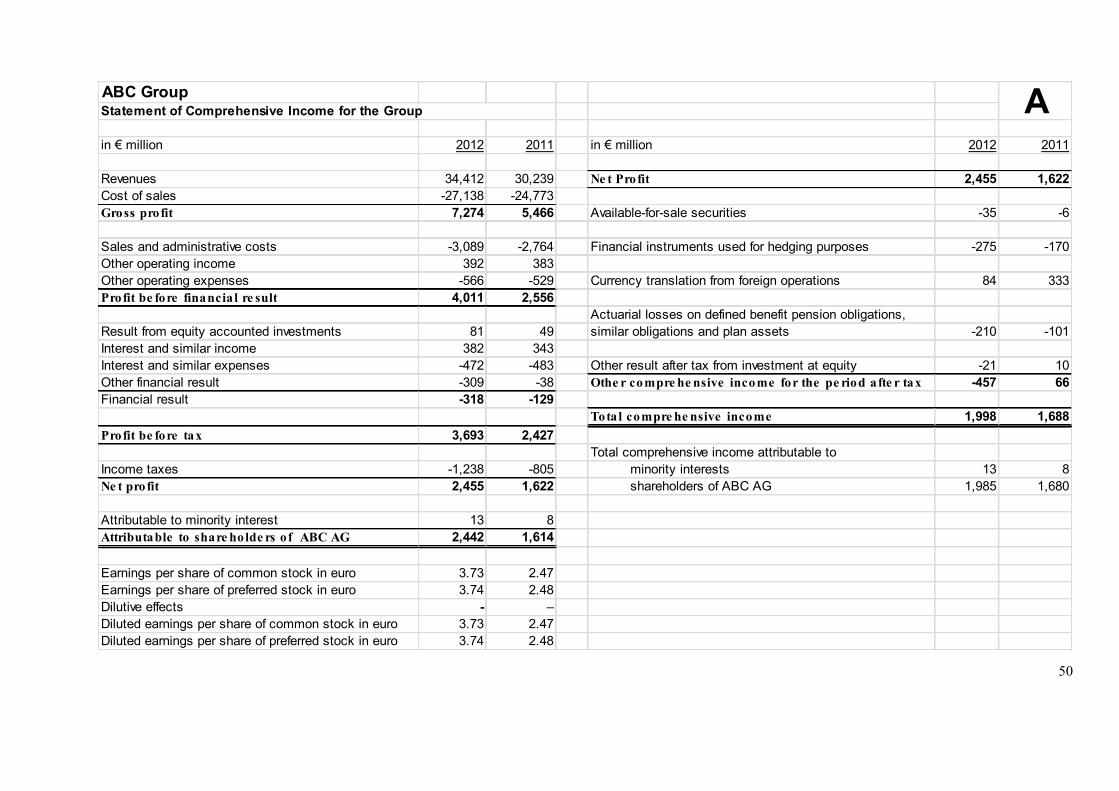
50
ABC Group
in € million 2012 2011 in € million 2012 2011
Revenues 34,412 30,239 Ne t Profit 2,455 1,622Cost of sales -27,138 -24,773Gross profit 7,274 5,466 Available-for-sale securities -35 -6
Sales and administrative costs -3,089 -2,764 Financial instruments used for hedging purposes -275 -170Other operating income 392 383Other operating expenses -566 -529 Currency translation from foreign operations 84 333Profit be fore financia l re sult 4,011 2,556
Actuarial losses on defined benefit pension obligations, Result from equity accounted investments 81 49 similar obligations and plan assets -210 -101Interest and similar income 382 343Interest and similar expenses -472 -483 Other result after tax from investment at equity -21 10Other financial result -309 -38 Othe r compre he nsive income for the pe riod afte r tax -457 66Financial result -318 -129
Total compre he nsive income 1,998 1,688Profit be fore tax 3,693 2,427
Total comprehensive income attributable to Income taxes -1,238 -805 minority interests 13 8Ne t profit 2,455 1,622 shareholders of ABC AG 1,985 1,680
Attributable to minority interest 13 8Attributable to share holde rs o f ABC AG 2,442 1,614
Earnings per share of common stock in euro 3.73 2.47 Earnings per share of preferred stock in euro 3.74 2.48Dilutive effects - –Diluted earnings per share of common stock in euro 3.73 2.47Diluted earnings per share of preferred stock in euro 3.74 2.48
Statement of Comprehensive Income for the Group A

51

52
Treatment B "Tax Detail"

53

54
Treatment C "Tax Detail x3"

55
ABC Group
in € million 2012 2011 in € million 2012 2011
Revenues 34,412 30,239 Ne t Profit 2,455 1,622Cost of sales -27,138 -24,773
Gross profit 7,274 5,466 Available-for-sale securities -38 -12
Deferred tax 3 6
Sales and administrative costs -3,089 -2,764 After tax -35 -6
Other operating income 392 383
Other operating expenses -566 -529 Financial instruments used for hedging purposes -653 -449
Profit be fore financia l re sult 4,011 2,556 Deferred tax 378 279
After tax -275 -170
Result from equity accounted investments 81 49
Interest and similar income 382 343 Currency translation from foreign operations 84 333
Interest and similar expenses -472 -483 Deferred tax 0 0
Other financial result -309 -38 After tax 84 333
Financial result -318 -129 Actuarial losses on defined benefit pension obligations,
Profit be fore tax 3,693 2,427 similar obligations and plan assets -459 -212
Deferred tax 249 111
Income taxes -1,238 -805 After tax -210 -101
Ne t profit 2,455 1,622 Other result after tax from investment at equity -57 13
Attributable to minority interest 13 8 Deferred tax 36 -1
Attributable to share holde rs o f ABC AG 2,442 1,614 After tax -21 10
Earnings per share of common stock in euro 3.73 2.47 Other comprehensive income for the period after tax -457 66Earnings per share of preferred stock in euro 3.74 2.48
Dilutive effects - – Total compre he nsive income 1,998 1,688Diluted earnings per share of common stock in euro 3.73 2.47
Diluted earnings per share of preferred stock in euro 3.74 2.48 Total comprehensive income attributable to
minority interests 13 8
shareholders of ABC AG 1,985 1,680
Statement of Comprehensive Income for the Group
C

56
Treatment A + B + C Financial Statements

57
ABC Group Equity and Liabilities
in € million 2012 2011
Subscribed capital 328 328in € million 2012 2011 Capital reserves 977 970
Retained earnings 13,051 11,245Intangible assets 2,619 2,516 Accumulated other equity -838 -591Property, plant and equipment 5,843 5,713 Equity attributable to share holde rs o f ABC AG 13,518 11,952Leased products 11,557 9,544Investments at equity 151 106 Minority interest 33 13Other financial assets 281 89 Equity 13,551 11,965Receivables from financial services 14,664 13,563Financial assets 851 933 Pension liabilities 1,092 781Deferred tax 963 697 Other provisions 1,575 1,361Other assets 284 346 Deferred tax 1,637 1,700Non-curre nt asse ts 37,213 33,507 Financial liabilities 18,798 17,917
Other liabilities 1,456 1,292Inventories 4,819 3,883 Non-curre nt provisions and liabilitie s 24,558 23,051Trade receivables 1,643 1,165Receivables from financial services 10,007 9,119 Other provisions 1,551 1,413Financial assets 1,876 1,631 Current tax 682 599Current tax 597 583 Financial liabilities 15,190 13,260Other assets 1,672 1,479 Trade payables 2,670 2,175Cash and cash equivalents 3,888 3,716 Other liabilities 3,513 2,620Curre nt asse ts 24,502 21,576 Curre nt provisions and liabilitie s 23,606 20,067
Total asse ts 61,715 55,083 Total e quity and liabilitie s 61,715 55,083
Group Balance Sheet as per 31 December
Assets

58
Treatment A + B + C Financial Statements
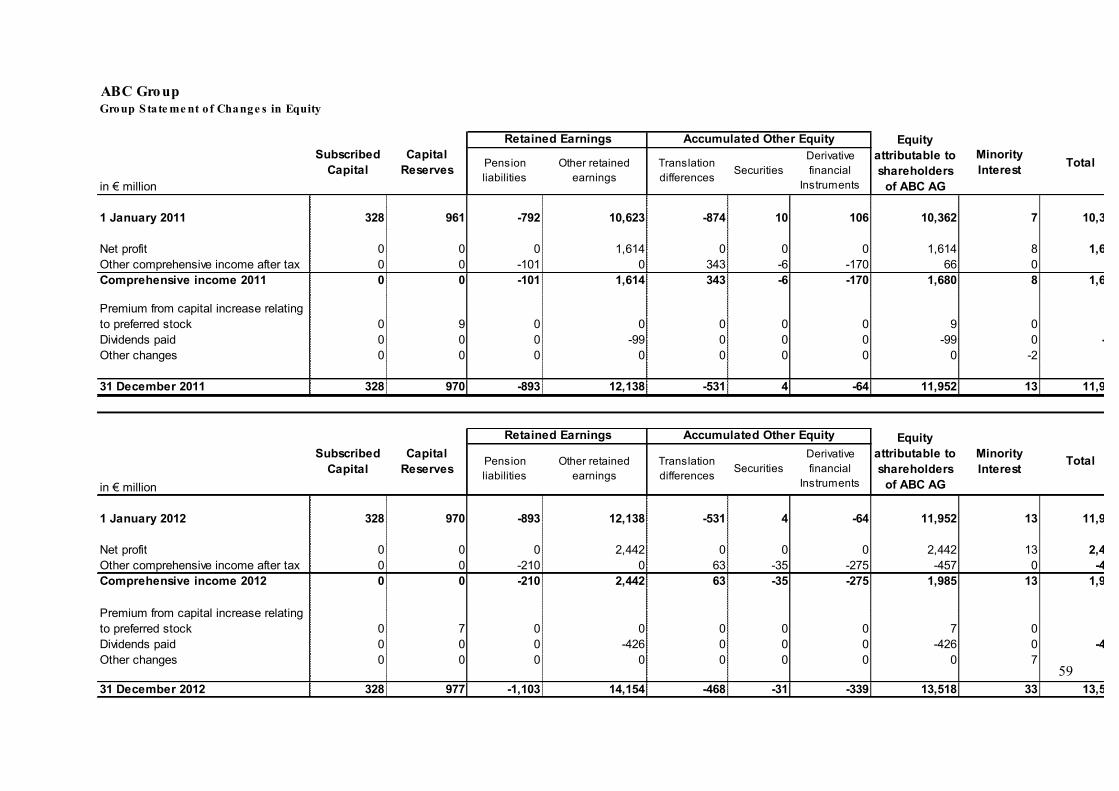
59
ABC Group
in € million
1 January 2011 328 961 -792 10,623 -874 10 106 10,362 7 10,369
Net profit 0 0 0 1,614 0 0 0 1,614 8 1,622Other comprehensive income after tax 0 0 -101 0 343 -6 -170 66 0 66Comprehensive income 2011 0 0 -101 1,614 343 -6 -170 1,680 8 1,688
Premium from capital increase relating to preferred stock 0 9 0 0 0 0 0 9 0 9Dividends paid 0 0 0 -99 0 0 0 -99 0 -99Other changes 0 0 0 0 0 0 0 0 -2 -2
31 December 2011 328 970 -893 12,138 -531 4 -64 11,952 13 11,965
in € million
1 January 2012 328 970 -893 12,138 -531 4 -64 11,952 13 11,965
Net profit 0 0 0 2,442 0 0 0 2,442 13 2,455Other comprehensive income after tax 0 0 -210 0 63 -35 -275 -457 0 -457Comprehensive income 2012 0 0 -210 2,442 63 -35 -275 1,985 13 1,998
Premium from capital increase relating to preferred stock 0 7 0 0 0 0 0 7 0 7Dividends paid 0 0 0 -426 0 0 0 -426 0 -426Other changes 0 0 0 0 0 0 0 0 7 7
31 December 2012 328 977 -1,103 14,154 -468 -31 -339 13,518 33 13,551
Group S tate me nt of Change s in Equity
Retained Earnings
Pension liabilities
Other retained earnings
Subscribed Capital
Capital Reserves
Retained Earnings Accumulated Other Equity
Subscribed Capital
Capital Reserves
Equity attributable to shareholders
of ABC AG
Minority Interest Total
Accumulated Other Equity
Translation differences Securities
Derivative financial
Instruments
Equity attributable to shareholders
of ABC AG
Minority Interest TotalPension
liabilitiesOther retained
earnings Translation differences Securities
Derivative financial
Instruments

60
Treatment A + B + C Financial Statements

61
ABC Group
in € million 2012 2011
Ne t profit 2,455 1,622
Reconciliation between net profit and cash inflow / outflow from operating activities:
Current tax 1,433 715Other interest and similar income / expenses 1 21Depreciation and amortisation of other tangible, intangible and investment assets 1,827 1,931Change in provisions 389 456Change in leased assets -190 444Change in receivables from financial services -1,418 -2,308Change in deferred taxes -169 174Other non-cash income and expense 74 -347Gain / loss from the sale of non-current assets and securities - 3Result from measurement at equity -81 -49Changes in working capital Change in inventories -858 -585 Change in trade receivables -400 -214 Change in trade payables 450 597 Change in other operating assets and liabilities 588 286Income taxes paid -1,351 -659Interest received 107 74Cash inflow / outflow from ope rating activitie s 2,857 2,160
Investment in intangible assets and property, plant and equipment -1,839 -1,631Proceeds from the disposal of intangible assets and property, plant and equipment 26 28Investment in financial assets -271 -40Net cash outflow from acquisition of ICL Group -298 -Proceeds from the disposal of financial assets 11 11Cash payments for the purchase of securities -1,037 -1,362Cash proceeds from the sale of securities 659 399Cash inflow / outflow from inve sting activitie s -2,749 -2,595
Cash inflow into equity 7 9Payment of dividend for the previous year -426 -99Interest paid -41 -111Proceeds from the issue of bonds 2,949 2,289Repayment of bonds -2,667 -1,703Intra-group financing - -Change in other financial liabilities 96 -146Change in commercial paper 124 16Cash inflow / outflow from financing activitie s 44 255
Effe ct o f e xchange rate on cash and cash e quiva le nts -6 10
Effe ct o f change s in Group me mbe rs on cash and cash e quiva le nts 28 2
Change in cash and cash e quiva le nts 172 -168
Cash and cash equivalents as per 1 January 3,716 3,884Cash and cash e quiva le nts as pe r 31 De ce mbe r 3,888 3,716
Group Cash Flow S tate me nts