pre-disaster secondary data - acaps · pre-disaster secondary data date of publication: march 2014...
TRANSCRIPT
1
COUNTRY PROFILE
CLIMATE AND GEOGRAPHY
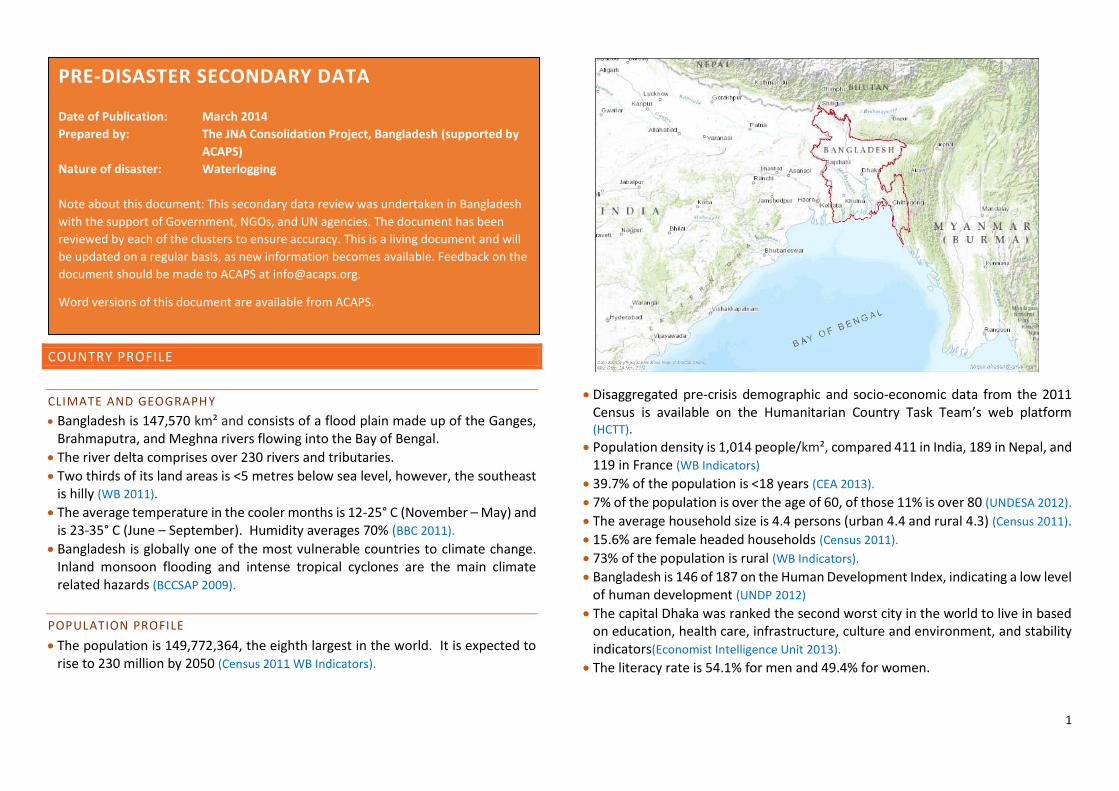
Bangladesh is 147,570 km² and consists of a flood plain made up of the Ganges, Brahmaputra, and Meghna rivers flowing into the Bay of Bengal.
The river delta comprises over 230 rivers and tributaries.
Two thirds of its land areas is <5 metres below sea level, however, the southeast is hilly (WB 2011).
The average temperature in the cooler months is 12-25° C (November – May) and is 23-35° C (June – September). Humidity averages 70% (BBC 2011).
Bangladesh is globally one of the most vulnerable countries to climate change. Inland monsoon flooding and intense tropical cyclones are the main climate related hazards (BCCSAP 2009).
POPULATION PROFILE
The population is 149,772,364, the eighth largest in the world. It is expected to rise to 230 million by 2050 (Census 2011 WB Indicators).
Disaggregated pre-crisis demographic and socio-economic data from the 2011 Census is available on the Humanitarian Country Task Team’s web platform (HCTT).
Population density is 1,014 people/km², compared 411 in India, 189 in Nepal, and 119 in France (WB Indicators)
39.7% of the population is <18 years (CEA 2013).
7% of the population is over the age of 60, of those 11% is over 80 (UNDESA 2012).
The average household size is 4.4 persons (urban 4.4 and rural 4.3) (Census 2011).
15.6% are female headed households (Census 2011).
73% of the population is rural (WB Indicators).
Bangladesh is 146 of 187 on the Human Development Index, indicating a low level of human development (UNDP 2012)
The capital Dhaka was ranked the second worst city in the world to live in based on education, health care, infrastructure, culture and environment, and stability indicators(Economist Intelligence Unit 2013).
The literacy rate is 54.1% for men and 49.4% for women.
PRE-DISASTER SECONDARY DATA Date of Publication: March 2014
Prepared by: The JNA Consolidation Project, Bangladesh (supported by
ACAPS)
Nature of disaster: Waterlogging
Note about this document: This secondary data review was undertaken in Bangladesh
with the support of Government, NGOs, and UN agencies. The document has been
reviewed by each of the clusters to ensure accuracy. This is a living document and will
be updated on a regular basis, as new information becomes available. Feedback on the
document should be made to ACAPS at [email protected].
Word versions of this document are available from ACAPS.

2
The youth (14–24 years) literacy rate is 75.4%, showing a significant improvement in literacy (CEA 2013 Census 2011).
The female teenage marriage rate is 32.5% (CEA 2013).
ADMINISTRATIVE DIVISIONS
Bangladesh is administratively divided into seven Divisions and 64 Districts. o Districts are further divided into 1,009 Upazila (rural) and Thana (urban) (500
and 509 respectively). o These are further divided into Union Parishads of which there are 4,451 in
Bangladesh. Disaster Management Committees exist at the District, Upazila and Union levels. Key local government positions responsible for disaster management are:
o District Relief and Rehabilitation Officer (DRRO) who reports centrally to the Department of Disaster Management
o Project Implementation Officer (PIO), who reports to the DRROand exists at Upazila level
o Upazila Chairman, an elected representative at Upazila level o Union Parishad Secretary, a secretary of the Union level Disaster
Management Committee o Union Chairman and members who are locally elected to represent at the
Union level
HEALTH INDICATORS
The crude birth rate is 17.88 per 1,000 (Census 2011). The crude death rate is 4.8 to per 1,000 (Census 2011). Fertility rate is 2.2(Census 2011). The infant mortality rate is 37 per 1,000 live births (WB Indicators). Maternal mortality rate is 240 per 100,000 (WB Indicators). Non-communicable diseases account for 52% of all deaths (WHO 2011). Drowning is the leading cause of death for children in Bangladesh aged 2-10 years
(WHO 2011 UNICEF 2012). HIV prevalence is under 0.1% with an estimated 7,500 PLHIV in Bangladesh
(UNAIDS 2012). 9.07% of the population has a disability (8.1% male and 10% female) (HIES 2010).
ECONOMY AND MARKETS
GDP growth was 6.1% in 2012. Agriculture comprises 19% of the GDP and 23% of export, with rice the staple
(MoA, GOB 2013). Obstacles such as lack of electricity, land disputes, extreme congestion, and lack
of urban planning have hindered economic growth. However, the economy has begun to gain strength, with the potential to generate $40 billion in exports annually from the clothing industry (The Economist 2012).
Off shore and on shore natural gas reserves may bring future prosperity to Bangladesh (BBC 2012).
Fluctuating yields, particularly in rice harvests, are associated with climatic conditions and frequency of natural disasters (floods and cyclones). Even when these disasters are low-profile, they can have a devastating impact on food security (UNICEF 2009).
SOCIO-CULTURAL CHARACTERISTICS
98% of the population is Bengali (UNHCR 2011, CARE 2011). 89.5% of the population are Muslims, with Hindus comprising under 10%, and
smaller populations of Adivasis, Biharis, Christians, and Ahmadiyyas (UNHCR 2011,
CARE 2011). In Khulna and Satkhira Districts, there are two ethnic minority groups, the
Mundas or Mahtas. Dalits and Mundas/Mahtas are socially and economically marginalized making them vulnerable to natural shocks (Solidarites 2013).
Dalits and Munda are routinely discriminated when accessing post-disaster assistance, with Dalits not welcome in cyclone shelters. Dalit NGOs are routinely excluded from networks and coordination with other local NGOs (INTRAC 2010).
Attacks on minority groups persist. Minorities continue to be subject to violence and other human rights abuses (RDC 2010).
MEDIA
Television is the most popular source of news and entertainment in urban Bangladesh. Urban access to television is 91%, compared to rural areas where access to television is 67% (InfoAsAid2012).
Radio ownership has fallen steadily in recent years, from 36% in 1999 to 15% in 2011 (InfoAsAid 2012).

3
A 2011 Survey indicated that 73% of radio listeners tuned into stations on their mobile phones, but only 34% still listened to programmes on a radio set (InfoAsAid
2012). One in five Bangladeshis do not watch TV or listen to radio at all (InfoAsAid 2012). 27% of females and 13% of males do not watch TV, listen to radio, or are reached
by any other media on a regular basis (InfoAsAid 2012). 40% of Bangladeshi men and 14% of women read newspapers at least once a
week (InfoAsAid 2012).
MOBILE PHONES
The mobile network covers 98% of the population (InfoAsAid 2012). Some mobile holes exist in the sparsely populated Chittagong Hill Tracts in the
southeast, the mangrove swamps of the Southern Sundarbans in the southwest, and in the extreme northwest (InfoAsAid 2012).
At end February 2012, there were 87.9 million active mobile subscribers (InfoAsAid
2012). 66% of all persons aged 15+ years own at least one mobile phone with an active
SIM (InfoAsAid 2012).
POVERTY PROFILE
Poverty is concentrated in three geographic areas: the northwest, which is affected by droughts and river erosion; the central northern region, which is subject to serious seasonal flooding that limits crop production; and the southern coastal zones, which are affected by soil salinity and cyclones (IFAD, 2011).
Determinants of poverty include: o Land Ownership: the chronically poor do not own cultivable land and depend
on volatile daily wage incomes. 4.6% of Bangladeshis are landless. 60.5% are functionally landless, owning under ½ acre (HIES 2010).
o Literacy: poverty rates are higher, in both rural and urban areas, when household heads are illiterate (JBIC 2007).
o Gender: women’s wages are half of those of men, and women’s employment is often temporary (JBIC 2007). However, poverty levels are lower for female headed households. Using the upper poverty line, the rate is 32.1% for male headed households and 26.6% for female headed households (HIES 2010).
Monthly income for female-headed households is significantly lower than their male-headed counterparts. Almost all (96%) households reported that men are
the only income earners in the household. Out of necessity, relatively more women from the poor are engaged in income earning activities (WFP).
The average monthly income in 2010 was Tk. 11,479 (rural = Tk. 9,648 and urban = Tk. 16,475). There is a significant underreporting of income (HIES 2010).
The average monthly expenditure in 2010 was Tk. 11,200 (rural = Tk. 9,612 and urban = Tk. 15,531), representing an increase in real expenditure of 36% from 2005 – 2010 (HIES 2010).
Families receiving remittances have an income on average 82% higher than families not receiving remittances. Poverty rates are 61% lower for remittance receiving families (HIES 2010).
32% of the population has taken loans from financial and non-financial institutions, friends, and money lenders (HIES 2010).
Figure 1: Source: (CEA 2013)

4
Per-capita income varies significantly by region. Coastal and char households have the lowest per-capita income; northwest and drought-prone households enjoy the highest income and expenditure figures (WFP).
Social deprivation is concentrated in the north, northeast, southeast, and to a lesser extent south central areas. The best performing districts are Khulna and Barisal, while Syhlet consistently lags behind (CEA 2013).
DISASTER MANAGEMENT FRAMEWORK
Disaster Management is the responsibility of the Ministry of Disaster Management and Relief. Within the Ministry the Department for Disaster Management (DDM) has a policy and advisory role.Bodies which support Disaster Management include (SOD 2010): o The National Disaster Management Council is headed by the Prime Minister
and is responsible for formulating new policy and delivering directives on all concerns.
o The Inter-Ministerial Disaster Management Coordination Council is responsible for implementing policy and is headed by the Minister of Disaster Management and Relief.
o The National Disaster Management Advisory Council is headed by an experienced person nominated by the Prime Minister.
o The National Platform Disaster Management for Disaster Risk Reduction coordinates and provides necessary facilitation to relevant stakeholders.
o The Focal Point Operation Coordination Group of Disaster Management is head by the DG of DDM to review and coordinate the activities of various departments/agencies related to disaster management and also to revive the Contingency Plan prepared by concerned departments.
o The NGO Coordination Committee of Disaster Management headed by the DG DDM reviews the coordinates the activities of concerned NGOs.
o The Committee for Speedy Dissemination of Disaster Related Warning/Signals head by the DG DDM to examine, ensure and find out the ways and means for the speedy dissemination of warning/signals among the people.
DISASTER MANAGEMENT REGULATORY FRAMEWORK
In 2012 a Disaster Management Act was passed, creating the framework for Disaster Risk Reduction (DRR) and emergency response management.
o The National Disaster Management Policy is a strategic policy document describing the broad national objectives and strategies for disaster management.
o The 2010–2015 National Plan for Disaster Management outlines the systemic and institutional mechanisms for DRR and emergency response management. NB, this Plan along with other key documents such as the Standing Order on Disasters (SOD) precedes the DM Act and the associated creation of a separate Ministry of Disaster Management and Relief and Department for Disaster Management (DDM).
The Guidelines for Government at all Levels (Best Practice Models) are available to guide the Government’s DRR and emergency response management.
The Standing Order on Disasters (SOD) outlines the national management arrangements and describes the detailed roles and responsibilities of the relevant government bodies at the central and local level (SOD 2010).
Quantitative information on a disaster in the initial days comes from the Government via their:
o SOS forms which provide information on approximate loss, damage and emergency requirements, including affected, dead and missing.
o D-Forms include detailed assessment on damage and loss.
Government sitreps based on this information are produced and published on the DMIC website
All INGOS and NGOs require Government approval for new projects. An FD6 is used in non-emergency situations and takes a minimum of 45 days to be approved. If a disaster has been declared by the Government, a fast-track system allows for use of the FD7 which can be approved in 24 hours. This last happened for waterlogging in 2011 and Cyclone Aila in 2009.
DISASTER MANAGEMENT COORDINATION STRUCTURES
The Local Consultative Group Mechanism (LCG) is one of the key the structures through which the Government engages in dialogue with development partners (www.lgcbangladesh.org).
There are 18 LCGs including the Disaster and Emergency Relief (DER) which is co-chaired by the Ministry of Disaster Management and the UN Resident Coordinator.

5
The DER is mandated to ensure effective coordination of national and international
stakeholders around all aspects of the disaster management cycle. o DER membership consists of senior decision makers from UN agencies,
donors, and a representative of both the INGOs and NGOs. o The DER is co-chaired by the UN Resident Coordinator and the Secretary,
Ministry of Disaster Management and Relief. Within the LCG DER, the Humanitarian Coordination Technical Team (HCTT) is a
working group which provides an operational level forum for coordinated disaster preparedness, response, and recovery across sectors.
Membership of the HCTT includes: o All cluster lead agencies o Two donor representatives o Three elected representatives of the INGO Forum Emergency Sub Group o One representative of the NGO community o IFRC
In Bangladesh, clusters have been constituted, with Government approval, to engage on disaster preparedness. (This does not imply formal UN Cluster activation). Currently the clusters that have been formed are: WASH, food security, early recovery, health, nutrition, education, logistics, and shelter.
Cross cluster coordination takes place through the HCTT around preparedness. Clusters are designed to also operate as sub-sets of the relevant thematic LCGs.
The INGO Forum is a voluntary grouping of all INGOs operating in Bangladesh. The INGO Emergency Sub Committee consists of senior staff of the INGOs that have a humanitarian operational capacity.
Figure 2: DMIC/CDMP 2010

6
Figure 3 JNA (unpublished)
INFORMATION AND KNOWLEDGE MANAGEMENT
There are multiple data sources in Bangladesh. For the purposes of disaster
management in Bangladesh the key nationally and internationally recognised
data sources are:
o The Census 2011 (Census 2011)
o The Household Income and Expenditure Survey (HIES 2010)
o The Multiple Indicator Cluster Survey (MISC 2009)
These sources have been heavily drawn on for the purposes of this review. A new
MICS will be published by the end of 2014.
The Bangladesh Bureau of Statistics (BBS) also holds a wealth of information
provided by surveys and monitoring undertaken by a number of different
government departments. The core data is not easily accessible, which means
mining data at any scale is too time consuming at the start of an emergency.
During the process of writing these Secondary Data Reviews clusters were asked
to identify key baseline indicators from secondary data that they require to carry
out thorough needs assessments. Some of these are already available and others
will need to be a work in progress. The status of these baselines has been
highlighted within the document.
Information Management is handled both within organisations, UN agencies,
INGOs and NGOs as well as in different government departments. For the
purposes of Disaster Management there is a Disaster Management Information
Centre (DMIC), which is currently in the process of transitioning out of CDMP into
the Department of Disaster Management. The information needs of development
partners involved in disaster management and the products and services which
DMIC can provide is still a work in progress.
Extracting lessons learnt on disaster response was a key constraint to the
secondary data review. There is limited information publically available on low
profile disasters. Cyclone responses have the greatest amount of lesson learning,
but much is focused on internal and external operational issues, rather than
critical analysis of programmatic, strategic, assessment, and coordination issues.
This analysis is done, but retained within agency documents including, progress
and donor reports, which makes it difficult to access.

7
FLOODING IN BANGLADESH
There are different ways of classifying and categorising floods along geographic
and geophysical characteristics. In Bangladesh floods are most commonly classified as: o Flash floods which affect both the hilly areas of the south east, where they
can also cause landslides, and the Haor Basin area of the north east. o River flooding, also known as monsoon flooding, an annual event which can
be extreme some years o Waterlogging is the name given to the phenomenon in the southwest of
Bangladesh where river flooding is unable drain and causes prolonged flooding.
Widespread and prolonged flooding can lead the population to become extremely vulnerable. This is because itcan devastate crops, livestock, and property as well as disrupt livelihoods (Paul and Routray 2010).
Climate change is expected to cause glaciers to melt therefore increasing the amount of water flowing through Bangladesh. This combined with greater levels of precipitation and rising sea levels will lead to increased areas of land flooded and for longer periods of time (INTRAC 2010CDMP 2009)
Bangladesh uses both structural (embankments, levees, and polders) and non-structural (flood warning and awareness raising) mitigation techniques (Paul and
Routray 2010). Structural mitigation methods are increasingly recognised as being financially and
environmentally unsustainable. Indigenous flood management methods are increasingly being sought (Paul and Routray 2010).
The delta system has an international dimension as dams constructed and flood gates opened in upstream in India have major effects on flooding in Bangladesh (INTRAC 2010).
Rising levels of river water is also caused by increased silt (INTRAC 2010).
Floods by nature are complex events caused by a range of human vulnerabilities, inappropriate development planning and climate variability (ADPC, 2005 in (ALNAP
2008). Critical infrastructure such as government buildings, schools, health clinics
remain situated in high risk locations and will be continuously at risk to damage and flood inundation unless risk mitigation work is undertaken (GoB 2007).

8
WATEROGGING IN THE SOUTHWEST
Figure 4 Map of 2013 Waterlogged Unions (JNA)
Waterlogging refers to stagnant flood waters that are unable to recede, primarily affecting the southwest coastal belt across Satkhira, Jessore, and Khulna Districts.
Since 2000, communities in Satkhira, Jessore, and Khulna Districts have been waterlogged on an annual or bi-annual basis, with some areas reported to be under water for six – eight months of the year (FRESH 2012).
In 1971, the rivers in these Districts were key transport links, moving people and goods around Bangladesh. It is now estimated that 40% of these rivers are no longer viable for boat transport due largely to siltation preventing the free flow of river traffic (FRESH 2013).
Waterlogging can increase at the end of the monsoon period (August/September) creating an even more significant problem. People displaced as a result of waterlogging reside on high ground (roadsides and embankments) while others remain marooned in raised homesteads. In recent years this situation has lasted for two – three months.
In 2011, heavier than usual rain and release of water from the Durgapur/Damodar Barrage and the Farakkah Barrage in India contributed to excess water (JNA 2011).
Water flowed into the two major rivers, the Kapotakho and the Betrabati, but the onward flow of water towards the Bay of Bengal was obstructed resulting in waterlogging (JNA 2011).
In 2011, Unions were waterlogged for over 12 weeks from September, causing displacement, disruption of livelihoods, and damage to agricultural crops and housing and resulting in humanitarian needs (WFP, FAO, and Shushilan 2011).
In 2013, waterlogging began later than usual (in October), but continued until December.
In 2013 although the level of monsoon rain was categorised as normal by the Flood Forecasting and Warning Centre, slow drainage or low carrying capacity of the Kobodak, Haribhanga and Shibsa river system meant the Kobadak river and Jhikorgacha river flowed above danger levels for 120 days (FFWC).
The waterlogging in 2013 was estimated to have left 280,000 in need of assistance (figure taken from Food Security cluster quantification exercise).
Government and development partners all agree in the need for long-term solutions to the recurring problem, but a shared analysis of the situation does not exist (UNDP 2012).
Waterlogging occurs due to a complex set of natural and man-made factors which cross sectors and have multiple inter-related causes (UNDP 2012).

9
STRUCTURAL RIVER MANAGEMENT
Waterlogging evolved in the south west coastal belt in the 1980s in part due to the Coastal Embankment Programme (CEP) which began in the 1960s. The construction of polders has restricted entrance of river water to the wetlands. Although the intent was to protect agricultural land and settlements, it is now considered that the longer term result has been the elevation of riverbeds, instead of wetlands (Uttaran 2006).
Poor maintenance of embankments and other water infrastructure and natural river-bed silting has resulted in drainage congestion. Over time, this congestion has caused waterlogging to become a regular problem in the area whenever excess water (either through heavy rainfall or upstream flooding) is experienced (Uttaran 2006).
There is debate as to whether structural river management is still protecting flood prone areas or creating long-term unintended negative outcomes (INTRAC
2010). Embankments have encouraged more people to live in certain areas as the land
inside is fertile. This has meant an increase in the number of people living in highly vulnerable areas (INTRAC 2010).
Some NGOs have called for dredging of riverbeds and raising of embankments. Others claim that this is not sustainable due to the high volume of sediment on an annual basis. There are also questions raised about where the sediment would be put (INTRAC 2010).
Tidal River Management (TRM) is a traditional practice in parts of the Bangladesh delta. Communities cut a point in the embankment which will allow the river water to flow into the flood plains during high tide. This water is full of sediment which is then deposited on the flood plain, while the water flows out. This process does not allow sediment to be deposited on riverbeds and in fact deepens the river bed, allowing it to be congestion free (Uttaran 2011).
There are difficulties with TRM regarding the governance and compensation processes of the scheme and some question the ease at which it could be scaled up in relation to the magnitude of the problem (Practical Action 2008).
EARLY RECOVERY
The Early Recovery cluster is part of the humanitarian coordination structure. The Early recovery Cluster was formed to: o Address issues not addressed by other clusters such as livelihoods;
governance; security and rule of law; and crosscutting issues such as environment, gender etc.
o Improve preparedness and coordination of early recovery interventions o Sensitize and contextualize the concept of early recovery. o Facilitate all sectors to move into the recovery phase.
Early Recovery as a principle is inherent in the mandate of every cluster.
There are four pillars of Early Recovery: livelihoods; governance; environment; and community infrastructure.
To ensure that Early Recovery is an integral part of all clusters, an Early Recovery Network, comprising of focal points from each existing clusters, is managed under the auspices of the UN Resident Coordinator.
THE EARLY RECOVER FACILITY (ERF)
In Bangladesh, there is a pooled fund in the form of the Early Recovery Facility (ERF).
The ERF was established by UNDP as a way of financing and implementing emergency response and early recovery efforts to disasters in order to close the gap between the relief phase and long-term recovery.
There is a programme branch to the ERF which funds early recovery activities and a policy development and capacity building of government branch.
The ERF is intended to be sufficiently flexible that it can support and complement national efforts during times of emergency response, when necessary.
To support the government in times of crisis, ERF has pre-approval to spend up to $60 million at its disposal to be able to quickly respond to emergencies based on build back better approaches.
The ERF has pre-approval from the Government and does not require additional approval post-disaster.
The ERF has 49 INGO and NGO partners who are pre-approved and do not require further approvals to commence work.

10
EDUCATION
EDUCATION KEY CHARACTERISTICS
Bangladesh has made great gains in education, as per the HDI. But national progress hides regional disparities (CEA 2013).
Nationally, BANBEIS is responsible for the collection (including annual enrolment data), dissemination, documentation, and publishing of educational information (BANBEIS, accessed 2014).
Just under one in five (18.9%) Bangladeshi girls attended secondary school in 2008. 47% of enrolment in Government secondary schools and 18% of enrolment in non-government schools was female (BANBEIS).
Drop-out rates vary according to source and method of measurement. The 2013 ASPR cites a drop-out rate of 27%, but a completion rate of 75% (ASPR 2013). In comparison, the CEA notes that 23% of children aged 6 to 10 are out of school (CEA 2013).
There is a correlation between remoteness, social deprivation, and out of school children rates. Levels between girls and boys is comparable, and child labour does not appear to be the cause of children dropping out of school (CEA 2013).
The dropout rate is high due to children’s need to help with farming and household chores, child-unfriendly teaching-learning methods, overcrowded classrooms, and unattractive educational environment (UNICEF).
Of the children interviewed in a 2011 UNICEF study, over 5% of children aged 5-11 are in child labour, increasing to 14% for 12-14 year old children. The proportion of child labourers among children attending school is about 6%, but increases to 22% for children not attending school. Boys are three times more likely to be involved in child labour than girls. Among boys aged 12-14 years, 23% was involved in some economic activity (UNICEF, unpublished 2012)1.
There has been an increase in the national primary enrolment rate from 50% in 2007 to 97% in 2013 (DPE).
The national education policy is for children to start school at the pre-primary level, age 5, using nationally approved minimum standards and curriculum (Education Cluster).
1 From UNICEF Out of School Children, 2011-12, unpublished.
CHILDREN WITH DISABILITIES
The mandate for implementing Education For All lies with the Ministry of Education and the Ministry of Primary and Mass Education, but the education of children with disabilities is managed by the Ministry of Social Welfare and is seen as a matter of charity, not a human rights issue (UNICEF 2013).
In 2012, there were 89,994 children with disabilities at school (ASPR 2013).
SCHOOL YEAR
The school calendar for primary and secondary school runs from January to December. Exams are at the end of the year.
At the Union there are adaptable school calendars, which officials can adjust due to disasters, but few diverge from the standard calendar.
EDUCATION COORDINATION
The Education cluster for preparedness is operational and co-led by UNICEF and Save the Children. The cluster has agreed to meet on a bi-monthly basis.
Currently there is not an Education cluster website. o Primary Education falls under the remit of the Ministry of Primary and Mass
Education (MoPME) and is operationalized through the Directorate of Primary Education (DPE) (Education Cluster):
o The bureau is working on an equivalency framework so children from non-government schools are able to sit exams. Currently, only children in BRAC schools are able to sit exams. Government primary schools are free, but students must pay for books, pens etc.
o Ebtedayee Madrasa schools are managed by the Madrasa Education Board but recognized by DPE and included in the Annual School Census (ASC). These schools teach with a mixed religious and government curriculum. Coumi Madrasa schools do not follow the government curriculum and are not included in the DPE ASC.
Secondary Education falls under the remit of the Ministry of Education and is operationalised by the Directorate of Secondary and Higher Education.

11
National Education Rates Figures Source
PRIMARY SCHOOL
Gross intake rate 106%2 (MISC 2009)
National primary school attendance 81% - (83% girls and 80% boys)
(MISC 2009)
School attendance rate for 5 year olds
22% (MISC 2009)
National attendance rates for the poorest quintile
77% - (82% girls and 73% boys)
(HIES 2010 and Education Cluster)
Primary national enrolment rate 97% - (99% girls and 95% boys)
(ASPR 2013)
Completion rate for five-year primary education cycle
67% (BANBEIS, 2001)
SECONDARY SCHOOL
Net Attendance Rate 54% - (59% girls and 50% boys)
(CEA 2013, fr 2001)
Dropout rate 66% girls and 58% boys
(BANBEIS,2007)
PRE-CRISIS BASELINE EDUCATION DATA
Indicators are used to provide the baseline for Phase 1 and Phase II assessments (see opposite table).
IMPACT OF WATERLOGGING ON EDUCATION
Areas most vulnerable to waterlogging include the worst performing Upazilas in terms of primary school attendance in Satkhira. However, there are also best performing Upazilas in Khulna (MISC 2009).
SCHOOL CLOSURE
2 Indicating either that students are double enrolled and/or attendance rolls are not accurately compiled.
In 2013, there were no reported school closures due to waterlogging. Direct observation in some waterlogged areas noted that teachers had moved teaching
3 There is no standardised water quality testing in Bangladesh. The focus of the school water supply is to ensure there is water available for handwashing not drinking water (UNICEF KI).
Baseline Indicator Notes
Disaggregated demographic data
2011 Census data, available in excel on HCTT web platform. Disaggregated to Union level.
List of schools in the affected area
Data not currently available with the cluster
Number of student’s in the affected area
Data not currently available with the cluster
Primary school National Attendance Rate
Data collected for Annual School Survey. Disaggregated data not currently available with the cluster
Secondary National Attendance Rate
Data collected for Annual School Survey, Disaggregated data not currently available with the cluster
At least one toilet in the school
Data collected for Government Primary Schools for the Annual School Survey. Disaggregated data not currently available with the cluster
Separate girls and boys toilets
Data collected for Government Primary Schools for the Annual School Survey. Disaggregated data not currently available with the cluster
Potable water supply3
Data collected for Government Primary Schools for the Annual School Survey. Disaggregated data not currently available with the cluster
Number of schools acting as flood / cyclone shelter
Data available with the WASH cluster
Drop-out rate Data collected for Government Primary Schools for the Annual School Survey. Disaggregated data not currently available with the cluster

12
materials from waterlogged schools and that lessons were taking place in alternative learning spaces (KI, JNA, 2013).
In 2011, the following Education findings were made (JNA 2011): o In areas affected by waterlogging, 32% of schools were closed or occupied
by IDPs (this was approximately two months after waterlogging had begun) o One major causes of children not returning to school was because their
families were unable to pay for new school clothes, education materials, or fees.
o There was a high risk of school dropouts reported in areas affected by waterlogging as children were unable to study at home and due to a loss in family income may be required to seek employment
o Increased drop-out rates were also reported.
LESSONS LEARNT
Management of school facilities, when used as flood shelters, and ensuring that teaching materials and school assets are safe-guarded during times when schools are used as flood shelters will be a key advocacy point pushed by the Education cluster under the DRR/EiE framework in 2014 (KI, Education Cluster, 2013).
GAPS IN INFORMATION
Accurate information on school closure due to waterlogging (including information on where temporary learning spaces are established and how long they are required for).
Figures on numbers of schools beyond registered and non-registered.
Access to core data from which the ASPR and BANBEIS take their figures
Information and lessons learnt on impact of waterlogging on education
Analysis on impact on school structures and facilities when used repeatedly as shelters.
Information on the damage waterlogging does to school buildings and educational materials and how long this takes to repair/resolve.
Information on the impact on attendance (if any) when children and families are displaced or marooned as a result of waterlogging.
4 This figure appears to contradict the figure of 65% of households being functionally landless and must be further explored.
FOOD SECURITY AND LIVELIHOODS
KEY CHARACTERISTICS
The coastal belt is one livelihood zone, based on homogenous food security and livelihood characteristics (IPC 2013).
Most households (65%) in the southern region are functionally landless; the average household has less than 0.5 acres of land (BBS 2011 Southern Delta Plan
2013). The average land ownership is 0.72 acres, which is below the national average of
0.79 acres. A challenge for the agricultural sector is the lack of cultivatable arable land (BBS 2010 Southern Delta Plan 2013).
LIVELIHOODS
46% of households in the southern region are small farmers (with less than 2.5 acres). This figure is in line with the national average of 45%4 (Southern Delta Plan
2013). 28% of households in the region are agricultural labourers, the highest prevalence
is in the southwest. This group can be characterised by (Southern Delta Plan 2013): o Seasonal employment and unemployment o Low demands for labour for most of the year because most are single
cropping areas o Low wage in the lean season (September to October) o Discriminatory wage for women o High levels of debt o Migration to nearby cities for several months of the year.
Shrimp fry collection relies on cheap labour to carry out the work. There is a high number of children involved in this livelihood activity (Southern Delta Plan 2013).
Forest dependent households live in or near the Sundarbans and depend on extracting natural resources. Poor people also collect firewood from the newly established forests in the char islands in Patuakhali, Bhola, and Noakhali (Southern
Delta Plan 2013).
13
FOOD SECURITY
The southwest region is a food deficit area where net food production and diversity of food production have declined significantly over recent decades. Increasing shrimp production has reduced the diversity and quantity of food production particularly for local consumption (Pravda, 2011).
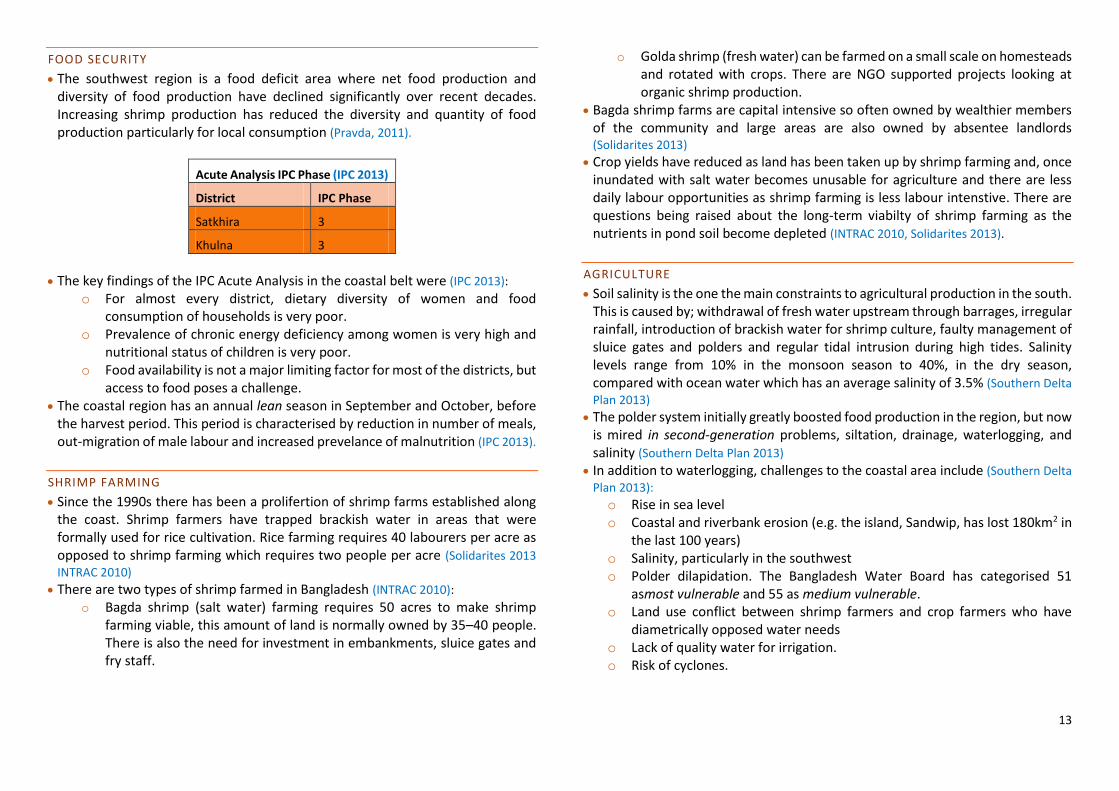
Acute Analysis IPC Phase (IPC 2013)
District IPC Phase
Satkhira 3
Khulna 3
The key findings of the IPC Acute Analysis in the coastal belt were (IPC 2013):
o For almost every district, dietary diversity of women and food consumption of households is very poor.
o Prevalence of chronic energy deficiency among women is very high and nutritional status of children is very poor.
o Food availability is not a major limiting factor for most of the districts, but access to food poses a challenge.
The coastal region has an annual lean season in September and October, before the harvest period. This period is characterised by reduction in number of meals, out-migration of male labour and increased prevelance of malnutrition (IPC 2013).
SHRIMP FARMING
Since the 1990s there has been a prolifertion of shrimp farms established along the coast. Shrimp farmers have trapped brackish water in areas that were formally used for rice cultivation. Rice farming requires 40 labourers per acre as opposed to shrimp farming which requires two people per acre (Solidarites 2013
INTRAC 2010) There are two types of shrimp farmed in Bangladesh (INTRAC 2010):
o Bagda shrimp (salt water) farming requires 50 acres to make shrimp farming viable, this amount of land is normally owned by 35–40 people. There is also the need for investment in embankments, sluice gates and fry staff.
o Golda shrimp (fresh water) can be farmed on a small scale on homesteads and rotated with crops. There are NGO supported projects looking at organic shrimp production.
Bagda shrimp farms are capital intensive so often owned by wealthier members of the community and large areas are also owned by absentee landlords (Solidarites 2013)
Crop yields have reduced as land has been taken up by shrimp farming and, once inundated with salt water becomes unusable for agriculture and there are less daily labour opportunities as shrimp farming is less labour intenstive. There are questions being raised about the long-term viabilty of shrimp farming as the nutrients in pond soil become depleted (INTRAC 2010, Solidarites 2013).
AGRICULTURE
Soil salinity is the one the main constraints to agricultural production in the south. This is caused by; withdrawal of fresh water upstream through barrages, irregular rainfall, introduction of brackish water for shrimp culture, faulty management of sluice gates and polders and regular tidal intrusion during high tides. Salinity levels range from 10% in the monsoon season to 40%, in the dry season, compared with ocean water which has an average salinity of 3.5% (Southern Delta
Plan 2013) The polder system initially greatly boosted food production in the region, but now
is mired in second-generation problems, siltation, drainage, waterlogging, and salinity (Southern Delta Plan 2013)
In addition to waterlogging, challenges to the coastal area include (Southern Delta
Plan 2013): o Rise in sea level o Coastal and riverbank erosion (e.g. the island, Sandwip, has lost 180km2 in
the last 100 years) o Salinity, particularly in the southwest o Polder dilapidation. The Bangladesh Water Board has categorised 51
asmost vulnerable and 55 as medium vulnerable. o Land use conflict between shrimp farmers and crop farmers who have
diametrically opposed water needs o Lack of quality water for irrigation. o Risk of cyclones.

14
LIVESTOCK
Livestock is an important sub-sector for the rural landless and for marginal and small farmers. It is labour intensive, providing employment opportunities and a regular monthly income through the sale of milk, eggs, poultry and goats (GoB
2008). Main livestock assets are poultry (chicken, ducks, goose, pigeon, Koel), goat,
sheep, cows, buffalo, and pigs (KI, ACF 2014). Poultry farming can be further categorised as (KI, ACF 2014):
o Backyard where 2-50 indigenous birds are kept. Poor households keep the birds inside their house, richer households prepare separate shed near the house.
o Small commercial farming of 500 to 10,000 birds, including birds for both meat (broiler) and egg (layer) production. Practiced mostly by medium and rich farmers who have a separate bird shed and use improved modern techniques
o Large commercial farms. Landless and small farmers keep goats and sheep or one or two cows for milk and
ox for fattening. Poor households keep larger livestock in and extra shed by their house. Comparatively bigger farmer may keep up to twenty cows in separate (KI,
ACF 2014). In the coastal belt, farmers keep buffalo for both milk and draught purposes (KI,
ACF 2014). For poor households, livestock is usually only one element of a diversified
livelihood.
MARKETS
Institutional credit in the south is very low. 80% of loans are from mohajansand dadanders, private money lenders who charge high rates of interest, roughly 10% per month, and have other negative terms attached to loans (Southern Delta Plan
2013). Market density in the southern region is lower than in other parts of Bangladesh,
resulting in high levels of monsoon losses due to poor market infrastructure (Southern Delta Plan 2013).
5The above applies to cyclone based emergencies but it is anticipated that these packages will be recommended for flooding as well.
Market places are exposed and vulnerable to cyclones and storm surges. However, reports suggest that after cyclone Sidr markets re-established rapidly (Southern Delta Plan 2013).
FOOD SECURITY AND LIVELIHOODS COORDINATION
The Food Security cluster meets regularly in Dhaka. Technical Working Groups are set up on an ad hoc basis to address specific issues (including needs assessment).
The cluster is co-led by WFP and FAO in Dhaka. District focal points in all coastal belt districts are a work in progress and will be rolled out in 2-3 pilot districts during 2014. The cluster has up-to-date mapping in the form of a 4W (using the new standardised IMWG tool).
There is a comprehensive cluster website: http://foodsecuritycluster.net/ As reflected in the contingency plan, all cluster members have agreed on5(FSC
Contingency Plan 2013): o A standardised recommended response package for dry food for the first 7
days (immediate response) o A recommended short-term (week 2-8) standardised food package (food
only) o A recommended short-term (week 2-8) standardised package (cash and
food mix).
PRE-CRISIS BASELINE LFS DATA
WFP’s VAM Unit is preparing a compendium of proxy indicators/variables of food security and nutrition along with their disaggregation level and source, not published yet (KI, VAM, 2014).
The VAM unit has also requested the Bangladesh Bureau of Statistics (BBS) to generate food security related proxy variables at Upazila level from the 2011 Census. This should include percentage of households with major income sources from agriculture lay labour and those with major income sources from non-agricultural activities (KI, VAM, 2014).
Key indicators to provide a baseline for Phase 1 and Phase 2 assessments have been agreed by the FSC Technical Working Group as:

15
Additional pre-crisis data should include seasonal price trends and access to markets.
The Bangladesh Integrated Food Security Phase Classification (IPC) is housed in FAO and provides protocols to classify the severity and causes of food insecurity and provide actionable knowledge by consolidating wide-ranging evidence. It is a process for building technical consensus among key stakeholders. The Acute Food Security Situation for the coastal region has been completed, other zones will now follow.
IMPACT OF WATERLOGGING
Although collecting specific information on the impact of waterlogging is relatively new, assessment reports from 2011 and 2013 found similar impacts on food security and livelihoods as a result of waterlogging.
Key findings from the 2013 JNA light are: o Food, in terms of quality, quantity and diversity, was reported to be less than
required. Affected poor households were managing the limited quantity of food by sharing one meal among all family members.
o Vulnerable groups who were unable to leave their village, including older people and child-headed households, were reliant on Government food aid. The food aid was described in reports as inadequate as it only contained 5kg of rice.
o Food access was hampered by people being marooned (in their homes/locations which may be on raised plinths or high ground and surrounded by water) and unable to access markets easily. Where this was the case, families sometimes moved from their homes, even though the houses were not damaged.
o The destruction of the fish farms and submergence of the agricultural meant that there were few, and in some cases no, daily wage opportunities. This lack of income severely hampered access to food for the affected people (due to lack of purchasing power).
o Household food storage was described in reports as inadequate, which is in keeping with the fact that the area was already experiencing the annual lean season where food stocks were expected to be limited or non-existent, particularly for the poorest families.
o Some reports from the field indicated that households were not prioritising food for young children and lactating or pregnant mothers. These vulnerable
groups were at risk of malnutrition as they (along with the rest of the affected population) consumed insufficient, and less than usual, food.
o Serious food needs for landless and marginal farm families and the extremely poor.
FOOD SECURTY AND LIVELIHOODS RESPONSE LE SSONS LEARNT
No documented lessons learnt were accessed for this review.
KEY INFORMATION GAPS
Baseline figures for seasonal migration Collated food security and livelihoods lessons learnt.
Baseline Indicator Notes
Demographic data Census data, available in excel on HCTT web platform in excel. Disaggregated to union level.
Poverty levels Available from WFP, in excel. Disaggregated to Upazila level.
Livelihood groups The JNA is in discussion with the cluster and the information management working group about where and how to access this data.
Number of landless Disaggregated to Division level in the HIES. The JNA is in discussion with the cluster and the information management working group about where and how to access this data.
Integrated food security phase classification (IPC)
Acute analysis available for coastal Districts.
Number covered by government social safety net programme
This data is not readily available. It could potentially be collected through Upazila Chairman or PIOs. For those enrolled on the Vulnerable Group Development programme WFP could request this information.
16
HEALTH
KEY CHARACTERISTICS
Health service provision is through the Government, the private sector, and the NGO sector.
The health services provider structure is built on the country’s administrative pattern which follows the national government, divisional, district, Upazila, Union, and Ward administrations (Health Sector Profile 2010).
Bangladesh faces many challenges in improving the health of the population, particularly the poor and vulnerable. Maternal and neonatal mortality, though decreasing, are not reducing at an acceptable rate (Health Sector Profile 2010).
Health care is provided for free at the community clinic level (Health Bulletin 2012).
The for-profit sector is a key service deliverer for all income groups (providing 30% of services to the poorest two quintiles). There is a modest role played by the NGO sector which typically provides less than 10% of services for all income groups (with perhaps slightly more for the poorest quintile) (Health Sector Profile
2010).
MATERNAL HEALTH
The maternal mortality rate is 194 per 100,000 (BMMS 2010). Antenatal care for women by medically trained personnel increased from 33%
1999-2000 to 55% in 2011 (HPNSDP 2013).
An estimated 73% of births are attended by non-medically trained persons (UNFPA 2013).
In 2010, 76% of deliveries still took place in the home (UNFPA 2013). Close to 7,000 mothers dying each year due to pregnancy-related causes (UNFPA
2013). Nearly two-thirds of all maternal deaths are the direct result of obstetric
complications (UNFPA 2013). Unmet need for family planning has increased from 11% in 2004, to 17% in 2007
(UNFPA 2013) .
CHILD HEALTH
The infant mortality rate is 36 per 1,000 live births (SVRS 2010).
Drowning is the leading cause of death for children aged 2-10 years, followed by pneumonia, and malnutrition (UNICEF 2005).
Drowning, usually occurs close to home, in and around the local community, and the majority of drowning deaths occur during sunny weather. It is a neglected form of child mortality and often goes unreported (UNICEF 2012).
The leading causes of mortality for infants are pre-term birth, pneumonia and birth asphyxiation (UNICEF 2005).
The leading causes of morbidity for infants are acute respiratory infections (ARI), diarrhoea, and malnutrition (UNICEF 2005).
The leading causes of morbidity for children aged 1-17 are ARI, diarrheal diseases, and fever UNICEF (UNICEF 2005).
The Bangladesh Health and Demographic Survey(BDHS) 2007 indicates that only about 37% of sick children receive care from a trained provider, with girls and the poor having lower rates(BDHS 2011).
86% of children 12 – 23 months are fully vaccinated; the figures is 85% for girls and 87% for boys (BDHS 2011).
Coverage for measles is 88%, the GoB target is 90% (BDHS 2011).
DISEASE
Diarrhoea is highly prevalent throughout the year, but typically spikes in April and October (Icddr,B I/V 2013).
The main public health diseases are tuberculosis, malaria, dengue and soil-transmitted helminthiasis (WHO 2010).
There is no malaria in waterlogging prone districts.
Dengue Fever has increased due to rapid urbanisation and high urban and peri-urban population density (CDC 2012).
There is no routine surveillance of levels of aedes mosquitoes which carry dengue (CDC 2012).
NON-COMMUNICABLE / CHRONIC DISEASE
Non-communicable diseases account for 52% of all deaths, 27% due to cardiovascular disease and 9% to cancer (WHO 2011).
Injuries account for 10% of all deaths (WHO 2011).
HIV
HIV prevalence is under 0.1% with an estimated 7,500 PLHIV in Bangladesh (UNAIDS 2012).

17
DISABILITY
9.07% of the population has a disability (8.1% male and 10% female). The figure is 9.63% in rural areas and 7.49% in urban areas (HIES 2010).
Disability caused by injury, after infancy, is more than twice as likely to happen to boys as to girls (UNICEF 2005).
HEALTH COORDINATION
In Bangladesh, WHO-BAN has been leading the UN DER (Disaster and Emergency
response) health Cluster and ensuring health sector coordinating mechanisms
involving UN agencies, NGOs, CBOs, Health authorities, donors, and community
members, including between the centre and the field, and other sectors/clusters.
The Health cluster responds to both emergencies and to assess health sector preparedness activities on an ongoing basis (ERM 2012).
The Ministry of Health and Family Welfare (MoHFW) is responsible for the implementation, management, coordination and regulation of national health and family planning related activities, programs and policies.
The MoHFW regulates the private and NGO sector.
HEALTH PRE-CRISIS BASELINE DATA
All Government health facilities are mapped in this link Health Infrastructure in
Bangladesh. Health Data is available through the Health Management Information System Health cluster information management tools such as UN-DER Health Cluster
Standard Operating Procedures, post disaster disease surveillance for morbidity and mortality, Agency Inventory format, and the 3W were developed and finalised in 2012 (ERM 2012).
There are not currently agreed essential pre-crisis health baseline indicators.
CONTINGENCY PLANNING AND PREPAREDNESS
The Emergency Preparedness and Response Programme is an active unit of Directorate General of Health Services for adequate disaster preparedness activities and response to emergencies (EPR 2013).
The Directorate General Health Services, WHO, and other stakeholders manage a buffer stock of drugs and medical supplies which in the past have been used
during emergencies at district and Upazila levels, including emergency drugs (antibiotics, IV fluids, antipyretics, analgesics, topical ointments, drops, nebulizer, anti-snake venom injections etc.) (Health Cluster 2013).
A number of guidelines exist for health professionals and community health volunteers for disaster preparedness and response and are available through the health cluster (EPR 2012).
IMPACT OF WATERLOGGING ON HEALTH SERVICES
Post disaster disease outbreaks can be triggered by damaged water and sanitation systems. Diarrhoea, ARI, and skin-eye-ear infections are common in post disaster situations (ERM 2012).
The public health needs of the affected population increase as a consequence of people living under open sky, lack of safe drinking water, and damage to sanitary systems (KI Health Cluster 2013).
In the 2011 waterlogging assessments people prioritised the following health concerns(JNA 2011): o Diarrhoea o Skin diseases o Snakebites o Access to safe birth support o A reduction in access to health care reported. Those living on the
embankments stated that they had no access to health care and those in marooned houses or damaged houses were unable to make the journey to health facilities, largely because they could not afford transportation costs (as boats were required and in limited supply).
FOOD SECURTY AND LIVELIHOODS RESPONSE LESSONS LEARNT
No documented lessons learnt were accessed for this review.
KEY INFORMATION GAPS
Lessons learnt documentation remains scant An agreed list of pre-crisis baseline data. Information on health seeking behaviour during waterlogging periods as
compared to other times of the year.
18
NUTRITION
NUTRITION KEY CHARACTERISTICS
Child <5 nutrition has decreased since the 1990s, but the rate of reduction has been slow (UNREACH, Unpublished).
Chronic stunting and wasting are persistent challenges (UNREACH, Unpublished).
The pattern and change in wasting has been small and inconsistent.
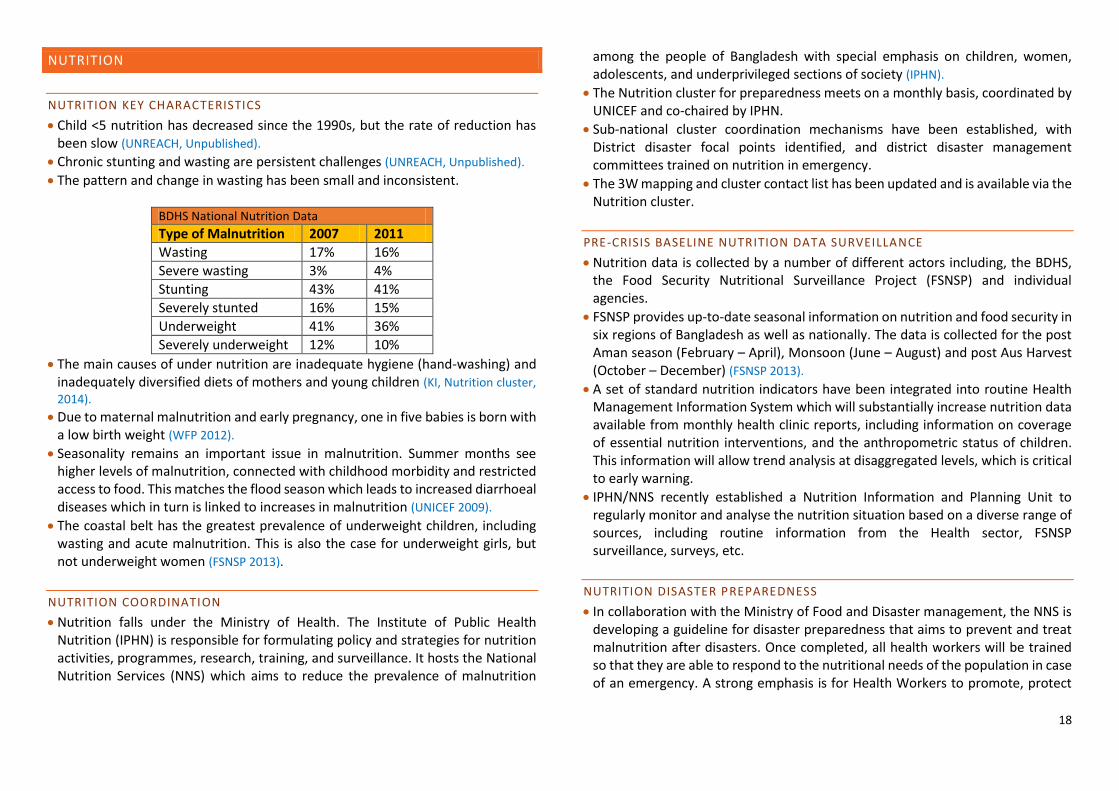
BDHS National Nutrition Data
Type of Malnutrition 2007 2011
Wasting 17% 16%
Severe wasting 3% 4%
Stunting 43% 41%
Severely stunted 16% 15%
Underweight 41% 36%
Severely underweight 12% 10%
The main causes of under nutrition are inadequate hygiene (hand-washing) and inadequately diversified diets of mothers and young children (KI, Nutrition cluster,
2014). Due to maternal malnutrition and early pregnancy, one in five babies is born with
a low birth weight (WFP 2012).
Seasonality remains an important issue in malnutrition. Summer months see higher levels of malnutrition, connected with childhood morbidity and restricted access to food. This matches the flood season which leads to increased diarrhoeal diseases which in turn is linked to increases in malnutrition (UNICEF 2009).
The coastal belt has the greatest prevalence of underweight children, including wasting and acute malnutrition. This is also the case for underweight girls, but not underweight women (FSNSP 2013).
NUTRITION COORDINATION
Nutrition falls under the Ministry of Health. The Institute of Public Health Nutrition (IPHN) is responsible for formulating policy and strategies for nutrition activities, programmes, research, training, and surveillance. It hosts the National Nutrition Services (NNS) which aims to reduce the prevalence of malnutrition
among the people of Bangladesh with special emphasis on children, women, adolescents, and underprivileged sections of society (IPHN).
The Nutrition cluster for preparedness meets on a monthly basis, coordinated by UNICEF and co-chaired by IPHN.
Sub-national cluster coordination mechanisms have been established, with District disaster focal points identified, and district disaster management committees trained on nutrition in emergency.
The 3W mapping and cluster contact list has been updated and is available via the Nutrition cluster.
PRE-CRISIS BASELINE NUTRITION DATA SURVEILLANCE
Nutrition data is collected by a number of different actors including, the BDHS, the Food Security Nutritional Surveillance Project (FSNSP) and individual agencies.
FSNSP provides up-to-date seasonal information on nutrition and food security in six regions of Bangladesh as well as nationally. The data is collected for the post Aman season (February – April), Monsoon (June – August) and post Aus Harvest (October – December) (FSNSP 2013).
A set of standard nutrition indicators have been integrated into routine Health Management Information System which will substantially increase nutrition data available from monthly health clinic reports, including information on coverage of essential nutrition interventions, and the anthropometric status of children. This information will allow trend analysis at disaggregated levels, which is critical to early warning.
IPHN/NNS recently established a Nutrition Information and Planning Unit to regularly monitor and analyse the nutrition situation based on a diverse range of sources, including routine information from the Health sector, FSNSP surveillance, surveys, etc.
NUTRITION DISASTER PREPAREDNESS
In collaboration with the Ministry of Food and Disaster management, the NNS is developing a guideline for disaster preparedness that aims to prevent and treat malnutrition after disasters. Once completed, all health workers will be trained so that they are able to respond to the nutritional needs of the population in case of an emergency. A strong emphasis is for Health Workers to promote, protect

19
and support breastfeeding, and appropriate complementary feeding and hygiene among children <2 (IPHN).
The Nutrition cluster maintains a district level inventory of stocks pre-positioned by cluster members, including anthropometric equipment and essential nutrition supplies.
A detailed Nutrition cluster contingency plan is being finalised
The nutrition cluster has established a Rapid Nutrition Assessment Team (RNAT) which is expected to lead post disaster rapid nutrition assessments and nutrition surveys
Phase three JNA assessment guidelines for nutrition are under development.
The Nutrition cluster has contributed to setting standards for scaling-up a full set of direct nutrition interventions needed to prevent under-nutrition and micronutrient deficiencies, through development of job aids and tools under the Nutrition in Emergencies national training module.
IMPACT OF WATERLOGGING ON NUTRITION
In light of the high pre-existing rates of malnutrition (and also based on information on the impact of food security and livelihoods), the nutrition situation could easily and quickly deteriorate during a period of waterloggingand, particularly, increase the vulnerability of children <5.
In a disaster, a lack of shelter and/or water will result in decreased hygiene, often with limited available space where women feel comfortable to continue breastfeeding and/or engage in complementary feeding (KI, Nutrition cluster, 2014).
In a disaster, food crops and market are destroyed and/or disrupted resulting in less access to diversified nutritious food leading to inadequate energy and micronutrient intake (KI, Nutrition cluster, 2014).
Lack of shelter/water and disruption to livelihoods are typically the first sectors to be compromised when a disaster hits which is why under-nutrition often aggravates soon after an emergency (KI, Nutrition cluster, 2014).
In waterlogging prone areas, pre-crisis vulnerability in relation to nutrition and the impact on food and livelihoods could impact on child feeding practices that could further compromise nutrition.
Waterlogging may not have a direct and immediate impact on nutrition, but it creates a situation that increases vulnerability and can lead to a rise in under-nutrition in a short amount of time, complicated by factors such as inadequate hygiene, a lack of shelter for private and safe spaces for women to breastfeed or
feed children, and inaccessibility to nutritious food. The nutrition situation of pregnant/lactating women and children, who are most vulnerable, should be closely monitored at all times (KI, Nutrition cluster, 2014).
LESSONS LEARNT
Concurrent sectoral interventions implemented post disaster will go a long way in mitigating and reducing the deterioration of nutritional status.
Nutrition sensitive strategies should be mainstreamed into responses of key sectors (KI, Nutrition Cluster, 2014): o Food security/livelihoods to ensure vulnerable populations have access to
and consume adequately diversified nutritious diets. o Shelter that ensures mothers have safe, private, and hygienic spaces to
breastfeed infants and young children must be established as soon as possible to avoid decreases in breast feeding.
o WASH activities to ensure caregivers hand wash with soap before handling of food and feeding to avoid contamination and subsequent illness in children that can lead to under-nutrition (both practical activities to ensure provision of water and soap as well as hygiene promotion).
o Health to ensure essential health and nutrition services are delivered by health providers at quality and scale to vulnerable populations (including micronutrient supplementation, counselling and promotion, disease management, management of acute malnutrition, etc.).
INFORMATION GAPS
Impact of waterlogging on nutrition status Agreed nutrition baselines Lessons learnt from previous nutrition responses.
SHELTER
SHELTER KEY CHARACTERISTICS
There is no clear written definition of partially or completely destroyed house, the consensus among shelter cluster partners is:

20
o Partially damaged is where any component of a house (roof/ wall/foundation/column) is damaged, but the house is repairable.
o Completely destroyed is when the house is severely damaged or washed away and cannot be repaired
Shelter Types in Bangladesh
Pucca Fully brick structures
Semi-pucca Floors and/or walls made of brick and the rest made from tin (metallic sheet)
Kutcha Floors made of soil and roof and walls made of tin
Jhupri Floors made from soil and roof/walls made from bamboo
EMERGENCY SHELTER
Temporary shelter in emergency response is defined as a temporary structure which provides adequate shelter for a short period of time immediately after the event (Shelter TWG).
Where possible, shelter materials used for emergency responses should be appropriate for early recovery. This can be difficult due to the different needs for building on embankments and on flatground (Shelter Cluster TWiG 2009).
TRANSITIONAL SHELTER
Transitional shelter/semi durable shelter for transitional response is defined as a structure which provides adequate shelter which covers a period of time from the emergency phase until longer term durable solutions can be provided. If required they can be dismantled and relocated (Shelter Cluster TWG).
Transitional shelter interventions must consider land rights issues. In Bangladesh, where population density is high it can be difficult to get Government approval for transitional shelter sites due to political concerns, resentment by host populations, fear the site may become permanent, or fear the value of the land may be reduced (unpublished UNDP).
Types of transitional shelter sites include dispersed settlements, collective centres, and cluster transitional shelter.
The Shelter cluster has developed standard shelter kit lists for people displaced to embankments and one for people living on their own land or returned home (Shelter Cluster TWiG 2009).
Main Features of Standardised Transitional Shelter(Shelter TWG 2013)
Flooding and cyclones in inland and coastal areas
Plinth Height variable Above 1 ft HFL, 5" Brick wall with 10" X 10" brick pillar
Columns and frame 10 No RCC (5 in x 5 in with T section)
Wall Cladding CGI + Bamboo Mat
Trusses and CGI fixing Timber truss , Tin Screw (Bolt), Cyclone strap
Foundation Below 1.5 ft GL , T Shape
Roof shape hipped
Roof slope 30- 35 degree
Length of Canopy 1.5 ft
Plinth space for veranda 6ft wide extended earth filling
Ceiling bamboo mat
Window 3 No (Beneficiary choice)
Door 2 No (Beneficiary choice)
Height (PL to Ceiling) minimum 7 ft
Latrine Single Chamber, minimum 5 to 7 ring, Bamboo/ wooden Pole, .24 mm CI sheet for wall cladding, 0.30 mm CGI sheet, Ramp, fero-cement work
Gender Partition, Two no of door, secured toilet
Disability Staircase/ramp
Age Staircase/ramp (Railing for older people)

21
PERMANENT HOUSING
Permanent house in recovery response is defined as a permanent structure built to normal national standards appropriate for the exposure to hazards (Shelter TWG).
SHELTER COORDINATION
The Shelter cluster is led by UNDP during non-emergency periods and led by IFRC during emergency responses.
The shelter cluster for preparedness is established and meets regularly. There is a Technical Working Group who meet on a regular basis.
There is a comprehensive website which is a resource for humanitarian agencies working in the Shelter sector (Shelter Cluster).
The location of NFIs is still under discussion in Bangladesh between the shelter cluster, early recovery cluster and the food security cluster (KI, Shelter TWG, 2014).
The shelter cluster are in the process of agreeing a standard shelter kit package.
PRE-POSITIONING AND CONTINGENCY PLANNING
There are pre-positioned shelter items, by both cluster members and the Government. These are currently in the process of being mapped.
PRE-CRISIS BASELINE SHELTER DATA
The key baseline required for the shelter cluster is available on the HCTT website in excel format.
The data on land ownership which is key complex issue facing the shelter cluster is difficult to find.
Baseline Indicator
Notes Location
Disaggregated demographic data
2011 Census data, available in excel on HCTT web platform. Disaggregated to Union level.
JNA Baselines
Type of housing 2011 Census data, available in excel on HCTT web platform. Disaggregated to Union level.
JNA Baselines
Land Ownership Disaggregated to Division level in the HIES. T n/a
6This report was not accessed during this review.
IMPACT OF WATERLOGGING ON SHELTER
Kutcha construction is highly vulnerable to water related disasters. The earthen plinths get badly eroded or completely washed off and have to be rebuilt. Bamboo or timber posts rot at the base when they remain in saturated soil, thus weakening the structure of the buildings and making them more vulnerable to damage by strong winds including: sagging, developing cracks and losing alignment (JNA 2011)
In 2011 in Satkhira, houses built with mud and other primary natural materials were damaged or completely destroyed by the flooding. Many household economic activities in rural Bangladesh take place in the home. Such income stops when a house is damaged by disaster (ERF 2011)
Displaced persons with severely damaged homes experienced delays in return due to long term flooding and lack of access to materials needed for repairs and rebuilding. People reported being uncertain about the length of time it would be before they could resume livelihood activities (ERF 2011)
In 2013, NGO staff working in waterlogged areas report that the length of the time many houses have been sitting in water has had severe impact on the mud buildings and that the houses have totally collapsed as a result of the mud becoming saturated and no longer able to hold its form (JNA Light 2013).
LESSONS LEARNT
The FRESH project, a consortium project in response to Cyclone Aila and subsequent waterlogging, had a significant shelter component. The FRESH consortium project built flood shelters (houses) that were designed to be resistant to floods and waterlogging. FRESH were due to put together a report6 to assess how resilient the beneficiaries of the project have been to the 2013 waterlogging (JNA Light 2013).
Observations from the 2013 waterlogging indicated that some of the FRESH housing was above the water level and people were able to continue to reside in these homes, even though they were effectively marooned and had to move to roads and other nearby structures on bamboo pole bridges. In some areas however the FRESH houses had been vacated. Sometimes this appeared to be because the water level had encroached inside the houses and transportation required boats. It was also suggested that people vacated shelters to be able to

22
access goods and services that they could not access from their marooned houses.
Transitional shelter responses are unable to include landless families, therefore leaving out the most vulnerable members of the community. The chronic complexity of land reform and landlessness should not be underestimated and a quick-fix of these issues following a disaster is unlikely (KI Shelter Cluster TWG 2014).
Untangling the actual situation in relation to the shelter response is complicated by inconsistencies between reports. For instance, more than a year after cyclone Sidr, UNDP estimated that 170,000 families were still without housing, while Oxfam cites 276,000 (Early Recovery Review, 2007).
Difficulties in accessing remote communities, transporting materials, and accessing materials were obstacles to an effective shelter response.
Lessons learnt by Oxfam after cyclone Sidr included (unpublished Oxfam GB): o Shelter kits took too long to arrive, were too heavy and unsuitable, with
many containing metal elements not recommended for use in a high salinity and humid region.
o People also needed non-traditional skills to use the materials which required external assistance.
o An increase in child marriage and polygamous marriages were two unintended outcome of OGB’s policy of giving all transitional shelter kitsto women headed households and handing over materials to the woman in the household directly.
o OGB assumed that a household was a single generation plus children. This meant extended families had to split up to each get a kit, thus eroding traditional support structures. If they did not split up different generations had to share rooms, which is not in keeping with local custom.
WASH
WASH KEY CHARACTERISITCS
Water quality in Bangladesh is compromised by the presence of arsenic detected in 61 of 64 districts of Bangladesh. It is at dangerous levels for at least 20 million people. In 2006, contamination levels were estimated to be 20% at source and 12% at point of consumption. The Bangladesh acceptable level of arsenic in
drinking water is <50 micrograms per litre; the WHO global standard is <10 micrograms per litre (UNICEF 2009).
Up to 53% of the coastal region suffers from saline intrusion in surface water (Haque 2006).
There are no systematic mechanisms for water quality monitoring and surveillance in Bangladesh (UNICEF 2009a).
Only one third of secondary towns have piped water, and where it exists it is often contaminated due to leakages and intermittent supply (UNICEF 2009a).
There are greatly varying figures on sanitation coverage due to different terminology for improved sanitation (UNICEF 2009a).
The National Sanitation Strategy aims to have 100% of the population with access to sanitary latrines by 2015. Currently, 60% of the population has latrines, 32% hygienic and 25% unhygienic (DPHE).
WASH COORDINATION
At the national level, the Local Government Division of the Ministry of Local Government, Rural Development and Cooperatives is responsible for the overall development of the Water Supply and Sanitation (WSS) sector.
The Department for Public Health Engineering (DPHE) is responsible for implementation of GoB WSS projects.
The DPHE is represented down to the Upazila level; at the Union level, there is a Union WASH Committee.
The WASH cluster for preparedness is functioning and is coordinated by UNICEF’s WASH department and co-coordinated the DPHE.
The WASH cluster website is currently under construction.
CONTINGENCY PLANNING AND PREPAREDNESS
The WASH cluster has developed a Contingency Plan for 2014 which contains planning ranging for a worst case scenario of a caseload of 1.7 million affected people and the least severe cyclone having a caseload of 790,000 affected people.
There is an up-to-date list of prepositioned supplies, government, UNICEF, and cluster members in the plan.
PRE-CRISIS DATA

23
The WASH cluster has identified the following as the key WASH baseline indicators (WASH cluster 2014):
Indicator Notes
Number of water points Government only
Arsenic contamination
Sanitation coverage including
Unimproved, improved, shared and open defection
Number of primary schools
Government, registered non-government and community schools
Number of cyclone and flood shelters
Total number, capacity and other use
Number of toilets in shelters
Separate male/female, which floor and water supply
Water supply in shelters
The data sources used for the pre-crisis data are: o The Multiple Indicator Cluster Survey (MISC 2009)
o The Bangladesh Health and Demographic Survey (DHS 2011)
o World Bank: Hard-to-Reach Areas (Hard-to-Reach 2011).
There is currently no repository or mapping of hygiene baseline, however operational agencies in cyclone affected areas have hygiene surveys which they can share.
LIMITS OF PRE-CRISIS DATA
The WASH cluster did not include hygiene baselines, as these are not included in any national/international surveys, which provide geographically disaggregated data.
The indicators do not provide information on whether WASH facilities within flood and cyclone shelters are currently functioning or not functioning.
National level surveys are not annual, therefore at times data is out of date.
Disaster responses in certain areas can dramatically alter coverage, which is not reflected in this data
There is no comparable data on hygiene practices.
IMPACT OF WATERLOGGING ON WASH

24
The main concerns from water disasters are the destruction of water and sanitation infrastructure. An estimated 70-80% of water pumps have been submerged in previous waterlogging which contaminates water used for cooking and drinking and causes diseases (ERF 2011).
The 2011 waterlogging illustrated that while water levels were high, people with access to boats could travel to collect water. However, access to clean drinking water became increasingly difficult as water began to recede when boats can no longer be used to reach distant water points and transport water. Lack of clean drinking water increased as waters receded and there was greater urgency to repair damaged water points (ERF 2011)
An important concern is related to how water and sanitation interfaces with gender. Women and adolescent girls face particular difficulties travelling to collect water and using latrines located close to where people are staying but which do not provide sufficient privacy. Bathing is also a particular concern for women and adolescent girls because modesty, and social convention, prohibited women from bathing with the water from hand pumps. As a result, women were found washing in stagnant water and contracting skin diseases and other infections as a result (ERF 2011)
LESSONS LEARNT
No specific WASH lessons learnt documents were found during this review.
GAPS IN INFORMATION
Research is needed to develop & test the pros and cons of different water & sanitation options for areas experiencing 2-3 months water logging per year including: o Elevated latrine options (i.e. mud platform, mini-conodominial sewers,
composting toilets, floating latrine platforms with flexible pipes) o Elevated tubewell options (i.e. head raised, platform raised) o Water storage vessels that can float from the tubewell to house o More information is required on the specific WASH concerns related to
bathing in stagnant water and walking/staying in stagnant water for weeks and months on end.