pre-planned drape surfaces: a new survey planning …sgl.com/technicalpapers/drape.pdf ·...
TRANSCRIPT

Pre-planned drape surfaces: a new survey planning tool Luise Sander* * Sander Geophysics Limited, 260 Hunt Club Road, Ottawa, Ontario, K1V 1C1 Originally presented at CSEG Forum: High Resolution Aeromagnetics for Hydrocarbon Exploration, Calgary, Alberta, November 17, 1997 ABSTRACT SGDrape is Sander Geophysics Limited’s (SGL’s) system for designing and flying a drape surface for an airborne geophysical survey. The drape surface is computed by modifying the digital terrain model (DTM) of the survey area to ensure that the maximum acceptable climb/descent capability of the aircraft is not exceeded. Important factors involved in a successful drape survey are a high quality DTM trimmed to the survey area, a first and second derivative smoothing algorithm to create the flying surface, an accurate navigational guidance system and reliable error handling capabilities. An analysis of the derived flying surface can be used to determine if the airborne survey will meet the exploration requirements. The effect of modifications to the original survey plan are quantified by recalculating the flying surface after the survey plan has been modified. Such modifications could include changing line direction, modifying survey boundaries, or removing high elevation areas from the survey. Case studies of survey projects performed by SGL show substantial improvements can be gained by these modifications to the survey plans. INTRODUCTION For the past three years, Sander Geophysics Ltd. (SGL) has been routinely using its pre-planned computer-aided drape flying system, SGDrape, for the majority of its airborne surveys. Originally, SGDrape was intended to be a survey flying tool, resulting in more consistent flight altitudes for adjacent lines and improved traverse and control line intersection deviations. These benefits have been realized, but an unanticipated benefit has also been noticed. The pre-planning of the drape surface allows for pre-survey analysis of the survey flight plan and a quantification of the achievable flying heights in different parts of the survey area. By analysing the interaction between the proposed flight plan and the topography in the survey area, the survey flight plan can be optimized for the specific requirements of the client, resulting in higher quality data and a more efficient use of exploration dollars. This paper gives a short overview of SGDrape, and presents a number of case histories of modifications to survey plans based on the analysis of the pre-planned drape surface. SYSTEM OVERVIEW A detailed description of the history, setup and performance of SGL’s navigation and drape flying system is contained in reference [1]. SGDrape consists of five components:
• a flyable surface derived from a digital terrain model modified to reflect the flying capabilities of the survey aircraft;
• a digital version of the planned flight lines;
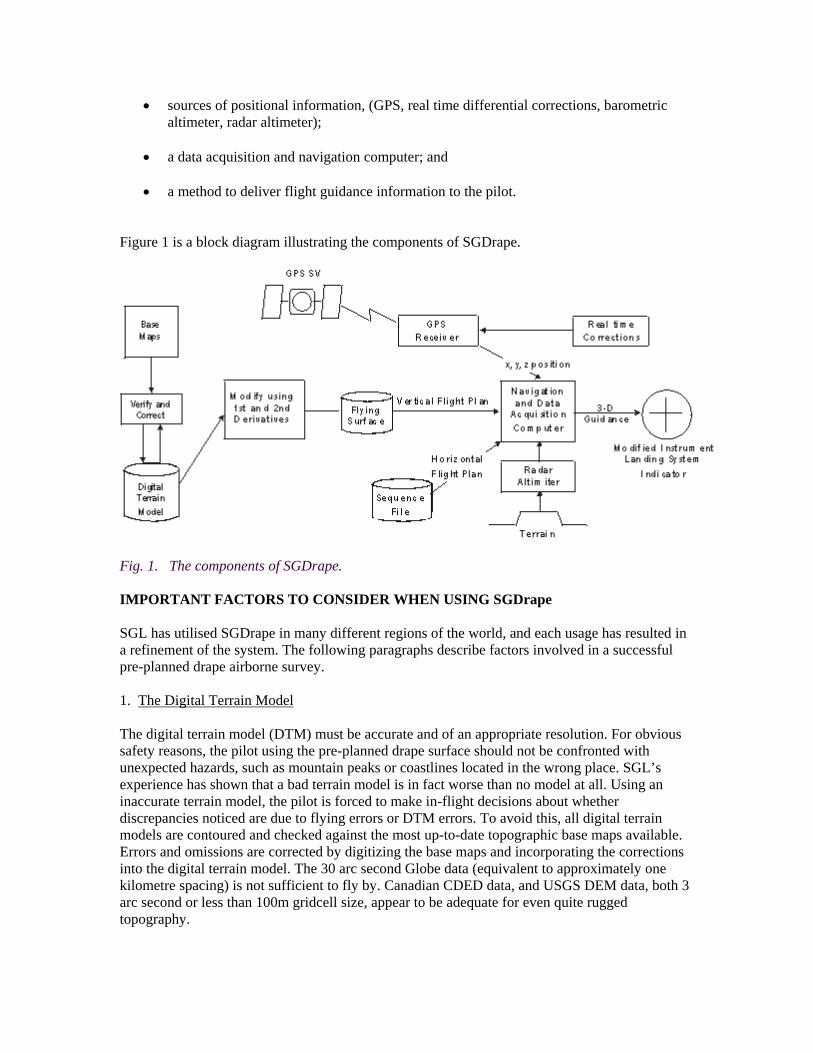
• sources of positional information, (GPS, real time differential corrections, barometric altimeter, radar altimeter);
• a data acquisition and navigation computer; and
• a method to deliver flight guidance information to the pilot. Figure 1 is a block diagram illustrating the components of SGDrape.
Fig. 1. The components of SGDrape. IMPORTANT FACTORS TO CONSIDER WHEN USING SGDrape SGL has utilised SGDrape in many different regions of the world, and each usage has resulted in a refinement of the system. The following paragraphs describe factors involved in a successful pre-planned drape airborne survey. 1. The Digital Terrain Model The digital terrain model (DTM) must be accurate and of an appropriate resolution. For obvious safety reasons, the pilot using the pre-planned drape surface should not be confronted with unexpected hazards, such as mountain peaks or coastlines located in the wrong place. SGL’s experience has shown that a bad terrain model is in fact worse than no model at all. Using an inaccurate terrain model, the pilot is forced to make in-flight decisions about whether discrepancies noticed are due to flying errors or DTM errors. To avoid this, all digital terrain models are contoured and checked against the most up-to-date topographic base maps available. Errors and omissions are corrected by digitizing the base maps and incorporating the corrections into the digital terrain model. The 30 arc second Globe data (equivalent to approximately one kilometre spacing) is not sufficient to fly by. Canadian CDED data, and USGS DEM data, both 3 arc second or less than 100m gridcell size, appear to be adequate for even quite rugged topography.

2. Trimming the Digital Terrain Model At survey speed aircraft will cover between 5 and 10 kilometres outside the survey area in a turn. For safety reasons, the flying surface should include a ten kilometre extension outside the survey area. It may be important, however, to exclude terrain outside of this extension so that large mountains that are outside the survey and extension area will not affect the flying surface. 3. Creation of the Drape Surface The digital terrain model is modified twice; once using a first derivative threshold to ensure that the maximum acceptable climb/descent slope is not exceeded, and then using a second derivative threshold to eliminate sudden transitions from climb to descent or vice versa. SGDrape allows for different maximum slope parameters for traverse lines and for control lines. It is important to take into account the capabilities of the specific aircraft at the altitude and temperature at which the survey will be flown. SGL’s drape surface creation program allows the maximum first derivative to vary with altitude. This has proved to be particularly important for surveys in coastal mountain regions, where flying altitude can vary from 0 to 15,000 ft ASL. Figures 2 and 3 contain summaries of climb/descent capabilities for SGL’s aircraft. Note that although the directions of control lines and traverse lines are specified, the actual locations of the lines are not. In effect, the aircraft will be capable of flying the surface anywhere in either direction along the traverse or control lines. This is considered a safety feature, in that an aircraft that is offline will still be given the proper navigational guidance.
Maximum Climb/descent Gradient Capability (m/km) vs Density Altitude Aircraft Type Sea Level 5000 ft 10,000 ft 15,000 ft 20,000 ft
Cessna 208B 62 52 41 35 21
Cessna 404 39 37 34 30 22
Fig. 2. Sustained climb/descent capability at different altitudes.
Typical Geophysical Aircraft Type
Climb Rate m/km (ft/nm)
Descent Rate m/km (ft/nm)
Cessna 404 76 (460) 39 (240)
Cessna 402 with STOL kit 68 (415) 37 (225)
Beechcraft Queenair 58 (350) 37 (225)
BN Islander 115 (700) 74 (450)
Cessna Grand Caravan 99 (600) 62 (375)
Eurocopter ASTAR 247 (1500) 165 (1000)
Fig. 3. Climb/descent capabilities at sea level, 15ºC.

4. Navigational Guidance System The accuracy of single receiver (non-differential) GPS is not adequate to provide vertical flight guidance for a pre-planned computer aided drape survey. Commercial systems such as OmniStar(TM) and Landstar(TM) now provide real time DGPS corrections over much of the world. They can be used to supply navigational data to the aircraft with better than 10 m accuracy vertically and 5 m horizontally. For areas not covered by satellite transmitted real time corrections, the Russian satellite navigation system Glonass is an option. Glonass is not affected by Selective Availability, the deliberate degradation of the GPS positions. SGL’s experience using the Glonass system has shown that vertical data can contain errors of about 30 m, which is considered borderline for vertical guidance. Other options include Coast Guard radio beacons for coastal areas, or a private link using radios and modems. For surveys with wide line spacing, single receiver GPS for horizontal guidance and a barometric altimeter for vertical guidance may be adequate if no other options are available.
Fig. 4a. Asia Project - Terrain data
Fig. 4b. Asia Project - Difference between terrain and the flying surface

Fig. 4c. Asia Project - Terrain data showing inset areas
Fig 4d. Asisa Project - Difference between terrain and the flying surface (inset area only)
Fig. 4e. Asia Project - Difference between the two flying surfaces over inset area
5. Error Handling Capability SGDrape monitors the radar altimeter, checking if the current reading is less than a specified threshold. When that occurs, the system reverts to radar altimeter mode in which the pilot is given vertical guidance (a fly-up command) based on radar altimeter height above ground. This situation occurs due to errors in the flying surface model, errors in the computed aircraft height, or pilot error. SGDrape software ensures that the transition from the standard SGDrape guidance mode to radar mode and vice versa is accomplished in a smooth manner. CASE STUDIES 1. South American Coastal Mountains The survey area consisted of a rectangular block parallel to the coast line. The topography was essentially planar sloping up from the coast to 12,000 ft. above sea level in approximately 70 kilometres. Traverse lines were flown parallel to the coast, and control lines planned perpendicular to the traverse lines. The slope of the terrain was steeper than the airplane could climb. To reach the highest areas of the survey in the control line direction, (ie flying directly up the slope), the flying surface had to be raised by 1,500 metres at the lowest point, the coast line. Flying the traverse lines would not affect the flying surface much because they ran perpendicular to the slope. Unfortunately, in order to intersect the control lines at the same height above ground, the traverse lines were also being forced up by 1,500 m along the coast. One solution suggested was to fly all the control lines in one direction only - up the slope. This would be advantageous because the maximum climb angle of piston engine aircraft is generally greater than the maximum descent angle. However, it would have been logistically difficult and would have substantially increased the number of kilometres required to complete the survey. The solution chosen was to fly the control lines at 45° to the traverse lines. Although this increased the number of kilometres flown, it lowered the flying surface by 1,000 metres to a much more acceptable 500 meres above sea level at the coast. 2. Asia For this project, the client was very concerned about flying as close to the ground as safely possible. The irregularly shaped survey area was centred within a steep valley. The main regions of interest were the contacts between the hills and the valley floor. The initial flying surface produced was unacceptable due to the fact that the surface was 600 metres above the ground over the client’s areas of interest. Figures 4a and 4b are plots of the terrain and the difference between the terrain and the flying surface for the survey area. The solution was to prepare two flying surfaces, one for the whole survey area, and one for an inset area which excluded the hills and covered only the valley floor. The difference in flying height between the two surfaces over the regions of interest was in the range of 500 metres. Figures 4c and 4d show the terrain covered by the inset area and the difference between the terrain and the flying surface created for the inset area only. Figure 4e shows the improvement in terrain clearance using the flying surface created for the inset area only. The area covered by the inset area surface was flown twice, once using each flying surface. This resulted in an inset area data set flown at the lowest possible clearance and a regional survey consisting of a complete data set for the entire survey area.
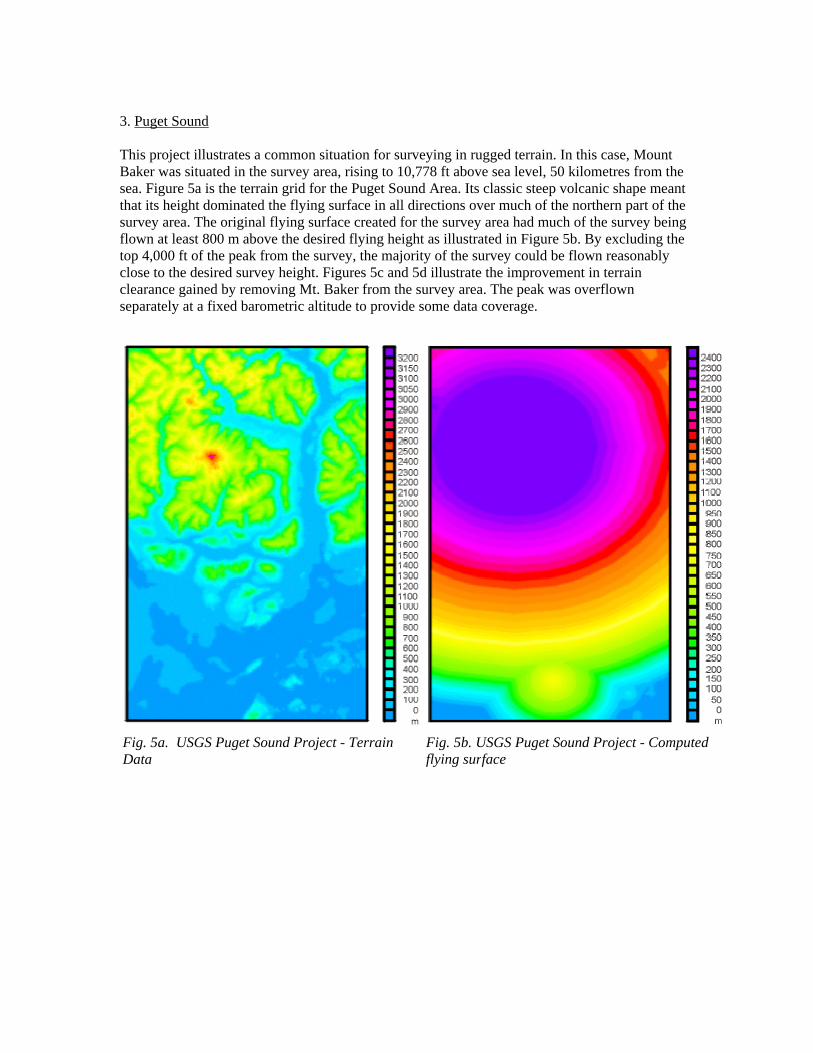
3. Puget Sound This project illustrates a common situation for surveying in rugged terrain. In this case, Mount Baker was situated in the survey area, rising to 10,778 ft above sea level, 50 kilometres from the sea. Figure 5a is the terrain grid for the Puget Sound Area. Its classic steep volcanic shape meant that its height dominated the flying surface in all directions over much of the northern part of the survey area. The original flying surface created for the survey area had much of the survey being flown at least 800 m above the desired flying height as illustrated in Figure 5b. By excluding the top 4,000 ft of the peak from the survey, the majority of the survey could be flown reasonably close to the desired survey height. Figures 5c and 5d illustrate the improvement in terrain clearance gained by removing Mt. Baker from the survey area. The peak was overflown separately at a fixed barometric altitude to provide some data coverage.
Fig. 5a. USGS Puget Sound Project - Terrain Data
Fig. 5b. USGS Puget Sound Project - Computed flying surface

Fig. 5c. USGS Puget Sound Project - Computed flying surface with peak of Mt. Baker removed
Fig. 5d. USGS Puget Sound Project - Difference between flying surfaces with and without Mt. Baker
4. Spectrometer Survey in South American Andes The client had requested a combined spectrometer/magnetometer survey over very rugged terrain. The primary data set was the spectrometer data. It was decided to relax the requirement for control line and traverse line intersections to be flown at the same height. The control lines were not to be used for the spectrometer data. The flying surface was created with an infinite maximum gradient in the control line direction and control lines were flown without the use of the SGDrape system. The resulting flying surface was optimum for minimum ground clearance, but inconsistent in adjacent line heights - not a great solution for a magnetometer survey, but a good compromise for the spectrometer data quality. CONCLUSIONS SGDrape has proven to be a useful survey flying tool resulting in more accurately flown data sets and safer survey flying operations. Care must be taken when designing the flying surface to ensure a reasonable and accurate surface will be created and that the pilots are given the proper navigational guidance. The act of pre-planning the flying surface provides an opportunity to evaluate the survey flight plan in relation to the topography in the survey area and to quantify the predicted flying heights in different regions of the survey area. Several approaches were described in this paper to optimize the data acquisition plan for different projects performed by SGL in different regions of the world.

REFERENCES J. Bryant, B. Coffin, S. Ferguson, M. Imray: Horizontal and Vertical Guidance for Airborne Geophysics: Canadian Aeronautics and Space Journal, Vol. 43, No. 2, June 1997, 126 - 134.