precious metals
DESCRIPTION
precious metals explanationTRANSCRIPT

Can Precious Metals Make Your Portfolio Shine?
C. Mitchell Conover, Ph.D., CFA Associate Professor of Finance The Robins School of Business
University of Richmond Richmond, VA 23173
(804) 287-1921 [email protected]
Gerald R. Jensen, Ph.D., CFA Professor of Finance
Northern Illinois University DeKalb, IL 60115 (815) 753-6399 [email protected]
Robert R. Johnson, Ph.D., CFA Deputy Chief Executive Officer & Managing Director, Education Division
CFA Institute 560 Ray C. Hunt Drive
Charlottesville, VA 22903 (434) 951-5255
Jeffrey M. Mercer, Ph.D.
Associate Professor of Finance Rawls College of Business
Texas Tech University Lubbock, TX 79409
(806) 742-3365 [email protected]
November 2007

1
Can Precious Metals Make Your Portfolio Shine?
Abstract
We extend earlier studies and present new evidence on the benefits of adding precious metals
to U.S. equity portfolios. We report five major findings related to the potential benefits of
investing in precious metals either directly via the commodity or indirectly via equities. First,
we find that adding a 25% allocation to the equities of precious metals firms improves portfolio
performance substantially. Second, our evidence indicates that an indirect investment
dominates a direct investment in precious metals. Third, relative to platinum and silver, gold
has better stand-alone performance and appears to provide a better hedge against the negative
effects of inflationary pressures. Fourth, the benefits of precious metals are strongly tied to
monetary conditions. Finally, while the benefits of adding precious metals to an investment
portfolio varied somewhat over time, they prevailed throughout much of the 34-year period.
Overall, our evidence suggests that investors could improve portfolio performance considerably
by adding a significant exposure to the equities of precious metals firms.

2
Can Precious Metals Make Your Portfolio Shine?
Numerous studies have explored the investment benefits of adding precious metals to
portfolios of U.S. equities, and many find that positive allocations improve overall performance
(e.g., Jaffe [1989] and Chua et al. [1990]). The benefits are typically ascribed to precious
metals’ low return correlation with U.S. equities and the natural hedge they provide against
inflation. The “flight to safety” phenomenon during equity market downturns is also well
known, and the ability of precious metals to provide protection against this phenomenon is well
documented. However, other studies find that the benefits have at times been small or
nonexistent (e.g., Johnson and Soenen [1997]).
A recent study by Hillier, Draper and Faff [2006] further develops the research on
precious metals. Hiller et al. examine the relative benefits of supplementing an investment in
the S&P 500 with gold, silver or platinum over the period 1976 to 2004. The authors find that
portfolio performance generally improves regardless of which precious metal is added. Gold
offers the greatest incremental benefit, while silver offers the least benefit. Additionally, the
authors find evidence refuting the merits of using tactical allocation as the basis of a precious
metals investment, as they find a switching strategy based on market volatility is dominated by
a buy-and-hold position in precious metals. While Hiller et al. and others provide many
insights as to the benefits of adding precious metals to U.S. equity portfolios; this study extends
the literature along several important dimensions.
First, it is unclear how the benefits of a direct investment in precious metals (i.e.,
purchasing the commodities themselves) compare to the benefits of investing indirectly in the
metals via the equities of precious metals companies. It is obvious that a direct investment in

3
the commodities (e.g. purchasing gold bullion) represents a pure-play on the price of the
commodity. On the other hand, Tufano [1998] finds that for North American gold mining
companies, the exposure of a firm’s equity price to the price of gold varies substantially over
time and across firms, with the company’s leverage playing an important role. Thus, we
compare and contrast the benefits of direct and indirect investments in gold, silver, and
platinum, along with combinations of these three metals.1
As a second extension to the literature, we examine whether the benefits of precious
metals are consistent through time, and whether there are patterns in the benefits that are tied to
Federal Reserve monetary policy. It is well known that a primary policy objective of the
Federal Reserve is long-run price stability. Since periods of monetary tightening tend to
coincide with increases in expected or actual inflation, and since precious metals typically
provide a hedge against inflation, we are left with the implication that the benefits might vary
with the Fed’s policy stance. Evidence of these policy-related patterns exists for broader
commodity classes, but not precious metals alone.2 Evidence also shows that returns to U.S.
equities are significantly lower during periods of Fed tightening relative to periods of Fed
easing, suggesting that the flight-to-safety benefits during market downturns might be more
observable during periods of tightening.3 Thus, we examine whether, and to what extent, the
benefits of precious metals vary with changes in the Federal Reserve’s monetary policy stance.
As a third extension to the literature, we investigate whether an ex ante indicator of
changes in the Federal Reserve’s broad monetary policy stance can be used to improve precious
metal allocation strategies ex ante. Jensen, Mercer and Johnson [1996] suggest that a change in
1 Hiller et al. provide a lucid discussion of the insights gained by studying these three metals. Briefly, they note that silver and gold are the traditional “investments of last resort,” while platinum is a precious metal used for industrial purposes. Examining these three metals allows us to compare our results with theirs. 2 See Jensen, Johnson and Mercer [2000, 2002]. 3 See Conover, Jensen, Johnson and Mercer [2005, 2007].

4
the Fed discount rate that is in the opposite direction of the prior change (i.e., a decrease
following an increase, or vice versa) can be used as a policy signal to broadly define overall
Fed policy intentions. A period of “expansive” policy coincides with the Fed lowering the
discount rate, while a “restrictive” policy occurs during a period when the Fed is increasing
rates. Jensen, Mercer and Johnson find strong support for the effectiveness of this approach as
they show that monetary aggregates and various measures of economic and banking activity are
significantly different across periods of expansive-versus-restrictive policy. An important
advantage of dichotomizing the Fed’s broad policy stance in this manner is that changes in the
Fed’s policy stance are readily identifiable. For example, the change in the Fed discount rate
that occurred on September 18, 2007 received considerable media attention and was widely
publicized in the financial press. We measure returns subsequent to shifts in Fed policy to
examine the efficacy of tactical and strategic allocation strategies that do not suffer from look-
ahead bias (i.e., these strategies could have been implemented in real time).
We offer a fourth extension to the literature by examining the benefits of adding varying
degrees of precious metals exposure to a portfolio. Specifically, we examine three alternative
precious metals’ exposures ranging from minimal (5%) to prominent (25%). The three
weightings reflect reasonable allocations and provide investors with insight regarding the
benefits associated with varying their allocation aggressiveness. It is unlikely that equity fund
managers would allocate more than 25% of their equity portfolio to precious metals, or any
other single alternative investment; therefore the largest allocation considered is 25% even
though research suggests a heavier allocation may be more advantageous (see Hillier et al.).
Finally, we examine the temporal consistency of the benefits over a lengthy, and
current, time period (1973 through 2006). Thus, we provide evidence that indicates the

5
robustness of the relationship over time. Before establishing a significant exposure to any asset
class, investors should consider whether the investment benefits associated with the security are
isolated to a particular time period.
Our main findings from the 34-year study period support the following claims:
1) For a U.S. equity investor, portfolio performance improves substantially when a
prominent portion of the portfolio is re-allocated to the equities of precious metals firms.
Allocating 25% of the portfolio to precious metals equities increases annual returns by 1.65%
and reduces the portfolio’s standard deviation by 1.86%. Smaller allocations to precious metals
improve portfolio performance, but to a lesser degree.
2) The investment benefits are considerably larger if the exposure to precious metals is
obtained indirectly via an investment in the equities of precious metals firms, rather than
directly by purchasing the precious metal as a commodity (e.g. gold bullion).
3) During periods of Federal Reserve tightening, the returns to precious metals
commodities are significantly higher than they are during expansive policy periods. This result
is in stark contrast to the U.S. equity market and the equities of precious metals companies.
4) Both direct and indirect investments in precious metals provide significant return and
risk benefits to U.S. equity portfolios during periods of Fed tightening, which represent 45% of
the sample period. In contrast, neither direct, nor indirect investments in precious metals
provide benefits of much consequence when the Fed is easing.
5) Strategic and tactical allocations to precious metals provide similar return and risk
improvement; however, we find limited evidence suggesting an incremental benefit to using
monetary policy shifts to guide tactical allocations. Importantly, virtually the entire benefit of
both approaches accrues during periods of restrictive monetary policy. There appears to be very

6
little benefit of positively weighting precious metals when the Fed is in an expansive policy
stance. In contrast, the benefits of allocating assets to precious metals are substantial during
periods of Fed tightening.
DATA
We examine daily returns for the U.S. equity market and six alternative precious metals
indices from January 17, 1973 through December 2006.4 The data for all indices are obtained
from Datastream International. The first two metals indices represent indirect investments in
precious metals (purchasing the equity of precious metals firms), and the other four indices
represent direct investments in the metals (purchasing the commodities).
The first index, labeled Precious Metals Equities, is the equally-weighted average of the
total return to the equities of global firms in the gold, silver and platinum sectors. The second
index, labeled Gold Equities, is the total return to equities in the global gold mining sector.5
The third index, labeled Precious Metal Commodities, is the equally weighted average total
return on gold, silver, and platinum. The fourth, fifth, and sixth indices are the (commodity)
returns on gold, silver, and platinum, and are labeled Gold, Silver, and Platinum, respectively.
The returns for the three individual metals are derived from the London gold bullion price in
U.S. dollars per troy ounce, the London Bullion Market silver price in U.S. cents per troy
ounce, and the London Free Market platinum price in U.S. dollars per troy ounce. Data for
4 The sample start date is chosen to correspond with the initiation of a restrictive Fed policy stance. 5 Separate indices are available for each of the precious metal commodities, whereas Datastream presents a unique index only for gold mining equities. Datastream combines the other precious metals equities (platinum and silver) into a single index.

7
Platinum starts in January 1976, and data for Gold is weekly until August 1976, after which it
is daily.6
EMPIRICAL RESULTS
Exhibit 1 presents performance data for the U.S. equity market and the six alternative
precious metals investments over the 34-year study period. The coefficient of variation
indicates that on a stand-alone basis, the U.S. equity market dominated the precious metals
investments during this period. Furthermore, an indirect exposure to precious metals in the
form of precious metals equities dominated a direct exposure on a stand-alone basis.7 Both of
these observations are consistent with expectations. The sub-par, stand-alone performance of
precious metals, relative to the equity market average, is consistent with their below average
systematic risk and above average unsystematic risk. This finding supports the widely
acknowledged view that the benefits of precious metals derives from their diversification
potential, rather than their attractive returns. The superior performance of precious metals
equities, relative to precious metal commodities, is explained by the fact that a commodity
investment gains only if the commodity increases in value, while equity appreciates based on
the firm’s operations. For example, an investment in the equity of a gold mining company may
appreciate even if gold prices remain flat because the mining company earns a profit from
mining and selling the gold ore.
The low correlations between the precious metals indices and U.S. Equities support
metals’ favorable diversification properties. The precious metals equity indices have higher
6 The results for the equally weighted precious metal commodities index (Precious Metal Commodities) from 1973 to 1976 reflects that of silver and gold. After 1976, it reflects the performance of platinum, silver, and gold. 7 We note that the geometric mean return for the Precious Metal Commodities index is higher than the return to each of its three constituents. This result is consistent with the “diversification return” identified by Erb and Harvey [2006].

8
correlations with U.S. Equities than the correlations between the precious metal commodities
and U.S. Equities. Gold bullion (Gold) has an especially low correlation with U.S. Equities,
-0.03. Further, relative to the other precious metals, it has superior stand-alone characteristics.
Hillier, Draper and Faff [2006] also find evidence supporting the investment superiority of gold
relative to platinum and silver. It should be noted that relative to silver and platinum, gold is
unique because a much greater proportion of its demand is derived from non-industrial uses.
Thus, it is not surprising to find that gold’s investment characteristics differ from the other two
precious metals.
Exhibit 2 considers the benefits of adding precious metals to a U.S. equity market
portfolio.8 For conciseness, we present only three of the six forms of precious metals exposure
that were reported in Exhibit 1. The three are selected based on their relatively attractive
investment features. The Precious Metals Equities index, with a coefficient of variation of 1.76,
offers the best stand-alone performance of the precious metals exposures. Gold has the lowest
correlation with U.S. Equities (-0.03) and has been the asset most frequently advocated as a
safe-haven during periods of market turmoil. The Precious Metal Commodities index has a
very low correlation with U.S. Equities (-0.01) and has relatively strong stand-alone
performance. The results with the other precious metals indices are similar to those reported,
but generally show less incremental benefit.
We consider three alternative precious metals allocations ranging from a relatively
small exposure of 5% (Panel A) to a prominent exposure of 25% (Panel C). Interestingly, in
spite of the poor stand-alone performance of precious metals, a substantial improvement in
portfolio performance, as indicated by the coefficient of variation, occurs in each case.
8 Precious metals equities are a component of the U.S. equity market index (U.S. Equities). The percentage is very small, however, because the majority of precious metals firms are foreign.

9
Consistent with the findings in Exhibit 1, investing in the equities of precious metals companies
is more beneficial than investing directly in the precious metals. The data indicates that the best
performance is achieved by supplementing U.S. Equities with a prominent exposure to
Precious Metals Equities as the risk per unit of return falls 24% (from 1.42 to 1.08). In
contrast, the smallest improvement is achieved by allocating 5% of the portfolio to Gold, for
which the coefficient of variation falls from 1.42 to 1.35. Also, consistent with expectations,
our findings indicate that much of the benefit achieved from the precious metals investments
accrues from risk reduction.
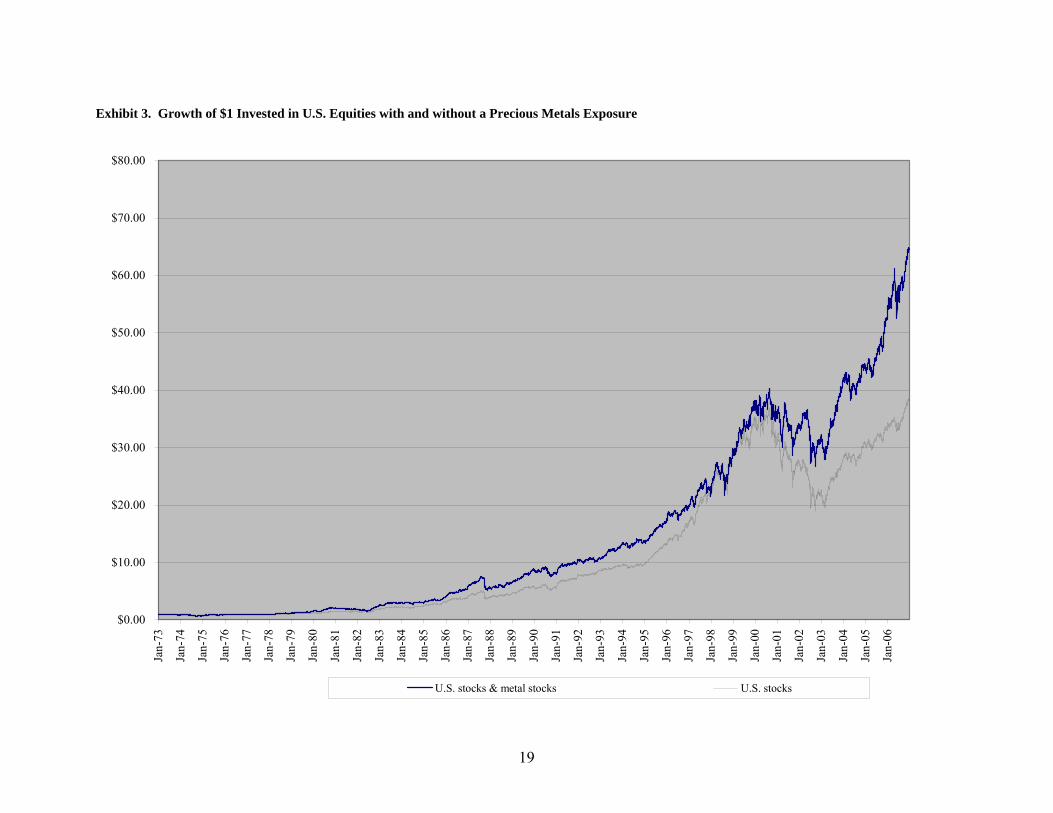
Exhibit 3 plots the cumulative returns associated with a 100% investment in U.S.
Equities versus a portfolio with 75% allocated to U.S. Equities and 25% allocated to Precious
Metals Equities. The plots help us to assess the temporal consistency of performance and the
cumulative benefits of adding a precious metals exposure to an equity portfolio. The plot shows
that the value of the diversified portfolio never drops significantly below the value of the U.S.
equity portfolio throughout the 34-year study period. The ending values on the far right of the
graph indicate that $1 invested in U.S. Equities would have grown to $38; while $1 invested in
the portfolio of 75% U.S. Equities and 25% Precious Metals Equities would have grown to
$65. During the strong bull market in equities during the late 1990’s, the precious metals
exposure appeared to be a detriment to portfolio performance. In the subsequent years,
however, the precious metals exposure was tremendously beneficial. In addition, the plots
indicate that the precious metals exposure proved to be quite attractive during the 1980’s and
early 1990’s.
Overall, Exhibit 3 indicates that the benefits of including a precious metals exposure in
an equity portfolio were not limited to a brief period of time, but instead prevailed throughout

10
much of the study period. The benefits have been somewhat inconsistent however, which may
explain the difference of opinion regarding precious metals as an investment vehicle. For
example, a study that focused on the 1995 to 2000 period would conclude that supplementing a
portfolio with precious metals harms portfolio performance, while a study emphasizing the
post-2000 period would find that precious metals were tremendously beneficial.9
TACTICAL ALLOCATION
We next explore whether there are patterns in the benefits of precious metals that are
tied to Federal Reserve monetary policy. We follow Jensen, Mercer and Johnson [1996] in
choosing opposite-direction changes in the Fed discount rate (turning points in the discount
rate) as our indicator of a broad shift in the Fed’s monetary policy stance.10 While there have
been over 120 changes in the discount rate during the study period, only 14 of them have been
in the opposite direction of the prior change (turning points). Thus, using this policy signal, the
Fed has switched from an expansive policy stance to a restrictive policy stance (or vice versa)
only 14 times in the last 34 years. Over the sample period then, there are seven expansive and
eight restrictive policy phases of the monetary cycle. The average duration of expansive policy
phases is approximately 32 months, and the average duration of restrictive policy phases is
approximately 23 months. Approximately 55% of the return observations are in periods of
expansive policy, and 45% are in periods of restrictive policy.
9 See Johnson and Soenen [1997] for evidence along this theme. 10 We rely on changes in the Fed discount rate rather than changes in the Fed’s federal funds rate target because the Fed discount rate has been a consistent tool of monetary policy throughout our sample period, while the Fed has targeted the federal funds rate only intermittently during the sample period. Furthermore, as noted by Thornton [1998] and Jensen and Mercer [2006] discount rate turning points and federal funds rate turning points align fairly closely.

11
The days and times of turning-point rate changes are identified through Wall Street
Journal articles announcing the change. A two-day announcement period includes the first day
the market can trade on an announcement and the following day.11 When evaluating the returns
across periods of expansive-versus-restrictive policy, the announcement period return is
omitted. This ensures that the analysis omits the announcement effects of directional changes
and focuses on the long-term relationship between the monetary environment and equity
returns.
In introducing monetary conditions to the analysis, it is important to note that we are not
attempting to determine whether a causal relationship exists between monetary conditions and
precious metals returns. As noted, by Conover, Jensen, Johnson and Mercer [2007], monetary
conditions may help to guide tactical shifts in portfolio allocation; however, due to the
interdependent nature of business and monetary conditions it is impossible to say that return
patterns are caused by changes in monetary conditions. Clearly, adjustments in Fed policy
occur in response to developments in the financial markets, but Fed policy also impacts the
financial markets. Thus, as with any rotation indicator, a Fed policy shift may serve as an
effective timing signal to identify periods when particular securities generally prosper or
languish, even though it is clearly the case that the policy shift is not the only factor that affects
security returns.
Exhibit 4 reports the returns earned during periods of restrictive and expansive Fed
monetary policy. Consistent with previous evidence, U.S. equity returns are an economically
and statistically significant 12.39% higher during expansive policy periods relative to
11 A two-day period is appropriate because rate change announcements occasionally occur during trading, which may cause the reaction to spill into the next day. It should be noted that the effective date of a rate change occasionally differs from the announcement date; in which cases we use the announcement date.

12
restrictive periods.12 Precious Metals Equities and Gold Equities also report higher returns
during expansive monetary periods (differences of 4.81% and 5.70%, respectively), but the
return pattern is less pronounced and is not statistically significant. In contrast, the returns on
the precious metal commodities indices are higher during restrictive policy periods. At
13.04%, the return difference is especially pronounced for Gold. This evidence supports the
contention that precious metals, and particularly gold, have been an effective hedge against the
increasing inflationary concerns that tend to coincide with periods of restrictive Fed policy.
Interestingly, the evidence in Exhibit 2 suggests that equity in precious metals firms
provides the better vehicle for establishing a buy-and-hold exposure to precious metals,
whereas the evidence in Exhibit 4 suggests a direct exposure through the precious metal
commodities dominates in hedging the adverse market performance during periods of
restrictive policy. This difference likely results because a direct investment (through precious
metal commodities) represents a pure-play on the price of the commodity, whereas an
investment in precious metals equities is impacted by additional firm-specific factors. This
finding is consistent with Tufano [1998] who shows that considerable variation exists in the
relationship between gold prices and the returns to the equities of gold mining firms.
Exhibit 5 complements Exhibit 2 by evaluating monetary policy’s impact on a U.S.
equity portfolio with 5%, 15%, or 25% allocated to precious metals. Using the U.S. Equities
portfolio as the benchmark, it is clear that the benefits from metals are present primarily during
periods of restrictive monetary policy. Not only does the portfolio return increase regardless of
which of the three metals indices we use, the returns increase monotonically as the allocation
increases. Gold consistently provides the greatest benefit. During periods of expansive policy,
12 Consistent with previous evidence, the standard deviations are significantly lower during expansive policy periods for all of the indices. The standard deviation results are available from the authors upon request.

13
the portfolio’s return increases only when we add equity in precious metals companies, and the
return enhancements are relatively small.
Given the evidence in Exhibit 5, we next examine the efficacy of two asset allocation
approaches: (1) a strategic allocation of 75% in U.S. Equities and 25% in Precious Metals
Equities throughout the entire sample period, and (2) a tactical allocation of 75% in U.S.
Equities and 25% in Precious Metals Equities during expansive policy periods, and 75% in
U.S. Equities and 25% in Gold during restrictive policy periods.
To ensure that the tactical allocation strategy avoided any look-ahead bias and could be
practically implemented on an ex-ante basis, tactical allocation strategy returns were measured
starting two days after an announced policy change and continued until one day after the
subsequent policy change. This represents a conservative approach as it assumes investment
managers are unable to capture any announcement period reaction associated with the shift in
monetary policy.13 Most importantly, an investor would not have required future information
to know the timing of the reallocations in the tactical approach. This is a significant advantage
of the monetary policy indicator we use.
Exhibit 6 provides a comparison of the strategic and tactical allocation approaches,
against U.S. Equities as the “benchmark.” It is clear that the performance of the two
approaches is quite comparable, with the tactical approach providing a slightly higher annual
return and slightly lower standard deviation of return.14 The strategic and tactical allocation
portfolios both compare favorably to U.S. Equities, as returns for both portfolios are
significantly higher than the benchmark, and at the same time, a significant risk reduction is
13 The Federal Reserve has increasingly announced discount rate changes while the stock market is still open. In light of this, our approach is particularly conservative because investors could initiate an equity rotation on a timelier basis than we assume. 14 We exclude transactions costs from the analysis; however, given the very infrequent nature of Fed policy shifts (14 in 34 years), the costs of shifting 25% of the portfolio per policy shift would be very low.

14
accomplished. Remarkably, over the 34-year study period, a prominent strategic allocation in
precious metals yielded a value approximately 69% higher than the benchmark ($64.51 versus
$38.27). The tactical allocation performed even better yielding a value 87% higher ($71.65
versus $38.27).
To provide a temporal perspective for the data reported in Exhibit 6, Exhibit 7 plots the
cumulative values for the tactical and strategic allocation portfolios relative to the benchmark.
The plots further support the advantages obtained by supplementing an equity portfolio with a
precious metals exposure. In general, adding a precious metals exposure was favorable except
during the extreme bull market in equities that started in the mid-1990’s and ended in 2000.
The plot also serves to highlight the dominance of the tactical allocation portfolio as the
portfolio maintains a superior value throughout the entire study period. It is clear from Exhibit
7 that the investment benefits of precious metals have varied considerably over time, yet
investors should be heartened that the recent benefits of the strategies have been especially
prominent.
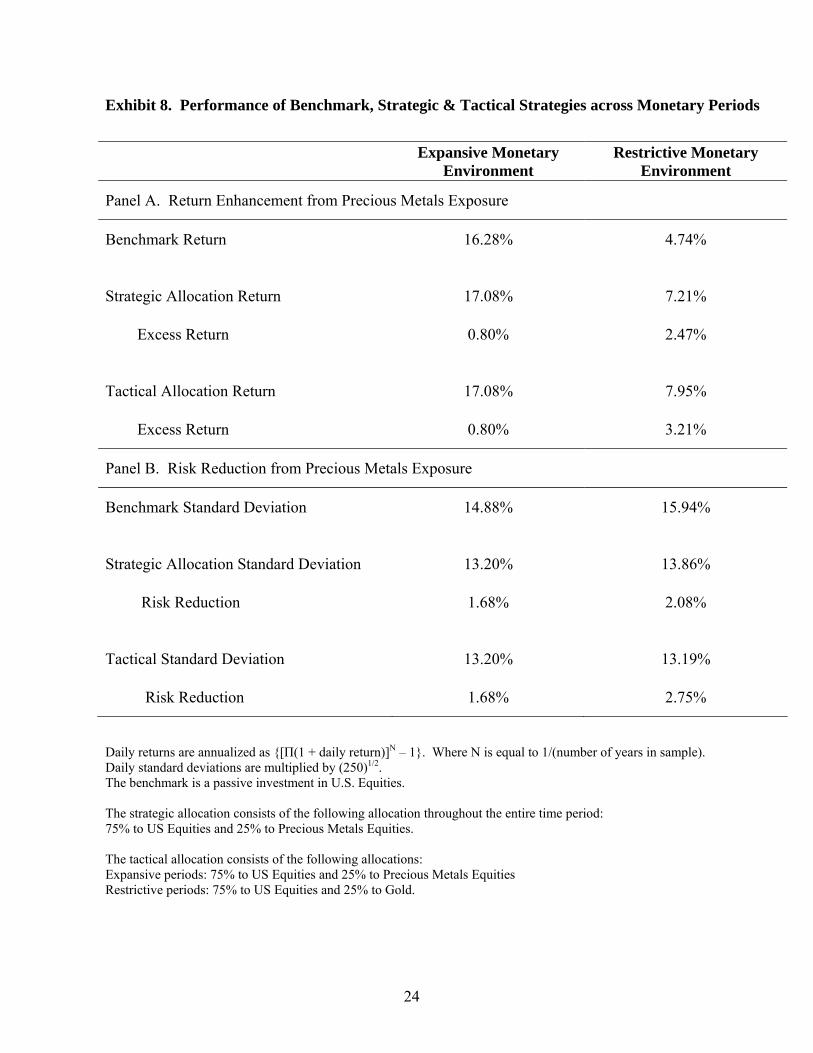
The plots in Exhibit 7 clarify the timing of the performance superiority of the allocation
strategies; however, what is not clear is how much of the benefit accrues during expansive
relative to restrictive monetary policy periods. Exhibit 8 addresses this issue by providing clear
evidence that the benefits of the strategic and tactical approaches come almost entirely in
restrictive policy periods. Since the strategic and tactical allocation portfolios have the same
composition during expansive policy periods, they will have the same risk and return
characteristics in expansive periods. The difference in performance between the two
approaches then has to result during restrictive periods. While the annual return to both
strategies in expansive policy periods is about 80 basis points higher than U.S. Equities (the

15
benchmark), the return difference in restrictive policy periods is 2.50% for the strategic
allocation portfolio and 3.21% for the tactical allocation portfolio. While both allocation
approaches have a standard deviation of return that is lower than the benchmark, the reduction
in risk (exceeding 2%) is considerably larger during restrictive policy periods. Furthermore,
the risk reduction is much more pronounced for the tactical allocation strategy relative to the
strategic portfolio (2.75% versus 2.08%).
SUMMARY AND CONCLUSIONS
We extend earlier studies and present new evidence on the benefits of adding precious
metals to U.S. equity portfolios. We report five major findings related to the potential benefits
of investing in precious metals either directly via the commodity or indirectly via equities.
First, we find that adding a 25% allocation to the equities of precious metals firms improves
portfolio performance substantially. Portfolio returns increase by 1.65% and the standard
deviation drops by 1.86%. While smaller allocations improve portfolio returns and risk, the
benefits are less prominent. Second, our evidence indicates that an indirect investment in
precious metals, via the equities of precious metals firms, dominates a direct investment in
precious metal commodities. Both direct and indirect investments improve portfolio
performance; however, the benefits of an indirect exposure are considerably larger. Third,
relative to platinum and silver, gold has better stand-alone performance and appears to provide
a better hedge against the negative effects of inflationary pressures. Fourth, the benefits of
precious metals are strongly tied to monetary conditions. The benefits of adding precious
metals to a portfolio are rather small during periods when Fed policy is expansive; however, the
benefits are substantial when monetary policy is restrictive. Finally, while the benefits of

16
adding precious metals to an investment portfolio varied somewhat over time, they prevailed
throughout much of the 34-year study period. Furthermore, the benefits have been quite
pronounced in recent years.
Overall, our evidence suggests that investors could improve portfolio performance
considerably by adding a significant exposure to the equities of precious metals firms. The
improvement can be attributed to the ability of precious metals to mollify the poor market
performance that tends to afflict many equities during periods when Fed policy is restrictive.
While a strategic allocation to precious metals equities captures most of the benefits; our results
suggest a tactical approach offers some additional benefits. Specifically, using monetary policy
shifts to guide investment in precious metals, and particularly gold bullion, achieved slightly
higher return and lower risk than that achieved with a strategic allocation.

17
Exhibit 1. Returns and Risk for U.S. Equities, Precious Metal Equities, and Precious Metals, 1973 through 2006
Indirect Exposure/Equities Direct Exposure/Commodities
US Equities
Precious Metal
Equities Gold
Equities
Precious Metals
Commodities Gold Silver Platinum
Annualized Return 10.83% 14.11% 11.22% 8.33% 6.64% 5.39% 6.51%
Standard Deviation 15.37% 24.81% 26.79% 23.11% 20.90% 36.69% 25.99%
Coefficient of Variation 1.42 1.76 2.39 2.77 3.15 6.81 3.99 Correlation with U.S. Equities 1.00 0.08 0.05 -0.01 -0.03 -0.01 0.01
Note: Daily returns are annualized as {[Π(1 + daily return)]N – 1}. Where N is equal to 1/(number of years in sample). Daily standard deviations are multiplied by (250)1/2.

18
Exhibit 2. Performance of Portfolios with and without Precious Metals Exposure
Portfolio Annualized Return Standard Deviation Coefficient of Variation
U.S. Equities 10.83% 15.37% 1.42
Panel A: Performance for allocations of 5% to alternative portfolio
U.S. Equities + Precious Metals Equities 11.21% 14.75% 1.32
U.S. Equities + Precious Metal Commodities 10.91% 14.63% 1.34
U.S. Equities + Gold 10.80% 14.61% 1.35
Panel B: Performance for allocations of 15% to alternative portfolio
U.S. Equities + Precious Metals Equities 11.88% 13.86% 1.17
U.S. Equities + Precious Metal Commodities 11.01% 13.47% 1.22
U.S. Equities + Gold 10.68% 13.34% 1.25
Panel C: Performance for allocations of 25% to alternative portfolio
U.S. Equities + Precious Metals Equities 12.48% 13.51% 1.08
U.S. Equities + Precious Metal Commodities 11.01% 12.82% 1.16
U.S. Equities + Gold 10.48% 12.52% 1.19
Note: Daily returns are annualized as {[Π(1 + daily return)]N – 1}. Where N is equal to 1/(number of years in sample).
19
Exhibit 3. Growth of $1 Invested in U.S. Equities with and without a Precious Metals Exposure
$0.00
$10.00
$20.00
$30.00
$40.00
$50.00
$60.00
$70.00
$80.00Ja
n-73
Jan-
74
Jan-
75
Jan-
76
Jan-
77
Jan-
78
Jan-
79
Jan-
80
Jan-
81
Jan-
82
Jan-
83
Jan-
84
Jan-
85
Jan-
86
Jan-
87
Jan-
88
Jan-
89
Jan-
90
Jan-
91
Jan-
92
Jan-
93
Jan-
94
Jan-
95
Jan-
96
Jan-
97
Jan-
98
Jan-
99
Jan-
00
Jan-
01
Jan-
02
Jan-
03
Jan-
04
Jan-
05
Jan-
06
U.S. stocks & metal stocks U.S. stocks

20
Exhibit 4. Asset Returns by Monetary Environment
Asset Class Restrictive Period Annualized Return
Expansive Period Annualized Return
Return Difference
U.S. Equities 3.87% 16.25% -12.39% (0.03)
Precious Metals Equities 11.60% 16.41% -4.81% (0.63)
Gold Equities 8.39% 14.09% -5.70% (0.57)
Precious Metal Commodities 13.29% 4.56% 8.73%
(0.24)
Gold 14.02% 0.98% 13.04% (0.06)
Silver 5.85% 5.38% 0.47% (0.82)
Platinum 9.62% 4.13% 5.49% (0.51)
Note: To avoid including the returns from announcement effects and focus on long-term returns, the returns do not include the two-day announcement period surrounding a change in Federal Reserve discount rate change that begin a new monetary environment. Daily returns are annualized as {[Π(1 + daily return)]N – 1}. Where N is equal to 1/(number of years in sample). P-values for the t-test of expansive period return ≥ restrictive period return are shown in parentheses below the return difference. T-tests are performed on the daily data, and where appropriate, are calculated assuming unequal variances.

21
Exhibit 5. Performance of Alternative Portfolios by Monetary Environment
Asset Restrictive Period Annualized Return
Expansive Period Annualized Return
Return Difference
U.S. Equities 3.87% 16.25% -12.39% (0.03)
Panel A: Performance for allocations of 5% to alternative portfolio
U.S. Equities + Precious Metals Equities 4.45% 16.47% -12.03%
(0.03)
U.S. Equities + Precious Metal Commodities 4.56% 15.81% -11.24%
(0.04)
U.S. Equities + Gold 4.57% 15.58% -11.01% (0.05)
Panel B: Performance for allocations of 15% to alternative portfolio
U.S. Equities + Precious Metals Equities 5.55% 16.84% -11.29%
(0.03)
U.S. Equities + Precious Metal Commodities 5.90% 14.86% -8.97%
(0.08)
U.S. Equities + Gold 5.93% 14.21% -8.27% (0.10)
Panel C: Performance for allocations of 25% to alternative portfolio
U.S. Equities + Precious Metals Equities 6.58% 17.12% -10.55%
(0.04)
U.S. Equities + Precious Metal Commodities 7.14% 13.86% -6.72%
(0.17)
U.S. Equities + Gold 7.21% 12.79% -5.57% (0.25)
Note: To avoid including the returns from announcement effects and focus on long-term returns, the returns do not include the two-day announcement period surrounding a change in Federal Reserve discount rate change that begin a new monetary environment. Daily returns are annualized as {[Π(1 + daily return)]N – 1}. Where N is equal to 1/(number of years in sample). P-values for the t-test of expansive period return ≥ restrictive period return are shown in parentheses below the return difference. T-tests are performed on the daily data, and where appropriate, are calculated assuming unequal variances.

22
Exhibit 6. Performance of Strategic and Tactical Strategies versus a Passive Benchmark
Optimal Strategic Allocation Optimal Tactical Allocation
Annualized Strategy Return 12.48% 12.81%
Annualized Benchmark Return 10.83% 10.83%
Difference in Annualized Returns 1.65% 1.98%
P-value 0.00 0.00
Strategy Standard Deviation 13.51% 13.20%
Benchmark Standard Deviation 15.37% 15.37%
Ratio of Standard Deviations 0.88 0.86
P-value 0.00 0.00
Ending Strategy value $64.51 $71.65
Ending Benchmark value $38.27 $38.27
Difference in values $26.24 $33.39
The benchmark is a passive investment in U.S. Equities. The strategic allocation consists of the following allocation throughout the entire time period: 75% to US Equities and 25% to Precious Metals Equities. The tactical allocation consists of the following allocations: Expansive periods: 75% to US Equities and 25% to Precious Metals Equities Restrictive periods: 75% to US Equities and 25% to Gold. Daily returns are annualized as {[Π(1 + daily return)]N – 1}. Where N is equal to 1/(number of years in sample). Daily standard deviations are multiplied by (250)1/2. P-values for the t-test of whether the mean of the daily difference in returns is equal to zero are shown below the return difference. P-values for the difference in variance (F-test) are shown below the ratio of standard deviations. F-tests are performed on the daily data. T-tests were calculated assuming unequal variances.

23
Exhibit 7. Growth of $1 Invested in Portfolios with Strategic and Tactical Allocations to Precious Metals
$0.00
$10.00
$20.00
$30.00
$40.00
$50.00
$60.00
$70.00
$80.00Ja
n-73
Jan-
74
Jan-
75
Jan-
76
Jan-
77
Jan-
78
Jan-
79
Jan-
80
Jan-
81
Jan-
82
Jan-
83
Jan-
84
Jan-
85
Jan-
86
Jan-
87
Jan-
88
Jan-
89
Jan-
90
Jan-
91
Jan-
92
Jan-
93
Jan-
94
Jan-
95
Jan-
96
Jan-
97
Jan-
98
Jan-
99
Jan-
00
Jan-
01
Jan-
02
Jan-
03
Jan-
04
Jan-
05
Jan-
06
Benchmark Strategic Allocation Tactical Allocation
24
Exhibit 8. Performance of Benchmark, Strategic & Tactical Strategies across Monetary Periods
Expansive Monetary Environment
Restrictive Monetary Environment
Panel A. Return Enhancement from Precious Metals Exposure
Benchmark Return 16.28% 4.74%
Strategic Allocation Return 17.08% 7.21%
Excess Return 0.80% 2.47%
Tactical Allocation Return 17.08% 7.95%
Excess Return 0.80% 3.21%
Panel B. Risk Reduction from Precious Metals Exposure
Benchmark Standard Deviation 14.88% 15.94%
Strategic Allocation Standard Deviation 13.20% 13.86%
Risk Reduction 1.68% 2.08%
Tactical Standard Deviation 13.20% 13.19%
Risk Reduction 1.68% 2.75%
Daily returns are annualized as {[Π(1 + daily return)]N – 1}. Where N is equal to 1/(number of years in sample). Daily standard deviations are multiplied by (250)1/2. The benchmark is a passive investment in U.S. Equities. The strategic allocation consists of the following allocation throughout the entire time period: 75% to US Equities and 25% to Precious Metals Equities. The tactical allocation consists of the following allocations: Expansive periods: 75% to US Equities and 25% to Precious Metals Equities Restrictive periods: 75% to US Equities and 25% to Gold.

25
References Chua, Jess H., Gordon Sick and Richard S. Woodward. “Diversifying with Gold Stocks.”
Financial Analysts Journal 46 (July/August 1990), pp. 76-79. Conover, C. Mitchell, Gerald R. Jensen, Robert R. Johnson and Jeffrey M. Mercer. “Is Fed
Policy Still Relevant for Investors?” Financial Analysts Journal 61 (January/February 2005), pp. 70-79.
Conover, C. Mitchell, Gerald R. Jensen, Robert R. Johnson and Jeffrey M. Mercer. “Sector
Rotation and Monetary Conditions.” Forthcoming Journal of Investing 2007. Erb, Claude B. and Campbell R. Harvey. “The Strategic and Tactical Value of Commodity
Futures.” Financial Analysts Journal 62 (March/April 2006), pp. 69-97. Hillier, David, Paul Draper and Robert Faff. “Do Precious Metals Shine? An Investment
Perspective.” Financial Analysts Journal 62 (March/April 2006), pp. 98-106. Jaffe, Jeffrey F. “Gold and Gold Stocks as Investments for Institutional Portfolios.” Financial
Analysts Journal 49 (March/April 1989), pp. 53-59. Jensen, Gerald R., Robert R. Johnson and Jeffrey M. Mercer. “Efficient Use of Commodity
Futures in Diversified Portfolios,” The Journal of Futures Markets 20 (May 2000), pp. 489-506.
Jensen, Gerald R., Robert R. Johnson and Jeffrey M. Mercer. “Tactical Asset Allocation and
Commodity Futures.” The Journal of Portfolio Management 28 (Summer 2002), pp. 100-111.
Jensen, Gerald, Jeffrey Mercer and Robert Johnson. “Business Conditions, Monetary Policy
and Expected Security Returns,” Journal of Financial Economics 40 (February 1996), pp. 213-38.
Jensen, Gerald, and Jeffrey Mercer. “Security Markets and the Information Content of
Monetary Policy Turning Points.” The Quarterly Review of Economics and Finance 46 (September 2006), pp. 477-494.
Johnson, Robert, and Luc Soenen. “Gold as an Investment Asset: Perspectives from Different
Countries.” Journal of Investing 6 (Fall 1997), pp. 94-99. Thornton, Daniel. “Tests of the Market’s Reaction to Federal Funds Rate Target Changes.”
Federal Reserve Bank of St. Louis Review 80 (November/December 1998), pp. 25-36. Tufano, Peter. “The Determinants of Stock Price Exposure: Financial Engineering and the
Gold Mining Industry.” Journal of Finance 53 (June 1998), pp. 1015-1052.