precipitation in connecticut - university of connecticut in connecticut david r. miller, ......
TRANSCRIPT

1
Precipitation In Connecticut
David R. Miller, Glenn S. Warner, Fred L. Ogden and Arthur T. DeGaetano
Contents Page Number
Introduction 2
Data Sets Used 2
Annual Precipitation 2
Seasonal Precipitation 3
Snowfall 3
Storms 3
Precipitation Extremes 4
Extreme Precipitation Regions in Connecticut 4
Computation of Return Periods 4
Spatial Distribution of Extreme Precipitation Events 5
Intensity-Duration-Frequency Curves 5
Area Reduction Curves 6
Seasonal Distribution of Extreme Precipitation Events 6
Intensity-Frequency of 15 Minute Precipitation 7
Droughts and Dry Days 7
Literature Cited 8
Tables 8
Figures 9

2
Introduction
This bulletin presents descriptions of the occurrence and distribution of precipitation in Con-necticut determined from analyses of long-term records at weather stations. Although the length ofrecords vary, a number of stations now have over 100 years of data. Authors of previous publicationsregarding precipitation in Connecticut typically used a 30 year period (or so called "normal" period)for their analyses. These publications include: Kirk (1939) who used data prior to 1939, Brumback(1965) who relied on measurements from the 1932-1961 period, and Hunter and Mead (1983) whoused the 1951-1980 period. The annual average in each of these publications varied due to the varia-tion in precipitation from one 30 year period to another. This variation can be seen in Figure 1 of thispublication, which shows annual precipitation amounts from 1885-1989.
Data Sets Used.
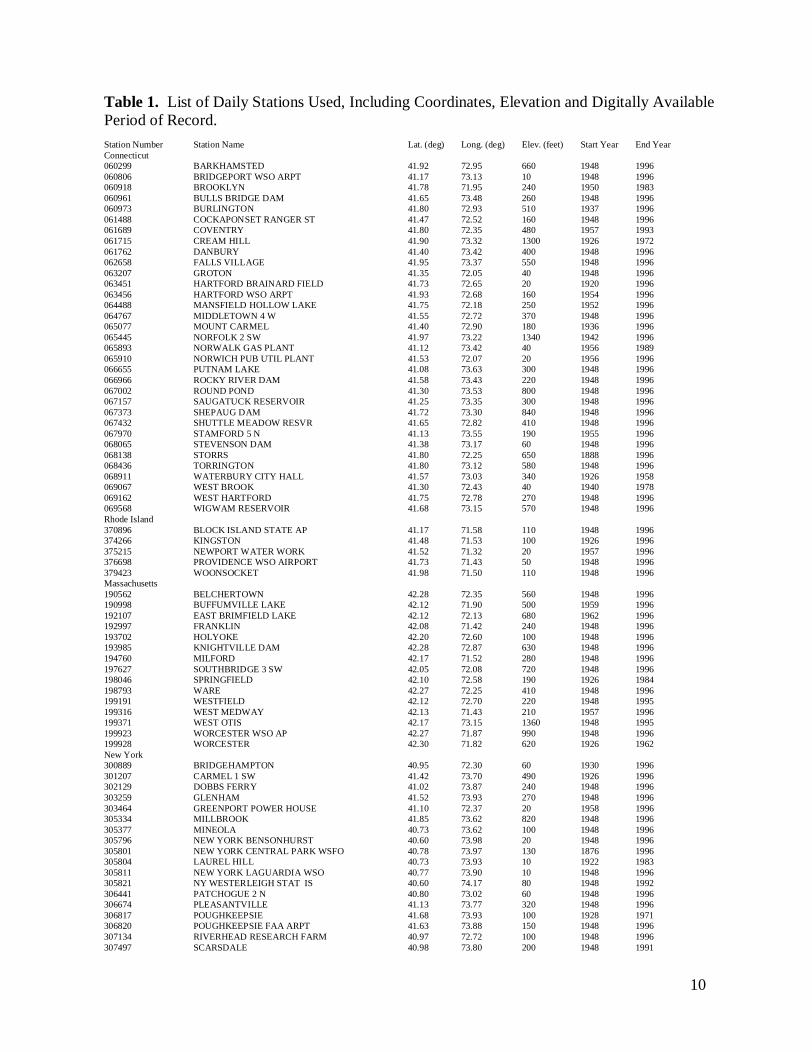
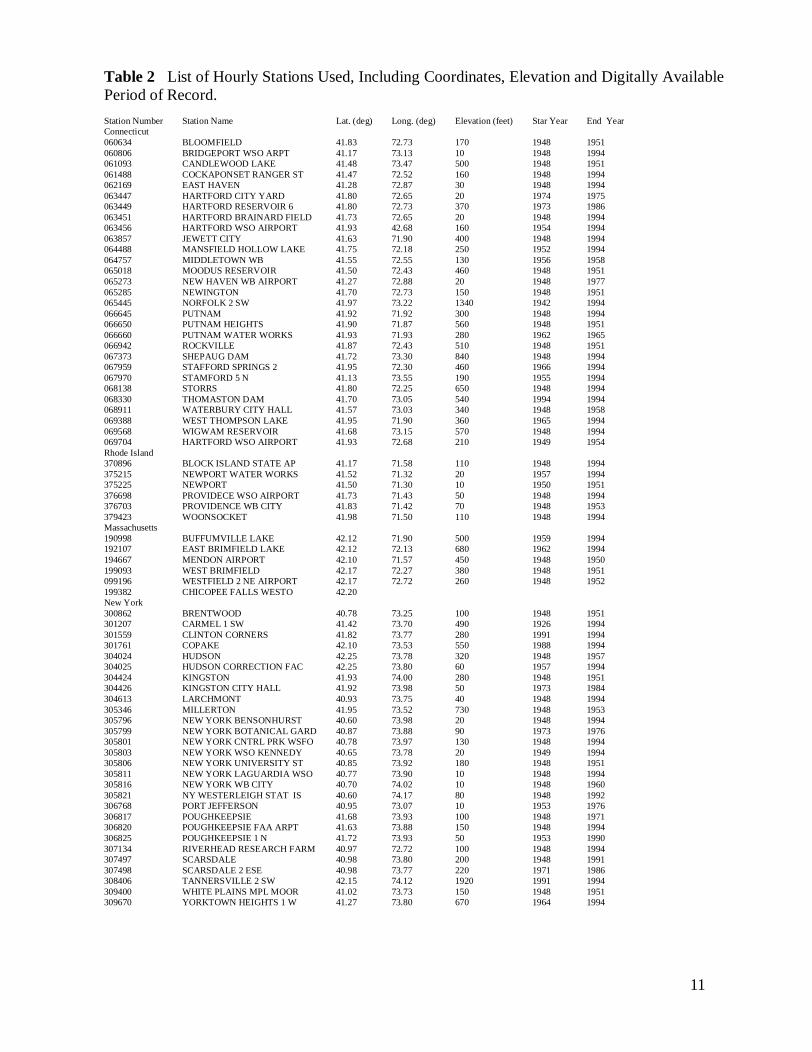
The precipitation amount, time and space distributions presented are from daily data recordsof 73 stations and hourly data records of 71 separate stations across Connecticut and adjacent portionsof New York, Rhode Island and Massachusetts. Tables 1 and 2 list the stations and their periods ofrecord.
Daily climatological data were included in the analysis if they contained at least 30 years ofrecord, regardless of the starting or ending date. Therefore, record length varied by station, with themost recent data ending in August 1996. All available hourly data were used regardless of period ofrecord, which in most cases was less than 30 years. The quality of the daily precipitation data wasevaluated based on a spatial comparison with neighboring stations. To be considered valid, precipita-tion amounts of 10 inches (245 mm) or more had to be corroborated by the occurrence of at least 5inches (127 mm) of precipitation at two or more stations within 200 miles (322 km) on the same day,the previous day, or the following day. Precipitation amounts between 5 and 10 inches (127 and 245mm) were validated in a similar manner, using 3-inch (76-mm) amounts at neighboring stations.Excessive hourly precipitation was validated by comparing daily and hourly observations at adjacentstations.
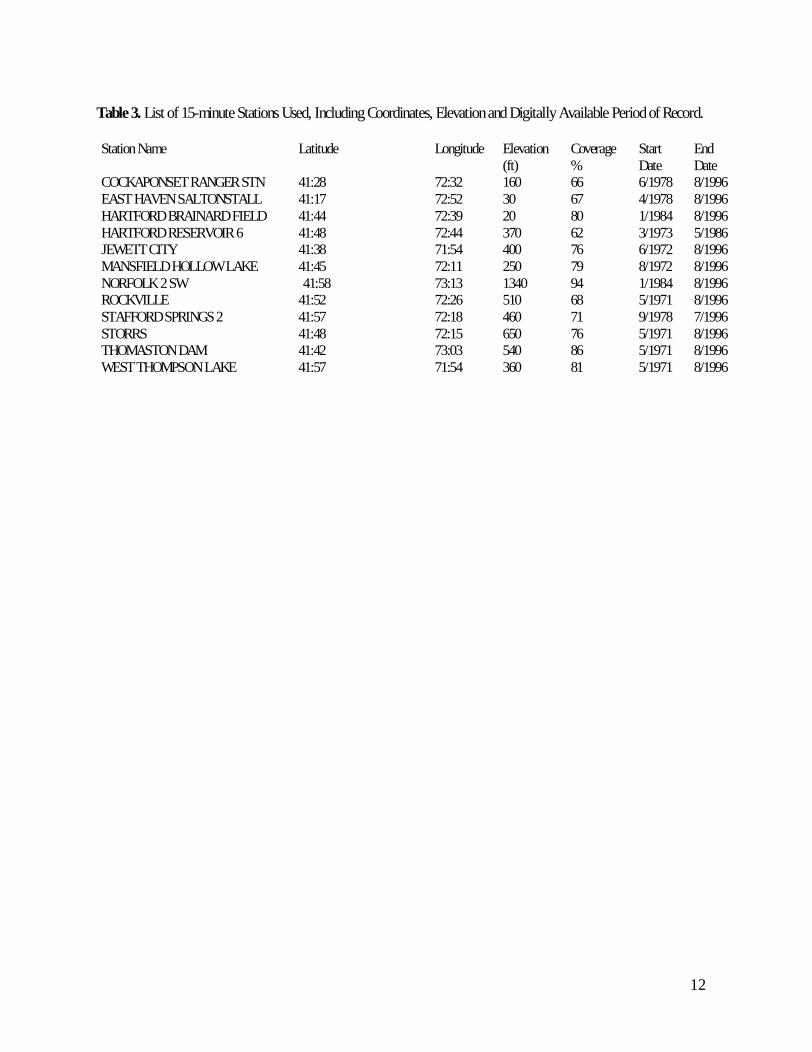
The data used in the 15-minute frequency analysis were from 12 stations listed in Table 3. Thedata were obtained from Hydrosphere, Inc. of Boulder, Colorado on a CD-ROM entitled “CLIMATE-DATA, Volume 5.0, NCDC 15 Minute Precipitation Values”. This CD-ROM record contains all 15-minute temporal resolution precipitation data archived at the U.S. Department of Commerce,National Oceanic and Atmospheric Administration, National Climatic Data Center, in Asheville,North Carolina, through August, 1996.
Annual Precipitation
The spatially averaged annual total precipitation in Connecticut over the last 100 years is plottedin Figure 1. Apparent from the graph is a generally increasing trend in precipitation over the centurywith high year to year variability. A linear regression fit to the data in Figure 1 is significantly differ-ent from a zero trend line with 95% confidence. Thus the increasing trend can be considered statisti-cally significant. The trend of increasing precipitation is consistent across the state, although the rate
3
of increase varies from about 7.5 to 10.7 inches (190 to 272 mm) over the one-hundred-year perioddepending on which long-term record is used. The differences may be the result of natural randomvariation among stations rather than actual differences in the rate of increases. Extrapolation of thesehistoric increases to the future is risky.
No similar trend in year to year variance could be found, and therefore the variability is appar-ently not changing. Periods, from one to three decades long, of lower than average precipitation,alternate with periods of higher than average precipitation throughout the record.
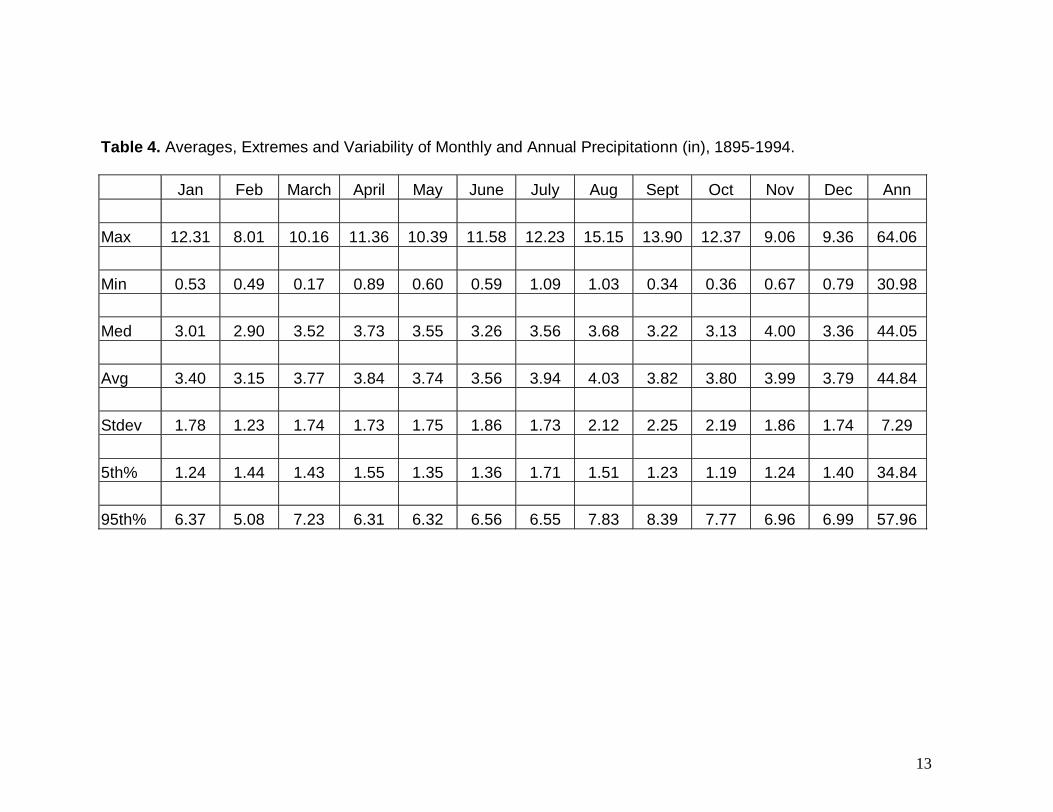
Table 4 presents the summary statistics for the annual precipitation for each month of the year.The long term mean annual precipitation is 44.84 inches (114 mm) per year. The maximum annualprecipitation during the century was 64.06 inches (1627 mm) and the minimum was 30.98 inches(786.9 mm) with a standard deviation of 7.29 inches (185 mm). In short, about 2/3 of the time thetotal annual precipitation is within 16% of the 100-year average.
Seasonal Precipitation
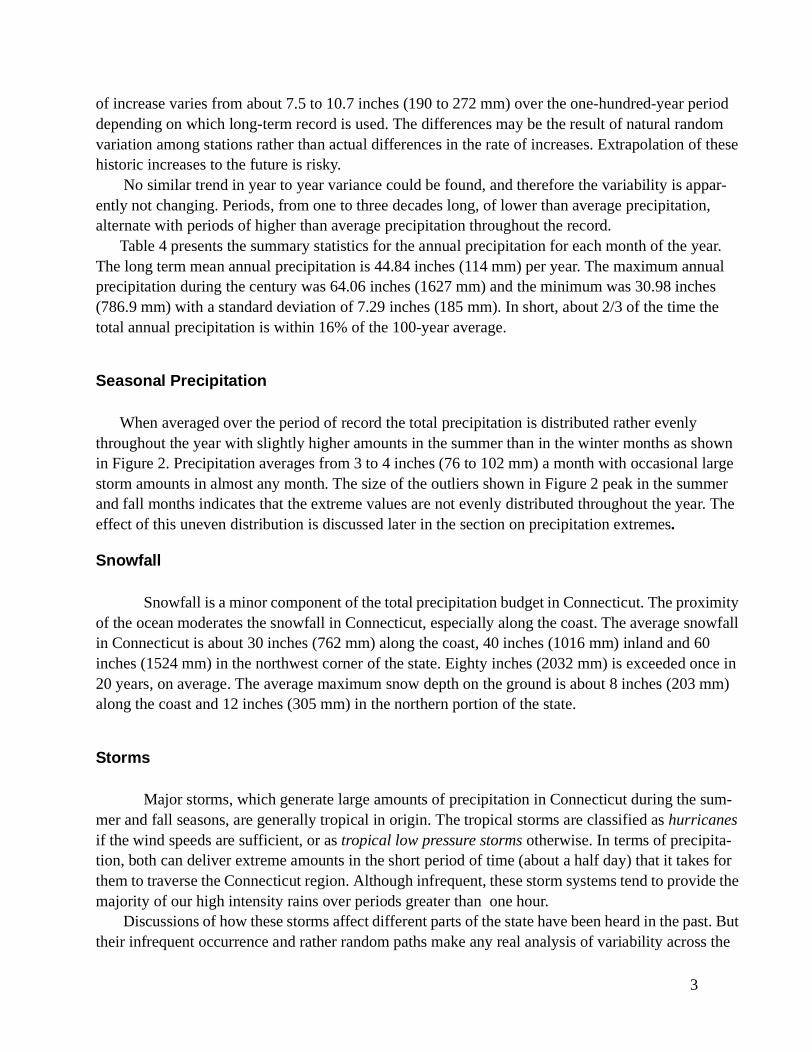
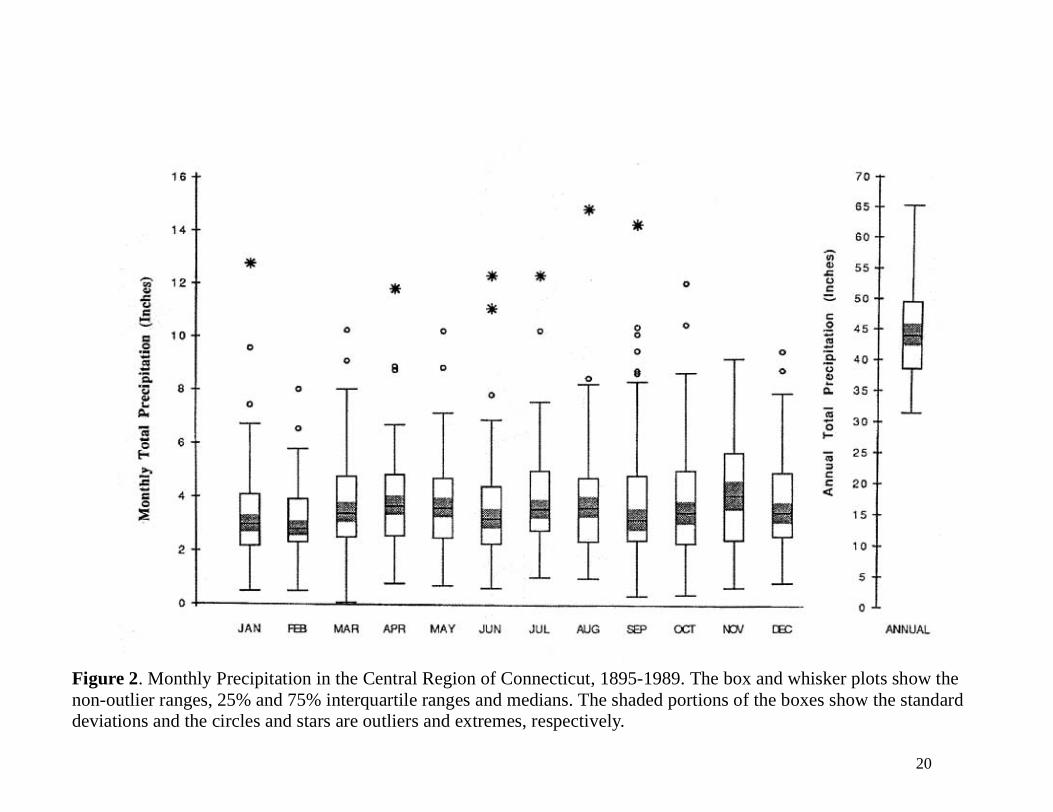
When averaged over the period of record the total precipitation is distributed rather evenlythroughout the year with slightly higher amounts in the summer than in the winter months as shownin Figure 2. Precipitation averages from 3 to 4 inches (76 to 102 mm) a month with occasional largestorm amounts in almost any month. The size of the outliers shown in Figure 2 peak in the summerand fall months indicates that the extreme values are not evenly distributed throughout the year. Theeffect of this uneven distribution is discussed later in the section on precipitation extremes.
Snowfall
Snowfall is a minor component of the total precipitation budget in Connecticut. The proximityof the ocean moderates the snowfall in Connecticut, especially along the coast. The average snowfallin Connecticut is about 30 inches (762 mm) along the coast, 40 inches (1016 mm) inland and 60inches (1524 mm) in the northwest corner of the state. Eighty inches (2032 mm) is exceeded once in20 years, on average. The average maximum snow depth on the ground is about 8 inches (203 mm)along the coast and 12 inches (305 mm) in the northern portion of the state.
Storms
Major storms, which generate large amounts of precipitation in Connecticut during the sum-mer and fall seasons, are generally tropical in origin. The tropical storms are classified as hurricanesif the wind speeds are sufficient, or as tropical low pressure storms otherwise. In terms of precipita-tion, both can deliver extreme amounts in the short period of time (about a half day) that it takes forthem to traverse the Connecticut region. Although infrequent, these storm systems tend to provide themajority of our high intensity rains over periods greater than one hour.
Discussions of how these storms affect different parts of the state have been heard in the past. Buttheir infrequent occurrence and rather random paths make any real analysis of variability across the

4
state intractable. Six hurricanes and 18 tropical lows have crossed Connecticut and Long Island in the100 years before 1994. The paths and detailed data of each storm are available on U.S. Department ofCommerce, National Oceanic and Atmospheric Administration, web site (http://www.noaa.gov).
Large extra-tropical storms are possible at any time of year but prevail in the winter and springseason. The most notable of these are the periodic Nor’easters, which move slowly in the oceansoutheast of New England and produce one to several days of blizzards or rain driven by the cyclonicwinds around the low.
Short-term intensive precipitation is generally greatest in localized thunderstorms, which are themost prevalent rainstorms in the warm season. They generally move from southwest to northeastacross the state and most often are associated with a frontal system. They seldom last longer thanabout an hour at any individual location and often are accompanied by small hail, severe lightening,high winds and rarely, a tornado.
Precipitation Extremes
Extreme Precipitation Regions in Connecticut
Four precipitation subregions were identified by statistically comparing the extreme precipitationrecords of the stations and grouping those with the least statistical differences and minimizing thegeographical distance between the sites following the methods of Wilks (1995) and DeGaetano(1996). The region boundaries were adjusted to fit town political boundaries and follow the majordrainage basin divides. Figure 3 shows the four regions superimposed on a town boundary map anddrainage basin map.
Computation of Return Periods
The probability (p) of a given size and duration precipitation event happening can be expressed asa decimal fraction or percent. For example, a given annual storm has p = 0.1 or a 10 percent chance ofoccurring this year. For precipitation these odds are most often expressed as a return period, and the0.1 chance annual storm is called a 1-in-10 year occurrence or a “10 year” storm. That is, the averageoccurrence of storms of this magnitude or greater is 10 years. The return period (T) is calculated by T= 1/p. It is important to understand that the actual time between storms will not be 10 years, it willonly average out to be 10 years over a very long period. Thus a location may receive a number ofthese storms in several years, or not receive one for decades. The occurrence of a 10-year storm doesnot change the probability of getting a 10-year storm the following year. There will still be a 10 per-cent chance in obtaining a 10-year storm each year.
Return periods were computed by DeGaetano (1997) using partial-duration precipitation data (i.e.the n largest daily precipitation values in n years of record) for each station in the state. Smoothingand extrapolation of the observed extreme precipitation values was done following the technique ofWilks (1995) by fitting the Beta-P distribution (Mielke and Johnson, 1974) for each station.
Due to the lack of long-term hourly precipitation observations, a set of empirically derived equa-tions was used to adjust the daily precipitation extremes to values representative of shorter duration.

5
The adjustment factors used here have been derived specifically for use in the northeastern UnitedStates (McKay and Wilks, 1995). Constant adjustment factors of 1.13, 1.07, 0.97 and 0.79 were usedto estimate extreme precipitation amounts for accumulation periods of 24, 18, 12, and 6 hours,respectively from the daily values. An adjustment for the 24-hour accumulation period was necessaryto account for precipitation events occurring within a 24-hour period, but spanning two fixed observa-tion time intervals. Multiple regression equations based on latitude, longitude, elevation, and dailyextreme precipitation amounts were used to estimate extreme precipitation amounts for 1, 2 and 3-hour accumulation periods.
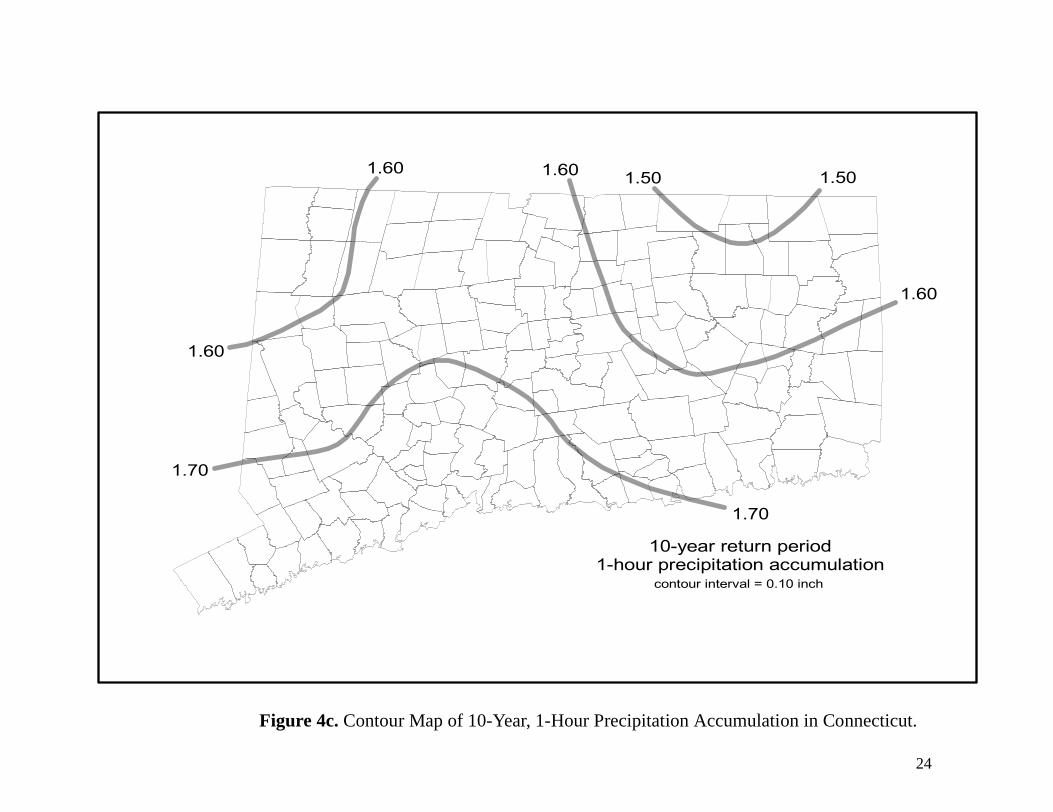
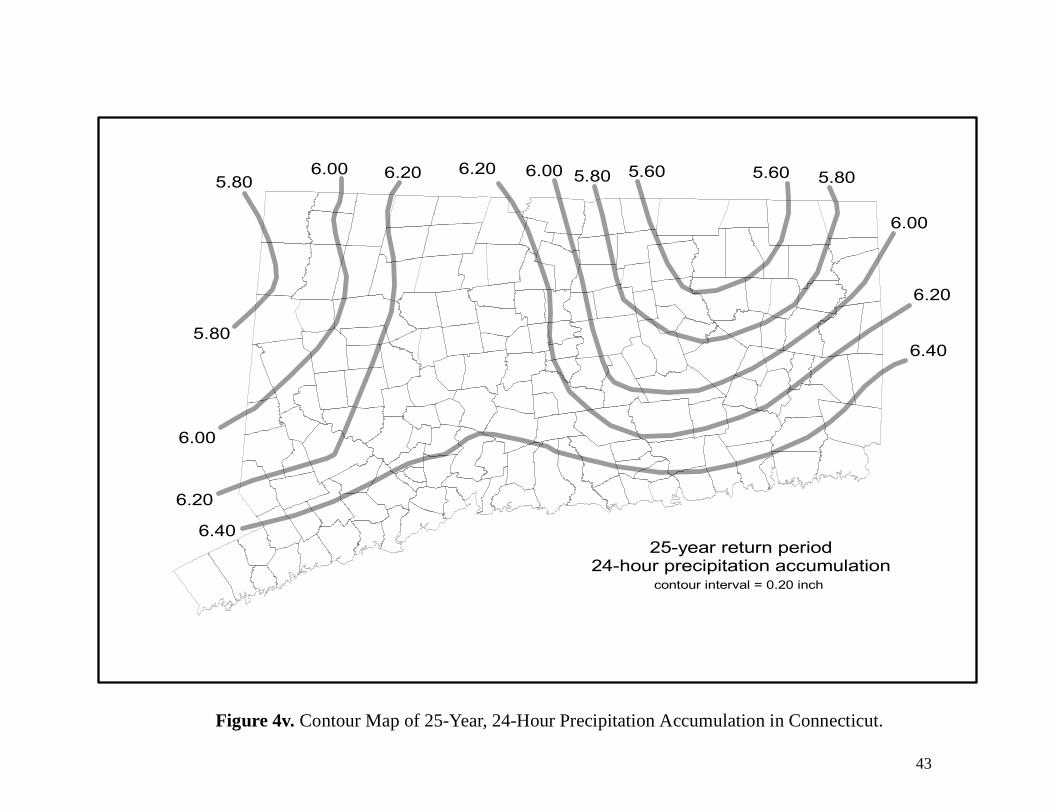
Spatial Distribution of Extreme Precipitation Events
Isohyets are contours of equal precipitation on a map. Figures 4a through 4x are isohyetal mapsof Connecticut showing the spatial distribution of 24, 12, 6, and 1-hour precipitation accumulationscorresponding to average return periods of 2, 5, 10, 25, 50, and 100 years. The isohyets shown arespatial averages of the station values drawn after using the interpolation algorithm of Wilks and Cem-ber (1993). Example 1 below demonstrates how these curves might be used.
Example 1. Using the Statewide Isohyet Maps.
A hydrologic consultant needs the 100 year 1-hour storm in SW Connecticut to design a detentionbasin that will store increased runoff due to increased impervious areas in a development.
Solution:
SW Connecticut is in Region 4. The consultant decides to use Figure 4f showing the statewide distri-bution of total amounts for the 100 yr - 1 hr storm. The site falls between the 2.4 and 2.5 inch (60 and64 mm) isohyets, and by interpolation, the amount for the design is 2.45 inches (62 mm).
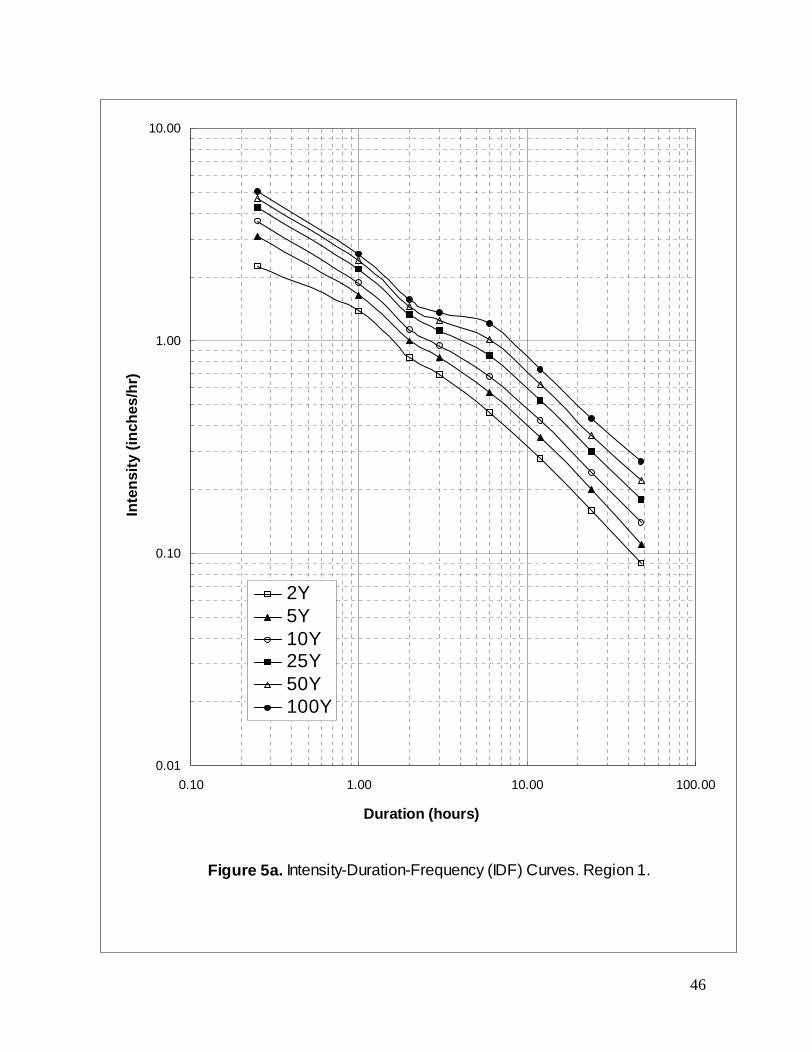
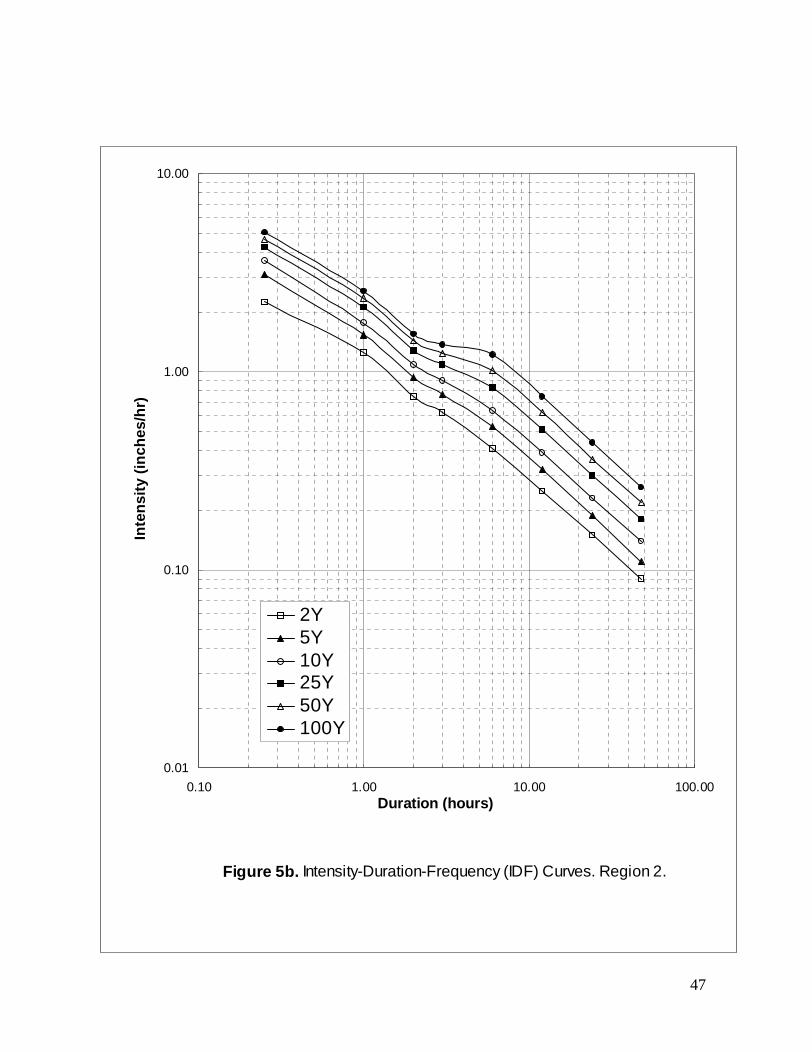
Intensity-Duration-Frequency Curves
Within each region, the station with the highest 24-hour extreme precipitation accumulation wasselected. Based on this representative station, precipitation intensity for various storm duration peri-ods are plotted as a function of return period in Figures 5a, 5b, 5c and 5d. Given that all stationswithin a region can be described by the same empirical extreme precipitation distribution, this singleintensity-duration curve is assumed representative of all sites in a region. The following examplesshow how these intensity-duration curves might be used.
Example 2. Reading the Intensity-Duration-Frequency (IDF) curves.
An engineer is designing a road culvert near Storrs, CT. The structure will be built to handle the flowfrom a 25-year recurrence interval rainfall, i.e. a discharge whose probability of occurring any year is4 %. The engineer also needs to know the 100-year peak discharge for flood management purposes. Ithas been determined that the time of concentration (tc) of the small watershed above the culvert is 1.5
hours. Therefore the intensities for a rainfall equal to this tc are needed.

6
Solution:Storrs, CT is located in Region 2, and the precipitation intensity-duration-frequency curves forRegion 2 are shown in Figure 5b.
The 25 yr, 1.5 hr precipitation event = 1.75 in/hr (44 mm/hr), andThe 100 yr, 1.5 hr precipitation event= 2.0 in/hr (51 mm/hr)
Note: Examples 1 and 2 show two approaches to calculate either total storm precipitation or averageintensity. Example 2 uses the Intensity-Duration-Frequency (IDF) curves (Figures 5a - 5d) which arebased on the highest precipitation amounts within each region. Example 1 uses the averages acrossthe state which are based on all rain gages. Average intensities calculated from the statewide isohyetalmaps (Figures 4a – 4x) may therefore be somewhat lower than from the IDF curves in Figure 5.
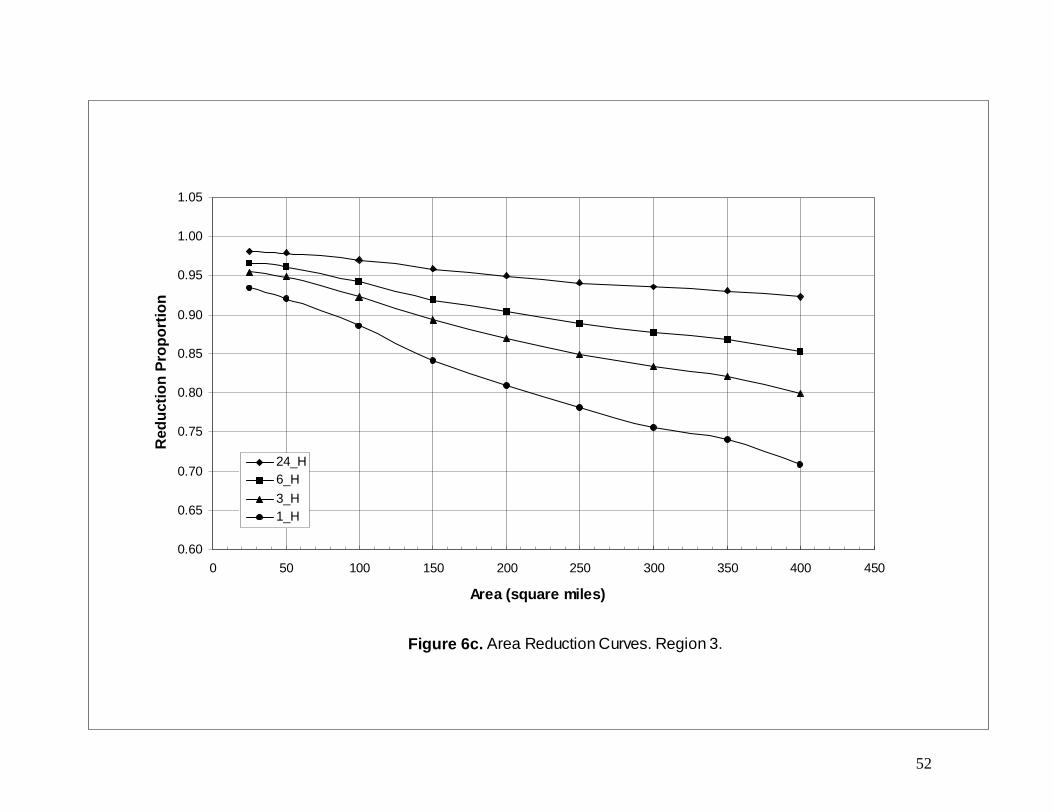
Area Reduction Curves
For applications involving drainage basins larger than a few square miles, it is necessary to con-sider the extreme precipitation depth averaged over the entire basin, which will be smaller than theextreme precipitation at a single point because no storm covers a large area evenly. The area reductioncurves for 1, 3, 6 and 24 hour duration storms (shown in Figures 6a, 6b, 6c, and 6d) for each regionare intended as an aid for extrapolating single point precipitation amounts to drainage basins of vari-ous areas. The example below shows how these curves might be used.
Example 3. Use of Area Reduction Curves.
A consultant is designing a spillway for a large reservoir having a drainage area (DA) of 125 mi2 (324
km2) located in Region 2. Since the DA is relatively large, the point precipitation statistics will begreater than an average precipitation over the entire watershed.Solution:The consultant uses the Area Reduction Curves along with the point precipitation IDF curves todetermine the best estimate for the watershed-wide storm. The critical precipitation duration for peakflow is 6 hours. The 100 yr - 6 hr precipitation intensity (Figure 5 b) is 1.15 in/hr (29 mm/hr) whichgives a total amount for 6 hours of 6.9 inches (175.3 mm). The “percent of point precipitation” from
Figure 6b for 125 mi2 (324 km2) is estimated as 89 %. Therefore 0.89 x 6.90 in (175 mm) = 6.14 in(156 mm).Note: There is a greater area reduction for shorter duration storms (e.g. 1 hr) than longer durationstorms (e.g. 24 hr) because intense summer thunderstorms typically cover relatively small areas.
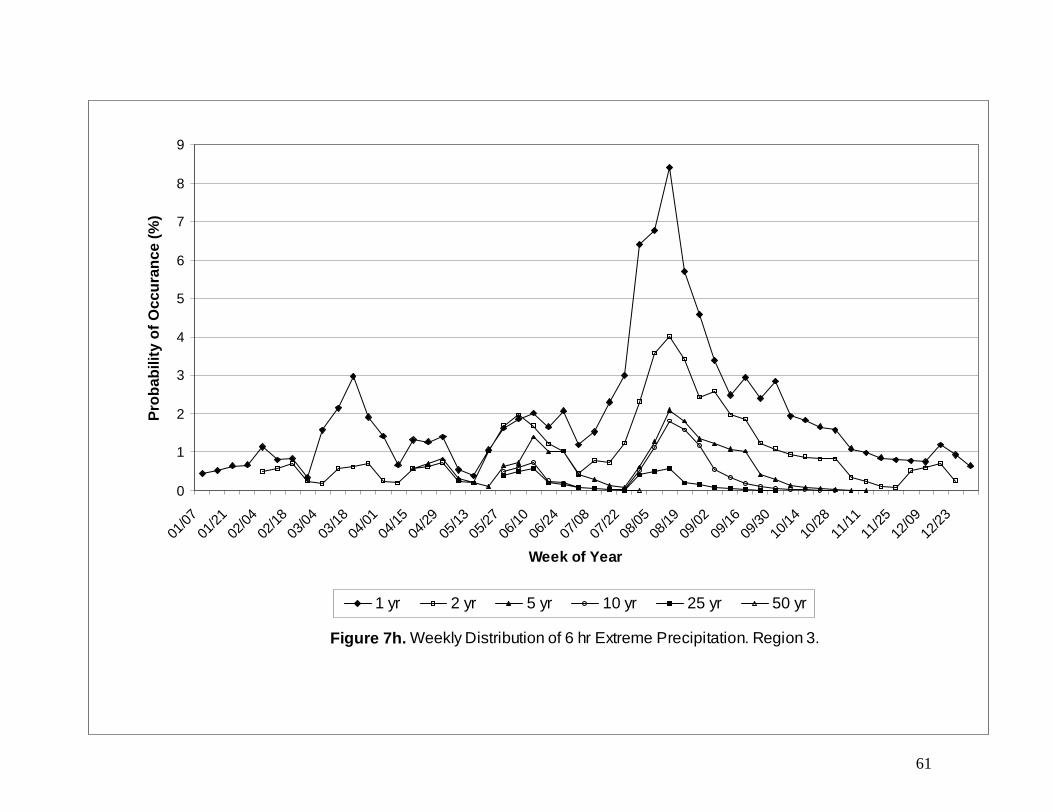
Seasonal Distribution of Extreme Precipitation Events
Although the mean annual precipitation is fairly evenly distributed throughout the year, the occur-rence of extreme precipitation is not. Probabilities calculated from the long-term records for receivinga particular size storm during any week are shown in Figures 7a - 7l by week of the year for 24, 6, and
7
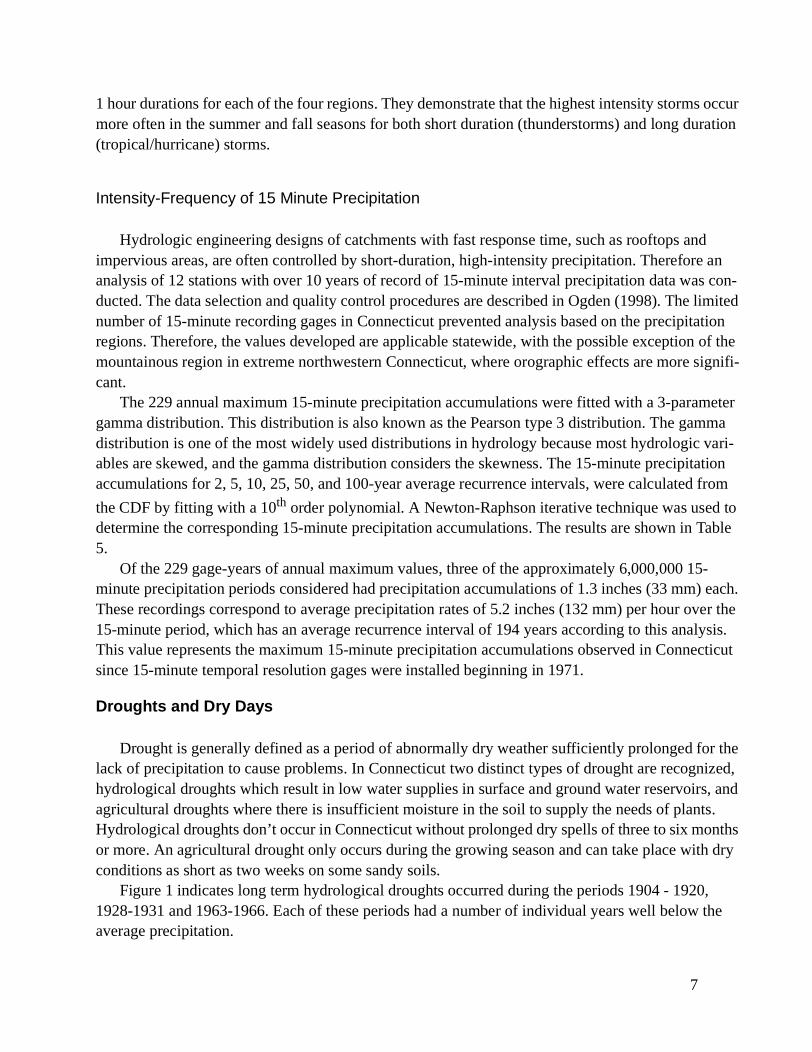
1 hour durations for each of the four regions. They demonstrate that the highest intensity storms occurmore often in the summer and fall seasons for both short duration (thunderstorms) and long duration(tropical/hurricane) storms.
Intensity-Frequency of 15 Minute Precipitation
Hydrologic engineering designs of catchments with fast response time, such as rooftops andimpervious areas, are often controlled by short-duration, high-intensity precipitation. Therefore ananalysis of 12 stations with over 10 years of record of 15-minute interval precipitation data was con-ducted. The data selection and quality control procedures are described in Ogden (1998). The limitednumber of 15-minute recording gages in Connecticut prevented analysis based on the precipitationregions. Therefore, the values developed are applicable statewide, with the possible exception of themountainous region in extreme northwestern Connecticut, where orographic effects are more signifi-cant.
The 229 annual maximum 15-minute precipitation accumulations were fitted with a 3-parametergamma distribution. This distribution is also known as the Pearson type 3 distribution. The gammadistribution is one of the most widely used distributions in hydrology because most hydrologic vari-ables are skewed, and the gamma distribution considers the skewness. The 15-minute precipitationaccumulations for 2, 5, 10, 25, 50, and 100-year average recurrence intervals, were calculated from
the CDF by fitting with a 10th order polynomial. A Newton-Raphson iterative technique was used todetermine the corresponding 15-minute precipitation accumulations. The results are shown in Table5.
Of the 229 gage-years of annual maximum values, three of the approximately 6,000,000 15-minute precipitation periods considered had precipitation accumulations of 1.3 inches (33 mm) each.These recordings correspond to average precipitation rates of 5.2 inches (132 mm) per hour over the15-minute period, which has an average recurrence interval of 194 years according to this analysis.This value represents the maximum 15-minute precipitation accumulations observed in Connecticutsince 15-minute temporal resolution gages were installed beginning in 1971.
Droughts and Dry Days
Drought is generally defined as a period of abnormally dry weather sufficiently prolonged for thelack of precipitation to cause problems. In Connecticut two distinct types of drought are recognized,hydrological droughts which result in low water supplies in surface and ground water reservoirs, andagricultural droughts where there is insufficient moisture in the soil to supply the needs of plants.Hydrological droughts don’t occur in Connecticut without prolonged dry spells of three to six monthsor more. An agricultural drought only occurs during the growing season and can take place with dryconditions as short as two weeks on some sandy soils.
Figure 1 indicates long term hydrological droughts occurred during the periods 1904 - 1920,1928-1931 and 1963-1966. Each of these periods had a number of individual years well below theaverage precipitation.

8
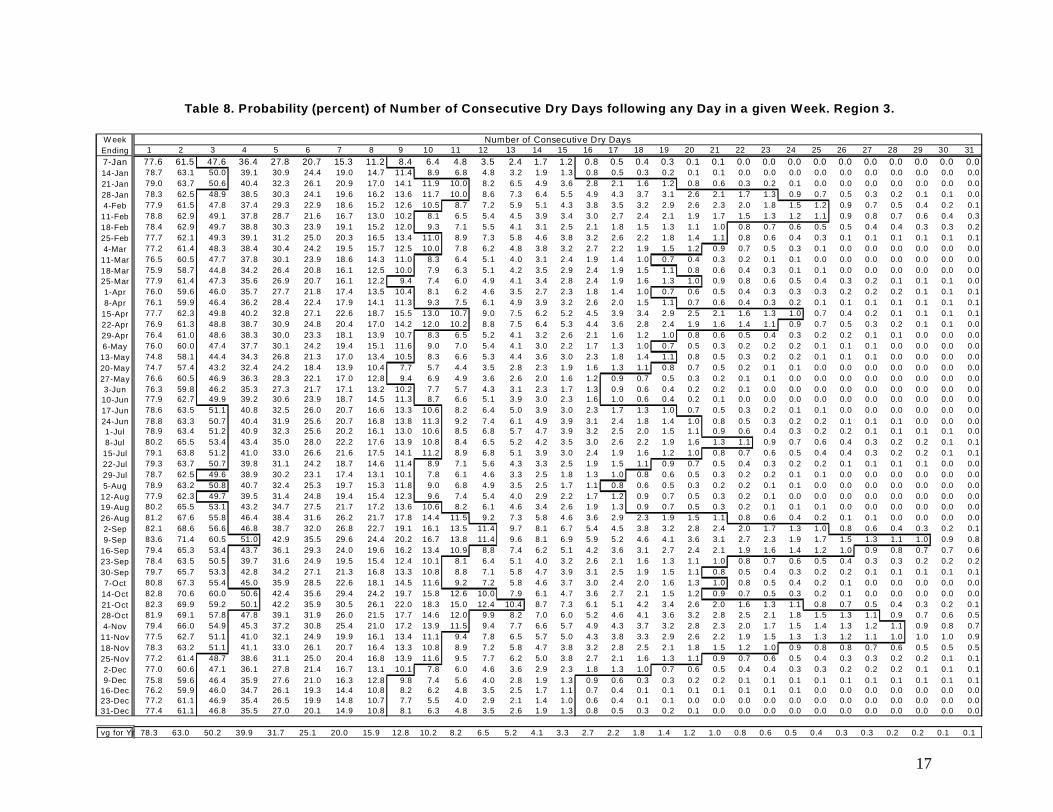
The probability of a number of consecutive days with no precipitation is of concern to industriessuch as recreation, sports and green industries when planning outdoor activities. Engineers use theseprobabilities for planning storm water treatment and the calculation of antecedent moisture in theground among other things.
Tables 6, 7, 8 and 9 (regions 1 through 4, respectively) provide the probability, in percent, of agiven number of consecutive dry days occurring following any day within a specific week. Dry daysare defined as either zero or a trace of precipitation. Values are averages for the seven days ending onthe date shown. Average probabilities for the year are given in the bottom row. Lines indicating the50, 10 and 1 percent probabilities are shown on the table.
Literature Cited
Brumbach, J. J. 1965. The Climate of Connecticut. Bulletin 99, CT Geological and Natural History Survey, CT Dept. Gar.and Nat. Res., Hartford, CT. 215p.
DeGaetano, A. T. 1996. Delineation of Mesoscale Climate Zones in the Northeastern United States Using A NovelApproach to Cluster Analysis. J. Climate 9(8):1765-1782.
DeGaetano, A. T. 1997. Extreme Precipitation Analysis for the State of Connecticut. Northeast Regional Climate CenterReport. Ithaca, NY.
Hunter, B. W. and D. B. Meade. 1983. Precipitation in Connecticut 1951-1980. Bulletin 6, CT Dept Env. Protection, Hart-ford, CT. 92p.
Kirk, J. M. 1939. The Weather and Climate of Connecticut. Bulletin 61, CT Geological and Natural History Survey. Hart-ford, CT. 241p.
Ogden, F. L. 1998. Intensity-Frequency Analysis of 15 Minute Precipitation Records in Connecticut. Dept of Civil andEnvironmental Engineering, University of Connecticut, Storrs, CT.
McKay, M., and D. S. Wilks. 1995. Atlas of Short-Duration Precipitation Extremes for the Northeastern United Statesand Southeastern Canada. Northeast Regional Climate Center Research Publication RR 95-1, 26p.
Mielke, P. W. Jr., and E. S. Johnson. 1974. Some generalized beta distributions of the second kind having desirable appli-cation features in hydrology and meteorology. Water Resources Research 29:3543-3549.
Wilks, D. S. 1995. Statistical Methods in the Atmospheric Sciences. Academic Press, San Diego, CA 464p.
Wilks, D. S. and R. P. Cember. 1993. Atlas of Precipitation Extremes for the Northeastern United States and SoutheasternCanada. Northeast Regional Climate Center Research Publication RR 93-5, 40p.
Tables
Table 1. List of Daily Stations Used, Including Coordinates, Elevation and Digitally Available Periodof Record.
9
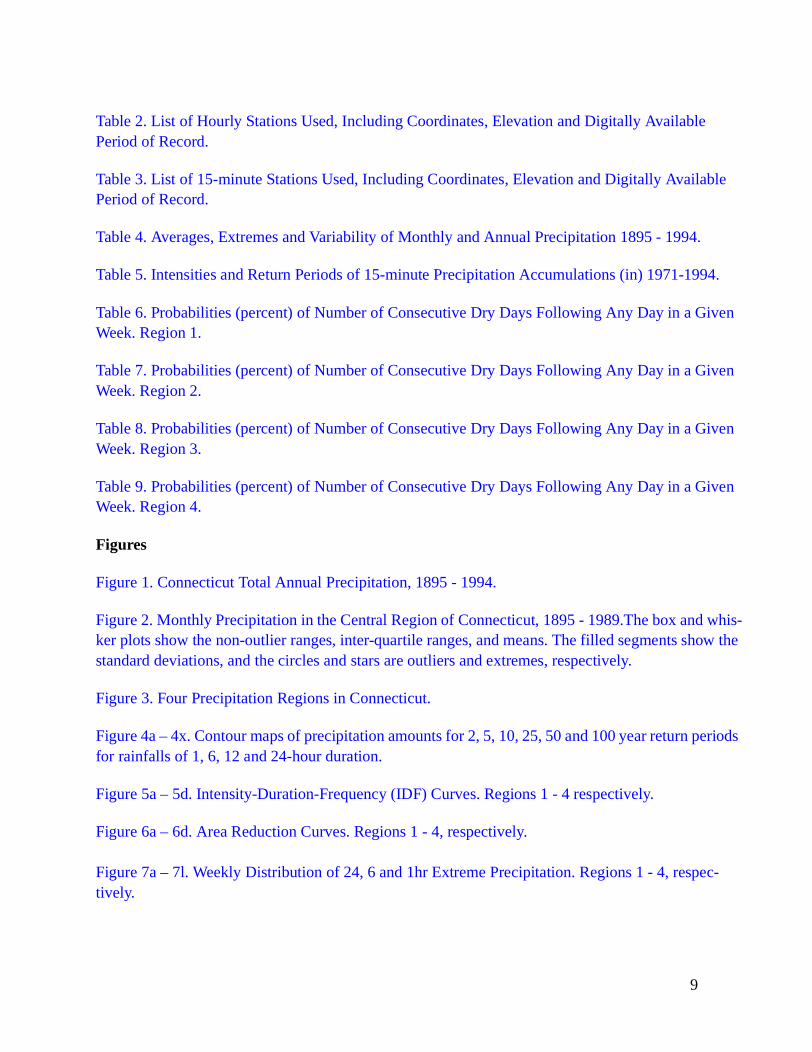
Table 2. List of Hourly Stations Used, Including Coordinates, Elevation and Digitally AvailablePeriod of Record.
Table 3. List of 15-minute Stations Used, Including Coordinates, Elevation and Digitally AvailablePeriod of Record.
Table 4. Averages, Extremes and Variability of Monthly and Annual Precipitation 1895 - 1994.
Table 5. Intensities and Return Periods of 15-minute Precipitation Accumulations (in) 1971-1994.
Table 6. Probabilities (percent) of Number of Consecutive Dry Days Following Any Day in a GivenWeek. Region 1.
Table 7. Probabilities (percent) of Number of Consecutive Dry Days Following Any Day in a GivenWeek. Region 2.
Table 8. Probabilities (percent) of Number of Consecutive Dry Days Following Any Day in a GivenWeek. Region 3.
Table 9. Probabilities (percent) of Number of Consecutive Dry Days Following Any Day in a GivenWeek. Region 4.
Figures
Figure 1. Connecticut Total Annual Precipitation, 1895 - 1994.
Figure 2. Monthly Precipitation in the Central Region of Connecticut, 1895 - 1989.The box and whis-ker plots show the non-outlier ranges, inter-quartile ranges, and means. The filled segments show thestandard deviations, and the circles and stars are outliers and extremes, respectively.
Figure 3. Four Precipitation Regions in Connecticut.
Figure 4a – 4x. Contour maps of precipitation amounts for 2, 5, 10, 25, 50 and 100 year return periodsfor rainfalls of 1, 6, 12 and 24-hour duration.
Figure 5a – 5d. Intensity-Duration-Frequency (IDF) Curves. Regions 1 - 4 respectively.
Figure 6a – 6d. Area Reduction Curves. Regions 1 - 4, respectively.
Figure 7a – 7l. Weekly Distribution of 24, 6 and 1hr Extreme Precipitation. Regions 1 - 4, respec-tively.
10
Table 1. List of Daily Stations Used, Including Coordinates, Elevation and Digitally AvailablePeriod of Record.
Station Number Station Name Lat. (deg) Long. (deg) Elev. (feet) Start Year End YearConnecticut060299 BARKHAMSTED 41.92 72.95 660 1948 1996060806 BRIDGEPORT WSO ARPT 41.17 73.13 10 1948 1996060918 BROOKLYN 41.78 71.95 240 1950 1983060961 BULLS BRIDGE DAM 41.65 73.48 260 1948 1996060973 BURLINGTON 41.80 72.93 510 1937 1996061488 COCKAPONSET RANGER ST 41.47 72.52 160 1948 1996061689 COVENTRY 41.80 72.35 480 1957 1993061715 CREAM HILL 41.90 73.32 1300 1926 1972061762 DANBURY 41.40 73.42 400 1948 1996062658 FALLS VILLAGE 41.95 73.37 550 1948 1996063207 GROTON 41.35 72.05 40 1948 1996063451 HARTFORD BRAINARD FIELD 41.73 72.65 20 1920 1996063456 HARTFORD WSO ARPT 41.93 72.68 160 1954 1996064488 MANSFIELD HOLLOW LAKE 41.75 72.18 250 1952 1996064767 MIDDLETOWN 4 W 41.55 72.72 370 1948 1996065077 MOUNT CARMEL 41.40 72.90 180 1936 1996065445 NORFOLK 2 SW 41.97 73.22 1340 1942 1996065893 NORWALK GAS PLANT 41.12 73.42 40 1956 1989065910 NORWICH PUB UTIL PLANT 41.53 72.07 20 1956 1996066655 PUTNAM LAKE 41.08 73.63 300 1948 1996066966 ROCKY RIVER DAM 41.58 73.43 220 1948 1996067002 ROUND POND 41.30 73.53 800 1948 1996067157 SAUGATUCK RESERVOIR 41.25 73.35 300 1948 1996067373 SHEPAUG DAM 41.72 73.30 840 1948 1996067432 SHUTTLE MEADOW RESVR 41.65 72.82 410 1948 1996067970 STAMFORD 5 N 41.13 73.55 190 1955 1996068065 STEVENSON DAM 41.38 73.17 60 1948 1996068138 STORRS 41.80 72.25 650 1888 1996068436 TORRINGTON 41.80 73.12 580 1948 1996068911 WATERBURY CITY HALL 41.57 73.03 340 1926 1958069067 WEST BROOK 41.30 72.43 40 1940 1978069162 WEST HARTFORD 41.75 72.78 270 1948 1996069568 WIGWAM RESERVOIR 41.68 73.15 570 1948 1996Rhode Island370896 BLOCK ISLAND STATE AP 41.17 71.58 110 1948 1996374266 KINGSTON 41.48 71.53 100 1926 1996375215 NEWPORT WATER WORK 41.52 71.32 20 1957 1996376698 PROVIDENCE WSO AIRPORT 41.73 71.43 50 1948 1996379423 WOONSOCKET 41.98 71.50 110 1948 1996Massachusetts190562 BELCHERTOWN 42.28 72.35 560 1948 1996190998 BUFFUMVILLE LAKE 42.12 71.90 500 1959 1996192107 EAST BRIMFIELD LAKE 42.12 72.13 680 1962 1996192997 FRANKLIN 42.08 71.42 240 1948 1996193702 HOLYOKE 42.20 72.60 100 1948 1996193985 KNIGHTVILLE DAM 42.28 72.87 630 1948 1996194760 MILFORD 42.17 71.52 280 1948 1996197627 SOUTHBRIDGE 3 SW 42.05 72.08 720 1948 1996198046 SPRINGFIELD 42.10 72.58 190 1926 1984198793 WARE 42.27 72.25 410 1948 1996199191 WESTFIELD 42.12 72.70 220 1948 1995199316 WEST MEDWAY 42.13 71.43 210 1957 1996199371 WEST OTIS 42.17 73.15 1360 1948 1995199923 WORCESTER WSO AP 42.27 71.87 990 1948 1996199928 WORCESTER 42.30 71.82 620 1926 1962New York300889 BRIDGEHAMPTON 40.95 72.30 60 1930 1996301207 CARMEL 1 SW 41.42 73.70 490 1926 1996302129 DOBBS FERRY 41.02 73.87 240 1948 1996303259 GLENHAM 41.52 73.93 270 1948 1996303464 GREENPORT POWER HOUSE 41.10 72.37 20 1958 1996305334 MILLBROOK 41.85 73.62 820 1948 1996305377 MINEOLA 40.73 73.62 100 1948 1996305796 NEW YORK BENSONHURST 40.60 73.98 20 1948 1996305801 NEW YORK CENTRAL PARK WSFO 40.78 73.97 130 1876 1996305804 LAUREL HILL 40.73 73.93 10 1922 1983305811 NEW YORK LAGUARDIA WSO 40.77 73.90 10 1948 1996305821 NY WESTERLEIGH STAT IS 40.60 74.17 80 1948 1992306441 PATCHOGUE 2 N 40.80 73.02 60 1948 1996306674 PLEASANTVILLE 41.13 73.77 320 1948 1996306817 POUGHKEEPSIE 41.68 73.93 100 1928 1971306820 POUGHKEEPSIE FAA ARPT 41.63 73.88 150 1948 1996307134 RIVERHEAD RESEARCH FARM 40.97 72.72 100 1948 1996307497 SCARSDALE 40.98 73.80 200 1948 1991
11
Table 2 List of Hourly Stations Used, Including Coordinates, Elevation and Digitally AvailablePeriod of Record.
Station Number Station Name Lat. (deg) Long. (deg) Elevation (feet) Star Year End YearConnecticut060634 BLOOMFIELD 41.83 72.73 170 1948 1951060806 BRIDGEPORT WSO ARPT 41.17 73.13 10 1948 1994061093 CANDLEWOOD LAKE 41.48 73.47 500 1948 1951061488 COCKAPONSET RANGER ST 41.47 72.52 160 1948 1994062169 EAST HAVEN 41.28 72.87 30 1948 1994063447 HARTFORD CITY YARD 41.80 72.65 20 1974 1975063449 HARTFORD RESERVOIR 6 41.80 72.73 370 1973 1986063451 HARTFORD BRAINARD FIELD 41.73 72.65 20 1948 1994063456 HARTFORD WSO AIRPORT 41.93 42.68 160 1954 1994063857 JEWETT CITY 41.63 71.90 400 1948 1994064488 MANSFIELD HOLLOW LAKE 41.75 72.18 250 1952 1994064757 MIDDLETOWN WB 41.55 72.55 130 1956 1958065018 MOODUS RESERVOIR 41.50 72.43 460 1948 1951065273 NEW HAVEN WB AIRPORT 41.27 72.88 20 1948 1977065285 NEWINGTON 41.70 72.73 150 1948 1951065445 NORFOLK 2 SW 41.97 73.22 1340 1942 1994066645 PUTNAM 41.92 71.92 300 1948 1994066650 PUTNAM HEIGHTS 41.90 71.87 560 1948 1951066660 PUTNAM WATER WORKS 41.93 71.93 280 1962 1965066942 ROCKVILLE 41.87 72.43 510 1948 1951067373 SHEPAUG DAM 41.72 73.30 840 1948 1994067959 STAFFORD SPRINGS 2 41.95 72.30 460 1966 1994067970 STAMFORD 5 N 41.13 73.55 190 1955 1994068138 STORRS 41.80 72.25 650 1948 1994068330 THOMASTON DAM 41.70 73.05 540 1994 1994068911 WATERBURY CITY HALL 41.57 73.03 340 1948 1958069388 WEST THOMPSON LAKE 41.95 71.90 360 1965 1994069568 WIGWAM RESERVOIR 41.68 73.15 570 1948 1994069704 HARTFORD WSO AIRPORT 41.93 72.68 210 1949 1954Rhode Island370896 BLOCK ISLAND STATE AP 41.17 71.58 110 1948 1994375215 NEWPORT WATER WORKS 41.52 71.32 20 1957 1994375225 NEWPORT 41.50 71.30 10 1950 1951376698 PROVIDECE WSO AIRPORT 41.73 71.43 50 1948 1994376703 PROVIDENCE WB CITY 41.83 71.42 70 1948 1953379423 WOONSOCKET 41.98 71.50 110 1948 1994Massachusetts190998 BUFFUMVILLE LAKE 42.12 71.90 500 1959 1994192107 EAST BRIMFIELD LAKE 42.12 72.13 680 1962 1994194667 MENDON AIRPORT 42.10 71.57 450 1948 1950199093 WEST BRIMFIELD 42.17 72.27 380 1948 1951099196 WESTFIELD 2 NE AIRPORT 42.17 72.72 260 1948 1952199382 CHICOPEE FALLS WESTO 42.20New York300862 BRENTWOOD 40.78 73.25 100 1948 1951301207 CARMEL 1 SW 41.42 73.70 490 1926 1994301559 CLINTON CORNERS 41.82 73.77 280 1991 1994301761 COPAKE 42.10 73.53 550 1988 1994304024 HUDSON 42.25 73.78 320 1948 1957304025 HUDSON CORRECTION FAC 42.25 73.80 60 1957 1994304424 KINGSTON 41.93 74.00 280 1948 1951304426 KINGSTON CITY HALL 41.92 73.98 50 1973 1984304613 LARCHMONT 40.93 73.75 40 1948 1994305346 MILLERTON 41.95 73.52 730 1948 1953305796 NEW YORK BENSONHURST 40.60 73.98 20 1948 1994305799 NEW YORK BOTANICAL GARD 40.87 73.88 90 1973 1976305801 NEW YORK CNTRL PRK WSFO 40.78 73.97 130 1948 1994305803 NEW YORK WSO KENNEDY 40.65 73.78 20 1949 1994305806 NEW YORK UNIVERSITY ST 40.85 73.92 180 1948 1951305811 NEW YORK LAGUARDIA WSO 40.77 73.90 10 1948 1994305816 NEW YORK WB CITY 40.70 74.02 10 1948 1960305821 NY WESTERLEIGH STAT IS 40.60 74.17 80 1948 1992306768 PORT JEFFERSON 40.95 73.07 10 1953 1976306817 POUGHKEEPSIE 41.68 73.93 100 1948 1971306820 POUGHKEEPSIE FAA ARPT 41.63 73.88 150 1948 1994306825 POUGHKEEPSIE 1 N 41.72 73.93 50 1953 1990307134 RIVERHEAD RESEARCH FARM 40.97 72.72 100 1948 1994307497 SCARSDALE 40.98 73.80 200 1948 1991307498 SCARSDALE 2 ESE 40.98 73.77 220 1971 1986308406 TANNERSVILLE 2 SW 42.15 74.12 1920 1991 1994309400 WHITE PLAINS MPL MOOR 41.02 73.73 150 1948 1951309670 YORKTOWN HEIGHTS 1 W 41.27 73.80 670 1964 1994
12
Table3. List of 15-minuteStations Used, IncludingCoordinates, ElevationandDigitallyAvailable Periodof Record.
StationName Latitude Longitude Elevation(ft)
Coverage%
StartDate
EndDate
COCKAPONSETRANGERSTN 41:28 72:32 160 66 6/1978 8/1996EASTHAVENSALTONSTALL 41:17 72:52 30 67 4/1978 8/1996HARTFORDBRAINARDFIELD 41:44 72:39 20 80 1/1984 8/1996HARTFORDRESERVOIR6 41:48 72:44 370 62 3/1973 5/1986JEWETTCITY 41:38 71:54 400 76 6/1972 8/1996MANSFIELDHOLLOWLAKE 41:45 72:11 250 79 8/1972 8/1996NORFOLK2SW 41:58 73:13 1340 94 1/1984 8/1996ROCKVILLE 41:52 72:26 510 68 5/1971 8/1996STAFFORDSPRINGS2 41:57 72:18 460 71 9/1978 7/1996STORRS 41:48 72:15 650 76 5/1971 8/1996THOMASTONDAM 41:42 73:03 540 86 5/1971 8/1996WESTTHOMPSONLAKE 41:57 71:54 360 81 5/1971 8/1996
13
Table 4. Averages, Extremes and Variability of Monthly and Annual Precipitationn (in), 1895-1994.
Jan Feb March April May June July Aug Sept Oct Nov Dec Ann
Max 12.31 8.01 10.16 11.36 10.39 11.58 12.23 15.15 13.90 12.37 9.06 9.36 64.06
Min 0.53 0.49 0.17 0.89 0.60 0.59 1.09 1.03 0.34 0.36 0.67 0.79 30.98
Med 3.01 2.90 3.52 3.73 3.55 3.26 3.56 3.68 3.22 3.13 4.00 3.36 44.05
Avg 3.40 3.15 3.77 3.84 3.74 3.56 3.94 4.03 3.82 3.80 3.99 3.79 44.84
Stdev 1.78 1.23 1.74 1.73 1.75 1.86 1.73 2.12 2.25 2.19 1.86 1.74 7.29
5th% 1.24 1.44 1.43 1.55 1.35 1.36 1.71 1.51 1.23 1.19 1.24 1.40 34.84
95th% 6.37 5.08 7.23 6.31 6.32 6.56 6.55 7.83 8.39 7.77 6.96 6.99 57.96

14
Table 5. Intensities and Return Periods of 15-minute Rainfall Accumulations (in) 1971-1994.(Ogden, 1998)
Average Recurrence Interval(years)
15-minute rainfallaccumulation (in)
Average rainfall rate over the15 minute period (in/h)
2 0.55 2.2
5 0.75 3.0
10 0.87 3.48
25 1.02 4.08
50 1.12 4.48
100 1.21 4.84

15
W eekEnding 1 2 3 4 5 6 7 8 9 10 11 12 13 14 15 16 17 18 19 20 21 22 23 24 25 26 27 28 29 30 31
7-Jan 75.8 58.7 44.0 32.8 24.1 17.6 12.7 8.8 6.1 4.3 3.1 2.2 1.5 1.1 0.8 0.6 0.4 0.3 0.2 0.1 0.0 0.0 0.0 0.0 0.0 0.0 0.0 0.0 0.0 0.0 0.014-Jan 77.4 61.7 48.7 38.2 30.2 23.9 18.8 14.7 11.5 8.9 6.5 4.5 2.8 1.6 0.8 0.4 0.2 0.1 0.1 0.0 0.0 0.0 0.0 0.0 0.0 0.0 0.0 0.0 0.0 0.0 0.021-Jan 77.7 61.8 48.9 38.4 30.6 24.4 19.4 15.8 13.3 11.4 9.7 8.0 6.4 4.8 3.3 2.2 1.5 0.9 0.6 0.4 0.2 0.1 0.0 0.0 0.0 0.0 0.0 0.0 0.0 0.0 0.028-Jan 76.7 59.7 45.6 34.5 26.5 20.2 15.9 12.9 10.8 9.3 8.0 6.9 6.0 5.3 4.6 4.0 3.4 2.9 2.4 2.0 1.6 1.3 0.9 0.6 0.3 0.1 0.1 0.0 0.0 0.0 0.04-Feb 75.7 58.2 44.2 33.3 25.5 19.2 15.0 12.0 9.6 7.7 6.3 5.2 4.3 3.6 3.2 2.8 2.4 2.1 1.9 1.6 1.4 1.2 1.0 0.8 0.6 0.3 0.3 0.2 0.1 0.0 0.0
11-Feb 76.4 59.5 45.1 33.7 25.0 17.9 13.3 10.1 7.5 5.6 4.4 3.6 3.0 2.7 2.4 2.1 1.8 1.5 1.2 1.0 0.8 0.6 0.4 0.3 0.2 0.1 0.1 0.1 0.0 0.0 0.018-Feb 77.1 60.5 46.2 35.2 26.5 19.8 15.3 11.7 8.7 6.2 4.5 3.2 2.2 1.6 1.3 1.1 0.9 0.8 0.7 0.5 0.4 0.3 0.2 0.1 0.1 0.0 0.0 0.0 0.0 0.0 0.025-Feb 78.2 62.4 49.1 38.4 29.6 23.0 18.2 14.7 11.7 9.3 7.3 5.9 4.5 3.4 2.6 2.0 1.4 1.0 0.8 0.6 0.5 0.3 0.2 0.1 0.1 0.0 0.0 0.0 0.0 0.0 0.04-Mar 77.1 61.2 47.6 37.1 28.9 22.6 17.8 14.4 11.5 9.2 7.4 6.0 4.7 3.7 2.9 2.2 1.5 1.0 0.8 0.7 0.6 0.5 0.4 0.2 0.2 0.1 0.0 0.0 0.0 0.0 0.0
11-Mar 76.4 60.6 47.4 36.7 28.5 21.9 16.5 12.4 9.2 6.9 5.3 4.1 3.2 2.5 1.9 1.4 0.9 0.6 0.4 0.3 0.3 0.2 0.2 0.1 0.1 0.0 0.0 0.0 0.0 0.0 0.018-Mar 74.3 56.4 42.0 31.1 23.4 17.8 13.6 10.4 8.1 6.3 5.1 4.0 3.3 2.8 2.3 1.8 1.3 0.9 0.7 0.5 0.4 0.3 0.2 0.1 0.0 0.0 0.0 0.0 0.0 0.0 0.025-Mar 76.5 59.7 45.5 34.1 25.7 19.8 15.5 11.9 9.1 7.0 5.5 4.4 3.6 3.0 2.6 2.0 1.6 1.3 1.1 0.9 0.7 0.6 0.4 0.3 0.2 0.1 0.1 0.1 0.0 0.0 0.01-Apr 75.3 58.2 44.6 33.7 26.1 20.6 16.4 13.0 10.2 7.9 6.1 4.5 3.2 2.4 2.0 1.6 1.2 0.9 0.7 0.5 0.4 0.3 0.2 0.2 0.1 0.1 0.1 0.1 0.0 0.0 0.08-Apr 75.5 58.4 44.8 33.9 26.0 20.1 15.4 11.9 9.4 7.5 6.2 5.0 4.0 3.2 2.7 2.3 1.8 1.4 1.0 0.7 0.5 0.3 0.2 0.1 0.1 0.0 0.0 0.0 0.0 0.0 0.015-Apr 76.8 60.8 48.0 37.8 30.4 24.6 20.1 16.6 13.7 11.4 9.6 7.8 6.4 5.1 4.2 3.5 3.0 2.5 2.2 1.8 1.5 1.3 1.0 0.7 0.6 0.4 0.2 0.1 0.0 0.0 0.022-Apr 76.4 60.7 47.9 37.6 29.7 23.7 19.2 16.1 13.6 11.6 10.1 8.8 7.5 6.3 5.4 4.4 3.5 2.7 2.2 1.8 1.4 1.2 1.0 0.8 0.7 0.5 0.4 0.3 0.1 0.1 0.029-Apr 76.9 61.3 48.2 38.0 29.7 23.2 18.1 14.1 11.1 8.7 7.1 5.8 4.8 3.9 3.3 2.7 2.2 1.7 1.3 1.0 0.8 0.6 0.4 0.3 0.2 0.2 0.1 0.1 0.1 0.0 0.06-May 76.4 60.4 47.7 37.9 30.4 24.9 20.4 16.4 12.8 10.0 8.0 6.2 4.5 3.3 2.3 1.7 1.3 1.0 0.8 0.6 0.5 0.4 0.2 0.1 0.1 0.0 0.0 0.0 0.0 0.0 0.013-May 75.5 58.6 44.7 34.2 26.3 20.6 16.5 13.1 10.4 8.4 6.8 5.6 4.5 3.7 3.0 2.2 1.7 1.2 0.9 0.6 0.5 0.3 0.2 0.1 0.1 0.0 0.0 0.0 0.0 0.0 0.020-May 74.3 56.3 42.0 30.8 22.5 16.7 12.7 9.4 6.9 5.0 3.7 2.9 2.3 1.9 1.6 1.3 1.1 0.9 0.7 0.5 0.4 0.2 0.2 0.2 0.1 0.1 0.0 0.0 0.0 0.0 0.027-May 77.0 60.6 47.1 35.9 27.4 21.1 16.0 11.9 8.6 6.1 4.5 3.2 2.3 1.7 1.3 1.0 0.7 0.6 0.4 0.3 0.2 0.1 0.1 0.0 0.0 0.0 0.0 0.0 0.0 0.0 0.03-Jun 77.3 61.1 47.9 37.3 29.4 23.6 18.7 14.6 11.4 8.6 6.2 4.5 3.2 2.3 1.5 1.1 0.8 0.6 0.4 0.3 0.2 0.1 0.0 0.0 0.0 0.0 0.0 0.0 0.0 0.0 0.010-Jun 79.9 65.3 52.8 42.4 34.1 27.4 21.9 17.4 13.9 11.4 9.2 7.4 5.8 4.6 3.5 2.6 1.9 1.3 0.9 0.6 0.4 0.2 0.1 0.0 0.0 0.0 0.0 0.0 0.0 0.0 0.017-Jun 80.3 66.3 54.3 44.2 36.0 29.1 23.6 19.1 15.7 13.1 11.1 9.4 7.9 6.5 5.2 4.4 3.8 3.3 2.9 2.5 2.0 1.6 1.2 0.8 0.5 0.2 0.1 0.1 0.0 0.0 0.024-Jun 80.4 65.9 53.9 44.1 36.1 29.5 24.4 20.4 17.2 14.6 12.3 10.4 8.7 7.4 6.2 5.3 4.7 4.1 3.7 3.2 2.9 2.6 2.2 1.9 1.6 1.3 1.1 0.9 0.7 0.5 0.31-Jul 80.4 65.5 53.6 43.7 35.3 28.5 22.9 18.7 15.4 12.8 10.8 9.3 8.0 6.9 6.1 5.3 4.6 4.0 3.5 3.2 2.9 2.7 2.5 2.3 2.0 1.9 1.7 1.6 1.5 1.3 1.28-Jul 81.3 66.6 54.6 44.2 35.8 29.1 23.6 19.0 15.3 12.3 10.1 8.3 7.0 6.0 5.1 4.5 3.9 3.4 3.1 2.8 2.6 2.4 2.2 2.0 1.8 1.6 1.4 1.3 1.2 1.1 1.015-Jul 80.2 65.1 52.4 41.7 33.6 27.4 22.4 18.3 14.9 12.1 9.8 7.8 6.3 5.3 4.4 3.8 3.2 2.7 2.2 1.9 1.5 1.3 1.1 1.0 0.9 0.8 0.6 0.6 0.5 0.4 0.322-Jul 80.0 64.8 51.9 41.0 32.4 25.7 20.4 16.2 12.7 10.3 8.4 7.0 5.8 4.8 3.9 3.2 2.6 2.2 1.7 1.4 1.1 0.9 0.6 0.5 0.3 0.2 0.2 0.2 0.1 0.1 0.129-Jul 79.7 64.2 51.5 40.9 31.9 25.1 19.6 15.3 11.7 9.3 7.5 5.9 4.8 4.0 3.4 2.8 2.5 2.1 1.7 1.4 1.2 1.0 0.8 0.7 0.6 0.4 0.3 0.2 0.1 0.1 0.05-Aug 79.9 65.2 53.1 43.2 34.4 27.4 21.5 16.8 12.8 9.8 7.5 5.6 4.2 3.2 2.4 1.9 1.6 1.4 1.2 0.9 0.7 0.6 0.5 0.5 0.4 0.3 0.3 0.2 0.1 0.1 0.012-Aug 79.0 64.5 52.3 42.6 34.5 27.6 22.0 17.5 13.9 10.9 8.4 6.5 5.0 3.9 3.0 2.5 1.9 1.5 1.2 1.0 0.9 0.7 0.6 0.5 0.4 0.3 0.2 0.1 0.1 0.0 0.019-Aug 80.2 65.7 53.1 43.3 34.9 28.0 22.4 17.9 14.3 11.6 9.2 7.3 5.7 4.4 3.3 2.6 1.9 1.5 1.3 1.0 0.9 0.7 0.6 0.4 0.3 0.3 0.2 0.2 0.1 0.0 0.026-Aug 81.5 67.4 54.8 44.5 36.1 29.2 23.6 19.3 15.9 13.1 10.7 8.5 6.7 5.2 3.8 2.7 1.8 1.3 1.0 0.7 0.6 0.4 0.3 0.2 0.1 0.1 0.1 0.0 0.0 0.0 0.02-Sep 83.3 69.9 57.6 47.0 38.8 32.1 26.4 22.0 18.5 15.7 13.3 11.3 9.7 8.1 6.6 5.3 4.3 3.5 2.7 2.2 1.8 1.5 1.2 0.9 0.7 0.5 0.4 0.3 0.2 0.1 0.19-Sep 84.6 72.7 62.1 52.7 44.5 37.6 31.4 26.1 21.5 17.6 14.4 12.0 10.1 8.5 7.2 6.0 5.1 4.4 3.8 3.3 2.9 2.6 2.3 2.1 1.8 1.5 1.2 1.0 0.7 0.6 0.4
16-Sep 80.0 66.1 54.9 45.8 38.3 32.2 27.2 23.4 20.0 17.0 14.3 12.1 10.3 8.7 7.4 6.2 5.0 3.9 3.2 2.6 2.2 1.8 1.5 1.3 1.1 1.0 0.8 0.7 0.5 0.4 0.423-Sep 78.5 63.4 50.5 39.8 31.8 25.6 20.8 17.4 14.9 12.9 11.3 10.0 8.8 7.7 7.0 6.2 5.5 4.7 4.0 3.5 2.9 2.4 1.9 1.4 1.0 0.7 0.5 0.4 0.2 0.1 0.130-Sep 79.0 65.0 52.5 41.9 33.0 25.6 19.9 15.8 12.9 10.6 9.1 8.0 7.1 6.4 5.8 5.4 4.9 4.3 3.9 3.4 3.0 2.5 2.2 1.9 1.7 1.4 1.1 0.8 0.5 0.3 0.17-Oct 81.6 68.0 55.7 45.3 36.3 28.5 22.4 17.8 14.0 11.0 8.8 7.1 5.8 4.7 3.9 3.4 3.0 2.6 2.3 2.1 1.8 1.5 1.2 1.0 0.9 0.7 0.6 0.5 0.4 0.2 0.2
14-Oct 83.0 70.6 59.4 50.0 42.1 35.1 29.2 24.2 19.8 15.9 12.8 10.3 8.2 6.2 4.8 3.8 2.9 2.2 1.7 1.4 1.1 0.9 0.6 0.5 0.4 0.3 0.2 0.1 0.1 0.1 0.121-Oct 82.6 70.5 59.7 50.8 43.4 36.8 31.1 26.7 22.6 18.9 15.9 13.4 11.3 9.7 8.3 7.0 5.9 5.0 4.2 3.5 2.8 2.2 1.8 1.4 1.2 0.9 0.7 0.5 0.3 0.2 0.228-Oct 80.7 67.8 56.9 47.4 39.6 33.0 27.4 22.7 18.6 15.3 12.7 10.4 8.6 7.4 6.5 5.6 4.9 4.4 4.0 3.5 3.1 2.7 2.4 2.0 1.7 1.4 1.1 0.9 0.7 0.6 0.54-Nov 77.8 63.5 51.8 42.0 34.5 28.7 23.7 19.7 16.1 13.2 10.9 9.0 7.6 6.5 5.7 4.9 4.1 3.4 2.9 2.4 1.9 1.6 1.3 1.1 0.9 0.8 0.7 0.6 0.6 0.5 0.411-Nov 76.7 61.4 49.1 38.7 30.1 23.5 18.5 14.9 12.2 10.1 8.4 6.9 5.8 5.0 4.5 4.0 3.5 3.1 2.7 2.3 2.0 1.7 1.3 1.0 0.8 0.7 0.6 0.6 0.5 0.5 0.518-Nov 77.5 62.6 50.4 40.4 32.3 25.5 20.2 16.3 13.2 10.7 8.8 7.0 5.6 4.6 3.8 3.3 2.9 2.4 2.0 1.6 1.3 1.2 1.0 0.8 0.7 0.6 0.5 0.4 0.2 0.2 0.225-Nov 76.1 59.3 46.4 36.4 29.0 23.1 18.6 15.3 12.6 10.4 8.6 6.9 5.7 4.6 3.7 3.0 2.4 2.0 1.6 1.3 1.0 0.8 0.7 0.5 0.4 0.3 0.2 0.1 0.1 0.1 0.12-Dec 76.9 60.5 47.4 36.9 28.9 22.3 17.3 13.4 10.1 7.7 6.1 4.6 3.6 2.8 2.3 1.8 1.4 1.1 0.8 0.6 0.5 0.5 0.4 0.3 0.2 0.2 0.1 0.1 0.0 0.0 0.09-Dec 74.4 57.3 43.6 33.5 25.8 19.7 15.3 11.9 9.1 7.1 5.7 4.4 3.2 2.4 1.8 1.2 0.8 0.5 0.3 0.2 0.1 0.1 0.1 0.1 0.1 0.0 0.0 0.0 0.0 0.0 0.0
16-Dec 75.5 58.1 43.3 31.9 23.1 17.0 12.6 9.4 7.2 5.6 4.3 3.3 2.4 1.7 1.2 0.8 0.5 0.2 0.2 0.1 0.0 0.0 0.0 0.0 0.0 0.0 0.0 0.0 0.0 0.0 0.023-Dec 76.0 58.7 43.9 31.8 23.3 17.7 13.3 9.9 7.5 6.0 4.7 3.8 3.0 2.4 1.7 1.1 0.7 0.3 0.2 0.0 0.0 0.0 0.0 0.0 0.0 0.0 0.0 0.0 0.0 0.0 0.031-Dec 74.9 57.3 42.4 31.2 22.9 16.8 12.0 8.4 6.1 4.8 3.7 2.9 2.3 1.8 1.4 1.1 0.8 0.5 0.3 0.1 0.0 0.0 0.0 0.0 0.0 0.0 0.0 0.0 0.0 0.0 0.0
Avg for Yr 78.1 62.6 49.7 39.2 31.1 24.7 19.6 15.7 12.6 10.2 8.3 6.7 5.4 4.5 3.6 3.0 2.5 2.0 1.7 1.4 1.1 0.9 0.8 0.6 0.5 0.4 0.3 0.3 0.2 0.1 0.1
Number of Consecutive Dry Days
Table 6. Probability (percent) of Number of Consecutive Dry Days following any Day in a given Week. Region 1.

16
W eekEnding 1 2 3 4 5 6 7 8 9 10 11 12 13 14 15 16 17 18 19 20 21 22 23 24 25 26 27 28 29 30 31
7-Jan 77.4 61.0 46.9 35.3 26.8 20.0 14.7 10.8 7.9 5.9 4.4 3.3 2.5 2.0 1.6 1.3 1.1 0.9 0.8 0.6 0.4 0.3 0.2 0.1 0.1 0.0 0.0 0.0 0.0 0.0 0.014-Jan 78.5 63.2 50.1 39.1 30.6 24.0 18.5 14.2 10.7 8.2 6.1 4.3 2.9 1.9 1.3 1.0 0.6 0.5 0.4 0.2 0.2 0.1 0.1 0.0 0.0 0.0 0.0 0.0 0.0 0.0 0.021-Jan 78.0 62.7 49.7 39.5 31.5 25.2 20.1 16.4 13.6 11.4 9.7 8.0 6.4 5.0 3.9 2.9 2.2 1.8 1.4 1.0 0.8 0.5 0.4 0.3 0.2 0.1 0.0 0.0 0.0 0.0 0.028-Jan 76.9 60.7 47.1 37.0 28.8 22.7 18.3 15.2 12.9 11.2 9.9 8.9 8.0 7.3 6.5 5.8 5.1 4.5 3.9 3.3 2.8 2.4 1.9 1.6 1.2 0.9 0.7 0.6 0.4 0.3 0.24-Feb 77.3 60.4 46.5 36.0 28.3 22.3 17.9 14.6 12.2 10.2 8.7 7.5 6.5 5.9 5.3 4.8 4.5 4.1 3.9 3.5 3.3 3.0 2.7 2.3 1.8 1.4 1.2 1.0 0.8 0.5 0.4
11-Feb 78.6 62.6 48.7 37.3 28.3 21.4 16.3 12.6 9.9 7.9 6.6 5.7 4.9 4.3 3.9 3.5 3.2 2.9 2.6 2.4 2.3 2.2 2.1 2.0 1.8 1.6 1.4 1.3 1.1 0.8 0.618-Feb 77.5 61.8 48.6 37.9 29.7 23.6 18.7 14.6 11.3 8.7 6.7 5.2 4.0 3.2 2.6 2.2 1.9 1.6 1.3 1.2 1.1 1.0 0.9 0.9 0.8 0.8 0.7 0.7 0.6 0.5 0.525-Feb 76.8 60.5 47.4 36.9 29.2 23.1 18.6 15.0 12.1 9.8 8.0 6.5 5.3 4.2 3.4 2.8 2.2 1.9 1.5 1.3 1.0 0.8 0.6 0.5 0.3 0.2 0.2 0.2 0.2 0.2 0.14-Mar 76.6 60.3 46.9 36.6 28.5 22.3 17.5 13.9 11.1 8.9 6.8 5.4 4.3 3.5 2.9 2.3 1.8 1.4 1.1 0.9 0.7 0.6 0.4 0.3 0.2 0.1 0.1 0.1 0.0 0.0 0.0
11-Mar 76.4 60.3 47.4 37.0 28.7 22.0 16.6 12.1 8.9 6.5 4.9 3.8 2.9 2.3 1.8 1.4 1.1 0.8 0.6 0.4 0.3 0.2 0.2 0.1 0.1 0.0 0.0 0.0 0.0 0.0 0.018-Mar 75.0 57.4 43.7 33.3 25.6 20.1 15.8 12.1 9.5 7.4 5.9 4.7 3.8 3.1 2.5 2.0 1.4 1.0 0.8 0.6 0.4 0.3 0.2 0.1 0.0 0.0 0.0 0.0 0.0 0.0 0.0
25-Mar 76.3 59.0 44.5 32.6 23.9 18.0 14.0 10.8 8.4 6.8 5.6 4.7 3.9 3.3 2.7 2.3 1.9 1.4 1.1 0.9 0.8 0.6 0.5 0.4 0.3 0.2 0.1 0.1 0.0 0.0 0.01-Apr 74.6 57.1 43.1 32.4 24.2 18.3 14.1 10.4 7.9 5.9 4.4 3.3 2.6 2.0 1.7 1.5 1.2 0.9 0.6 0.5 0.4 0.3 0.2 0.2 0.1 0.1 0.1 0.1 0.1 0.0 0.08-Apr 74.0 56.4 42.5 31.8 24.1 18.4 14.0 10.3 7.7 6.0 4.5 3.3 2.4 1.7 1.3 1.0 0.8 0.6 0.3 0.2 0.2 0.1 0.1 0.1 0.0 0.0 0.0 0.0 0.0 0.0 0.0
15-Apr 75.3 59.1 46.4 36.3 29.0 23.4 18.9 15.1 12.1 9.6 7.6 5.9 4.5 3.3 2.5 2.0 1.6 1.2 1.0 0.7 0.5 0.3 0.2 0.1 0.1 0.0 0.0 0.0 0.0 0.0 0.022-Apr 75.0 58.7 45.6 35.5 27.9 21.9 17.8 14.7 12.2 10.1 8.5 7.2 5.9 4.8 3.6 2.7 1.9 1.3 0.9 0.6 0.5 0.3 0.3 0.2 0.1 0.0 0.0 0.0 0.0 0.0 0.029-Apr 74.9 58.5 45.0 34.3 26.3 19.8 15.1 11.4 8.6 6.5 5.1 4.1 3.1 2.5 1.9 1.4 1.0 0.7 0.5 0.3 0.2 0.2 0.1 0.1 0.0 0.0 0.0 0.0 0.0 0.0 0.06-May 75.0 58.6 45.5 35.2 27.6 21.6 16.8 12.6 9.2 6.9 5.2 3.8 2.7 2.0 1.3 0.9 0.7 0.5 0.4 0.3 0.2 0.2 0.1 0.1 0.1 0.0 0.0 0.0 0.0 0.0 0.013-May 73.4 56.5 43.0 32.7 25.4 20.1 15.9 12.3 9.4 7.3 5.6 4.4 3.5 2.8 2.2 1.7 1.3 1.0 0.7 0.5 0.3 0.1 0.1 0.0 0.0 0.0 0.0 0.0 0.0 0.0 0.020-May 72.9 55.1 41.3 31.0 23.6 18.4 14.4 11.1 8.5 6.5 4.9 3.8 3.0 2.4 2.0 1.6 1.3 1.0 0.8 0.6 0.4 0.2 0.1 0.1 0.0 0.0 0.0 0.0 0.0 0.0 0.027-May 74.7 57.8 44.0 33.3 25.5 20.0 15.5 11.9 8.9 6.6 5.1 4.0 3.2 2.7 2.2 1.8 1.4 1.0 0.7 0.5 0.3 0.2 0.1 0.1 0.0 0.0 0.0 0.0 0.0 0.0 0.03-Jun 75.0 58.0 44.2 33.5 25.9 20.5 16.1 12.6 9.7 7.2 5.3 3.9 2.8 2.1 1.6 1.3 1.0 0.7 0.5 0.4 0.3 0.2 0.1 0.0 0.0 0.0 0.0 0.0 0.0 0.0 0.010-Jun 76.3 60.0 46.4 35.8 27.4 20.9 16.3 12.9 10.2 8.1 6.4 5.1 3.9 3.0 2.2 1.7 1.2 0.8 0.6 0.4 0.2 0.1 0.0 0.0 0.0 0.0 0.0 0.0 0.0 0.0 0.0
17-Jun 77.2 61.1 48.0 37.6 29.4 22.8 17.8 14.0 11.1 8.8 7.0 5.7 4.7 3.9 3.2 2.7 2.2 1.8 1.5 1.2 0.9 0.6 0.4 0.3 0.2 0.1 0.1 0.0 0.0 0.0 0.024-Jun 77.0 60.3 47.3 37.2 29.5 23.6 19.2 15.7 12.9 10.6 8.5 6.9 5.6 4.7 3.9 3.3 2.8 2.4 2.0 1.7 1.4 1.1 0.9 0.7 0.6 0.5 0.4 0.3 0.2 0.1 0.01-Jul 76.5 59.5 46.4 35.9 27.6 21.4 16.7 13.2 10.7 8.8 7.2 5.9 4.8 4.1 3.5 3.1 2.6 2.3 1.9 1.5 1.2 1.0 0.7 0.5 0.4 0.3 0.2 0.2 0.1 0.0 0.08-Jul 77.7 61.7 48.5 37.5 28.9 22.0 16.7 12.7 9.8 7.6 6.0 4.8 3.9 3.3 2.8 2.5 2.3 2.1 1.9 1.7 1.5 1.2 1.0 0.8 0.7 0.5 0.3 0.2 0.2 0.1 0.015-Jul 77.3 61.0 47.7 36.8 28.6 22.2 17.2 13.2 10.0 7.7 5.8 4.4 3.3 2.5 2.0 1.6 1.4 1.2 1.0 0.9 0.8 0.7 0.6 0.6 0.5 0.4 0.3 0.3 0.2 0.2 0.222-Jul 76.4 59.7 46.2 34.8 26.2 19.8 14.8 10.9 8.1 6.2 4.7 3.6 2.8 2.1 1.6 1.2 0.9 0.8 0.6 0.5 0.5 0.4 0.4 0.3 0.3 0.3 0.2 0.2 0.2 0.1 0.129-Jul 76.5 59.6 46.0 34.6 25.7 19.0 13.8 9.9 7.4 5.5 4.1 3.0 2.1 1.5 1.0 0.7 0.5 0.3 0.2 0.2 0.2 0.2 0.1 0.1 0.1 0.1 0.1 0.1 0.1 0.0 0.05-Aug 77.2 60.9 47.7 36.8 28.2 21.8 16.8 12.7 9.7 7.3 5.4 3.8 2.6 1.8 1.2 0.8 0.6 0.4 0.3 0.2 0.1 0.1 0.1 0.0 0.0 0.0 0.0 0.0 0.0 0.0 0.012-Aug 76.3 60.3 47.1 36.3 28.0 21.5 16.6 12.8 10.2 8.1 6.2 4.6 3.3 2.3 1.6 1.2 0.8 0.6 0.4 0.4 0.3 0.2 0.1 0.1 0.0 0.0 0.0 0.0 0.0 0.0 0.019-Aug 78.4 63.1 50.0 39.5 31.3 24.6 19.2 14.9 11.5 8.8 6.7 5.0 3.6 2.5 1.7 1.2 0.8 0.6 0.4 0.4 0.3 0.3 0.2 0.2 0.1 0.1 0.1 0.1 0.1 0.1 0.026-Aug 80.1 66.2 54.2 44.1 36.1 29.5 24.4 20.2 16.7 13.7 11.1 8.8 6.7 5.1 3.6 2.5 1.8 1.3 1.0 0.7 0.5 0.4 0.3 0.2 0.1 0.1 0.1 0.1 0.1 0.0 0.0
2-Sep 81.1 67.7 56.0 46.1 38.0 31.3 26.1 22.0 18.4 15.4 12.8 10.8 9.0 7.4 6.1 4.9 4.0 3.3 2.7 2.2 1.8 1.4 1.0 0.7 0.5 0.3 0.2 0.1 0.1 0.0 0.09-Sep 82.8 70.5 59.6 50.1 42.0 34.9 29.0 24.2 20.2 16.7 13.8 11.3 9.2 7.7 6.4 5.4 4.6 4.0 3.6 3.2 2.9 2.6 2.3 1.9 1.5 1.2 0.9 0.6 0.4 0.3 0.2
16-Sep 78.6 64.4 52.7 43.3 35.9 29.5 24.4 20.1 16.8 14.0 11.6 9.5 7.9 6.8 5.6 4.7 3.8 3.1 2.6 2.3 2.1 1.9 1.7 1.5 1.3 1.1 0.9 0.8 0.6 0.5 0.423-Sep 78.0 62.6 49.5 39.0 31.2 24.8 19.8 15.8 12.9 10.8 8.8 7.2 5.9 4.9 4.2 3.5 2.9 2.5 2.1 1.9 1.7 1.5 1.4 1.2 1.0 0.9 0.8 0.7 0.6 0.5 0.430-Sep 79.5 65.3 52.6 42.0 33.6 26.8 21.3 16.9 13.6 10.9 8.7 6.9 5.7 4.7 3.9 3.3 2.8 2.3 1.9 1.5 1.3 1.1 1.0 0.8 0.7 0.5 0.4 0.4 0.4 0.3 0.37-Oct 80.5 66.9 55.0 44.5 35.4 28.1 22.3 17.8 14.5 11.6 9.3 7.3 5.9 4.7 3.8 3.0 2.5 2.0 1.6 1.3 1.1 0.9 0.7 0.5 0.3 0.2 0.1 0.1 0.1 0.1 0.1
14-Oct 82.7 70.5 59.7 50.0 41.6 34.5 28.2 22.8 18.3 14.5 11.5 9.2 7.5 5.8 4.6 3.7 2.9 2.2 1.7 1.4 1.2 1.0 0.8 0.6 0.4 0.2 0.1 0.0 0.0 0.0 0.021-Oct 82.1 69.9 59.2 50.0 42.3 35.8 30.4 25.8 21.5 17.7 14.4 11.9 10.0 8.5 7.2 6.1 5.1 4.2 3.4 2.8 2.2 1.8 1.5 1.2 1.0 0.8 0.6 0.5 0.4 0.3 0.228-Oct 81.5 68.9 57.8 47.8 39.2 32.1 26.3 21.8 17.9 14.8 12.2 10.0 8.3 7.1 6.1 5.3 4.6 4.0 3.5 3.2 2.8 2.5 2.2 1.9 1.6 1.3 1.1 0.9 0.8 0.6 0.54-Nov 78.5 64.7 53.4 43.9 36.2 30.2 25.0 20.7 16.9 13.7 11.1 9.0 7.4 6.4 5.5 4.7 4.1 3.5 2.9 2.4 2.0 1.6 1.3 1.1 1.0 0.9 0.8 0.7 0.6 0.6 0.511-Nov 77.1 61.8 49.4 39.3 31.1 24.4 19.4 15.8 13.0 10.7 8.8 7.2 5.8 5.0 4.4 3.8 3.3 2.9 2.5 2.2 1.9 1.5 1.1 0.9 0.8 0.7 0.6 0.6 0.5 0.5 0.5
18-Nov 77.3 61.5 48.7 38.3 30.3 23.8 18.8 15.0 11.9 9.5 7.6 5.9 4.5 3.4 2.5 2.1 1.8 1.5 1.3 1.1 1.0 0.8 0.7 0.6 0.5 0.5 0.4 0.3 0.3 0.2 0.225-Nov 76.3 59.7 46.4 35.7 27.9 21.6 17.1 13.8 11.2 9.2 7.5 6.1 4.9 3.9 2.8 2.1 1.6 1.2 1.0 0.7 0.6 0.4 0.2 0.2 0.2 0.1 0.1 0.1 0.1 0.1 0.12-Dec 76.5 59.6 46.0 35.2 27.2 20.9 16.3 12.7 9.7 7.3 5.6 4.3 3.3 2.7 2.0 1.6 1.2 0.8 0.6 0.5 0.4 0.3 0.2 0.2 0.1 0.0 0.0 0.0 0.0 0.0 0.09-Dec 75.3 58.4 44.8 34.6 26.6 20.4 15.8 12.4 9.6 7.4 5.6 4.2 3.1 2.3 1.6 1.1 0.7 0.4 0.3 0.2 0.1 0.1 0.1 0.0 0.0 0.0 0.0 0.0 0.0 0.0 0.0
16-Dec 75.4 58.8 44.9 33.9 25.3 18.8 14.2 10.8 8.3 6.5 4.9 3.7 2.7 2.0 1.4 0.9 0.6 0.4 0.3 0.1 0.1 0.1 0.0 0.0 0.0 0.0 0.0 0.0 0.0 0.0 0.023-Dec 76.6 60.4 46.6 35.5 26.7 20.2 15.3 11.3 8.6 6.5 5.1 3.9 3.0 2.2 1.7 1.2 0.9 0.5 0.4 0.2 0.2 0.1 0.0 0.0 0.0 0.0 0.0 0.0 0.0 0.0 0.031-Dec 77.0 60.7 46.6 35.1 26.7 20.0 14.9 11.1 8.5 6.6 5.3 4.3 3.5 2.8 2.3 1.9 1.6 1.3 1.0 0.7 0.6 0.4 0.2 0.2 0.1 0.0 0.0 0.0 0.0 0.0 0.0
Avg for Yr 77.2 61.4 48.3 37.8 29.7 23.4 18.5 14.6 11.6 9.2 7.4 5.9 4.7 3.8 3.1 2.5 2.0 1.7 1.4 1.1 0.9 0.8 0.6 0.5 0.4 0.3 0.3 0.2 0.2 0.1 0.1
Number of Consecutive Dry Days
Table 7. Probability (percent) of Number of Consecutive Dry Days following any Day in a given Week. Region 2.
17
W eekEnding 1 2 3 4 5 6 7 8 9 10 11 12 13 14 15 16 17 18 19 20 21 22 23 24 25 26 27 28 29 30 31
7-Jan 77.6 61.5 47.6 36.4 27.8 20.7 15.3 11.2 8.4 6.4 4.8 3.5 2.4 1.7 1.2 0.8 0.5 0.4 0.3 0.1 0.1 0.0 0.0 0.0 0.0 0.0 0.0 0.0 0.0 0.0 0.014-Jan 78.7 63.1 50.0 39.1 30.9 24.4 19.0 14.7 11.4 8.9 6.8 4.8 3.2 1.9 1.3 0.8 0.5 0.3 0.2 0.1 0.1 0.0 0.0 0.0 0.0 0.0 0.0 0.0 0.0 0.0 0.021-Jan 79.0 63.7 50.6 40.4 32.3 26.1 20.9 17.0 14.1 11.9 10.0 8.2 6.5 4.9 3.6 2.8 2.1 1.6 1.2 0.8 0.6 0.3 0.2 0.1 0.0 0.0 0.0 0.0 0.0 0.0 0.028-Jan 78.3 62.5 48.9 38.5 30.3 24.1 19.6 16.2 13.6 11.7 10.0 8.6 7.3 6.4 5.5 4.9 4.3 3.7 3.1 2.6 2.1 1.7 1.3 0.9 0.7 0.5 0.3 0.2 0.1 0.1 0.04-Feb 77.9 61.5 47.8 37.4 29.3 22.9 18.6 15.2 12.6 10.5 8.7 7.2 5.9 5.1 4.3 3.8 3.5 3.2 2.9 2.6 2.3 2.0 1.8 1.5 1.2 0.9 0.7 0.5 0.4 0.2 0.1
11-Feb 78.8 62.9 49.1 37.8 28.7 21.6 16.7 13.0 10.2 8.1 6.5 5.4 4.5 3.9 3.4 3.0 2.7 2.4 2.1 1.9 1.7 1.5 1.3 1.2 1.1 0.9 0.8 0.7 0.6 0.4 0.318-Feb 78.4 62.9 49.7 38.8 30.3 23.9 19.1 15.2 12.0 9.3 7.1 5.5 4.1 3.1 2.5 2.1 1.8 1.5 1.3 1.1 1.0 0.8 0.7 0.6 0.5 0.5 0.4 0.4 0.3 0.3 0.225-Feb 77.7 62.1 49.3 39.1 31.2 25.0 20.3 16.5 13.4 11.0 8.9 7.3 5.8 4.6 3.8 3.2 2.6 2.2 1.8 1.4 1.1 0.8 0.6 0.4 0.3 0.1 0.1 0.1 0.1 0.1 0.14-Mar 77.2 61.4 48.3 38.4 30.4 24.2 19.5 15.7 12.5 10.0 7.8 6.2 4.8 3.8 3.2 2.7 2.2 1.9 1.5 1.2 0.9 0.7 0.5 0.3 0.1 0.0 0.0 0.0 0.0 0.0 0.0
11-Mar 76.5 60.5 47.7 37.8 30.1 23.9 18.6 14.3 11.0 8.3 6.4 5.1 4.0 3.1 2.4 1.9 1.4 1.0 0.7 0.4 0.3 0.2 0.1 0.1 0.0 0.0 0.0 0.0 0.0 0.0 0.018-Mar 75.9 58.7 44.8 34.2 26.4 20.8 16.1 12.5 10.0 7.9 6.3 5.1 4.2 3.5 2.9 2.4 1.9 1.5 1.1 0.8 0.6 0.4 0.3 0.1 0.1 0.0 0.0 0.0 0.0 0.0 0.025-Mar 77.9 61.4 47.3 35.6 26.9 20.7 16.1 12.2 9.4 7.4 6.0 4.9 4.1 3.4 2.8 2.4 1.9 1.6 1.3 1.0 0.9 0.8 0.6 0.5 0.4 0.3 0.2 0.1 0.1 0.1 0.01-Apr 76.0 59.6 46.0 35.7 27.7 21.8 17.4 13.5 10.4 8.1 6.2 4.6 3.5 2.7 2.3 1.8 1.4 1.0 0.7 0.6 0.5 0.4 0.3 0.3 0.3 0.2 0.2 0.2 0.1 0.1 0.18-Apr 76.1 59.9 46.4 36.2 28.4 22.4 17.9 14.1 11.3 9.3 7.5 6.1 4.9 3.9 3.2 2.6 2.0 1.5 1.1 0.7 0.6 0.4 0.3 0.2 0.1 0.1 0.1 0.1 0.1 0.1 0.1
15-Apr 77.7 62.3 49.8 40.2 32.8 27.1 22.6 18.7 15.5 13.0 10.7 9.0 7.5 6.2 5.2 4.5 3.9 3.4 2.9 2.5 2.1 1.6 1.3 1.0 0.7 0.4 0.2 0.1 0.1 0.1 0.122-Apr 76.9 61.3 48.8 38.7 30.9 24.8 20.4 17.0 14.2 12.0 10.2 8.8 7.5 6.4 5.3 4.4 3.6 2.8 2.4 1.9 1.6 1.4 1.1 0.9 0.7 0.5 0.3 0.2 0.1 0.1 0.029-Apr 76.4 61.0 48.6 38.3 30.0 23.3 18.1 13.9 10.7 8.3 6.5 5.2 4.1 3.2 2.6 2.1 1.6 1.2 1.0 0.8 0.6 0.5 0.4 0.3 0.2 0.2 0.1 0.1 0.0 0.0 0.06-May 76.0 60.0 47.4 37.7 30.1 24.2 19.4 15.1 11.6 9.0 7.0 5.4 4.1 3.0 2.2 1.7 1.3 1.0 0.7 0.5 0.3 0.2 0.2 0.2 0.1 0.1 0.1 0.0 0.0 0.0 0.013-May 74.8 58.1 44.4 34.3 26.8 21.3 17.0 13.4 10.5 8.3 6.6 5.3 4.4 3.6 3.0 2.3 1.8 1.4 1.1 0.8 0.5 0.3 0.2 0.2 0.1 0.1 0.1 0.0 0.0 0.0 0.020-May 74.7 57.4 43.2 32.4 24.2 18.4 13.9 10.4 7.7 5.7 4.4 3.5 2.8 2.3 1.9 1.6 1.3 1.1 0.8 0.7 0.5 0.2 0.1 0.1 0.0 0.0 0.0 0.0 0.0 0.0 0.027-May 76.6 60.5 46.9 36.3 28.3 22.1 17.0 12.8 9.4 6.9 4.9 3.6 2.6 2.0 1.6 1.2 0.9 0.7 0.5 0.3 0.2 0.1 0.1 0.0 0.0 0.0 0.0 0.0 0.0 0.0 0.03-Jun 76.3 59.8 46.2 35.3 27.3 21.7 17.1 13.2 10.2 7.7 5.7 4.3 3.1 2.3 1.7 1.3 0.9 0.6 0.4 0.2 0.2 0.1 0.0 0.0 0.0 0.0 0.0 0.0 0.0 0.0 0.010-Jun 77.9 62.7 49.9 39.2 30.6 23.9 18.7 14.5 11.3 8.7 6.6 5.1 3.9 3.0 2.3 1.6 1.0 0.6 0.4 0.2 0.1 0.0 0.0 0.0 0.0 0.0 0.0 0.0 0.0 0.0 0.017-Jun 78.6 63.5 51.1 40.8 32.5 26.0 20.7 16.6 13.3 10.6 8.2 6.4 5.0 3.9 3.0 2.3 1.7 1.3 1.0 0.7 0.5 0.3 0.2 0.1 0.1 0.0 0.0 0.0 0.0 0.0 0.024-Jun 78.8 63.3 50.7 40.4 31.9 25.6 20.7 16.8 13.8 11.3 9.2 7.4 6.1 4.9 3.9 3.1 2.4 1.8 1.4 1.0 0.8 0.5 0.3 0.2 0.2 0.1 0.1 0.1 0.0 0.0 0.01-Jul 78.9 63.4 51.2 40.9 32.3 25.6 20.2 16.1 13.0 10.6 8.5 6.8 5.7 4.7 3.9 3.2 2.5 2.0 1.5 1.1 0.9 0.6 0.4 0.3 0.2 0.2 0.1 0.1 0.1 0.1 0.08-Jul 80.2 65.5 53.4 43.4 35.0 28.0 22.2 17.6 13.9 10.8 8.4 6.5 5.2 4.2 3.5 3.0 2.6 2.2 1.9 1.6 1.3 1.1 0.9 0.7 0.6 0.4 0.3 0.2 0.2 0.1 0.115-Jul 79.1 63.8 51.2 41.0 33.0 26.6 21.6 17.5 14.1 11.2 8.9 6.8 5.1 3.9 3.0 2.4 1.9 1.6 1.2 1.0 0.8 0.7 0.6 0.5 0.4 0.4 0.3 0.2 0.2 0.1 0.122-Jul 79.3 63.7 50.7 39.8 31.1 24.2 18.7 14.6 11.4 8.9 7.1 5.6 4.3 3.3 2.5 1.9 1.5 1.1 0.9 0.7 0.5 0.4 0.3 0.2 0.2 0.1 0.1 0.1 0.1 0.0 0.029-Jul 78.7 62.5 49.6 38.9 30.2 23.1 17.4 13.1 10.1 7.8 6.1 4.6 3.3 2.5 1.8 1.3 1.0 0.8 0.6 0.5 0.3 0.2 0.2 0.1 0.1 0.0 0.0 0.0 0.0 0.0 0.05-Aug 78.9 63.2 50.8 40.7 32.4 25.3 19.7 15.3 11.8 9.0 6.8 4.9 3.5 2.5 1.7 1.1 0.8 0.6 0.5 0.3 0.2 0.2 0.1 0.1 0.0 0.0 0.0 0.0 0.0 0.0 0.0
12-Aug 77.9 62.3 49.7 39.5 31.4 24.8 19.4 15.4 12.3 9.6 7.4 5.4 4.0 2.9 2.2 1.7 1.2 0.9 0.7 0.5 0.3 0.2 0.1 0.0 0.0 0.0 0.0 0.0 0.0 0.0 0.019-Aug 80.2 65.5 53.1 43.2 34.7 27.5 21.7 17.2 13.6 10.6 8.2 6.1 4.6 3.4 2.6 1.9 1.3 0.9 0.7 0.5 0.3 0.2 0.1 0.1 0.1 0.0 0.0 0.0 0.0 0.0 0.026-Aug 81.2 67.6 55.8 46.4 38.4 31.6 26.2 21.7 17.8 14.4 11.5 9.2 7.3 5.8 4.6 3.6 2.9 2.3 1.9 1.5 1.1 0.8 0.6 0.4 0.2 0.1 0.1 0.0 0.0 0.0 0.02-Sep 82.1 68.6 56.6 46.8 38.7 32.0 26.8 22.7 19.1 16.1 13.5 11.4 9.7 8.1 6.7 5.4 4.5 3.8 3.2 2.8 2.4 2.0 1.7 1.3 1.0 0.8 0.6 0.4 0.3 0.2 0.19-Sep 83.6 71.4 60.5 51.0 42.9 35.5 29.6 24.4 20.2 16.7 13.8 11.4 9.6 8.1 6.9 5.9 5.2 4.6 4.1 3.6 3.1 2.7 2.3 1.9 1.7 1.5 1.3 1.1 1.0 0.9 0.8
16-Sep 79.4 65.3 53.4 43.7 36.1 29.3 24.0 19.6 16.2 13.4 10.9 8.8 7.4 6.2 5.1 4.2 3.6 3.1 2.7 2.4 2.1 1.9 1.6 1.4 1.2 1.0 0.9 0.8 0.7 0.7 0.623-Sep 78.4 63.5 50.5 39.7 31.6 24.9 19.5 15.4 12.4 10.1 8.1 6.4 5.1 4.0 3.2 2.6 2.1 1.6 1.3 1.1 1.0 0.8 0.7 0.6 0.5 0.4 0.3 0.3 0.2 0.2 0.230-Sep 79.7 65.7 53.3 42.8 34.2 27.1 21.3 16.8 13.3 10.8 8.8 7.1 5.8 4.7 3.9 3.1 2.5 1.9 1.5 1.1 0.8 0.5 0.4 0.3 0.2 0.2 0.1 0.1 0.1 0.1 0.17-Oct 80.8 67.3 55.4 45.0 35.9 28.5 22.6 18.1 14.5 11.6 9.2 7.2 5.8 4.6 3.7 3.0 2.4 2.0 1.6 1.3 1.0 0.8 0.5 0.4 0.2 0.1 0.0 0.0 0.0 0.0 0.0
14-Oct 82.8 70.6 60.0 50.6 42.4 35.6 29.4 24.2 19.7 15.8 12.6 10.0 7.9 6.1 4.7 3.6 2.7 2.1 1.5 1.2 0.9 0.7 0.5 0.3 0.2 0.1 0.0 0.0 0.0 0.0 0.021-Oct 82.3 69.9 59.2 50.1 42.2 35.9 30.5 26.1 22.0 18.3 15.0 12.4 10.4 8.7 7.3 6.1 5.1 4.2 3.4 2.6 2.0 1.6 1.3 1.1 0.8 0.7 0.5 0.4 0.3 0.2 0.128-Oct 81.9 69.1 57.8 47.8 39.1 31.9 26.0 21.5 17.7 14.6 12.0 9.9 8.2 7.0 6.0 5.2 4.6 4.1 3.6 3.2 2.8 2.5 2.1 1.8 1.5 1.3 1.1 0.9 0.7 0.6 0.54-Nov 79.4 66.0 54.9 45.3 37.2 30.8 25.4 21.0 17.2 13.9 11.5 9.4 7.7 6.6 5.7 4.9 4.3 3.7 3.2 2.8 2.3 2.0 1.7 1.5 1.4 1.3 1.2 1.1 0.9 0.8 0.7
11-Nov 77.5 62.7 51.1 41.0 32.1 24.9 19.9 16.1 13.4 11.1 9.4 7.8 6.5 5.7 5.0 4.3 3.8 3.3 2.9 2.6 2.2 1.9 1.5 1.3 1.3 1.2 1.1 1.0 1.0 1.0 0.918-Nov 78.3 63.2 51.1 41.1 33.0 26.1 20.7 16.4 13.3 10.8 8.9 7.2 5.8 4.7 3.8 3.2 2.8 2.5 2.1 1.8 1.5 1.2 1.0 0.9 0.8 0.8 0.7 0.6 0.5 0.5 0.525-Nov 77.2 61.4 48.7 38.6 31.1 25.0 20.4 16.8 13.9 11.6 9.5 7.7 6.2 5.0 3.8 2.7 2.1 1.6 1.3 1.1 0.9 0.7 0.6 0.5 0.4 0.3 0.3 0.2 0.2 0.1 0.12-Dec 77.0 60.6 47.1 36.1 27.8 21.4 16.7 13.1 10.1 7.8 6.0 4.6 3.6 2.9 2.3 1.8 1.3 1.0 0.7 0.6 0.5 0.4 0.4 0.3 0.3 0.2 0.2 0.2 0.1 0.1 0.19-Dec 75.8 59.6 46.4 35.9 27.6 21.0 16.3 12.8 9.8 7.4 5.6 4.0 2.8 1.9 1.3 0.9 0.6 0.3 0.3 0.2 0.2 0.1 0.1 0.1 0.1 0.1 0.1 0.1 0.1 0.1 0.1
16-Dec 76.2 59.9 46.0 34.7 26.1 19.3 14.4 10.8 8.2 6.2 4.8 3.5 2.5 1.7 1.1 0.7 0.4 0.1 0.1 0.1 0.1 0.1 0.1 0.1 0.0 0.0 0.0 0.0 0.0 0.0 0.023-Dec 77.2 61.1 46.9 35.4 26.5 19.9 14.8 10.7 7.7 5.5 4.0 2.9 2.1 1.4 1.0 0.6 0.4 0.1 0.1 0.0 0.0 0.0 0.0 0.0 0.0 0.0 0.0 0.0 0.0 0.0 0.031-Dec 77.4 61.1 46.8 35.5 27.0 20.1 14.9 10.8 8.1 6.3 4.8 3.5 2.6 1.9 1.3 0.8 0.5 0.3 0.2 0.1 0.0 0.0 0.0 0.0 0.0 0.0 0.0 0.0 0.0 0.0 0.0
vg for Yr 78.3 63.0 50.2 39.9 31.7 25.1 20.0 15.9 12.8 10.2 8.2 6.5 5.2 4.1 3.3 2.7 2.2 1.8 1.4 1.2 1.0 0.8 0.6 0.5 0.4 0.3 0.3 0.2 0.2 0.1 0.1
Number of Consecutive Dry Days
Table 8. Probability (percent) of Number of Consecutive Dry Days following any Day in a given Week. Region 3.

18
W eekEnding 1 2 3 4 5 6 7 8 9 10 11 12 13 14 15 16 17 18 19 20 21 22 23 24 25 26 27 28 29 30 31
7-Jan 78.3 62.2 48.1 36.4 27.7 20.9 15.6 11.6 8.7 6.5 4.8 3.3 2.3 1.7 1.2 0.9 0.7 0.6 0.4 0.2 0.1 0.0 0.0 0.0 0.0 0.0 0.0 0.0 0.0 0.0 0.014-Jan 78.9 63.5 50.4 39.2 30.8 24.3 18.9 14.7 11.4 8.7 6.5 4.5 2.9 1.8 1.2 0.9 0.6 0.4 0.2 0.1 0.0 0.0 0.0 0.0 0.0 0.0 0.0 0.0 0.0 0.0 0.021-Jan 78.6 63.1 49.9 39.0 30.8 24.5 19.2 15.6 12.9 10.9 9.1 7.3 5.8 4.4 3.3 2.5 1.8 1.4 1.1 0.8 0.5 0.4 0.2 0.2 0.1 0.1 0.0 0.0 0.0 0.0 0.028-Jan 77.9 61.7 47.9 37.0 28.6 22.4 17.6 14.1 11.6 9.8 8.2 6.9 5.8 4.9 4.3 3.8 3.3 2.8 2.4 2.1 1.7 1.4 1.1 0.8 0.5 0.4 0.3 0.2 0.1 0.1 0.04-Feb 77.8 61.3 47.7 37.2 29.4 23.2 18.5 15.0 12.1 9.8 7.9 6.2 4.8 3.8 3.2 2.7 2.3 2.0 1.7 1.5 1.4 1.2 1.1 0.9 0.7 0.5 0.4 0.3 0.2 0.1 0.0
11-Feb 78.8 63.0 49.4 38.3 29.4 22.3 17.4 13.8 11.0 8.8 7.1 6.0 4.9 4.2 3.7 3.2 2.7 2.2 1.7 1.3 1.0 0.7 0.6 0.4 0.3 0.2 0.1 0.1 0.1 0.0 0.018-Feb 77.9 62.4 49.6 38.9 30.7 24.1 19.0 15.0 11.7 8.8 6.6 5.3 4.2 3.4 2.8 2.3 1.9 1.6 1.3 1.0 0.7 0.5 0.4 0.2 0.1 0.1 0.1 0.0 0.0 0.0 0.025-Feb 77.7 61.6 48.8 38.7 31.0 24.6 19.7 15.9 12.8 10.3 8.2 6.8 5.5 4.4 3.6 2.9 2.4 2.0 1.8 1.5 1.2 1.0 0.7 0.4 0.2 0.1 0.0 0.0 0.0 0.0 0.04-Mar 77.7 61.9 48.7 38.5 30.3 23.8 19.0 15.2 12.2 9.8 7.8 6.3 5.0 4.2 3.4 2.7 2.0 1.6 1.2 1.0 0.8 0.7 0.6 0.4 0.3 0.1 0.1 0.0 0.0 0.0 0.0
11-Mar 76.9 60.9 48.0 37.6 29.4 22.7 17.2 12.8 9.6 7.0 5.3 4.3 3.4 2.8 2.3 1.9 1.5 1.1 0.9 0.7 0.6 0.5 0.4 0.3 0.2 0.1 0.1 0.0 0.0 0.0 0.018-Mar 75.8 58.5 44.7 34.0 26.0 20.2 15.5 11.7 9.0 6.8 5.2 3.9 3.0 2.3 1.9 1.5 1.1 0.9 0.6 0.4 0.3 0.3 0.2 0.2 0.1 0.1 0.0 0.0 0.0 0.0 0.025-Mar 77.8 60.7 46.2 34.2 25.2 19.2 14.8 11.3 8.6 6.8 5.4 4.3 3.6 2.9 2.5 2.2 1.8 1.5 1.2 1.0 0.7 0.6 0.4 0.3 0.2 0.1 0.1 0.0 0.0 0.0 0.01-Apr 75.8 59.0 44.7 33.6 25.3 19.3 15.2 11.6 8.7 6.5 4.9 3.6 2.6 1.9 1.6 1.3 1.1 0.9 0.7 0.6 0.5 0.4 0.4 0.2 0.1 0.1 0.1 0.0 0.0 0.0 0.08-Apr 75.3 58.7 44.8 33.8 25.8 19.6 15.0 11.1 8.5 6.7 5.1 3.8 2.7 1.9 1.5 1.1 0.8 0.6 0.4 0.3 0.2 0.2 0.1 0.1 0.0 0.0 0.0 0.0 0.0 0.0 0.0
15-Apr 76.9 61.3 48.7 38.6 31.2 25.3 20.7 16.8 13.8 11.6 9.6 7.8 6.3 4.9 3.8 3.0 2.2 1.7 1.3 0.9 0.7 0.5 0.3 0.2 0.1 0.1 0.0 0.0 0.0 0.0 0.022-Apr 76.4 60.2 47.3 37.1 29.7 24.0 19.4 16.1 13.5 11.7 10.2 9.1 8.0 6.8 5.7 4.5 3.3 2.4 1.7 1.2 0.7 0.5 0.4 0.3 0.2 0.1 0.0 0.0 0.0 0.0 0.029-Apr 75.7 59.4 46.1 36.0 28.1 22.0 17.0 12.9 9.8 7.5 6.0 4.8 3.8 3.0 2.4 2.0 1.5 1.1 0.8 0.5 0.4 0.3 0.2 0.1 0.1 0.0 0.0 0.0 0.0 0.0 0.06-May 75.9 59.6 46.5 36.4 28.7 22.9 18.3 14.3 10.8 8.3 6.5 5.0 3.7 2.6 1.7 1.1 0.8 0.5 0.3 0.2 0.1 0.1 0.1 0.0 0.0 0.0 0.0 0.0 0.0 0.0 0.0
13-May 75.4 59.2 45.7 35.3 27.3 21.7 17.4 13.9 11.0 8.8 7.1 5.8 4.8 3.8 3.0 2.3 1.7 1.3 0.9 0.6 0.3 0.1 0.0 0.0 0.0 0.0 0.0 0.0 0.0 0.0 0.020-May 75.2 58.7 45.2 34.9 26.8 21.1 16.5 12.9 10.1 7.9 6.3 5.1 4.1 3.3 2.7 2.2 1.8 1.5 1.2 0.9 0.6 0.3 0.1 0.0 0.0 0.0 0.0 0.0 0.0 0.0 0.027-May 76.8 61.2 48.3 38.4 30.6 24.6 19.7 15.3 11.9 9.3 7.3 5.8 4.6 3.7 3.0 2.4 1.8 1.4 1.0 0.6 0.4 0.2 0.0 0.0 0.0 0.0 0.0 0.0 0.0 0.0 0.03-Jun 75.4 58.9 45.6 35.6 28.2 23.0 18.7 14.9 12.0 9.4 7.2 5.5 4.1 3.0 2.2 1.6 1.2 0.9 0.6 0.5 0.3 0.1 0.0 0.0 0.0 0.0 0.0 0.0 0.0 0.0 0.0
10-Jun 79.3 64.5 51.8 41.4 32.8 26.0 20.8 16.3 13.0 10.3 8.3 6.6 5.3 4.2 3.4 2.6 2.0 1.5 1.0 0.7 0.5 0.3 0.1 0.0 0.0 0.0 0.0 0.0 0.0 0.0 0.017-Jun 80.7 66.9 55.2 45.1 36.6 29.4 23.7 19.2 15.6 12.5 10.1 8.3 7.0 5.8 4.8 3.9 3.1 2.6 2.2 1.8 1.4 1.0 0.7 0.4 0.3 0.2 0.2 0.1 0.1 0.1 0.024-Jun 80.1 65.8 54.3 44.8 37.0 30.6 25.6 21.5 18.0 15.1 12.7 10.7 9.2 7.7 6.4 5.1 4.0 3.1 2.3 1.8 1.4 1.1 0.9 0.7 0.7 0.6 0.5 0.4 0.4 0.3 0.21-Jul 78.8 63.4 51.1 41.5 33.7 27.5 23.1 19.7 17.0 14.7 12.8 11.1 9.9 8.7 7.6 6.6 5.5 4.5 3.6 2.8 2.2 1.6 1.3 1.0 0.7 0.6 0.5 0.4 0.4 0.3 0.38-Jul 80.3 65.7 53.1 42.8 34.2 27.3 21.9 17.5 14.2 11.7 9.9 8.4 7.3 6.4 5.7 5.0 4.4 3.9 3.4 3.0 2.5 2.1 1.8 1.4 1.2 0.8 0.5 0.4 0.3 0.2 0.2
15-Jul 79.9 65.2 52.6 42.6 34.4 27.9 22.7 18.3 14.5 11.4 8.9 7.0 5.5 4.4 3.5 2.8 2.4 2.0 1.7 1.5 1.3 1.1 0.9 0.8 0.7 0.5 0.4 0.3 0.3 0.3 0.222-Jul 80.0 64.9 52.0 41.3 32.2 25.2 19.9 15.6 12.3 9.7 7.6 5.9 4.4 3.3 2.4 1.7 1.3 1.1 0.9 0.7 0.6 0.4 0.4 0.3 0.3 0.2 0.2 0.1 0.1 0.1 0.129-Jul 78.4 62.9 50.1 39.7 31.2 24.6 19.5 15.3 12.3 10.0 8.0 6.3 4.7 3.5 2.5 1.8 1.3 1.0 0.8 0.6 0.4 0.3 0.3 0.2 0.2 0.1 0.1 0.1 0.1 0.0 0.05-Aug 77.9 61.9 49.2 39.0 31.0 24.8 19.9 15.7 12.4 9.8 7.8 6.0 4.5 3.4 2.4 1.9 1.4 1.1 0.8 0.5 0.3 0.3 0.2 0.1 0.1 0.1 0.1 0.1 0.1 0.0 0.0
12-Aug 78.4 62.9 50.3 40.0 31.9 25.5 20.2 16.0 12.6 9.9 7.8 5.8 4.4 3.2 2.3 1.8 1.3 0.9 0.7 0.5 0.3 0.2 0.2 0.1 0.0 0.0 0.0 0.0 0.0 0.0 0.019-Aug 80.9 66.7 54.8 44.8 36.3 29.1 23.5 18.9 15.3 12.2 9.8 7.8 6.2 4.9 3.8 2.9 2.1 1.5 1.1 0.7 0.5 0.3 0.2 0.1 0.0 0.0 0.0 0.0 0.0 0.0 0.026-Aug 81.9 68.8 57.3 47.8 39.7 32.8 27.1 22.5 18.6 15.2 12.3 10.1 8.3 6.8 5.4 4.3 3.4 2.7 2.2 1.8 1.3 1.0 0.7 0.4 0.3 0.1 0.1 0.0 0.0 0.0 0.02-Sep 82.8 69.7 58.3 48.5 40.5 33.9 28.5 24.0 20.3 16.8 13.8 11.6 9.7 8.2 6.8 5.4 4.4 3.6 3.0 2.6 2.2 1.8 1.4 1.1 0.8 0.6 0.5 0.3 0.2 0.2 0.19-Sep 84.6 73.0 62.8 53.7 45.8 38.7 32.6 27.4 23.0 19.0 15.7 12.8 10.6 8.9 7.6 6.5 5.6 4.8 4.2 3.6 3.0 2.6 2.2 1.7 1.5 1.2 1.0 0.8 0.7 0.6 0.5
16-Sep 79.8 65.9 54.3 45.1 37.6 31.1 26.0 21.7 18.1 15.0 12.4 10.2 8.4 6.9 5.6 4.7 4.0 3.5 3.0 2.7 2.4 2.1 1.8 1.5 1.3 1.2 1.0 0.8 0.6 0.5 0.423-Sep 78.5 63.5 50.0 39.3 31.1 24.7 19.7 15.9 13.1 10.9 9.1 7.6 6.3 5.3 4.6 3.9 3.4 3.0 2.7 2.4 2.2 2.0 1.8 1.6 1.5 1.4 1.2 1.1 1.0 0.9 0.830-Sep 79.3 65.2 52.6 42.1 33.4 26.4 20.6 16.1 12.7 10.3 8.4 6.8 5.7 4.9 4.3 3.7 3.2 2.8 2.4 2.1 1.8 1.6 1.4 1.2 1.0 0.9 0.8 0.7 0.6 0.6 0.67-Oct 81.7 68.5 56.6 46.3 37.2 29.7 23.9 19.2 15.3 12.1 9.6 7.5 6.0 4.8 4.0 3.3 2.8 2.3 1.9 1.7 1.4 1.2 1.0 0.8 0.5 0.3 0.2 0.2 0.2 0.2 0.2
14-Oct 84.0 72.2 61.7 52.3 44.0 37.1 31.2 26.0 21.5 17.6 14.4 11.6 9.3 7.2 5.5 4.2 3.2 2.5 1.8 1.5 1.2 0.9 0.7 0.6 0.4 0.2 0.1 0.1 0.1 0.0 0.021-Oct 82.8 71.1 60.9 52.0 44.1 37.6 32.1 27.5 23.3 19.6 16.4 13.8 11.7 10.1 8.7 7.3 6.2 5.2 4.2 3.5 2.7 2.3 2.0 1.6 1.4 1.1 0.9 0.7 0.5 0.4 0.328-Oct 82.1 70.0 59.0 49.2 40.5 33.2 27.2 22.5 18.7 15.6 13.1 11.0 9.2 8.0 6.9 5.9 5.3 4.7 4.1 3.6 3.2 2.9 2.6 2.3 2.0 1.7 1.5 1.2 1.0 0.9 0.84-Nov 80.0 67.2 56.3 46.8 38.7 32.1 26.6 22.1 18.3 14.9 12.3 10.0 8.2 7.2 6.3 5.4 4.8 4.2 3.7 3.1 2.6 2.3 2.0 1.7 1.5 1.3 1.2 1.0 0.8 0.7 0.6
11-Nov 78.2 64.3 52.7 42.8 34.2 27.0 21.8 18.1 15.5 13.3 11.5 9.7 8.3 7.4 6.6 5.8 5.2 4.6 4.1 3.6 3.1 2.7 2.2 1.8 1.5 1.4 1.2 1.1 1.0 0.9 0.818-Nov 78.7 64.1 52.1 42.1 34.0 27.1 21.5 17.4 14.5 12.2 10.5 8.9 7.7 6.8 5.9 5.2 4.7 4.1 3.6 3.1 2.6 2.2 1.9 1.6 1.4 1.2 1.0 0.8 0.6 0.4 0.425-Nov 77.6 62.0 49.1 39.0 31.4 25.1 20.4 16.8 13.9 11.7 9.8 8.1 6.9 5.8 4.7 3.9 3.2 2.8 2.5 2.3 2.0 1.7 1.4 1.2 1.0 0.8 0.6 0.4 0.2 0.1 0.12-Dec 77.4 61.2 47.7 36.5 28.4 22.1 17.5 13.9 10.8 8.5 6.7 5.4 4.4 3.5 2.8 2.2 1.7 1.3 1.0 0.9 0.8 0.7 0.6 0.6 0.5 0.4 0.3 0.2 0.1 0.0 0.09-Dec 75.8 59.6 46.6 36.2 28.3 21.9 17.4 14.0 11.1 8.8 6.9 5.2 4.0 3.0 2.1 1.6 1.2 0.9 0.7 0.7 0.6 0.5 0.4 0.3 0.2 0.2 0.1 0.1 0.0 0.0 0.0
16-Dec 76.5 60.3 46.6 35.3 26.6 19.6 14.9 11.3 8.8 6.9 5.4 4.2 3.2 2.4 1.8 1.5 1.2 0.9 0.9 0.8 0.8 0.7 0.7 0.6 0.6 0.5 0.4 0.3 0.3 0.2 0.123-Dec 77.4 61.0 46.8 35.3 26.5 20.3 15.6 11.8 9.0 6.9 5.4 4.1 3.2 2.4 1.9 1.4 1.0 0.8 0.6 0.5 0.5 0.5 0.4 0.4 0.4 0.4 0.4 0.3 0.3 0.2 0.231-Dec 78.4 62.0 47.5 35.5 26.9 20.3 15.2 11.3 8.6 6.6 5.2 4.0 3.2 2.5 1.9 1.6 1.3 1.0 0.7 0.5 0.2 0.1 0.1 0.1 0.1 0.1 0.1 0.1 0.1 0.1 0.0
Avg for Yr 78.6 63.4 50.7 40.3 32.1 25.7 20.6 16.5 13.3 10.8 8.7 7.1 5.7 4.7 3.8 3.1 2.6 2.1 1.7 1.4 1.1 0.9 0.8 0.6 0.5 0.4 0.3 0.2 0.2 0.2 0.1
Number of Consecutive Dry Days
Table 9. Probability (percent) of Number of Consecutive Dry Days following any Day in a given Week. Region 4.

19
Figure 1. Connecticut Total Annual Precipitation, 1895-1994.
30.00
35.00
40.00
45.00
50.00
55.00
60.00
65.00
70.00
1895
1904
1913
1922
1931
1940
1949
1958
1967
1976
1985
1994
Year
Pre
cip
itat
ion
(in
ches
)
20
Figure 2. Monthly Precipitation in the Central Region of Connecticut, 1895-1989. The box and whisker plots show thenon-outlier ranges, 25% and 75% interquartile ranges and medians. The shaded portions of the boxes show the standarddeviations and the circles and stars are outliers and extremes, respectively.

21
Figure 3. Four Precipitation Regions in Connecticut.

22
Figure 4a. Contour Map of 2-Year, 1-Hour Precipitation Accumulation in Connecticut.
2-year return period1-hour precipitation accumulation
contour interval = 0.10 inch
1.30
1.30
1.201.20
1.10 1.10

23
Figure 4b. Contour Map of 5-Year, 1-Hour Precipitation Accumulation in Connecticut.
contour interval = 0.10 inch
5-year return period1-hour precipitation accumulation
1.40
1.40
1.50
1.50
1.40 1.30 1.30
1.40
24
Figure 4c. Contour Map of 10-Year, 1-Hour Precipitation Accumulation in Connecticut.
10-year return period1-hour precipitation accumulation
contour interval = 0.10 inch
1.70
1.60
1.60 1.601.50 1.50
1.60
1.70

25
Figure 4d. Contour Map of 25-Year, 1-Hour Precipitation Accumulation in Connecticut.
contour interval = 0.10 inch
25-year return period1-hour precipitation accumulation
1.80
1.80 1.90
1.90
2.002.00
1.90
1.801.801.90

26
Figure 4e. Contour Map of 50-Year, 1-Hour Precipitation Accumulation in Connecticut.
50-year return period1-hour precipitation accumulation
contour interval = 0.10 inch
2.10
2.20
2.10 2.10 2.00 2.00
2.10
2.20

27
Figure 4f. Contour Map of 100-Year, 1-Hour Precipitation Accumulation in Connecticut.
contour interval = 0.10 inch
100-year return period1-hour precipitation accumulation
2.302.30 2.20
2.40
2.50
2.30
2.40
2.50
2.30
2.20

28
Figure 4g. Contour Map of 2-Year, 6-Hour Precipitation Accumulation in Connecticut.
2-year return period6-hour precipitation accumulation
contour interval = 0.10 inch
2.20
2.20
2.30
2.40
2.50
2.50
2.50
2.40
2.30
2.202.20

29
Figure 4h. Contour Map of 5-Year, 6-Hour Precipitation Accumulation in Connecticut.
5-year return period6-hour precipitation accumulation
contour interval = 0.10 inch
2.70
2.702.80
2.80
2.90
3.00
3.10
3.10
3.10
3.10
2.90 2.90 2.80 2.70 2.70 2.80
2.90
3.00

30
Figure 4i. Contour Map of 10-Year, 6-Hour Precipitation Accumulation in Connecticut.
contour interval = 0.20 inch
10-year return period6-hour precipitation accumulation
3.20 3.40 3.40 3.20 3.20
3.40
3.60
3.60
3.60
3.40
3.20

31
Figure 4j. Contour Map of 25-Year, 6-Hour Precipitation Accumulation in Connecticut.
25-year return period6-hour precipitation accumulation
contour interval = 0.20 inch
4.00
4.20
4.40
4.60
4.60
4.40
4.20
4.003.803.804.004.204.00 4.20

32
Figure 4k. Contour Map of 50-Year, 6-Hour Precipitation Accumulation in Connecticut.
contour interval = 0.20 inch
50-year return period6-hour precipitation accumulation
4.60
4.60
4.805.00
4.80
5.00
5.20
5.40
5.20
5.20
5.40
5.00
4.804.604.604.805.00

33
Figure 4l. Contour Map of 100-Year, 6-Hour Precipitation Accumulation in Connecticut.
100-year return period6-hour precipitation accumulation
contour interval = 0.20 inch
6.00
5.80
5.60
5.605.80 6.00
6.206.00 5.80
5.20
5.605.405.40 5.80 6.00
6.20
6.40
5.60
6.40
6.20

34
Figure 4m. Contour Map of 2-Year, 12-Hour Precipitation Accumulation in Connecticut.
contour interval = 0.10 inch
2-year return period12-hour precipitation accumulation
3.00
2.90
2.80
2.70
2.70 2.80 2.80
2.80
2.90
3.00

35
Figure 4n. Contour Map of 5-Year, 12-Hour Precipitation Accumulation in Connecticut.
5-year return period12-hour precipitation accumulation
contour interval = 0.10 inch
3.30 3.40 3.50
3.60
3.50
3.40
3.30
3.60
3.60
3.50
3.403.303.303.50 3.40
3.70
3.803.80
3.80
3.70

36
Figure 4o. Contour Map of 10-Year, 12-Hour Precipitation Accumulation in Connecticut.
contour interval = 0.20 inch
10-year return period12-hour precipitation accumulation
4.00
4.20
4.40
4.00 4.20 4.20 4.00 4.00
4.20
4.40

37
Figure 4p. Contour Map of 25-Year, 12-Hour Precipitation Accumulation in Connecticut.
25-year return period12-hour precipitation accumulation
contour interval = 0.20 inch 5.60
5.40
5.20
5.00
4.80
4.80
5.005.20
5.40
5.60
5.20
5.004.804.80
5.005.205.40

38
Figure 4q. Contour Map of 50-Year, 12-Hour Precipitation Accumulation in Connecticut.
contour interval = 0.20 inch
50-year return period12-hour precipitation accumulation
6.60
6.40
6.20
6.00
5.80
5.80 6.00 6.206.40
6.206.00 5.805.80 6.00
6.20
6.40
6.60

39
Figure 4r. Contour Map of 100-Year, 12-Hour Precipitation Accumulation in Connecticut.
6.80 7.207.60
7.206.80
7.60
7.60
6.80
7.20
7.60
7.20
6.80
100-year return period12-hour precipitation accumulation
contour interval = 0.40 inch

40
Figure 4s. Contour Map of 2-Year, 24-Hour Precipitation Accumulation in Connecticut.
contour interval = 0.10 inch
2-year return period24-hour precipitation accumulation
3.10
3.20
3.30
3.40
3.503.40
3.30
3.20
3.103.103.10
3.50

41
Figure 4t. Contour Map of 5-Year, 24-Hour Precipitation Accumulation in Connecticut.
5-year return period24-hour precipitation accumulation
contour interval = 0.10 inch
4.30
4.20
4.40
4.10 4.003.90 4.104.00
4.40
3.90
4.40
4.00
4.10
3.90
3.90 4.00
4.10
4.20
4.30

42
Figure 4u. Contour Map of 10-Year, 24-Hour Precipitation Accumulation in Connecticut.
10-year return period24-hour precipitation accumulation
contour interval = 0.20 inch 5.20
5.20
5.00
4.804.604.604.80
5.00
4.80
4.80
43
Figure 4v. Contour Map of 25-Year, 24-Hour Precipitation Accumulation in Connecticut.
6.40
6.40
6.20
6.00
6.20
6.00
5.805.605.605.806.006.206.206.005.80
5.80
25-year return period24-hour precipitation accumulation
contour interval = 0.20 inch

44
Figure 4w. Contour Map of 50-Year, 24-Hour Precipitation Accumulation in Connecticut.
7.80
7.60
7.40
7.20
7.00
7.80
7.60
7.40
7.20
7.007.007.207.407.407.207.00
contour interval = 0.20 inch
50-year return period24-hour precipitation accumulation

45
Figure 4x. Contour Map of 100-Year, 24-Hour Precipitation Accumulation in Connecticut.
contour interval = 0.40 inch
100-year return period24-hour precipitation accumulation
8.008.40 8.80
8.40 8.00 8.00
8.40
8.80
9.20
9.20
8.80
8.40
8.00
8.80
46
Figure 5a. Intensity-Duration-Frequency (IDF) Curves. Region 1.
0.01
0.10
1.00
10.00
0.10 1.00 10.00 100.00
Duration (hours)
Inte
nsi
ty(i
nch
es/h
r)
2Y5Y10Y25Y50Y100Y
47
Figure 5b. Intensity-Duration-Frequency (IDF) Curves. Region 2.
0.01
0.10
1.00
10.00
0.10 1.00 10.00 100.00Duration (hours)
Inte
nsi
ty(i
nch
es/h
r)
2Y5Y10Y25Y50Y100Y

48
Figure 5c. Intensity-Duration-Frequency (IDF) Curves. Region 3.
0.01
0.10
1.00
10.00
0.10 1.00 10.00 100.00
Duration (hours)
Inte
nsi
ty(i
nch
es/h
r)
2Y5Y10Y25Y50Y100Y

49
Figure 5d. Intensity-Duration-Frequency (IDF) Curves. Region 4.
0.01
0.10
1.00
10.00
0.10 1.00 10.00 100.00
Duration (hours)
Inte
nsi
ty(i
nch
es/h
r)
2Y5Y10Y25Y50Y100Y

50
Figure 6a. Area Reduction Curves. Region 1.
0.60
0.65
0.70
0.75
0.80
0.85
0.90
0.95
1.00
1.05
0 50 100 150 200 250 300 350 400 450
Area (square miles)
Red
uct
ion
Pro
po
rtio
n
24_H
6_H
3_H
1_H

51
Figure 6b. Area Reduction Curves. Region 2.
0.60
0.65
0.70
0.75
0.80
0.85
0.90
0.95
1.00
1.05
0 50 100 150 200 250 300 350 400 450
Area (square miles)
Red
uct
ion
Pro
po
rtio
n
24_H6_H
3_H1_H
52
Figure 6c. Area Reduction Curves. Region 3.
0.60
0.65
0.70
0.75
0.80
0.85
0.90
0.95
1.00
1.05
0 50 100 150 200 250 300 350 400 450
Area (square miles)
Red
uct
ion
Pro
po
rtio
n
24_H6_H
3_H1_H

53
Figure 6d. Area Reduction Curves. Region 4.
0.60
0.65
0.70
0.75
0.80
0.85
0.90
0.95
1.00
1.05
0 50 100 150 200 250 300 350 400 450
Area (square miles)
Red
uct
ion
Pro
po
rtio
n
24_H6_H
3_H1_H

54
Figure 7a. Weekly Distribution of 24 hr Extreme Precipitation. Region 1.
0
0.5
1
1.5
2
2.5
3
3.5
4
01/0
701
/21
02/0
402
/18
03/0
403
/18
04/0
104
/15
04/2
905
/13
05/2
706
/10
06/2
407
/08
07/2
208
/05
08/1
909
/02
09/1
609
/30
10/1
410
/28
11/1
111
/25
12/0
912
/23
Week of Year
Pro
bab
ility
of
Occ
ura
nce
(%)
1 yr 2 yr 5 yr 10 yr 25 yr 50 yr

55
Figure 7b. Weekly Distribution of 6 hr Extreme Precipitation. Region 1.
0
1
2
3
4
5
6
7
8
01/0
701
/21
02/0
402
/18
03/0
403
/18
04/0
104
/15
04/2
905
/13
05/2
706
/10
06/2
407
/08
07/2
208
/05
08/1
909
/02
09/1
609
/30
10/1
410
/28
11/1
111
/25
12/0
912
/23
Week of Year
Pro
bab
ility
of
Occ
ura
nce
(%)
1 yr 2 yr 5 yr 10 yr 25 yr 50 yr

56
Figure 7c. Weekly Distribution of 1 hr Extreme Precipitation. Region 1.
0
1
2
3
4
5
6
7
8
9
01/0
701
/21
02/0
402
/18
03/0
403
/18
04/0
104
/15
04/2
905
/13
05/2
706
/10
06/2
407
/08
07/2
208
/05
08/1
909
/02
09/1
609
/30
10/1
410
/28
11/1
111
/25
12/0
912
/23
Week of Year
Pro
bab
ility
of
Occ
ura
nce
(%)
1 yr 2 yr 5 yr 10 yr 25 yr 50 yr

57
Figure 7d. Weekly Distribution of 24 hr Extreme Precipitation. Region 2.
0
0.5
1
1.5
2
2.5
3
3.5
01/0
701
/21
02/0
402
/18
03/0
403
/18
04/0
104
/15
04/2
905
/13
05/2
706
/10
06/2
407
/08
07/2
208
/05
08/1
909
/02
09/1
609
/30
10/1
410
/28
11/1
111
/25
12/0
912
/23
Week of Year
Pro
bab
ility
of
Occ
ura
nce
(%)
1 yr 2 yr 5 yr 10 yr 25 yr 50 yr

58
Figure 7e. Weekly Distribution of 6 hr Extreme Precipitation. Region 2.
0
1
2
3
4
5
6
01/07
01/21
02/04
02/18
03/04
03/18
04/01
04/15
04/29
05/13
05/27
06/10
06/24
07/08
07/22
08/05
08/19
09/02
09/16
09/30
10/14
10/28
11/11
11/25
12/09
12/23
Week of Year
Pro
bab
ility
of
Occ
ura
nce
(%)
1 y 2 yr 5 yr 10 yr 25 yr 50 yr

59
Figure 7f. Weekly Distribution of 1 hr Extreme Precipitation. Region 2.
0
1
2
3
4
5
6
7
8
9
01/0
701
/21
02/0
402
/18
03/0
303
/17
03/3
104
/14
04/2
805
/12
05/2
606
/09
06/2
307
/07
07/2
108
/04
08/1
809
/01
09/1
509
/29
10/1
310
/27
11/1
011
/24
12/0
812
/22
Week of Year
Pro
bab
ility
of
Occ
ura
nce
(%)
1 yr 2 yr 5 yr 10 yr 25 yr 50 yr

60
Figure 7g. Weekly Distribution of 24 hr Extreme Precipitation. Region 3.
0
0.5
1
1.5
2
2.5
3
3.5
4
01/0
701
/21
02/0
402
/18
03/0
403
/18
04/0
104
/15
04/2
905
/13
05/2
706
/10
06/2
407
/08
07/2
208
/05
08/1
909
/02
09/1
609
/30
10/1
410
/28
11/1
111
/25
12/0
912
/23
Week of Year
Pro
bab
ility
of
Occ
ura
nce
(%)
1 yr 2 yr 5 yr 10 yr 25 yr 50 yr
61
Figure 7h. Weekly Distribution of 6 hr Extreme Precipitation. Region 3.
0
1
2
3
4
5
6
7
8
9
01/07
01/21
02/04
02/18
03/04
03/18
04/01
04/15
04/29
05/13
05/27
06/10
06/24
07/08
07/22
08/05
08/19
09/02
09/16
09/30
10/14
10/28
11/11
11/25
12/09
12/23
Week of Year
Pro
bab
ility
of
Occ
ura
nce
(%)
1 yr 2 yr 5 yr 10 yr 25 yr 50 yr

62
Figure 7i. Weekly Distribution of 1 hr Extreme Precipitation. Region 3.
0
2
4
6
8
10
12
01/0
701
/21
02/0
402
/18
03/0
303
/17
03/3
104
/14
04/2
805
/12
05/2
606
/09
06/2
307
/07
07/2
108
/04
08/1
809
/01
09/1
509
/29
10/1
310
/27
11/1
011
/24
12/0
812
/22
Week of Year
Pro
bab
ility
of
Occ
ura
nce
(%)
1 yr 2 yr 5 yr 10yr 25 yr 50 yr

63
Figure 7j. Weekly Distribution of 24 hr Extreme Precipitation. Region 4.
0
0.5
1
1.5
2
2.5
3
3.5
01/0
701
/21
02/0
402
/18
03/0
403
/18
04/0
104
/15
04/2
905
/13
05/2
706
/10
06/2
407
/08
07/2
208
/05
08/1
909
/02
09/1
609
/30
10/1
410
/28
11/1
111
/25
12/0
912
/23
Week of Year
Pro
bab
ility
of
Occ
ura
nce
(%)
1 yr 2 yr 5 yr 10 yr 25 yr 50 yr

64
Figure 7k. Weekly Distribution of 6 hr Extreme Precipitation. Region 4.
0
1
2
3
4
5
6
7
01/0
701
/21
02/0
402
/18
03/0
403
/18
04/0
104
/15
04/2
905
/13
05/2
706
/10
06/2
407
/08
07/2
208
/05
08/1
909
/02
09/1
609
/30
10/1
410
/28
11/1
111
/25
12/0
912
/23
Week of Year
Pro
bab
ility
of
Occ
ura
nce
(%)
1 yr 2 yr 5 yr 10 yr 25 yr 50 yr
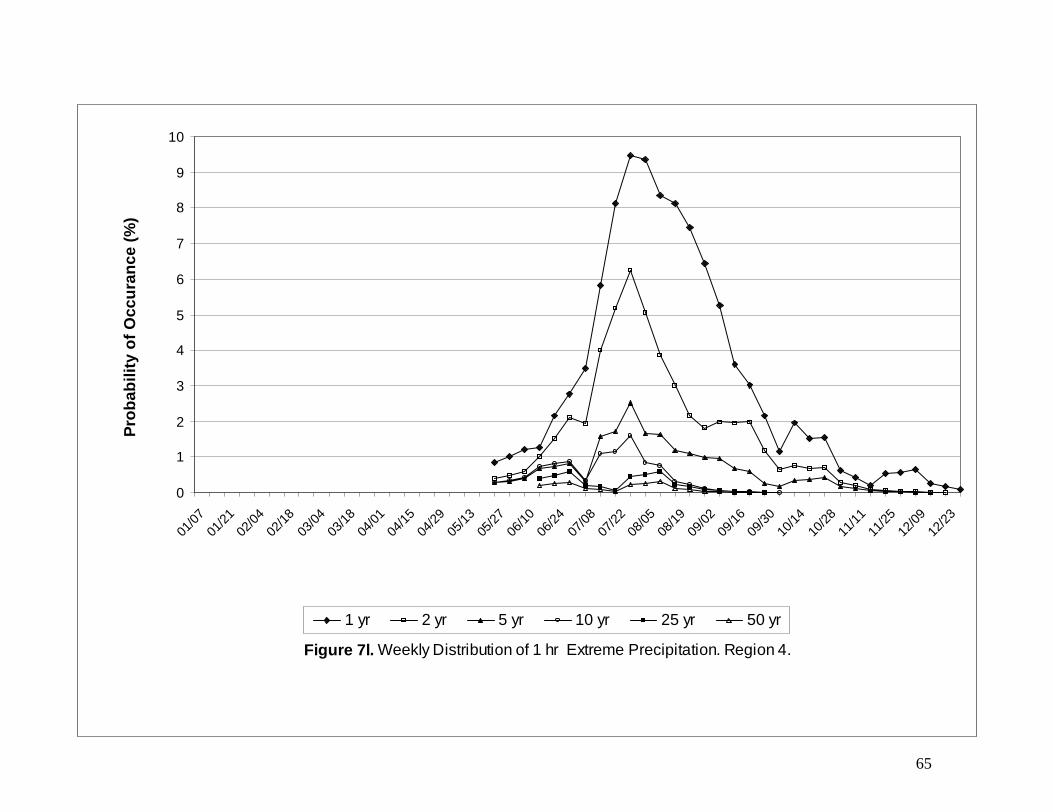
65
Figure 7l. Weekly Distribution of 1 hr Extreme Precipitation. Region 4.
0
1
2
3
4
5
6
7
8
9
10
01/0
701
/21
02/0
402
/18
03/0
403
/18
04/0
104
/15
04/2
905
/13
05/2
706
/10
06/2
407
/08
07/2
208
/05
08/1
909
/02
09/1
609
/30
10/1
410
/28
11/1
111
/25
12/0
912
/23
Week of Year
Pro
bab
ility
of
Occ
ura
nce
(%)
1 yr 2 yr 5 yr 10 yr 25 yr 50 yr