precipitation measurement study - … · alarm. . 28 temperature regulator 29 ... report (15...
TRANSCRIPT

ILLINOIS STATE WATER SURVEY
METEOROLOGIC LABORATORY
at the
University of Illinois Urbana, Illinois
PRECIPITATION MEASUREMENT STUDY
FINAL REPORT 15 February 1954
Sponsored by SIGNAL CORPS ENGINEERING LABORATORIES
Fort Monmouth, New Jersey
CONTRACT NO. DA-36-039 SC-15484 Department of the Army Project: 3-36-02-042
Signal Corps Project: 794C-0
DEMCO
ISWS Hiser, Homer W. CR-6 PRECIPITATION Loan c.3 MEASUREMENTS STUDY SWS0802

PRECIPITATION MEASUREMENTS STUDY
FINAL REPORT
15 February 1952 to 15 February 1954
Signal Corps Contract No.: DA-36-039 SC-15484
Dept. of the Army Project : DA3-36-02-042 Signal Corps Project No.: 794C-O
Prepared by
H. W. Hiser, Project Meteorologist and
F. A. Huff, Project Engineer
Approved by G. E. Stout
Head, Meteorologic Subdivision and
A. M. Buswell Chief
Illinois Sta te Water Survey a t
. University of I l l i n o i s Urbana, I l l i n o i s

TABLE OF CONTENTS
P a g e
ABSTRACT . . . . . 5 PURPOSE ... 7 PUBLICATIOHS AND CONFERENCES 8 ACKNOWLEDGMENTS 10
TASK A, EVALUATION OF PRECIPITATION GAGES 11 Approach to Problem 11
L i t e r a t u r e Review 11 Eva lua t ion System 11
Development of New Gages 11 O r i g i n a l Eva lua t ion of E x i s t i n g Gages 12
A r c t i c Gaging Problems . . . . . . . 1 2 Eva lua t ion of Gage Types 12 Eva lua t ion of S p e c i f i c Gages 12
Descr ip t ion o f Stevens Gage . . . . . . . . . . 1 3 Bendix-Friez Gage 13 Wind Sh ie ld ing 13 Melt ing of Snow............................ 14 Snow Capping 16 Temperature Compensation 16 Wind Compensation l6 Gage Exposure 17
Eva lua t ion of New Gages 17 Bureau of Reclamation Radio-Repor t ing
P r e c i p i t a t i o n Gage 17 Desc r ip t ion 17 Wind Sh ie ld ing 18 Melt ing of Snow 18 Snow Capping 20 Temperature and Wind Compensation 20 Gage Exposure 20 Eva lua t ion 20
S t r a i n Type Remote-Re cording P r e c i p i t a t i o n Gage . . 21 Descr ip t ion 21 Wind Sh i e ld ing . . . 23 Melting of Snow 23 Snow Capping 23 Temperature and Wind Compensation 23 Gage Exposure . . . . 2 3 Eva lua t ion . . . . . 2 3
TASK B, PRECIPITATION DETECTOR DEVELOPMENT......................... 24 I n t r o d u c t i o n 24 Eva lua t ion of E x i s t i n g Ins t ruments 24 R e s u l t s of Development 24 Laboratory Tes t ing Procedures . . . 2 4
- 2 -

-3 -Page
I n s t r u m e n t C o n s t r u c t i o n 2 5 C o n s t r u c t i o n Schedu le f o r D e t e c t o r E l emen t . . . . 2 5 Wind S h i e l d 27 E l e c t r o n i c Equipment 2 8
Power Supply 28 Alarm . . 28 Tempera ture R e g u l a t o r 29 Timer . . 29
P a r t s L i s t f o r P r e c i p i t a t i o n D e t e c t o r 3 1 I n s t r u m e n t O p e r a t i o n 34
Methods of O p e r a t i o n 34 R e s u l t s o f L a b o r a t o r y and P r e l i m i n a r y F i e l d
T e s t s 34 L a b o r a t o r y T e s t s 34 P r e l i m i n a r y F i e l d T e s t s 3 5
S u g g e s t i o n s f o r F u t u r e A p p l i c a t i o n 3 6 Conc lus ions 36
TASK C, DUST MEASUREMENT STUDY 37 I n t r o d u c t i o n 37 C l a s s i f i c a t i o n o f A i r Contaminants 37
Dus t s 37 Fumes 37 Smokes 38 M i s t s and Fogs 38 Vapors and Gases 38
S i z e s o f A i r b o r n e P a r t i c l e s 3 8 Dus t Measurement Devices 39
F i l t r a t i o n Devices 39 Automat ic F i l t e r 3 9 Thimble and Sugar Tube F i l t e r s 40
S e t t l e m e n t Devices 4 0 S t a n d a r d Gage 40
Washing Devices 40 Palmer Appara tus 41
P r e c i p i t a t i n g Devices . . . . . . 4 1 Thermal P r e c i p i t a t o r 4 1 E l e c t r i c P r e c i p i t a t o r 4 1 Son ic F l o c c u l a t o r 4 3
Impingement Devices 44 Kotze Konimeter 44 Greeriburg-Smith Impinger 45 Owens J e t Dus t Counter 45 A i t k e n Counter 4 6 Guyton E l e c t r o n i c P a r t i c l e C o u n t e r 4 6
P h o t o - E l e c t r i c Devices 4 8 Smith and C a r l i s l e Reco rd ing Dust Meter . . . 4 9 Record ing P h o t o - E l e c t r i c D u s t A n a l y z e r . . . 5 0 Dust C o n c e n t r a t i o n Meter 52 Watson Dens i tome te r 54 P e t e r s o n D i f f e r e n t i a l Pho tome te r 55 P h o t o - E l e c t r i c P a r t i c l e Coun te r . . . . . . . . 5 6

-4-
Page Dust Measurement Conclusions and Recommendations ... 58
Guyton Electronic Particle Counter . . . . . . . 58 Smith and Carlisle Dust Meter 59 Photo-Electric Particle Counter 60 Other Instruments 60
Selected References on Dust Measurement 60 OVERALL CONCLUSIOMS .'. 74
Precipitation Gaging 74 Precipitation Detection 74 Dust Measurement . 74
FINAL RECOMMENDATIONS 74 Precipitation Gaging • • • 74 Precipitation Detection 75 Dust Measurement 75
LIST OF ILLUSTRATIONS Figure Page
1 Effects of Orifice Diameter and Wind Shields Upon Snow Catch . . . . . . . 15
2 Bureau of Reclamation Radio-Reporting Precipitation Gage 19
3 Strain Type Remote Recording Precipitation Gage . 22 4 Precipitation Detector . 26 5 Thyratron, Temperature Regulator, and
Power Supply 30 6 Timer Circuit . . . . 30a 7 Airborne Particle Sizes and Settling Rates ... 6l 8 Filtration Devices 62 9 Settlement Device 63 10 Washing Device 63 11 Thermal Precipitator 63 12 Precipitating Devices 64 13 Impingement Devices 65 14 Electrical Diagram of the Particle Counter ... 66 15 Smith and Carlisle Recording Dust Meter 66 16 Recording Photo-electric Dust Analyzer 67 17 Dust Concentration Meter 67 18 Watson Densitometer 67 19 Peterson Differential Photometer . . . . . . . . 68 20 Photo-electric Particle Counter 68

-5-ABSTRACT
Task A, Evaluation of Precipitation Gages
An evaluation was made of all known precipitation gages to ascertain the most adaptable gage for the Signal Corps Arctic automatic weather station. The study was guided by the Signal Corps technical requirements.
A review of Arctic climatology was made to define Arctic gaging problems. This study resulted in the definition of six general problems to be overcome in providing a satisfactory gage for Arctic operations. These include: (1) wind shielding to reduce wind and turbulence effects about the gage orifice; (2) prevention of orifice capping in wet, sticky snow; (3) melting of snow or ice in the gage to keep the required gage capacity within reasonable limits; (4) wind compensation of the recording elements to reduce large vibrations and obtain acceptable measurement accuracy; (5) temperature compensation of the recording elements to maintain suitable sensitivity and accuracy over a wide temperature range; (6) proper gage exposure with respect to the existing snow surface and blowing snow.
Using the extensive literature survey presented in the annual report (15 February 1952 to 15 February 1953) as a basic reference, precipitation gages were classified by types and each type evaluated. The weight-type gage was found to be most adaptable to the automatic weather station. Evaluation was then made of specific weight-type gages, taking into consideration the six Arctic gaging problems and the existing technical requirements.
As a result of the evaluation, it was concluded that the recently developed Bureau of Reclamation, Radio-Reporting Precipitation gage is the most adaptable gage for use with the automatic weather station, although it does not satisfy all Signal Corps technical requirements.
Task B, Precipitation Detector Development
A study was made of existing instruments and methods for precipitation detection to determine the most applicable type of detector for use in the automatic weather station, based upon the Signal Corps technical requirements. It was concluded that the Barnothy and Bell method was the most adaptable, although considerable modification of the instrument's components would be necessary for the contemplated use. In the Barnothy and Bell precipitation detector, an alarm system is activated whenever a drop of water wets a heated metal cylinder. The droplet strikes a blotter paper, wets through the paper and closes a circuit from an outer wire winding to an interior metal cylinder. Heat from the cylinder is used to evaporate the water, thereby reopening the circuit and completing the detection cycle.
Using the Barnothy and Bell principle, a precipitation detector has been developed to detect rain, drizzle, and snow, and to initiate and complete its operational cycle within a three-minute period as desired by the Signal Corps. The main components of the instrument are:
-6-(1) a cyl indrical foundation of galvanized s t e e l ; (2) a heat ing uni t employing Nichrome V wire , and incorporating an e lec t ronic temperature regulator ; (3) a detector winding of copper wire; (4) insu la t ing layers of Fiberglas separating the various elements of the system; (5) a protect ive wind shield to a id in snow detect ion; (6) an alarm c i r c u i t employing a thyratron tube.
Laboratory and preliminary f i e ld t e s t s were made with the developed instrument. As a r e s u l t , it has been concluded t ha t the developed in strument should provide sa t i s fac to ry se rv ice , provided tha t recommendat ions relevant to the construct ion and operation of the instrument are followed. However, further f i e ld t e s t s are recommended before incorporating the instrument into the automatic weather s t a t i o n observational program.
Task C, Dust Measurement Study
A l i t e r a t u r e survey was made to ascer ta in the adaptab i l i ty of exis t ing dust measuring devices for the automatic weather s t a t i o n . Adaptability was based upon the Signal Corps technical requirements.
From an invest igat ion of types and s izes of airborne p a r t i c l e s , it was concluded that a su i t ab le dust measuring device for the automatic s ta t ion should be capable of detect ing pa r t i c l e s of one micron diameter or greater . Dust measuring devices were c lass i f i ed in to s ix types, according to the physical basis of operat ion. These include: (1) f i l t r a t i o n ; (2) set t lement; (3) washing; (4) p r e c i p i t a t ing; (5) impingement; and (6) photo-e lec t r ic devices. Specific instruments within each c l a s s i f i c a t i on were then s tudied .
The impingement and photo-e lec t r ic devices, or a combination of the two types, were found to be most su i tab le for use in the automatic weather s t a t ion . Due to i t s s impl ic i ty in design, and adaptab i l i ty to a wide variety of cl imatic condit ions, the Guyton Electronic Par t ic le Counter offers the most advantages for use in the automatic weather s t a t ion . This instrument u t i l i z e s the e l e c t r o s t a t i c charge created when a par t ic le is impinged upon a wire . The Smith and Car l i s l e Dust Meter, a photo-electr ic device employing the Tyndall Beam or l i g h t sca t te r ing pr inc ip le , was ra ted second. This instrument is somewhat more subject to comtamination than the Guyton device. Third choice was the Photo-electric P a r t i c l e Counter, which combines a photo-e lec t r ic analyzer with a thyratron c i r c u i t . It has been ra ted th i rd due to i t s greater complexity of e lec t ronic components, although it is ideal ly suited to coding as counts per un i t of t ime.
Recommendations re levant to incorporating the selected dust measuring devices into the automatic weather s t a t i o n are discussed. A selected bibliography of 67 references is included.

-7-PURPOSE
In compliance with provisions of contract DA.-36-O39 SC-15484, a study was made of all Known methods of measuring precipitation, both solid and liquid which may occur in nature, with a view to adapting these techniques of prVcipltation measurement to unattended automatic weather station operation. The study was guided by the Signal Corps Technical Requirements, dated 13 June 1951, which specify:
1. Measurement of rate of precipitation to indicate whether or not it is raining or snowing at the time of the observation. The minimum rate of precipitation to be accepted as an index of whether precipitation is occurring is 0.02 in. per hour.
2. Measurement of precipitation to report the amount since the preceding observation to the nearest 0.01 in. with a capacity of 3 in.
3. Measurement of amount of rain and/or dust deposited on a unit area since the preceding observation in arbitrary units.
4. Measurements of (1) and (2) shall be possible for all conditions of temperature from -60°F to + 120°F and wind speeds up to 150 mph. Measurement of (3) shall be possible under conditions of temperature from +32°F to +120°F and wind speeds up to 150 mph.
5. The apparatus considered for this application shall be of a type that is capable of unattended operation for a period of at least one year.
6. A minimum amount of electrical power from a 6-volt storage battery source will be available at all times in the automatic weather station. In addition, 115-volt, 60-cycle, a-c power will be available at the time of the observation, i.e. the time the automatic weather station operates and transmits its message. This power will be available for approximately three minutes once every three hours.
7. If as a result of the investigation it is determined that known techniques cannot be adopted to provide the desired results, the investigation shall take the form of exploring new techniques in an effort to obtain the desired results.
The overall project covered by the contract was broken down into three tasks involving investigation of precipitation gages, precipitation detectors, and dust measurement devices, since these three instruments are needed to satisfy the technical requirements for precipitation measurement. This final report presents a history of the project from its inception on 15 February 1952 to its termination on 15 February 1954. The three tasks are discussed separately since each presents a separate instrumental problem. Operational and technical problems, methods of approach to these problems, and results of the investigations are discussed. Conclusions and recommendations are presented; where appropriate, specifications and drawings are included.
-8-PUBLICATIONS AMD CONFERENCES
Publications
First Quarterly Report, 15 March to 15 May 1952. An outline of the tasks and methods to he used in the research.
Second Quarterly Report, 15 May to 15 August 1952. Status of the bibliography and review on precipitation measurements.
Third Quarterly Report, 15 August to 15 November 1952. An outline of the annual report on precipitation measurement.
Annual report, "Precipitation Measurements Study", 30 March 1953. A technical report and partially annotated bibliography with 1078 references. On 30 June 1953, authority was received to declassify this report. It was republished by the State Water Survey as Report of Investigation Number 20.
Fifth Quarterly Report 15 February to 15 May 1953. Notes on heated collectors, the effects of the collector rim on gage catch, and the Barnothy and Bell ombroscope.
Sixth Quarterly Report, 15 May to 15 August 1953. An evaluation of known precipitation gages with respect to use in the automatic weather station.
Seventh Quarterly Report, 15 August to 15 November 1953. Results pertaining to the development of a precipitation detector for use in the automatic weather station and a summary of progress made on the literature survey on atmospheric dust measurement.
Conferences
16 September 1952. Dr. A. M. Buswell, Chief, State Water Survey, conferred with R. M. Boyd at the Evans Signal Laboratory, Belmar, New Jersey, on the precipitation measurements study.
24 September 1952. J. Kurtyka, Project Engineer, conferred with Dr. C. F. Brooks of the Blue Hill Observatory on precipitation measurement.
25 September 1952. J. Kurtyka, Project Engineer, conferred with Professor D. Keily of the Massachusetts Institute of Technology on precipitation measuring instruments.
6 November 1952. R. M. Boyd, Signal Corps Project Engineer, met with State Water Survey representatives in Urbana to discuss the forthcoming annual report on precipitation measurement.
9 April 1953. J. Kurtyka, Project Engineer, and F. A. Huff, Project Advisor,' met with Dr. R. W. Gerdel and M. Diamond of the Snow, Ice, and Permafrost Research Establishment, Wilmette, Illinois to discuss precipitation measurement and arctic problems.

-9-20 April 1953. J. Kurtyka, Project Engineer, met with Professors
Warnick and Baldwin of the University of Idaho, while attending the Western Snow Conference, to discuss effects of wind shields and other aspects of precipitation measurement. Also, a conference was held with H. P. Dugan and E. J. Shukle, of the Bureau of Reclamation concerning structural failure of the Shasta shield during field trials and the development of a radio-reporting rain and snow gage by the Bureau of Reclamation.
25 June 1953. Water Survey representatives met with Signal Corps contract representatives at Belmar, New Jersey, to discuss the aims of the precipitation detector development.
19 October 1953• G. E. Stout met with Signal Corps contract representatives at Belmar, New Jersey, to discuss the status of the research and future plans.
26 January 1954. G. E. Stout met with Signal Corps contract representatives at Belmar, New Jersey, to discuss the desired content of the final report.
-10-ACKNOWLEDGMEHTS
Much of the research was carr ied out under the immediate superv is ion of John Kurtyka, who served as project engineer from 15 February 1952 to 1 October 1953. Harlan Van Gerpen, E lec t r i ca l Engineer, was responsible for a major portion of the prec ip i ta t ion detector design. Robert Hardin, Research Ass is tan t , constructed and tes ted experimental models of the p rec ip i t a t ion detector and ass is ted in the design of the instrument. Credi t is due numerous s ta f f members of the I l l i n o i s S t a t e Water Survey for consultat ion on various phases of the program.
The authors wish to acknowledge the cooperation received from C. C. Warnick, University of Idaho; various members of the Denver office of the Bureau of Reclamation; and J. H. Conover, Blue Hi l l Observatory; who furnished valuable information and data presented in the p r ec ip i t a t i on gage evaluat ion.
The work was performed under the di rect ion of Dr. A. M. Buswell, Chief, and under the general supervision of G. E. Stout , Head of the Meteorologic Sub-Division.

-11-TASK A, EVALUATION OF PRECIPITATION GAGES
- Approach to Problem
Literature Review
As the initial phase under this task, a comprehensive review of literature pertaining to methods and instruments for measuring rain and snow was made. This review also served as the initial phase under Task B which is concerned with precipitation detectors (ombroscopes).
The results of the literature search were presented in the annual report, 15 February 1952 to 15 February 1953, entitled, "Precipitation Measurements Study", by J. C. Kurtyka. This report contained a brief discussion of methods and instruments found in the literature review, and included many illustrations to clarify and augment the description of the various instruments. A partially annotated bibliography containing 1079 references with subject indez was presented, covering published material from the inception of precipitation measurements to the date of the report.
Due to its size, the annual report has not been incorporated into the final report. It should, however, be used as a basic reference in any future precipitation measurement studies. Reference will occasionally be made to it in the following discussions.
Evaluation System
As the next step in evaluating known precipitation gages with respect to the Signal Corps technical requirements, a study of Arctic Climatology was made to help define the gaging problems. Using the annual report as a basic reference, existing precipitation gages were then classified by types. After careful study, the weight-type gage was selected as the most adaptable to the existing gaging problems. Further evaluation of individual gages among the weight type was then made, and the Stevens Q12M and Bendix-Friez Universal Recording gages were selected as most adaptable after incorporating certain modifications, although neither appeared capable of entirely satisfying the existing technical requirements. The results of the precipitation gage evaluation were presented in detail in the Sixth Quarterly Report under this contract.
Development of New Gages
In the Sixth Quarterly Report, reference was made to a precipitation gage recently developed by the Bureau of Reclamation, which is a radio-reporting gage and has been especially designed for unattended operations in regions that have a large amount of snow. However, details of its construction and operation were not available at that time, since patent rights had not been established. Through the combined efforts of the Signal Corps and the Water Survey, the information for an evaluation has since been made available for use on this contract. In addition, data on a new precipitation gage developed by J. H. Conover at the Blue Hill Observatory, which employs the principles of a strain gage, has become available for evaluation since the Sixth Quarterly Report.
-12-
Both these gages have desirable features and the Bureau of Reclamation gage appears more adaptable to the automatic weather station than any gage evaluated in the original survey presented in the Sixth Quarterly Report. Consequently, considerable space in this final report will be devoted to an evaluation of the two new gages after presenting a summary of the original evaluation.
Original Evaluation of Existing Gages
Arctic Gaging Problems
To help define Arctic gaging problems, a review of Arctic Climatology was made using data published by the Armed Forces and the U. S. Weather Bureau. Particular emphasis was placed upon Shemya Island and Point Barrow, Alaskan weather stations designated by the Signal Corps as representative sites of automatic weather stations. This climatic study resulted in the definition of six general problems to be overcome in providing a gage suitable for Arctic operations. These include:
1. Wind shielding to reduce wind and turbulence effects about the gage orifice.
2. Prevention of orifice capping in wet sticky snow. 3. Melting of snow or ice in the gage to keep the required
gage capacity within reasonable limits. 4. Wind compensation of the recording elements to reduce
large vibrations and, consequently, obtain acceptable measurement accuracy.
5. Temperature compensation of the recording elements to maintain suitable sensitivity and accuracy over a wide temperature range.
6. Proper exposure with respect to the existing snow surface and blowing snow.
Evaluation of Gage Types
Using the annual report for 15 February 1952 to 15 February 1953, existing precipitation gages were clasified by types: float, oil and mercury float, weight-type, rate recorders, and remote recording. The general adaptability of each type to Arctic precipitation gaging was then evaluated considering such factors as gage capacity, power and heat requirements, applicability to snow measurements, modification requirements, and suitability for unattended operation. It was concluded that the weight-type is most suitable for Arctic operations.
Evaluation of Specific Gages
A further evaluation was then made of specific gages within the weight-type classification. Considering adaptability and availability, the Stevens Q12M and the Bendix-Friez Universal Recording gages were selected from among the various gages investigated. The Stevens gage was the first choice since it has a relatively high capacity (120 in.) and is designed for remote recording. However, it was concluded that both gages would require considerable modification and testing before
-13-
incorporation into the automatic weather station, because their present design does not satisfactorily overcome the various Arctic gaging problems. Even with feasible modifications, it was felt that neither gage would entirely satisfy the Signal Corps technical requirements. At best, they would serve only as an interim solution to the existing gaging problem.
Description of Stevens Gage. The metals used in this gage are mostly stainless, the catch ring is made of turned bronze, the housing of aluminum sheet, and the working parts are mostly brass and pot metal. The complete unit rests on a heavy (l/2 in.) steel base. The bearing straps supporting the counterweight are steel and have been known to fail due to corrosion in less than a year. The steel straps should be replaced by brass.
The throat of the gage is an upright truncated cone (fig. l89, Annual Report). This form has been found most acceptable since it hinders capping and snow-clinging in the orifice. The lower portion of the gage is cylindrical and rests on a l/2-inch steel base which is supported by three, 3/8-inch leveling screws. The gage is 23-inches in diameter and 66-inches in height.
In the type Q12M recorder, the weight of the accumulated precipitation in the catch bucket moves a pen arm to record inches of precipitation on the paper of a clock-operated drum. Since interval reporting and not continuous recording is to be used in the automatic station, the clock-operated drum would not be necessary. The precipitation weight is balanced by a cam and counterweight. Vibration of the pen arm is dampened by an oil dashpot. The overall capacity of the gage, precipitation and antifreeze, is 120 inches. A compensating weight is provided to balance the antifreeze charge. With the use of antifreezes, it has sufficient capacity for both the Shemya and Point Barrow areas on a semi-annual attendance basis (see Sixth Quarterly Report). If antifreezes can be eliminated, its capacity is sufficient for annual attendance.
Bendix-Friez Gage. Due to its 12-inch capacity, the Bendix-Friez gage requires more modification than the Stevens gage. Since the Bendix-Friez gage was the second choice originally and both gages have been superseded by the Bureau of Reclamation gage discussed later, no further space will be devoted to the Bendix-Friez gage. The reader is referred to the Sixth Quarterly Report for details of the necessary gage modifications.
The suggestions and recommendations presented in the following paragraphs regarding wind shielding, melting of snow, snow capping, temperature and wind compensation, and gage exposure apply to both the Stevens and Bendix-Friez gages.
Wind Shielding. The Alter swinging baffle type of shield (fig. 73, Annual Report) is most suitable (of those that have been field tested) for Arctic use as constant movement of the baffles decreases snow and ice accumulations. The "Modified Alter I" shield developed by C. C. Warnick, University of Idaho, has been proven in field trials and is recommended

-14-
for any immediate use. The "Modified Alter I" is not available commercially. Plans and specifications can be obtained from the Engineering Experiment Station, University of Idaho, Moscow, Idaho. The field trials of the more recent Warnick development, the "Shasta" shield, should be followed since wind tunnel tests indicate that this shield may be more efficient than the "Modified Alter I".
Figure 1 presents graphs showing some of the results of recent wind tunnel tests.1 performed by Warnick in which he used a fine sawdust to simulate snow. Figure la shows the decided advantage afforded by use of his newly developed "Shasta II" shield on a gage with an orifice diameter of 2.67 inches. About 95 percent snow catch is obtained at a wind speed of 15 mph when the shield is used, as compared to approximately 65 percent catch at the same wind speed without the wind shield. At a wind speed of 60 mph, the "Shasta II" shield affords about 30 percent snow catch while the unshielded gage catches only about 10 percent. Also, the curves in figure la show that the percentage catch with the "Shasta II" shield does not drop off nearly so rapidly as the catch for an unshielded gage in the range of wind speed from 15 to 25 mph.
Figure lb is similar to figure la except that a Nipher shield and a 4-inch orifice were used in the comparison. This graph indicates that the Nipher shield adds about 15 percent to the simulated snow catch at wind speeds of 10 to 12 mph. Above this range of speed, the percent of increased catch due to the Kipher shield becomes less. This shows that the Nipher shield definitely is not of as much value to the 4-inch gage as the "Shasta II" shield is to the 2.67-inch gage. It is quite likely that the "Shasta II" shield would also produce better results than the Nipher on all other sizes of orifices.
Figure 1c shows the relation of the percentage catch to gage diameter for 2.67-inch (1/3 scale), 4-inch (l/2 scale), and 8-inch (full scale) orifices without gage shielding. The 2.67-inch orifice gives a consistently higher percentage catch for wind speeds from 12 to 34 mph. All three sizes show their greatest decrease in efficiency in the range from 12 to about 22 mph.
A comparison of the three graphs shows that, within the limits tested, shielding is more critical than orifice size, because greater differences in percentages of catch can be produced by the use of shields than can be produced by varying the orifice diameter over the range from 2.67 to 8.00 inches. From these graphs, it appears that the most desirable snow measurement results would be obtained by use of a "Shasta II" shield and the smallest feasible orifice size. However, orifices much smaller than 8-inches in diameter are not recommended because they are more likely to cap with wet snow.
Melting of Snow. The use of an antifreeze solution in a precipitation gage for the automatic weather station should be avoided, if possible, due to the added gage capacity required for the antifreeze charge and the difficulty in finding a suitable antifreeze for
1 Data for figure 1 received by correspondence from C. C. Warnick, Engineering Experiment Station, University of Idaho, Moscow, Idaho.

(a) 2.67-Inch Orfice Shielded and Unshielded
(b) 4-Inch Orfice Shielded and Unshielded
(c) Percent Catch vs Wind Speed for Various Orfice Diameters
FIG 1 EFFECTS OF ORFICE DIAMETER AND WIND SHIELDS UPON SNOW CATCH
Courtesy C.C. Warnick, University of Idaho, Engineering Experiment Station
-15-
-16-
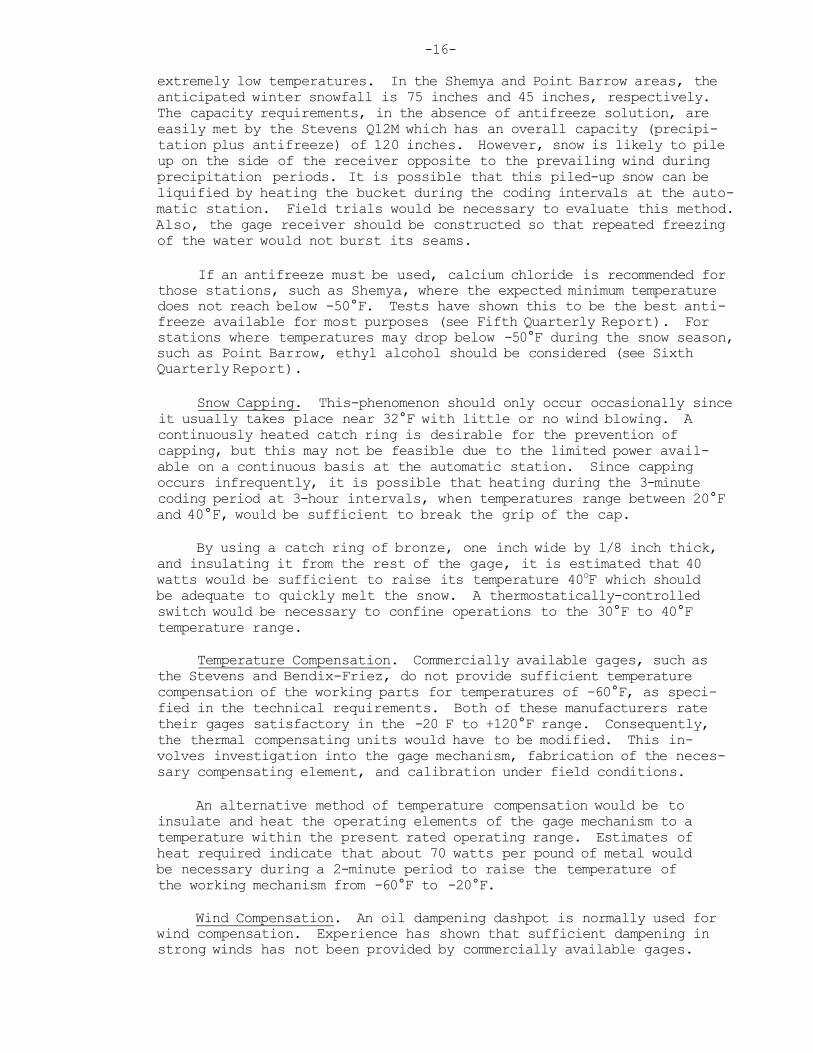
extremely low temperatures. In the Shemya and Point Barrow areas, the anticipated winter snowfall is 75 inches and 45 inches, respectively. The capacity requirements, in the absence of antifreeze solution, are easily met by the Stevens Q12M which has an overall capacity (precipitation plus antifreeze) of 120 inches. However, snow is likely to pile up on the side of the receiver opposite to the prevailing wind during precipitation periods. It is possible that this piled-up snow can be liquified by heating the bucket during the coding intervals at the automatic station. Field trials would be necessary to evaluate this method. Also, the gage receiver should be constructed so that repeated freezing of the water would not burst its seams.
If an antifreeze must be used, calcium chloride is recommended for those stations, such as Shemya, where the expected minimum temperature does not reach below -50°F. Tests have shown this to be the best antifreeze available for most purposes (see Fifth Quarterly Report). For stations where temperatures may drop below -50°F during the snow season, such as Point Barrow, ethyl alcohol should be considered (see Sixth Quarterly Report).
Snow Capping. This-phenomenon should only occur occasionally since it usually takes place near 32°F with little or no wind blowing. A continuously heated catch ring is desirable for the prevention of capping, but this may not be feasible due to the limited power available on a continuous basis at the automatic station. Since capping occurs infrequently, it is possible that heating during the 3-minute coding period at 3-hour intervals, when temperatures range between 20°F and 40°F, would be sufficient to break the grip of the cap.
By using a catch ring of bronze, one inch wide by l/8 inch thick, and insulating it from the rest of the gage, it is estimated that 40 watts would be sufficient to raise its temperature 40oF which should be adequate to quickly melt the snow. A thermostatically-controlled switch would be necessary to confine operations to the 30°F to 40°F temperature range.
Temperature Compensation. Commercially available gages, such as the Stevens and Bendix-Friez, do not provide sufficient temperature compensation of the working parts for temperatures of -60°F, as specified in the technical requirements. Both of these manufacturers rate their gages satisfactory in the -20 F to +120°F range. Consequently, the thermal compensating units would have to be modified. This involves investigation into the gage mechanism, fabrication of the necessary compensating element, and calibration under field conditions.
An alternative method of temperature compensation would be to insulate and heat the operating elements of the gage mechanism to a temperature within the present rated operating range. Estimates of heat required indicate that about 70 watts per pound of metal would be necessary during a 2-minute period to raise the temperature of the working mechanism from -60°F to -20°F.
Wind Compensation. An oil dampening dashpot is normally used for wind compensation. Experience has shown that sufficient dampening in strong winds has not been provided by commercially available gages.
-17-
Either the dash pots must be enlarged or a method of closing the gage orifice during coding time devised. Enlarging the dash pot is preferable if it will accomplish the job. Care should be exercised in the choice of dash pot oil. Silicone oils, such as Dow-Corning 200 fluids, are excellent for dampening since their viscosity-temperature slopes are remarkabley flat in comparison with petroleum oils. Oils having a pour point at -100°F and a viscosity of approximtely 100 centistokes in the -60 F to 0 F range should be considered.
Gage Exposure. A height of six feet at Shemya and four feet at Point Barrow should place the gage above the maximum snow level. Blowing snow, however, may occur to heights of 50 feet and may occur about 35 times per year at Point Barrow. Due to added wind effects at an elevation of 50 feet, placing the gage at this level is not recommended. Blowing snow will occur with relatively strong winds. In view of the low catch efficiency of gages with snow in strong winds, it is doubtful that blowing snow will introduce a serious quantitative error in snow measurements over a season, especially when all other sources of error are considered.
Evaluation of New Gages
Evaluations of the Bureau of Reclamation gage and one developed by J. H. Conover at the Blue Hill Observatory follow. As mentioned previously, details of the construction and operation of these gages were not available at the time other gages were evaluated in the Sixth Quarterly Report.
Bureau of Reclamation Radio-Beporting Precipitation Gage
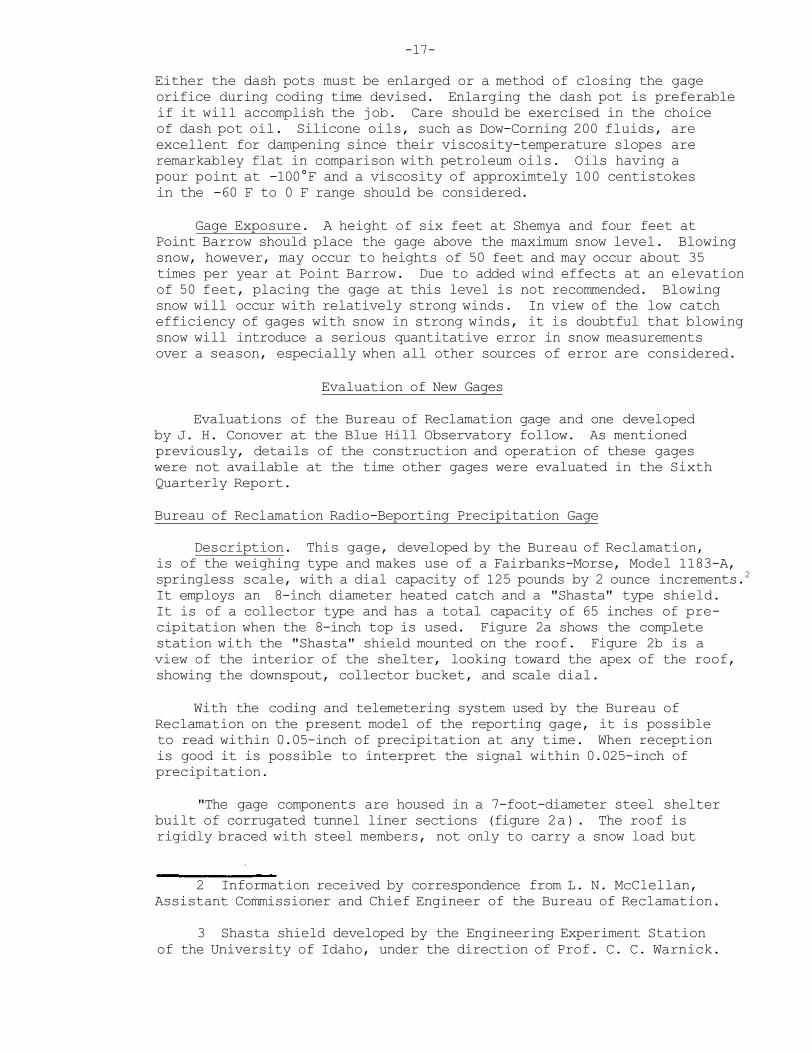
Description. This gage, developed by the Bureau of Reclamation, is of the weighing type and makes use of a Fairbanks-Morse, Model 1183-A, springless scale, with a dial capacity of 125 pounds by 2 ounce increments.2 It employs an 8-inch diameter heated catch and a "Shasta" type shield. It is of a collector type and has a total capacity of 65 inches of precipitation when the 8-inch top is used. Figure 2a shows the complete station with the "Shasta" shield mounted on the roof. Figure 2b is a view of the interior of the shelter, looking toward the apex of the roof, showing the downspout, collector bucket, and scale dial.
With the coding and telemetering system used by the Bureau of Reclamation on the present model of the reporting gage, it is possible to read within 0.05-inch of precipitation at any time. When reception is good it is possible to interpret the signal within 0.025-inch of precipitation.
"The gage components are housed in a 7-foot-diameter steel shelter built of corrugated tunnel liner sections (figure 2a). The roof is rigidly braced with steel members, not only to carry a snow load but
2 Information received by correspondence from L. N. McClellan, Assistant Commissioner and Chief Engineer of the Bureau of Reclamation.
3 Shasta shield developed by the Engineering Experiment Station of the University of Idaho, under the direction of Prof. C. C. Warnick.

-18-
also to provide a rigid base for the support for mounting of the Shasta shield. The size of the shelter was based chiefly on the knowledge of the ferocity and persistence of storms in the central Sierra-Hevada. The shelter is large enough to house not only the weighing mechanism but also the radio transmitters, receiver, batteries, heat exchanger, and additional components and supplies. It was made large enough so that men could enter and work on the equipment or use it as a shelter, if necessary, in comfort and safety."4
Figure 2c is a view through the doorway of the shelter showing the catch bucket, scales, interrogation or "on-call" relay, and the Motorola Handle-Talkie transceiver on the table. Dry cell batteries are on the shelf and storage cells on the floor. The "on-call" system, as used in this gage, reports only the total amount of precipitation in the gage at the time of observation. The receiver at the gage operates constantly. When a report is desired, a modulated tone signal is sent out from the central station. This signal is received by the gage station and is used to set the gages' transmitter and coding device into operation. The intelligence is transmitted for a predetermined period and then the transmitter and coder shuts itself off. The report requires less than two minutes.
One reason for using this "on-call" system was that the best time-cycle control clocks which could be secured were not guaranteed to run with an accuracy greater than plus or minus 20 minutes in one month under field conditions. Consequently, some stations might jam others due to errors in reporting times. The "on-call" system affords the advantage of being able to get reports as frequently as desired. Also, in the event of poor reception or interference at a given time, the operator can call upon the station a few minutes later and receive another report.
Figure 2d shows the scale with the electronic coding device in place, and the catchment bucket in position on the scale platform. The tube on the side of the catchment bucket allows draining without removing the bucket. The upper end of the tube is disconnected and lowered so as to drain the contents through the bottom opening of the catch bucket.
A recording device is not incorporated in the gage; however, it is understood that both Fairbanks-Morse and Toledo springless scales can be supplied with a printing type of recording mechanism, if considered desirable.
Wind Shielding. A very rugged "Shasta" type shield, capable of surviving under rigorous wind and precipitation conditions, is being developed by the Bureau of Reclamation. Perhaps the "Shasta II" shield being tested by Professor Warnick and mentioned in the discussion on wind shielding will prove more successful than present designs.
Melting of Snow. The Bureau of Reclamation gage has a thermostatically-controlled heater to maintain the shelter for the gage at a temperature of about 40°F. This should provide adequate means for melting the collected snow in the catch bucket on the scale platform and for keeping the downspout free of snow.
4 Ibid 2, p. 17

(c) Scales and Catch Bucket (d) Coding Device on Scales
FIG 2 BUREAU OF RECLAMATION RADIO-REPORTING PRECIPITATION GAGE
(a) Complete Station (b) Downspout Assembly
19
-20-
Snov capping. Heat is applied intermittently to the intake tube at the times when the shelter heater is operating. A heat exchanger, employing freon 114 as the media of transport, is used to deliver heat from the shelter's space heater up to the intake tube- A tubular coil is fitted around the shelter heater's exhaust pipe. This coil is connected to a similar one around the upper end of the intake tube of the gage. The freon 114 circulates from one of these coils to the other and thereby transports heat from the heater to the intake tube.
Although the design of the present apparatus does not allow for temperatures as low as -40°F to -60°F, it is the belief of the designers5 that a similar apparatus could be designed to meet these conditions. Actually, it should not be necessary to heat the intake at such low temperatures, since the snow would probably be too dry to stick and cause snow capping at temperatures below 20 F.
Temperature and Wind Compensation. Since this gage is completely housed in a heated shelter at 40°F, temperature compensation does not present a problem.
The fact that the gage is well sheltered and has a long intake tube or downspout makes it less subject to wind disturbance than most other gages. No dash pots are provided in the present design but these could easily be added if deemed necessary.
Gage Exposure. This is probably the greatest disadvantage to the Bureau of Reclamation gage. The height of the intake above ground is of some value in reaching above low blowing snow on some occasions, but the disruption of wind flow by the shelter imposes a problem. The Bureau of Reclamation's round shelter with a conical roof and with the gage intake at the apex of the roof probably is about the best arrangement. The shelter does not need to be as high as the present model except that the extra height makes for ease of servicing the gage. The "Shasta" shield on the gage intake also helps reduce the adverse effects of the shelter.
The many advantages of this gage more than offset this disadvantage.
Evaluation. This is probably the most readily adaptable gage for use in the automatic weather station if it can be built into the station as an integral part, so as to receive' the full benefit of any heat liberated by the other equipment and heaters.
It is understood that plans and specifications for this gage have been made available to the Signal Corps by the Bureau of Eeclamation. It is recommended that consideration be given to incorporating this gage into the automatic weather station.
The heat exchanger used by the Bureau of Reclamation for heating the catch could also be applied in the automatic weather station. It could be thermostatically controlled to operate only at temperatures around 32°F. Also it could be made to operate only when the gage is recording precipitation.
5 Ibid 2, p. 17

-21-The "cm-call" telemetering system seems to be a desirable feature
for the reasons given by the Bureau of Reclamation. Leaving the receiver on would prolong its life and add heat to the shelter and should not produce an undue drain on the power supply. By making frequent calls during suspected heavy precipitation, some information as to the rate of precipitation could be obtained.
A change in the coding system or possibly an increase in the size of the collector would need to be made to increase the sensitivity so that the amount of precipitation can be read to the nearest 0.01 inch. If the catch size is increased, this will reduce the total collection capacity; however, it is sufficiently large to permit some reduction and still accommodate most places for one year. The use of a scale or coder that is sensitive enough to measure 0.01 inch of precipitation with the use of the present 8-inch collector is to be desired, because enlarging the collector would decrease the collection efficiency somewhat.
Strain Type Remote-Recording Precipitation Gage.
Description. This gage was developed by J. H. Conover6. The outstanding features of the gage are that it has a sensitive strain gage capable of measuring amounts of precipitation up to one inch, and has automatic compensating weights to relieve the strain gage, thereby increasing the total capacity to 4.0 inches of precipitation.
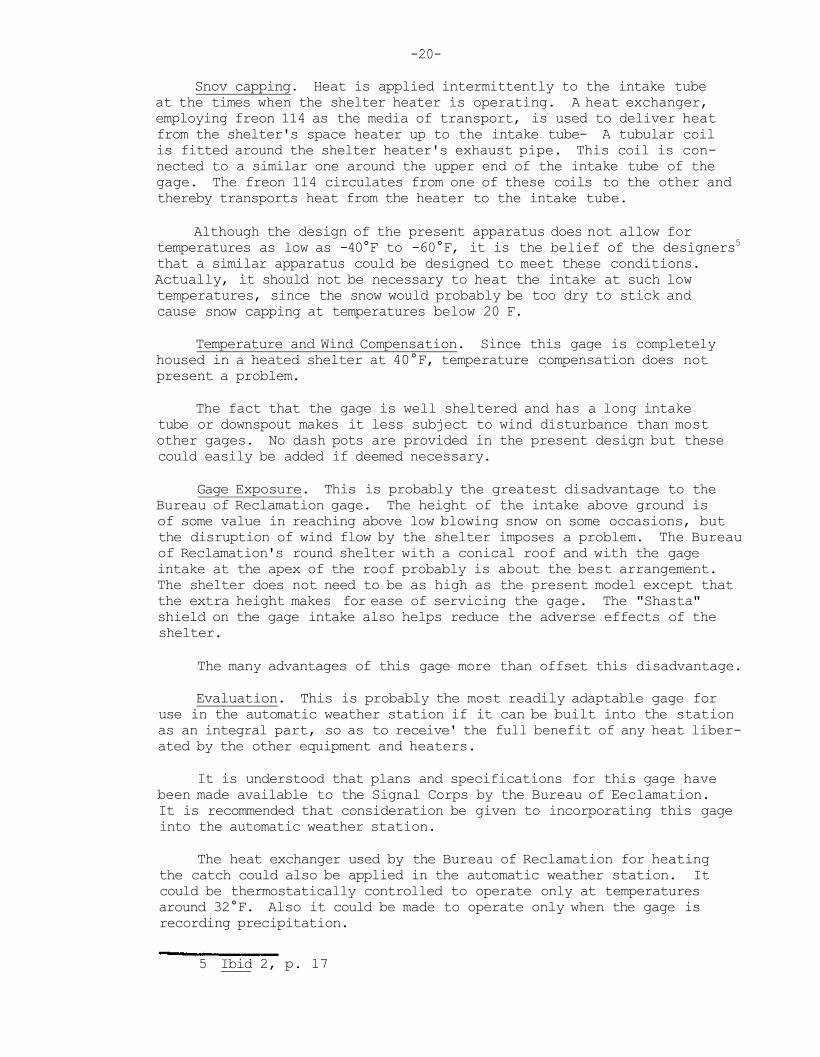
Figure 3a is a schematic drawing of the gage. It employs a beam balance whose primary bearings consist of steel knife edges. The balance has an initial accuracy of about 0.1 gm and a total capacity of about 3 kg. A 7-inch orifice is used instead of the standard 8-inch size because the gage is sufficiently sensitive to permit the use of the smaller orifice. The use of a smaller orifice decreases the wind disturbance and increases the catch efficiency. Figure 3b shows the collector and complete gage.
The beam balance is arranged so that one pan supports the receiving bucket, while the strain bar is mounted below the balance and attached to the bottom of the other pan by means of a chain (figure 3a and c). Thus an accumulation of weight in the receiver bucket deflects the strain bar upward. A deflection of the strain bar produces a change in its electrical resistance. The length of the strain bar is adjusted so that one inch of precipitation (634.9 gm) produces a full scale deflection on the circular recorder chart (figure 3d). A "zero adjust" knob on the recorder is used to zero the pen on the outermost line of the chart so that the most frequent precipitations, which are of low amounts, are recorded near the outside of the chart where the time scale is easier to read. A contacting switch is attached to the recorder to supply 115 volts when the recorder pen reaches one inch of precipitation. This 115-volt supply is used to activate a solenoid at the gage which allows a weight corresponding to one inch of precipitation to roll onto the counterweight pan of the beam balance. By the use of three such counterweights, the gage will measure up to 4.0 inches without overstraining the strain gage, losing precipitation during a syphoning process, or losing sensitivity or accuracy at the recorder.
6 All information courtesy of the inventor, J. H. Conover, Blue Hill Meteorological Observatory, Milton 86, Mass.
c) Gage Mechanism With Shield Removed
(d) Dynalog Recorder Chart Showing Two Rainstorms
FIG. 3 STRAIN TYPE REMOTE RECORDING PRECIPITATION GAGE
(Courtesy J,H.Conover,Biue Hill Meteorological Observatory)
(a) Schematic Drawing Of Precipitation Gage
(b) Gage Installed Showing Heated Collector Ring

-23-Wind Shielding. J. H. Conover plans to increase the depth of the
bucket and make the cylindrical part higher (figure 3b) so as to mount a wind shield around the orifice. A modified "Shasta type" shield will be tried. Good results should he obtained since this gage is smail enough not to greatly disturb the wind field around it.
Melting of Snow. The receiving bucket is made of light-weight, tinned steel, coated with a layer of neoprene, 0.7 mm thick. This protection allows the use of calcium chloride charges in winter to reduce snow to water. No more than 300 cc of standard calcium chloride charges have been tried. The calcium chloride is in the form of oil-coated grains about 3 nam in diameter. The oil helps to prevent absorption of water vapor. According to the inventor, snow was effectively reduced but some water may have been absorbed during fog.
Snow capping. An orifice rim-heater made of nichrome ribbon, glass tape, and resin is installed on the outside of the top of the gage (figure 3b). Conover has found that 40 watts will keep the rim free of wet sticky enow or glaze without appreciably advancing evaporation. Conover suggests that thermostats be mounted at the base of the rim-heater so that heat will only be supplied when the temperature is between about 28°F and 35°F.
Temperature and Wind Compensation. The present model of the gage does not include a temperature compensating mechanism. Such provisions would probably be necessary for operation of the gage at extremely high and low temperatures.
For wind compensation, the gage uses a dash pot filled with a non-evaporating silicone oil, which changes its viscosity by only 2 percent for a 100°F temperature change. The dash pot is attached to the beam balance beneath the receiving bucket. This prevents oscillation of the recorder pen by winds at gust speeds of 20-25 mph at the orifice and greatly dampens oscillations caused by stronger winds. Conover suggests the trial of a magnetic damper in place of the dash pot to further improve the stability of the gage during strong gusty winds.
Gage Exposure. This gage presents less of an exposure problem than most other types due to its small size. However, if the gage was enlarged and modified to handle larger total accumulations it might no longer possess this desirable feature.
Evaluation. This gage, in its present form, is not recommended for use in the automatic weather station because its total capacity is too low and the counterbalancing system is a source of trouble to be avoided if possible. However, for use in regions with very low annual rainfall the present model of the gage might prove very successful.
The thermostatically controlled electric rim-heater suggested for use on this gage might well be adopted for use on other gages.

-24-
TASK B, PRECIPITATION DETECTOR DEVELOPMENT
Introduct ion
A detai led disciss ion of the p rec ip i t a t i on detector development up to 15 November 1953 was included in the Seventh Quarterly Report. Consequently, only a summary of the instrument 's development, along with a detai led description of i t s construct ion, is made in th is f ina l repor t to provide a c lear , concise presenta t ion of the f ina l r e s u l t s . The reader is referred to the Seventh Quarterly Report for de t a i l s on laboratory t e s t equipment and the se lec t ion of shape, s i z e , and materials for the instrument.
Evaluation of Exis t ing Instruments
A study was made of ex i s t ing instruments and methods for p re c ip i t a t ion detection to determine the most applicable type of detector for use in the automatic weather s t a t i o n . As a r e s u l t of t h i s study, it was concluded tha t the Barnothy and Bel l method was the most adaptable, although considerable modification of the instrument 's components would be necessary for the contemplated use . In the Barnothy and Bell p re c i p i t a t i o n detector , an alarm system is ac t ivated whenever a droplet of water wets a heated metal cy l inder . The drople t s t r i kes a b l o t t e r paper, wets through the paper and closes a c i r c u i t from an outer wire winding to an i n t e r i o r metal cyl inder . Heat from the cylinder is used to evaporate the water, thereby reopening the c i r c u i t and completing the detection cycle.
Results of Development
Using the Barnothy and Bel l p r i nc ip l e , a p rec ip i t a t ion detector has been developed to detect r a i n , d r i z z l e , and snow and to i n i t i a t e and complete i t s operational cycle within a 3-minute period as des i re by the Signal Corps. The main components of the instrument a r e : (1) a cy l i nd r i cal foundation of galvanized s t e e l , (2) a heat ing u n i t employing Nichrome V wire and incorporating an e lec t ronic temperature regula tor , (3) a detector winding of copper wire , (4) insu la t ing layers of Fiberglas separating the various elements of the system, (5) a protect ive wind shield to aid in snow detect ion, and (6) an alarm c i r c u i t employing a thyratron tube. A timer c i r c u i t was added to the l a s t model constructed in order to simulate actual weather s t a t i o n operating condit ions. Figures 4a and 4b show the assembled components of the de tec tor .
Laboratory Testing Procedures
An apparatus employing a water sprayer was fabricated to provide a drizzle-type prec ip i ta t ion at an approximate r a t e of 0.02 inch per hour. Fog and mist producing devices were a lso assembled. Steam fog, produced in an enclosed a rea , was used to represent fog. Mist was produced by the use of a fine spray nozzle. The cold rooms of the University of I l l i n o i s Dairy Sciences bui ld ing and meat laboratory were pe r iod i cal ly available for low temperature experiments. Crystals of ice
7 Barnothy, J. and B e l l , B . , Ze i t s ch r i f t fur Ins trumentkunde, Vol. 55, June 1935, pp. 264-65.

-25-
deposited on re f r ige ra t ing pipes were used to simulate snow. Simulated snowfall was provided by sprinkl ing ice c rys ta l s into the a i r stream from a 12-inch e l e c t r i c fan.
Experimental models of p rec ip i t a t ion detectors were placed in the t e s t area of simulated condit ions, and graphic r e su l t s of the frequency and magnitude of deteetions with respect to time were obtained from an Esterline-Augus e l e c t r i c a l recorder . In most cases, the use of the drizzle detect ion method provided suf f ic ien t information to evaluate model construction problems. When these specif ic problems in model construction were solved for d r i z z l e , t e s t ing in simulated mist, fog, and snow was performed.
A t o t a l of eleven models of the detect ion element were b u i l t . Some of the e a r l i e r ones were in the form of a pyramid. A cyl indr ical shape was f ina l ly decided upon because it was eas ier to assemble and almost as e f f i c i en t as other shapes. Most of the ea r l i e r models developed defects and had to be dismantled (see Sixth Quarterly Report) . Several of these were modified and r e b u i l t as new models.
Instrument Construction
Construction of the p rec ip i t a t ion detector was guided by: (1) the basic pr inc ip les of construction of the Barnothy and Bell detector 8 , (2) the requirement for unattended, long-term operation, and (3) the f a c i l i t i e s of the automatic weather s t a t ion . The form of the detector was dic ta ted by the need of a meteorologically acceptable method of exposure and by l imi ta t ions of fabr icat ion. Choice of materials was based on operational acceptab i l i ty , resistance to de ter iora t ion , and cos t .
Construction Schedule for Detector Element.
Construction proceeds as follows (refer to figure 4c):
1. Two notches, 3/4-inch long, are cut in a 10-inch piece of 5/8-inch, thin-wall conduit of welded, cold-rol led, galvanized s t e e l . The notches extend halfway through the pipe and are spaced 2-3/4 inches apar t , center to center , and 3-5/8 inches from each end.
2. Two wooden plugs, having axia l 1/4-inch holes, are machined to f i t the notches so tha t t he i r outer surface is flush with the p ipe . For the lead- in wires, each plug is provided with three l / l 6 - inch holes, extending from the top of the plug to the axia l hole.
3. After the s ix lead- in wires have been drawn through the wooden plugs, and a l l brought out of one end of the p ipe , t ha t portion of the pipe between the wooden plugs is wrapped f i r s t with a layer of Dow-Corning S i l a s t i c R tape, and then with a layer of No. 126 Fiberglas, to insu la te the heater wire from the p ipe . Fiberglas is manufactured by Owens-Corning Fiberglas Corp., Toledo, Ohio.
8 Ibid 7, page 2k.

(a) Detector Elements Shielded And Unshielded
Electronic Equipment L. to R. Recorder, Temp. Regulator And Thyratron, Variac, Timer.
6. Wind with Nickel No. 36 wire. 7. Wrap with Fiberglas No. 120. 8. Wrap with 0.005 in. copper foil. 9. Wrap with layer of Fibergias No. 120. 10. Wind with copper No. 26 wire. 11. Seal ends with plastic wood.
(c) Schematic And Construction Schedule For Cylindrical Detector Element
FIG.4 PRECIPITATION DETECTOR
)1. Cut notches in pipe. 2. Insert wood anchor plugs. 3. Wrap with layer of Fiberglas No. 126. 4. Wind with Nichrome V No. 30.
heater element wire. §5. Wrap with layer of Fiberglas No. 126

-27-
4. Twenty turns of Nichrome V No. 30 wire, manufactured by Driver-Harris Co. of Harrison, New Jersey, is wrapped on the pipe, approximately 1/10 inch between turns, and anchored to the lead-in wire in each plug, which is nearest to the length-wise center of the pipe. This winding has a resistance of approximately 25 ohms. In one of the last two models field tested, a Nichrome 7 NaT 20 wire winding, having a resistance of about two ohms, was used for the heater. The advantage of the smaller wire is that less current is required for the same amount of power; hence, the current requirements of relay contacts and the step-down transformer for the heater are reduced.
5. A layer of No. 126 Fiberglas is wrapped over the heater wire, and a small bit of Silastic R tape is placed over the heater wire connections to the lead-in wires for insulation purposes.
6. Nickel wire No. 36 is wound over this layer, 1/10-inch between turns. This winding has a resistance of approximately nine ohms at 75°F. The ends of the nickel wire are connected to two lead-in wires, one in each plug. This wire provides a means of controlling the temperature of the detector.
7. A layer of No, 120 Fiberglas is wound over the nickel wire, and small bits of Silastic B tape are placed over the connections to the lead-in wires.
8. Sheet copper, 0.005-inch thick, is wrapped snugly around the Fiberglas, and soldered at each end of the overlap. One of the lead-in wires is also soldered to this copper sheet at the overlap.
9. No. 120 Fiberglas is wrapped over the sheet copper.
10. No. 26 copper wire is then wound over this Fiberglas, approximately l/8-inch between turns. One end of the copper wire is connected to the remaining lead-in wire, and the other end is fastened to a small screw in the other wooden plug.
11. The frayed ends of the Fiberglas are tied down with "Plastic Wood", which is spread smoothly around the circumference of the pipe at each end of the detector. This also serves as a water-tight seal to keep moisture out of that portion of the detector beneath the sheet copper. The "Plastic Wood" is manufactured by Boyle-Midway Inc., Chicago, Illinois.
Wind Shield
A wind shield is provided to aid in snow detect ion. This wind shield measures 18 inches in length by 10 inches in diameter and is fabricated from l8-gage f l a t expanded metal having 1.0-inch by 0 . 3 -inch diamond perforat ions. The detector is mounted cent ra l ly and along the diameter of the shield (see figure 4a). The complete assembly is then post mounted with the cylinder standing v e r t i c a l l y .
-28-Electronic Equipment
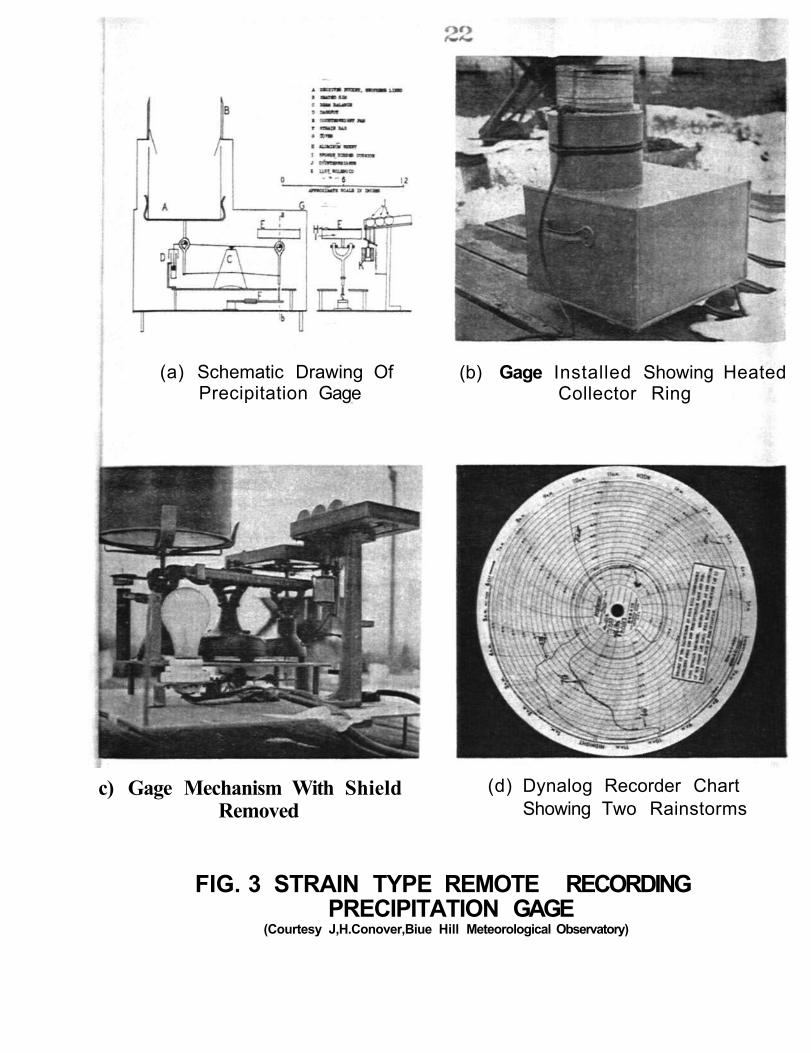
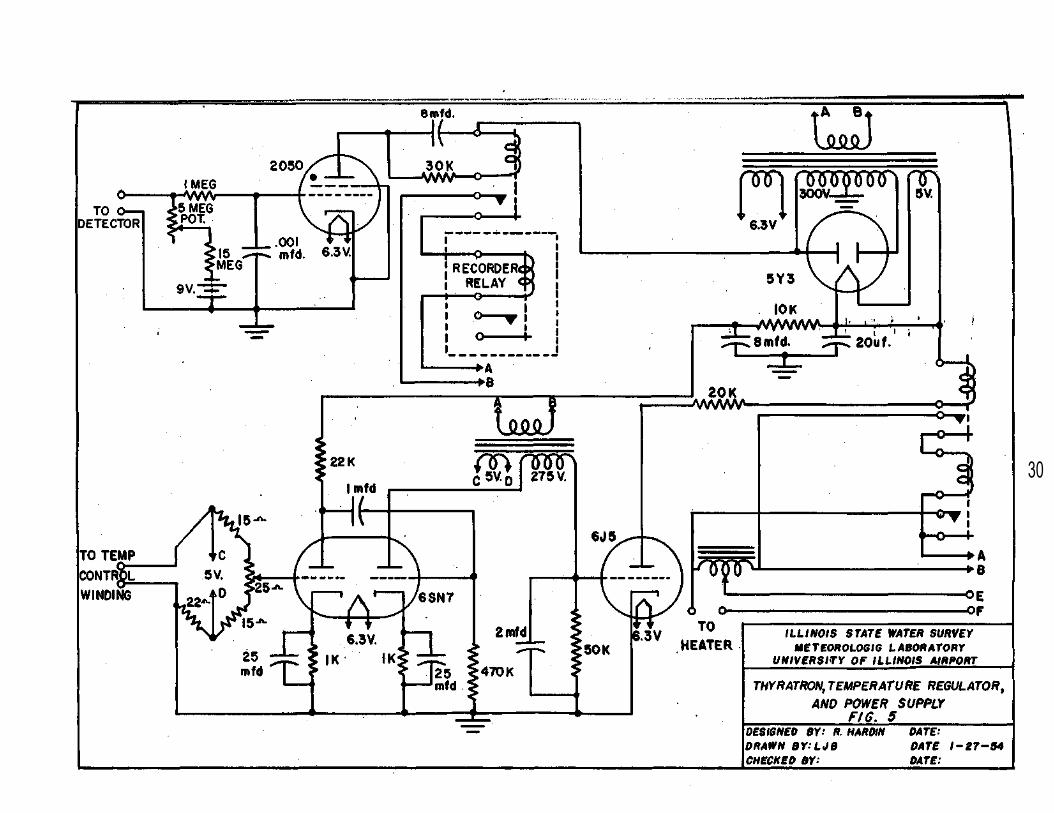
Power Supply. A 5Y3 full-wave rectifier tube, operating off a 600-volt, center-tapped, 50-milliampere power transformer, provides the necessary D.C. voltage for the temperature regulator (figure 5). Three hundred (300) volts A.C. for the plate of the thyratron in the alarm circuit is obtained off one side of the power transformer. The power transformer also has a 6.3-volt winding at 2 amperes, and a 5-volt winding at 2 amperes, for the 5Y3 filament. A capacitor-input filter is used.
Alarm. A voltage divider network in the grid circuit of 2050 thyratron tube is the essence of the alarm circuit (figure 5). The plate voltage on the 2050 tube is 300 volts A . C , obtained from the power transformer. Two 4.5-volt dry cells in series with a 15 megohm, l/2-watt resistance, and a 5-megohm potentiometer, in the grid circuit of the 2050 tube, are shunted across the detector. The sheet copper in the detector is connected to the cathode (ground), and the copper wire winding is connected to the grid. A description of how the alarm works is given below:
When a drop of rain lands on the detector: (1) the resistance from grid to cathode is reduced (2) the voltage on the grid becomes more positive (3) the thyratron "fires," or becomes conductive (4) the relay in the 205O tube plate circuit closes (5) the alarm is sounded
The drop of rain quickly dries because the detector is kept warm. The following sequence then takes place:
(1) the resistance of the detector increases (2) the voltage on the grid cf the 2050 tube becomes
more negative (3) the tube ceases to conduct current (4) the plate circuit relay opens (5) the alarm is turned off
The 1-megohm resistance, in conjunction with the 0.001-microfarad mica capacitor in the grid circuit, is of some value in preventing false firing due to "stray" or "pickup" voltages. Of more importance in preventing false firing is the shielded cable used in connecting the detector to the alarm circuit. The sheet copper in the detector is connected to the shield and grounded; the outside copper wire on the detector is connected to the inner conductor of the shielded cable.
The variable resistance in the grid circuit provides a means of adjusting the sensitivity of the detector. By varying this resistance, the value of resistance which must appear at the detector to cause the thyratron to fire, is varied. It was found that for a "firing resistance" above 15 megohms, the circuit is rather unstable and some false firing occurs. During field tests, a firing resistance of about 10 megohms was used and found very satisfactory.

-29-Temperature Regulator. The No. 36 nickel wire in the detector
forms one side of a Wheats tone bridge (figure 5). Five volts A.C. is impressed across the bridge, and a triode (1/2 6SN7) serves as the bridge detector. The A.C. voltage produced by an imbalance in the bridge, which in turn, is produced by the nickel wire being too hot or too cold, is amplified by this triode and fed to the second half of the 6SN7. This half of the 6SN7 acts as a "phase detector". If the voltage on the grid is negative when the voltage on the plate is positive, the tube will not conduct. This results in a more positive grid voltage at the 6J5, the 6J5 becomes more conductive, and the relay in its plate circuit, which controls the power delivered to the heater in the detector, closes. The foregoing is the case when the nickel wire is too cold.
The phase relationship between the voltage applied to the bridge and that applied to the plate of the second half of the 6SN7 must be checked when the circuit is wired, to prevent the heater power relay from closing when the nickel wire is too hot. The plate voltage on the second half of the 6SN7 is supplied by a 275-volt, 50-milliampere transformer. This transformer also supplies the five volts impressed across the bridge.
The 25-ohm potentiometer in the bridge provides a means of adjusting the regulator to maintain the detector at any desired temperature. With the circuit components shown in the schematic diagram (figure 5), the bridge can be balanced when the resistance of the nickel wire in the detector is any value between 4 and 25 ohms. Thus, to maintain the temperature at a desired value, one must adjust the potentiometer in the bridge circuit so that the bridge will be balanced at that value of resistance which the nickel wire will present at the desired temperature. A Bureau of Standards9 calibration curve for nickel was used to obtain a temperature calibration curve for the nickel wire in the temperature control winding on the detector element (see Seventh Quarterly Report).
Timer. A timer was constructed for use during field tests to similate the operation of the detector in the automatic weather station (figure 6). The timer turns the equipment on for three minutes during every hour. An hourly observation was used instead of the required three hourly observation in order to give the instrument more tests. The temperature regulator was adjusted to hold the temperature of the detector at 350°F for the first 1.5 minutes. Tests have shown that the detector can be cleared of ice and water in one minute under the most severe weather conditions. The power to the heater is turned off 1.5 minutes after the equipment is turned on, and remains off during the rest of the three-minute period. The detector is then allowed to cool as the prevailing ambient weather conditions dictate, and reaches a temperature range within which precipitation detection is possible. This temperature range was found to be below 225 F for very light rains, and between 100°F and 250°F for the best detection of snow. Tests under various simulated weather conditions have shown that the detector cools to these ranges within one minute.
9 Handbook of Chemistry and Physics, 33rd Edition, pp. 2142, 1951-52.
30

30a
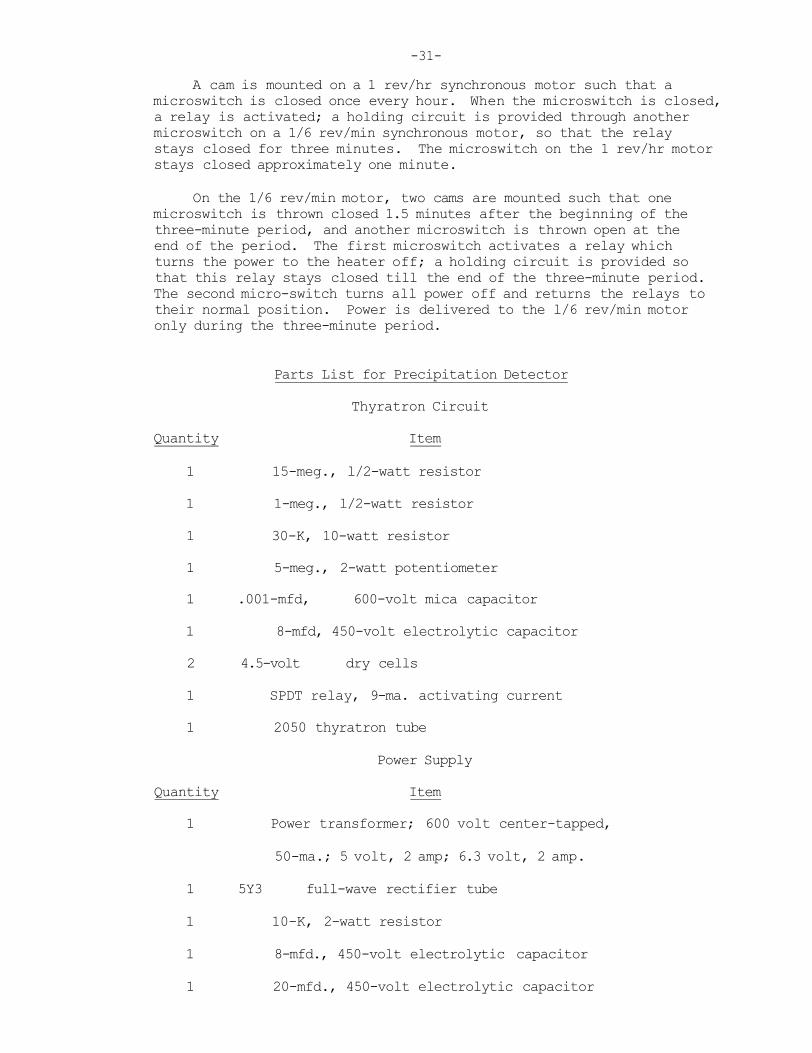
-31-A cam is mounted on a 1 rev/hr synchronous motor such that a
microswitch is closed once every hour. When the microswitch is closed, a relay is activated; a holding circuit is provided through another microswitch on a 1/6 rev/min synchronous motor, so that the relay stays closed for three minutes. The microswitch on the 1 rev/hr motor stays closed approximately one minute.
On the 1/6 rev/min motor, two cams are mounted such that one microswitch is thrown closed 1.5 minutes after the beginning of the three-minute period, and another microswitch is thrown open at the end of the period. The first microswitch activates a relay which turns the power to the heater off; a holding circuit is provided so that this relay stays closed till the end of the three-minute period. The second micro-switch turns all power off and returns the relays to their normal position. Power is delivered to the l/6 rev/min motor only during the three-minute period.
Parts List for Precipitation Detector
Thyratron Circuit
Quantity Item
1 15-meg., l/2-watt resistor
1 1-meg., l/2-watt resistor
1 30-K, 10-watt resistor
1 5-meg., 2-watt potentiometer
1 .001-mfd, 600-volt mica capacitor
1 8-mfd, 450-volt electrolytic capacitor
2 4.5-volt dry cells
1 SPDT relay, 9-ma. activating current
1 2050 thyratron tube
Power Supply
Quantity Item
1 Power transformer; 600 volt center-tapped,
50-ma.; 5 volt, 2 amp; 6.3 volt, 2 amp.
1 5Y3 full-wave rectifier tube
1 10-K, 2-watt resistor
1 8-mfd., 450-volt electrolytic capacitor
1 20-mfd., 450-volt electrolytic capacitor

-32-
Temperature Regulator
Quantity Item
2 15-ohm, I -wat t r e s i s t o r
1 22-ohm, 1-watt r e s i s t o r
2 1-K, 1-watt r e s i s to r
1 22-K, 1-watt r e s i s t o r
1 470-K, 1-watt r e s i s t o r
1 50-K, 2-watt r e s i s to r
1 20-K, 10-watt r e s i s t o r
1 25-ohm, 2-watt potentiometer
1 0.1-mfd, 600-volt paper capacitor
2 25-mfd, 25-volt e l e c t ro ly t i c capacitors
1 2-mfd, 250-volt e l e c t ro ly t i c capacitor
1 . 6SN7 tube
1 6J5 tube
1 Transformer; 275 volt, 50 ma.; 5 volt, 2 amp.
1 SPDT relay, 9-ma. activating current
1 SPDT relay, 115-volt coil, 15-amp contact
1 115-volt variac, 15 amps.
Timer Circuit
Quantity Item
1 1 rev/hr synchronous motor
1 l/6 rev/min synchronous motor
3 Microswitch, SPDT, 5-amp contact
2 DPDT relay, 115-volt coil, 15-amp contact
-33-
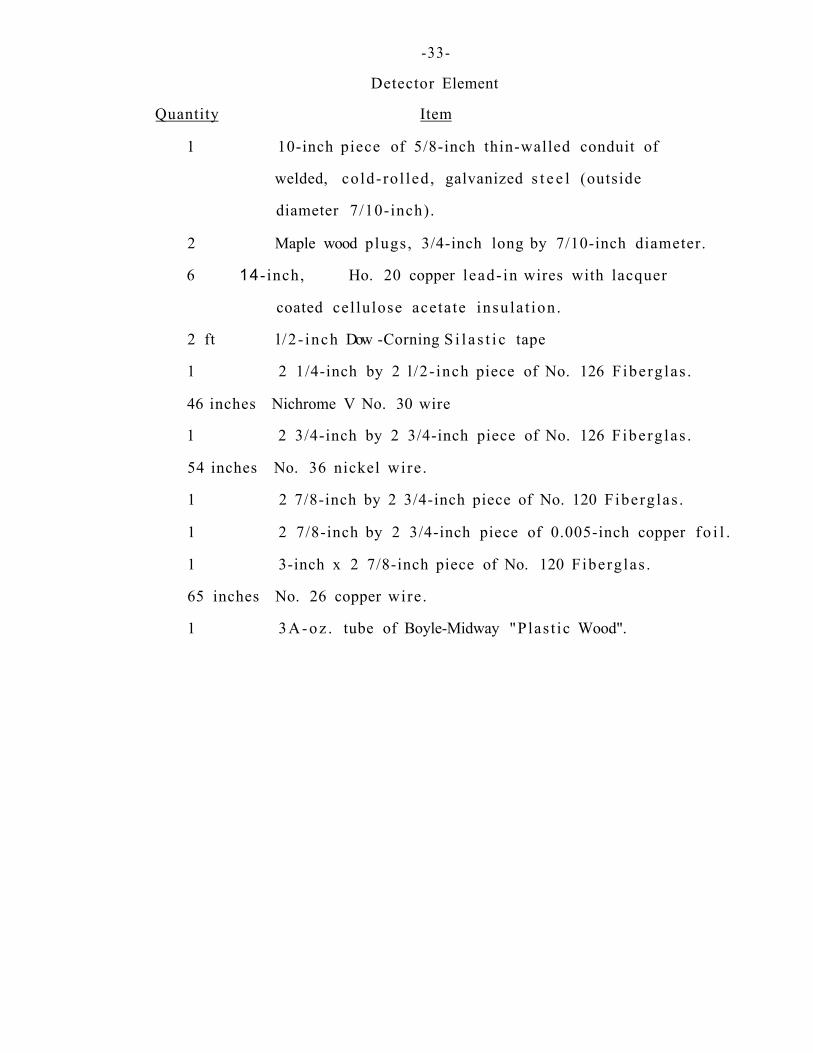
Detector Element
Quantity Item
1 10-inch piece of 5/8-inch thin-walled conduit of
welded, cold-rol led , galvanized s t e e l (outside
diameter 7/10-inch).
2 Maple wood plugs, 3/4-inch long by 7/10-inch diameter.
6 14- inch, Ho. 20 copper lead- in wires with lacquer
coated cel lulose acetate insula t ion .
2 ft l /2 - inch Dow -Corning S i l a s t i c tape
1 2 1/4-inch by 2 l /2- inch piece of No. 126 Fiberg las .
46 inches Nichrome V No. 30 wire
1 2 3/4-inch by 2 3/4-inch piece of No. 126 Fiberg las .
54 inches No. 36 nickel wire .
1 2 7/8-inch by 2 3/4-inch piece of No. 120 Fiberglas .
1 2 7/8-inch by 2 3/4-inch piece of 0.005-inch copper f o i l .
1 3-inch x 2 7/8-inch piece of No. 120 Fiberglas .
65 inches No. 26 copper wire.
1 3A-oz . tube of Boyle-Midway "Plas t ic Wood".

-34-Instrument Operation
Method of Operation The operation of the instrument at the automatic weather station
will be on an intermittent basis; that is, it will be used 3 minutes during each 3-hourly observation. For the exposure time of three minutes, the following division of time is suggested.
1. Tube warm up, power on and detector off 1/4 minute 2. Clearing time, power on and detector off 1 minute 3. Detection time, power off and detector on 1 l/2 minutes 4. Coding time, power off and detector on 1/4 minute
TOTAL 3 minutes 1. "Tube warm up" represents the time necessary to warm and
activate the tubes of the temperature control unit and the thyratron tube.
2. "Clearing time" represents the time necessary to rid the instrument of any water or ice that accumulated on it during the preceding 2 hours and 57 minutes of inoperativeness.
3. "Detection time" represents the estimated time available for detection purposes
4. "Coding Time" represents the estimated time necessary to transfer the intelligence from the detector to a coding and transmitting mechanism.
Results of Laboratory and Preliminary Field Tests Laboratory Tests. The tube warm-up time ranged from 10 to 15
seconds in the laboratory at temperatures of 70°F to 90°F. Clearing time for drying off the detector element ranged between 50 and 60 seconds for an instrument temperature of 350°F and a power input of 200 watts. These tests consisted of a thorough soaking of the detector and measurement of the time necessary for the instrument to become completely dry. The tests were conducted in a cold room with the instrument saturated with frozen water and an air temperature of -2°F, and in the laboratory with water saturation at 65°F and an air temperature of 80°F.
The estimated power requirement, obtained from heat transfer calculations, is 110 watts for an extreme condition of -40°F air temperature, 40 mph wind velocity, and 212°F instrument temperature. The 212 F temperature assumes that the surface of the detector is covered with boiling water at 212 F even though the internal temperature may be at 350°F. Calculations of the power required to boil away 1.5 grams of water, the detector's approximate capacity, indicated that 70 watts for one minute would be necessary. Combined with the preceding estimated 110 watts, it is seen that l80 watts would be required to meet a realistic extreme condition. On this basis, 200 watts input power was selected as a safe operating value for the instrument.
-35-As noted previously, 1 l/2 minutes of a 3-minute operating
period are to be devoted to precipitation detection. Ordinarily this should be sufficient to detect precipitation at rates as low as 0.02 inch per hour. Laboratory tests have shown that when the detector element temperature exceeds 230°F, droplets of drizzle or mist are not easily de tec table. Presumably, they are evaporated before they can wet thV insulation. Since the detector element is maintained at 350°F at the beginning of the detection period, there will be a short period during which time the temperature is dropping, when drizzle will not be detected. In the laboratory, tests showed detection of drizzle at 0.02 inch per hour within one minute after beginning of detection time. Tests also showed that simulated snow and large water drops were not affected by the high surface temperature .
In order to detect snow under windy conditions, it was found necessary to shield the detector element from direct impact by the wind. Snow particles upon hitting the warm surface of the detector apparently need a fraction of a second in which to raise their temperature to 32 F, melt, and enter the insulation. When subject to direct impact by wind it is probable that they are swept from the instrument surface before they have time to melt. This difficulty was overcome in laboratory tests by surrounding the detector with a perforated metal cylindrical shield which interrupts the wind, yet permits precipitation particles to enter the instrument area and to be detected in an eddy zone.
Preliminary Field Tests. The last three models of the detector element were field tested. Two of these are shown mounted on a roof in figure 4a. Also, an earlier pyramid model was field tested during the period 22 August to 16 September 1953.
The pyramid model was operated without a timer or temperature regulator. A constant amount of power was supplied to the heater coil in sufficient quantity for the existing temperatures. On several occasions, "traces" of rain were detected that showed no record on nearby recording raingages.
The first of the three cylindrical models of the detector element was operated from 16 October to 12 December 1953. It was first operated without a temperature regulator or timer. On 19 November, the first model of the temperature regulator was coupled to this detector. The detector element appeared to develop short circuits and gave false indications of precipitation. When the temperature regulator was added, it also gave troubles of various nature. Part of the false indications of precipitation were determined to be due to "stray" or "pickup" voltages on the cable connecting the detector to the alarm circuit. Much better results were obtained when the insulated wire was replaced by a shielded cable; however, the detector was still somewhat erratic in operation.

-36-A second cylindrical model of the detector element, rising a
smaller heater wire (No. 30 Nichrome) and a new temperature regulator, replaced the first field test model on 12 December 1953. The second model successfully detected traces and low rates of rain and snow until 30 December 1953 when it developed a short circuit and had to be dismantled.
On 5 January 1954, third field test model of the detector element was installed using a timer and a temperature regulator. This detector element used some parts from the first field-tested model described previously. The third model was installed without a windshield (see figure 4a). It was operated until 3 February 1954, at which time the complete detector, including the alarm and temperature regulator components, was stored for future reference or shipment to the Signal Corps upon their request. This third model operated successfully during the period it was tested, except that on one occasion it detected large flying particles of frost.
On 27 January, the second field-tested model of the detector element was rebuilt and placed in operation. It operated successfully until 15 February 1954 when a short circuit developed.
It was worthy of note that during these four field trials the detector elements at first worked successfully and later developed troubles after several occurrences of precipitation or after one long interval of precipitation. Apparently, the elements became polluted and developed short circuits because of electrolytic action, or the cables and leads developed shorts due to water seepage through the seals.
Suggestions for Future Application
The primary difficulty with the precipitation detector seems to be in the construction of the detector element. Machine methods of production and the use of better water seals should do much to eliminate the troubles.
It is also very important to have all electrical connections water-tight and free of condensed moisture. A very small amount of. moisture in the electrical connections can cause the current to bypass the detector element and actuate the alarm circuit.
The detector element should be covered except at observation time in order to reduce dust collection upon it. In Arctic regions this may not be necessary, but in regions with moderate amounts of dust it seems to be important. It is probable that the dirt and water sets up electrolytic action that eventually creates permanent short circuits in the detector element.
Conclusions
If the foregoing suggestions for future application are followed, it is believed that the developed instrument will give satisfactory performance. However, further field trials should be made before the precipitation detector is integrated into the automatic weather station observational program.

-37-TASK C, DUST MEASUREMENT STUDY
Introduction
The purpose of this study was to ascertain vhat types of atmospheric dust measuring devices have been developed and to evaluate these devices according to their adaptability for use in the automatic weather station. Adaptability was based upon the Signal Corps technical requirements listed in the section entitled, "Purpose."
The various devices were classified into types for evaluation purposes. Typical devices under each type have been described and conclusions and recommendations presented regarding their adaptability for the automatic weather station. A selected list of references pertaining to the problem has been included.
Classification of Air Contaminants
The following classification of air contaminants was obtained from Heating, Ventilating, and Air Conditioning Guide (4). The term "aerosol" is frequently used to include all of these contaminants.
Dusts
Dusts are solid particles projected into the air by natural forces, such as winds, volcanic eruptions, and earthquakes; and by mechanical processes, such as crushing, grinding, milling, drilling, demolition, shoveling, conveying, screening, bagging, and sweeping. Some of these forces produce dust from larger masses, while others simply disperse materials which are already pulverized. Generally, particles are not considered dusts if they are larger than 100 microns. Dusts may be of mineral type, such as rock, ore, metal, sand; vegetable, such as grain, flower, wood, cotton, pollen; or animal, such as wool, hair, silk, feathers, leather.
Fumes
Solid particles commonly formed by the condensation of vapors from normally solid materials such as molten metals are classified as fumes. Metallic fumes generally occur as oxides in the air due to the highly reactive nature of finely divided matter. Fumes may also be formed by sublimation, distillation, calcination, or chemical reaction, whenever such processes create airborne particles predominately less than the one micron size. Fumes permitted to age tend to flocculate into clumps or aggregates of larger size, thereby facilitating removal from air.

-38-Smokes
Smokes are extremely small solid particles produced by incomplete combustion of organic substances such as tobacco, wood, coal, oil, tar, and other-carbonaceous materials. The term "smoke" is commonly applied to the mixture of solid, liquid, and gaseous products of combustion, -although the technical literature prefers to distinguish among such components as soot or carbon particles, fly-ash, cinders, tarry matter, unburned gases, and gaseous combustion products. The finest particulate constituents are much less than one micron in size, often in the range of 0.1 to 0.3 micron.
Mists and Fogs
Both mists and fogs are particulate air contaminants. Mists are very small airborne droplets of materials that are ordinarily liquid at normal temperatures and pressures. Fogs are airborne droplets formed by condensation from the vapor state,
Vapors and Gases
These substances are non-particulate air contaminants. Vapors are the gaseous phases of substances that are either liquid or solid in their commonly known state. Examples are gasoline, kerosene, benzene, mercury, iodine, and camphor. Gases are normally formless fluids which tend to occupy a space of enclosure completely and uniformly at ordinary temperatures and pressures.
Sizes of Airborne Particles
Figure 7 is a graphic tabulation of the properties of airborne solids and liquids arranged according to size on the micron scale (4).
Particles larger than 10 microns are unlikely to remain suspended in air currents of moderate strength, but settle out by gravity. Speed of settling is dependent upon the shape, size and specific gravity of the particle; wind velocity; orientation of the collection surface; and topography. These larger particles are of major interest to the engineer in solving nuisance problems, but it is usually the smaller particles (less than 10 microns) that remain in the air long enough to be of hygienic as well as economic significance.
Industrial dust particles are predominantly of the order of one micron in size. Tremendous numbers are also present in the sub-microscopic range below 0.5 micron. Those below 0.1 micron are not believed to be of particular importance, due to their exceedingly small mass in comparison with the balance of airborne matter. In fact, particles this small may become the permanent atmospheric impurities that have little, if any, opportunity of settling because of the continual motion imparted to them by air currents and the molecular activity of gases (Brownian Movement).

-39-The lower limit of particle size visible to the naked eye cannot
be stated definitely. It depends not only upon the individual eye, but also upon the shape and color of the particle, intensity and quality of the light, and the nature of the background or opportunity for contrast. Under ideal conditions, a particle of 10-micron size might be recognized, while under less favorable conditions it may be impossible to distinguish a particle smaller than 50 microns. The lower limit of visibility probably ranges from 10 to 50 microns.
In this study, attention has been centered on particles with diameters of one micron and larger, since particles in this range are temporary atmospheric impurities as shown in figure 7. The more adaptable dust measuring devices for use in the automatic weather station do in some instances detect particles smaller than one micron in diameter; however, such measurements are not considered to be highly significant for meteorologic purposes.
Dust Measurement Devices
Numerous dust measuring devices have been developed through the years. Most of these devices can be fitted into one of the following six classifications, according to the physical basis of operation.
1 . F i l t r a t i o n 2. Settlement 3. Washing 4. Precipitating
a. thermal b. electrical c. sonic
5. Impingement 6. Photo-e lect r ic devices
Examples of each type will be discussed in this report although those in groups 5 and 6, or combinations thereof, seem most suitable for use in the automatic weather station.
Filtration Devices
Automatic Filter. The automatic filter shown in figure 8a and 8b is an example of the filtration type. This instrument provides an hourly record of the concentration of dust. It was designed by Dr. J. S. Owens in 1918 and has been widely used (53). It is usually placed indoors, and air is drawn in from outside through the inlet tube C (figure 8b). The instrument is connected at I to a water supply, and provision is made for outgoing water to be drained from G.
The tank A is repeatedly filled with water and emptied again; the syphon G is a self-operating type, and the whole mechanism is governed by the filling and emptying. During syphoning, two liters of air are drawn through the filter paper E, on which is left a dust stain O.32 cm in diameter. During filling, the filter paper is moved to a new position by an arrangement of a clock and weight, which is

-40-
shown at the top of the instrument in figure 8a. The filter paper is circular, having a diameter of 18 cm. The hours 0 to 23 are printed near the edge, and the dust stains are produced within 1 cm of the edge of the paper.
The weight of dust in each stain is found by visual comparison with a standard scale of shades. The "shade number" is multiplied by 0.32 to convert it to an estimate of dust concentration in milligrams per cubic meter of air.
In many regions relatively free from dust, two liters of air are not sufficient to make a readable stain on the filter paper. The automatic filter may easily be modified to draw three to five times as much air at each syphoning by placing a sealed tank of suitable diameter at the same level as tank A, and connecting the two tanks by pipes at the top and bottom. The conversion factor, to get the dust concentration in milligrams per cubic meter, is then
0.32 x 2, V
where V is the volume syphoned in liters.
The automatic filter would require modification for use in an automatic weather station, and even then it probably would not be completely satisfactory. The liquid operation would give trouble in some climates even if a closed return reservoir with a gravity head were used. It would probably be better to replace the liquid with a metered pump that would pump a known volume of air through the filter during the first half of the 3-minute operating period of the automatic weather station. Under light dust conditions, it would be difficult to obtain a detectable sample in the 1.5-minute sampling period. Also, a photo-electric analyzer for the filter paper would have to be incorporated to make the data available for coded radio transmission.
Thimble and Sugar Tube Filters. The thimble and the sugar tube filters are shown in figure 8c and 8d (63). Neither of these would be suited to the automatic weather station due to their complex methods of analysis. The thimble filter catches the dust in cotton or wool filling inside a paper thimble through which the air is drawn. The filter must be taken apart and the cotton or wool filling removed for analysis of dust content. The sugar tube filter collects the dust in a filter of granulated sugar through which the air is drawn. The sugar is then refined in order to collect and measure the dust. Both of these instruments are mainly suited to laboratory use.
Settlement Devices
Standard Gage. The standard gage shown in figure 9 is an example of one type of settlement device (53). The dust is usually permitted to settle in the funnel-shaped catch basin until rain occurs and washes the deposits into the catchment bottle beneath the basin. The sample is then distilled and the residue analyzed for amount and kind of material. This device would be suited only for attended stations at which fast sampling at a given time is not required.

-41-Washing Devices
Palmer Apparatus. The Palmer apparatus shown in figure 10 is an example of an instrument employing the washing principle (21). The great difficulty in extracting all particles and the possible loss of soluble particles are disadvantages of this method. Palmer's apparatus draws in a high velocity air current through 40 cubic centimeters of water in the inverted flask shown in figure 10. Particles from one cubic centimeter are then counted in a cell after they have settled out.
Methods have been developed for analyzing particles suspended in a fluid by use of a Tyndall beam and a photo-electric recorder, which will be discussed under photo-electric devices. However, for long term unattended use, maintaining or obtaining the supply of clean liquid for washing the air would impose an undesirable problem.
Most washing devices are difficult to clean and not highly efficient except for the collection of large particles. They have not been used often in recent years, since more accurate and simpler determinations may be made with impingers and other devices.
Precipitating Devices
Several types of these devices have been developed. The types include thermal, electrical, and sonic precipitators.
Thermal Precipitator. Figure 11 shows the Green and Watson thermal precipitator which is a good example of its types. In the Green and Watson model (21), dusty air is drawn through a slot O.O51 x 0.95 cm in cross section at a velocity of 140 cm per minute. Centrally located across the slot is a nichrome wire, 0.025 cm in diameter, which is heated electrically to a temperature of 100°C. The walls of the slot at this point are formed by 3/4-inch cover slips backed by polished blocks of brass, which act as heat conductors and thus keep the glass surface cool (see fig. 11b). A thermal gradient sufficiently steep to insure complete precipitation is obtained in this way, and dust samples are collected in the form of well-defined deposits of equal shape and density on the two cover glasses. These glasses are removed after sampling and mounted, dust side down, on a standard microscope slide for counting with the aid of a miscroscope.
The thermal precipitator could be used to collect a sample for detection and reporting by a photo-electric device; however, it would probably be too slow for the sampling time alloted to the automatic weather station. Also, a combination instrument of this type would probably be too complex for unattended use.
Electric Precipitator. The principle of electric precipitation has been utilized successfully for the collection of small quantities of industrial dust. Dust-laden air is passed between two surfaces carrying a high electric potential, and under the force of the electric field, the particles are driven in a direction normal to the air motion and are so precipitated upon the collecting surface. The precipitation

-42-
results from two forces: (1) electrostatic attraction, and (2) ionic bombardment of the electric wind created by the corona discharge. The latter is of greater magnitude.
The design of the instrument was studied by Drinker, Thomson, and Fitchet (18) who determined optimum tube dimensions, precipitating voltage, sampling rates, etc., and showed that, due to its small dimensions, the apparatus functions as well on alternating as on direct current. The design described by Drinker (l6) is shown diagram-matlcally in figure 12a. Precipitation tubes of pyrex glass are made in two sizes. The larger tube is used in miscellaneous dust sampling at 15,000 volts, which is obtained from the alternating-current lighting circuit through a General Electric "luminous tube transformer;" the smaller operates with a potential of only a few thousand volts obtained by means of a storage battery and induction coil. The central electrode in the large- instrument is gold-plated drill steel and is held in alignment by means of a rubber stopper (see figure 12a). Fine copper wire is used in the low-voltage tube, and it is conveniently supported by rubber stoppers at both ends. The outer electrode is preferably made of 12-mesh copper screen wrapped tightly around the tube and secured in place with adhesive tape. The open screen permits one to see the shape and density of the dust deposit and thus aids in determining the proper sampling time.
A vacuum-cleaner unit is used as a source of suction. The maximum fan capacity for general work is 50 liters per minute against a resistance of 15 cm of water in the gage. A charcoal trap is included in the line to remove the ozone formed in the corona, since this gas destroys rubber tubing and is unpleasant to breathe. All rubber connections require frequent inspection. The charcoal trap could probably be eliminated from the precipitator for use in the automatic weather station by making all connections of some material not affected by ozone.
With efficient operation there is no perceptible dust in the upper part of the tube. A practical operating efficiency close to 100 per cent can be obtained by adjusting the air flow and voltage to the proper values in relation to the tube diameter and kind of dust. For the collection of most industrial dusts, a sampling rate of 15 liters per minute and 15,000 volts is satisfactory in the model with the large precipitation tube.
Dust is deposited along the collecting tube in a decreasing amount in the form of a firmly held dry powder. There is a tendency toward clumping of the particles and a suggestion of separation along the tube according to particle size. The deposit is usually very dense at the entrance, but its pattern varies with the adjustment of the central electrode.
The electric precipitator could be used to deposit a sample which would be detected and reported by a photo-electric device. However, the complexity of the combination would make it undesirable for the automatic weather station.

-43-Sonic Flocculator. The "sonic flocculator" is the name given to
an interesting device developed by the Metallurgical Division of the Bureau of Mines for flocculating aerosols such as smoke, fumes, and dust by high-frequency sound waves. A description of its construction and operation, as presented in reference (52), is given in the following paragraphs.
* "The apparatus is illustrated in figure 12b. The essential parts
are a vibrating body for producing the sound waves and a resonating chamber for producing the sound field. A magnetostrictive vibrator is used for generating the sound. The resonating chamber is a pyrex-glass cylinder, 4 l/2 inches in diameter and about 18 inches in length. It is adjusted to resonance with the vibrator by means of the movable reflecting disc at the top.
"Magnetostriction is that property of most of the ferromagnetic metals and alloys of becoming mechanically deformed when placed in a magnetic field. The most common deformation involves a change of length and is best known as the Joule effect. Nickel shows this effect to a remarkable degree. A nickel rod placed in a field of 1,000 gauss decreases in length about 4 x 10 - 5 cm per centimeter length. If such a rod is placed in a periodically varying magnetic field produced by an oscillating vacuum-tube circuit, the rod becomes a powerful sound source, particularly when the frequency of the varying magnetic field is the same as the natural frequency of vibration for the rod. This ingenious device is known as a magnetostrictive vibrator; it was invented by G. W. Pierce of Harvard (49).
"Since it has been found that magnetostrictive effects do not penetrate deeply into the magnetostrictive core, it is best to use a tube rather than a rod. The magnetostrictive core used in this apparatus is a nickel tube, one inch in diameter and having a l/l6-inch wall. An aluminum piston is pressed onto one end to give better sound radiation. The tube is clamped at its nodal position near the center, leaving the two ends free to vibrate. The lower end projects into the exciting field and is split to reduce the eddy currents. The arrangement of the various parts of the resonating chamber and magnetostrictive vibrator are shown by the diagram in figure 12c.
"The electrical circuit for supplying the exciting field is shown in figure 12d. The constant polarizing field is provided by a 5Z3 full-wave rectifier tube. It can be regulated to give any value up to 1,000 gausses. The alternating field is produced by a Hartley circuit using a 100-watt, 203A radiotron. One of the coils is in the plate circuit and the other, which provides the feed-back for maintaining the oscillations, is in the grid circuit. The alternating current flows through both coils. The variable capacitance in the oscillating circuit is provided by a bank of fixed condensers having a maximum capacity of 0.02 mfd. The circuit is tuned to that of the magnetostrictive core by varying either the capacitance or the number of turns in the plate and grid coils. Closer tuning can be made by varying the polarizing current or the plate voltage.

-44-
"Otoe sound field is produced in essentially the same way as in the familiar Kundt dust-tube experiment (50). When the resonating column is adjusted to resonance, the radiated and reflected waves interfere in such a way as to produce a standing wave pattern of nodes and antinodes. The nodes and antinodes are positions of minimum and maximum sound intensity, respectively. Because the wave length is smaller than the diameter of the cylinder, the standing wave pattern is more complex than in a Kundt's tube. There is usually a series of antinodes one-half wave length apart along the axis of the cylinder, and another less regular pattern of antinodes along the wall. With the reflector in certain positions, there is a group of antinodes arranged symmetrically around the vibrating aluminum piston.
"In operation, as soon as the sound field is set up, the fume, smoke, or dust begins to flocculate and first appears as fine flakes, plainly visible to the naked eye. After a brief turbulent motion, these flakes collect at the antinodal positions and form large curtainlike flocs. As these flocs become large, they settle to the bottom, and finally the aerosol becomes completely flocculated. Most of the flocculated material settles to the bottom of the chamber, but some of it remains suspended at the antinodal positions.
"The sonic flocculator seems to be capable of flocculating any kind of aerosol. Among those that have been tried, are ammonium chloride, ammonium sulphite, quartz dust, tobacco smoke, coal smoke, and an artificial smelter fume prepared by heating a charge of flue dust from a lead smelter. All are readily flocculated but vary in the speed of flocculation and the tendency to form large flocs."
A photo-electric analyzer could be incorporated to report the amount of dust flocculated; however, the complete instrument would probably be too complex for unattended operation over long periods of time.
Impingement Devices
The impingement classification probably includes more dust measuring devices than any of the other five classes of instruments. The earliest impinger was developed by Pouchet in 1859. The first to gain wide recognition was the Kotze konimeter, which was followed by the Owens jet dust counter and the Greenburg-Smith impinger (17). Several impingement devices have been combined with photo-electric devices, and one of these, the Watson densitometer, will be discussed under the photo-electric classification. Four representative types of impingers are described herein.
Kotze Konimeter. Figure 13a shows one model of the Kotze Konimeter. This instrument, devised by Sir Robert Kotze (43), is provided with an entrance nozzle, 0.0225 inch in diameter, through which the air is drawn to impinge upon a collecting plate located at a distance of 0.0197 inch from the end of the nozzle. The air stream is induced by a spring-actuated vaiveless piston pump. The spring is of such strength that an average impinging velocity of 164 ft per second is developed. The glass collecting plate is covered with a thin film of
-45-petroleum or glycerin jelly which traps and retains the dust, the sample appearing as a spot. The film of adhesive must be prepared from dust-free material and should be of proper thickness; if it is too thick, the impinging air stream washes it out into a crater, with resulting poor distribution of particles in the spot.
Microscopic examination is usually made to determine number of particles. A photo-electric method of analysis of the Konimeter record has been developed, but' the instrument is not too well suited for automatic unattended use due to the time required to impinge a detectable sample under light dust conditions. The instrument is designed mainly for use in dusty industrial areas.
Greenburg-Smith Impinger. In this instrument, which was introduced in 1922 by Greenburg and Smith (22), the principle of high-velocity impingement is combined with subsequent collection of the dust particles in water (see fig. 13b). Although the nozzle and impinging plate are immersed in water, the actual impingement takes place in air, since the inrushing air stream keeps the plate dry. The dust does cot stick to the plate, as in the konimeter and jet dust counter, but is carried into the water where it is captured.
The required sampling time and the fluid media used in this instrument both are handicaps to its use in the automatic station. A photo-electric analysis could be used to measure the turbidity of the fluid produced by the impinged dust; however, changing of fluid and cleansing before the next observation would present problems.
Owens Jet Dust Counter. The essential principle of this dust counter is the condensation of moisture from a saturated atmosphere onto the contained particulate matter as a result of an adiabatic expansion (5). An open cylindrical metal chamber, having a capacity of 50 cubic centimeters, is lined with damp blotting paper and holds the sample of air or gas to be examined (figure 13c). A hand pump of similar capacity is connected at right angles to this chamber; between the two is a small communicating metal cell containing a metal platform, which holds a microscope cover glass (or paper disc, if desired) about one millimeter from a slit in the base of the damping chamber, the slit being one centimeter long and one millimeter wide. A quick operation of the pump causes moisture and particles to be projected through the slit, the moisture adiabatically condenses on the particles, and the particles are projected onto the cover glass giving a slit image or ribbon consisting of the dust particles collected from the metal chamber.
Usually the coverglass slide bearing the dust deposit is placed under a microscope and the number of particles from the 50 cubic centimeter sample of air is counted. The device could be reconstructed to collect larger samples for analysis by other means, but it would probably be too complex for unattended use.
-46-
Aitken Counter. This device (1), shown in figure 13d, is not strictly an impaction device. It involves a condensation process like the Ovens jet dust counter, but the water-coated dust particles are gravity-impacted on a glass slide rather than forced by a jet or other means.
The main components shown in figure 13d are: the test-receiver, R; the air-pump, F; the measuring apparatus, M; the illuminating arrangements, L; and the gasometer, G. The air sample is drawn through pipe A by means of the gasometer and its connecting pipes. The air passes through the measuring apparatus (M), where a measured quantity of it is taken and passed into the receiver (R), where it is mixed with a certain quantity of dustless air, and saturated with water. The air in R is then expanded by the pump (P), a shower of rain is produced, and the number of drops which fall on a measured area are counted.
Some investigators question whether the Aitken counter gives an accurate dust count, or whether it gives a count of preferred nuclei of condensation and misses the particles that have a lower affinity for water. Certainly, this device is better suited to laboratory measurements of condensation nuclei than for general use in the automatic weather station, where some type of automatic analyzer would also be required.
Guyton Electronic Particle Counter. This instrument utilizes the electrostatic charges created when a particle is impinged upon a wire (26). The following description has been abstracted from (26).
"Figure 14 is a diagram of the electrical and mechanical aspects of the apparatus. A glass pickup is employed as illustrated in the insert in figure 14. A vacuum sucks air directly into the pickup, through the nozzle, and past the wire at a very high speed. When a particle impinges on the wire, an electrical impulse is produced in the wire. Exactly how this impulse is produced is not understood. The function of the electrical apparatus is merely to amplify this electrical pulse and record it either on the oscilloscope or on a counter.
"The so-called charging voltage for the pickup wire is necessary only when studying watery particles. For other particles no electrical charge is necessary, and the pickup wire in these instances can be connected directly to the grid input of the amplifier without the presence of the blocking condenser shown in the diagram.
"After the electrical pulse is amplified through a high frequency resistor and choke-coupled amplifier (figure 14), it is necessary to convert this pulse which has a duration of about; 1/20,000 of a second to one with longer persistence in order to visualize it adequately on the oscilloscope. For this reason the input circuit to the final stage of amplification was designed so that the instantaneous pulse is rectified by the grid of the amplifying tube. This rectified pulse charges the input blocking condenser with a negative charge which is allowed to leak away through the grid resistor at a comparatively slow rate, giving a pulse of approximately 1/2,000 of a second. This pulse is then easily discernible on the screen of the oscilloscope.

-47-
"For counting purposes, the impulse trips a thyraton tube whose discharge in turn is amplified through a class C triode which energizes the magnet of a mechanical counter. By using very dilute clouds, it has been determined that each impulse which is recorded on the screen of the oscilloscope or on the mechanical counter is due to a single particle, and is not due to a cumulative effect of many particles.
"Needless to say, the electrical design of the amplifier may be varied considerably; four different systems have been built in this laboratory. In general, any amplifier having a frequency response above 10,000 cycles per second and an amplification of 100,000 can be used successfully. Low frequency filtration, as provided by the choke coupling in the apparatus of figure 14t contributes greatly to the sensitivity of the apparatus.
"Simple though the pickup may seem to be (see diagram in the insert of Figure 14), it is actually the result of trials with many different designs. A tight spiral metal tube, used for centrifugal precipitation of particles, was tested, and many different sized orifices in a thin metal sheet were tried separately. A critical orifice with a wire suspended in the center of the aperture was tested with several different orifice sizes. Finally, many different designs of impingers were tried with the particles impinging against metal plates and against wires of all sizes. From this study, two pickups were adopted, both of which are impingers. One of these is shown in figure 14, and the other is similar to it, but has a metal plate placed approximately 1 mm from the opening of the impinger instead of the thin wire shown in figure 14. In this second design, air passes through a sidearm into a vacuum line. Impinging the particles against a metal plate is advantageous in that all particles above a critical size which pass through the impinger are counted, whereas the wire impinger counts only a certain proportion of those particles passing through the jet. With larger particles, this proportion is approximately equal to the ratio of the wire size to the aperture size. As the particles decrease in size, they may slip around the wire without coming into contact with it, but such particles are probably less than the size of those which have been counted in this study due to the extremely high speed at which air travels through the jet. The wire impinger has the advantage of greater sensitivity than the other types of pickups, and for this reason it has been employed most frequently.
"This impinger is approximately two inches in length and l/2 inch in diameter. The jet aperture is 0.8 mm in diameter and the size of the wire is 0.4 mm. The wire is almost in contact with the orifice so that practically no spreading of the air stream occurs before impinging takes place. It has been calculated that 6l per cent of the particles passing through the jet probably impinge on the wire and 39 per cent pass unrecorded. From microscopic studies it appears that the lower limit of particle size recorded by the equipment is approximately 2 to 3 microns.
-48-
"The taper of the jet was tested for several different angles ranging from 0° (a long thin capillary tube) almost to a 90° angle with the axis of the pickup. Best results were obtained with a taper of approximately 45°. This taper aids acceleration of the particles, and yet the overall resistance of the nozzle is such that critical flow is maintained. When the pressure difference between the two ends of the pickup is increased beyond the critical value of 36 cm of mercury, there is no further change in air flow through the orifice. This makes it unnecessary to record flow through the jet, provided the vacuum line pressure is known to be below a critical value. The critical flow for the jet illustrated is 5.75 liters per minute.
"The speed at which air is emitted from the orifice can be calculated from the amount of flow, the critical pressure of exit, and the size of the orifice. The result of this calculation shows that air flows from the jet at a speed of 345 meters per second or approximately the speed of sound. At this speed, the maximum time that particles remain very close to the wire, assuming they are not slowed by contact, is 1/1,000,000 of a second."
This instrument has several desirable features and is recommended for use in the automatic weather station. Further comments will be found in the recommendations for dust measurement at the end of this section.
Photo-electric Devices.
This classification includes a wide assortment of instruments, some of which are combinations of a photo-electric analyzer with a device from one of the other classifications. With some modification, at least one or two instruments in the photo-electric classification could perhaps be adapted for use in the automatic weather station.
A considerable amount of effort has gone into the design of instruments which measure photo-electrically the absorption or reflection of light by dust particles. The earliest instrument of this type interposes a sample of the dust-laden air between a light source and a photo-electric cell (33). Absorption of light by the dust particles produces a decrease in the e.m.f. induced in the cell. The new e.m.f. is measured by a sensitive milliammeter and the decrease in the current is proportional to the dust concentration. This type of instrument has a serious defect; the amount of light absorbed depends very largely on the color of the dust and on the texture of its surface. Transparent particles transmit much of the light which strikes them, therefore the apparent dust concentration depends on the type of dust investigated. Another disadvantage of the method is that the apparatus is relatively insensitive when the dust concentration is small.
A more satisfactory type of instrument utilizes the Tyndall effect. The phenomenon of light scattering was noted by Tyndall in 1868 and was treated theoretically by Lord Eayleigh in 1871 for the particular case where the radius of the scattering particle is small compared with the wavelength of light. Both experimental and theoretical results of later workers, notably, Mie, are summarized by Sinclair (55). These

-49-results show that the scattered intensity in any direction at an angle B to the incident light is a complicated function of the particle number concentration, the size or size distribution for a non-homogeneous dust cloud, the refrac-tive index of the material, the wavelength and intensity of the illumination source, the angle B, and the distance of the point of scattering. When a beam of light passes through a dusty atmosphere, the particle's of dust scatter the light, and these instruments are designed to ensure that a part of the scattered light falls on a photo-electric cell positioned at right angles to the main beam. The e.m.f. produced in the cell is stepped up by the aid of multipliers and is measured by a milliammeter. A recording meter may be used. The values given by this type of dust meter are less affected by the nature of the dust than those obtained by instruments which rely on the direct absorption of light by the dust particles; but, because the amount of light involved is very much smaller, the apparatus is necessarily more complicated, bulky, and expensive.
The intensity of the reflected light is a complicated function depending on the number of particles in the atmosphere, their size, their nature (in particular, their refractive index), and other factors. The Tyndall meter readings cannot be translated into particle counts or into mass concentration values; however, they do provide a relative measure of the dustiness of the atmosphere.
Smith and Carlisle Recording Dust Meter. This instrument (56) utilizes the Tyndall effect and provides an approximate measure of the dust particle concentration, if the nature of the dust and particle size are reasonably constant. The following description is given in (56).
"The instrument consists of two main units, a sampling tube and an electronic amplifier (figure 15). A lamp and lens system forms a light beam which is passed axially along a long tube terminated in a light trap. Dust-laden air passes through the same tube so that scattering occurs and the light, which is scattered approximately normally to the main beam, is measured through a suitable window by a photo-multiplier tube. The output of the photo-multiplier is displayed on a micro-ammeter or, after amplification, on a pen recorder.
"A 12-volt, 36-watt incandescent lamp is used as a light source, and variation of its operating conditions will not only modify the illuminating beam intensity, but also its effective wavelength. It was therefore considered desirable to stabilize the power supply to the light source, and for this purpose a constant-voltage transformer is used.
"The lamp, lens, and mirror system forms a real image of the source at the diaphragm A, and a further pair of lenses combine to form an almost parallel beam, which is defined by four circular diaphragms. This beam passes through the sampling chamber and is absorbed by a light trap. Dust-laden air or gas is drawn into the sampling chamber at an angle of about 30 to the axis of the unit and is then exhausted. A small fan unit can be fitted to extract samples from a system at atmospheric pressure. The scattered light is viewed through a window by one or more photo-multiplier cells connected in parallel, the output from which is connected to the amplifier. The number of cells employed depends on the sensitivity required.

-50-
"Figure 15b shows the circuit of the electronic unit. High voltage (1100 V.) for the photo-multipliers is obtained from a conventional voltage doubler circuit and a bank of neon stabilizers. The potential divider chain, providing the photo-multiplier dynode potentials, is mounted on the sampling unit for convenience of wiring. A 50-watt, constant-voltage transformer provides 12 volts at 3 amperes to supply the lamp.
"The D.C. amplifier consists of two pentodes operating as a balanced pair. An 0 to 5 milli-ampere pen recorder is connected between their anodes. The control grid of V2 is biased from a battery via a potentiometer and is adjusted initially to equalize the anode potentials of the two valves under conditions of no dust input to the sampling unit. The input voltage to the grid of V1 is generated by the passage of the photo-multiplier current through a load resistance. Variation of this current will thus unbalance the two anode potentials, giving rise to a recorder deflection."
Meters are provided for monitoring the currents in the stabilizer bank, the photo-multiplier output, and the lamp circuit. These meters have been omitted from the simplified circuit.
This instrument is quite well suited to the requirements of the automatic station. Some improvements could be made on it by taking into account the best features of some other instruments described in this section. These will be brought forth later in the discussion on recommendations for a dust measurement instrument.
Recording Photo-electric Dust Analyzer. This instrument, described by Walker (64), is manufactured and sold by General Power Plant Corporation, New York, New York. It employs the light absorption or attenuation principle.
"The analyzer (figure 16) includes two photo-electric cells mounted in opposite ends of a sampling tube. One, the reference cell, receives its excitation directly from the light source lamp, while the other, the analyzing cell, receives its excitation from the same light passing through the gas being analyzed. The gas sample is introduced into the center of the main tube and flows both ways, between the energizing lamp and the analyzing cell, to the exhausts where it is discharged. The velocity of the gas through the sampling tube is unimportant except to the extent that it must move fast enough to keep the dust in suspension.
"The outlets are large in relation to the inlet due to the necessity of keeping a constant pressure in the sampling tube; the use of large exhausts keeps the sampling tube at practically atmospheric pressure. In the event the gas being sampled is not under pressure in the main flow line, aspirators are used to maintain a representative flow. A manometer measures 'the differential across an orifice as a means of indicating that a proper flow of gas is being introduced into the sampling tube.
-51-"The lenses on the lamp and cell must be protected from any
accumulation of dust and moisture in the event that the sample is saturated. A 20-in. long, 2 l/2-in. tube in front of both the lamp and the cell provides dead air zones to keep the gas away from the lenses. It is recommended that a small quantity of dry air be introduced near the lamp and cell to keep the dust and vet gas out of these tubes. This air doubles back along the outside of these tubes to the outlets without changing the length of the sampling zone between the ends of these 2 l/2-ln. tubes. Sight flow indicators are installed to aid in regulating this flow and to enable the operator to insure that it remains flowing. A water seal is provided to take care of moisture condensation in the event of saturated gas.
"To measure very dirty gas, it is necessary to reduce the length of the sampling zone in order to keep the reading within the instrument's range. This is accomplished by sliding the inside sleeves out of the 2 1/2-in. lamp and cell support tubes. In this manner, the length of the sampling zone can be varied between 60 and 20 in.
"The two photo-electric cells are connected so their outputs oppose—-the Brown ElectroniK potentiometer used here then sees only the difference e.m.f.—thus eliminating errors due to energizing lamp output changes resulting from variations in line voltage. The instrument is zeroed by adjusting the circuit so that the outputs of the two cells are equal when the sampling tube is filled with clean air.
"The equipment is designed so that the collimated light reaching the analyzing cell is greater than that at the reference cell when the lamp is at the focal point of the lens. The two cells are brought into balance by moving the lamp ahead of the focus point, thereby scattering the light on the analyzing cell. This is accomplished by an adjusting screw accessible through the back of the energizing lamp case. In tills way, the instrument can be compensated for any dust that might have collected on the lenses. Several months of operation indicate that this is rarely necessary.
"The recorder must be calibrated for each type of gas and for each setting of the sampling tube, i.e., the length of the sample. The length of the sample is altered depending on the average density of the gas to make the pen record nearer the outer edge of the chart. For relatively clean gas, this length is 60 in.; for very dirty gas it may be 20 in.
"Calibration is "accomplished by measuring the actual solid content of the gas, using the familiar thimble and weighing the contents. The start and finish of this test is noted on the recorder chart with the number of the thimble. The actual weight of solids is then compared with the average chart reading. These results are plotted on a graph— chart readings versus weight of solids—and a smooth curve is drawn through the points.
"The ElectroniK recorder is provided with a 12-in. chart calibrated 0-100, and has a 24-hr rotation. It operates on 115-volt, 50-60 or 25-cycle current, and is not affected by line voltage variations of plus

-52-
or minus 10 per cent. A switch is provided to actuate an alarm when the dust concentrations exceed a preset limit. The sensitivity, or amount of pen deflection for a given change in dust concentration, can be varied by changing resistance R."
This instrument, as illustrated in figure 12, could be somewhat simplified for use in measuring atmospheric dust. However, some of the other instruments, under this classification, that embody the same basic principles of operation, are more readily adaptable to use in the automatic weather station.
Dust Concentration Meter. This instrument, developed by Simon, Kron, Watson, and Raymond, (54), employs the light absorption principle rather than the scattering or Tyndall beam effect used in the recording dust meter described above. The discussion of the light-sensitive receiver merits particular attention. The following discussion is quoted from reference 54.
The essential elements of the dust concentration meter are: (1) a source of light of constant intensity, (2) a fixed length of path, (3) a light sensitive receiver and (4) a recording meter actuated by the receiver.
"As the light source a small concentrated filament Mazda lamp connected to a small transformer and provided with a ballast tube for keeping the current constant (to compensate for line fluctuations) is used. The light diverging from the filament (figure 17) is rendered parallel by means of a condensing lens and then passes through a transparent plate (window) into the volume containing the gas of which the dust content is to be determined. It then traverses a predetermined distance in the gas and passes out through a second transparent plate. A second lens then concentrates the beam on the light-sensitive receiver, in this particular case a thermopile, although a photo-electric cell, a selenium cell, bolometer, photographic film, etc., could also be used. The current developed by the thermopile is registered by a recording microammeter.
"In addition to the four elements listed above however, the practical difficulty that the entrance and exit windows would otherwise quickly become clouded with dust makes it necessary to add another: namely a device for keeping these windows clean. This is accomplished very simply in the instrument by adding an ordinary windshield wiper, which is actuated continually be a small electric motor.
(The lamp, lenses, windows, thermopile and wiper are all mounted within a pipe, which can be connected to the external air intake. The leads from the thermopile can be connected to a remote coder or recorder.)
"The light-sensitive receiver merits a separate discussion. As already pointed out above, a photo-electric cell, a thermopile, a selenium cell, a bolometer, a photographic film, etc., could be used. We have experimented with a photo-electric cell and a thermopile, and found that for the purpose in hand the thermopile is decidedly superior to the

-53-photo-electric cell. As this was somewhat of a surprise, in view of the great preference given the photocell during the last few years in photometric work, it is. worthwhile to discuss this point somewhat in detail; since, moreover, in view of our experiences it would seem that the thermopile can advantageously replace the photocell in many photometric and optical applications where the photocell is now being used.
"At the outset it was feared that perhaps the thermopile would have the following drawback":' it might show too great a lag, it might not be linear, it might be affected by stray (heat) radiation.
"With regard to the first point, it is now possible to obtain commercially thermopiles with a negligible lag and surprising speed; in fact it is possible to obtain thermopiles which for most ordinary purposes are instantaneous. On the other hand, the thermopile has an added advantage over the photocell in that its very low resistance causes the meter used with it to be practically deadbeat, whereas on account of the high resistance of a photocell circuit, the meter will be underdamped. For the purpose in hand, and for most photometric purposes a slight lag is immaterial anyway so that on this score the thermopile may be considered at least as good as the photocell.
"With regard to the second point, namely: the question of the linearity of the thermopile, we have carried on a great number of tests with rotating sectored discs and also with blackened screens and have always found that over a wide range the current generated by the thermopile is proportional to the amount of light falling on it. On the other hand, when the same experiment was carried out on photocells, both the gas filled and the vacuum types, strict proportionality between current and light intensity was never observed over any considerable range.
"With regard to the third point, we have never observed any effect of stray radiation on the thermopile; whereas with the photocell there is always endless trouble in excluding stray light; furthermore with the photocell there are always present variable leakage currents, which require a high degree of insulation, whereas the low voltage current from the thermopile can be conducted considerable distances aways to an instrument house without difficulty.
"Having answered these three possible initial objections to the thermopile, we can now discuss wherein lies its great superiority over the photocell, namely in that it enables the use of a very simple circuit, which in turn makes for great constancy, accuracy and duplicability of results. The thermopile generates its own e.m.f., while the photocell requires the use of auxiliary batteries, vacuum tubes, etc. It is hardly possible to use the photocell in any field work, the use of the photo cell nearly always implies the use of an amplifier with all the iherent difficulties of keeping filament current, grid bias and plate voltage constant. With the thermopile all this auxiliary apparatus can be dispensed with and a very simple arrangement results.
"As already pointed out above, if the average grain size were known for the particular dust to be measured, then the calibration factor of the instrument could be calculated directly. In practice it is more convenient to determine this factor by comparison with some

-54-other method. For this purpose the so-called Brady filter method can be used. This consists in drawing a measured volume of gas through a filter and weighing the-amount of dust collected.
"For the purpose of" calibration it is necessary to select an arbitrary unit of concentration, and this for convenience is taken as that concentration which transmits (for the particular length of path used in the instrument) 90% of the incident light. Double this concentration is then present when 90% of 90% or 81% of the incident light is transmitted; and so on according to the table: Conc'n. 0 1 2 3 4 5 10 15 Through 100% 90% 61% 72.9% 65.61% 50.05% 34.87% 20.59%
These percentages can be calculated conveniently by means of logarithms according to the formula (below)"
log 1 0 p = 2 - 0.04576m
This instrument also warrants consideration for use in the automatic weather station. The use of a thermopile seems to eliminate most of the difficulties experienced with earlier types of light absorbing instruments in which photocells were used. This will be discussed further under recommendations for a dust measuring instrument.
Watson Densitometer. A very simple type of apparatus for estimating dust concentrations on the spot has been developed by H. H. Watson for use in the coal industry (33). A measured sample of air is drawn through filter paper by means of a hand pump. The dust deposited in the paper increases its opacity, and the change in this value is measured by a photo-electric method. An instrument, made specifically for carrying out these measurements, is now manufactured commercially and is shown in figure 18.
Watson states that the relation between the optical density of the stain made on the filter paper by the dust and the number of particles producing the stain is given by the equation:
in which Q is the number of particles, D is the optical density and a and b are constants. The value of b has been determined experimentally as 1.5, while the factor "a" depends on the physical characteristics of the dust and particularly on its size distribution. The instrument is calibrated for the particular dust which is to be investigated against a thermal precipitator.
This instrument should be satisfactory for use in the automatic weather station in areas of fairly high dust concentration where a filter sample could be obtained during the short observation period. It could also be used in less dusty regions if readings were only desired at times when exceptionally high amounts of dust were being airborne due to strong winds or other causes.

-55-For automatic use", a motor-driven suction device would need to be
substituted for the hand pump, and a moving filter strip used for collecting the samples, so that a clean portion of filter could be advanced into position before each observation.
Peterson Differential Photometer. Peterson has developed a differential photometer which eliminates most of the disadvantages of earlier types and has a greatly increased sensitivity of measurement (25, 48). Figure 19a shows the optical system of this instrument. The following discussion is quoted from (25, 48).
"The light from a 6-v, 50 candle power automobile headlight bulb is focused by means of the aspheric lenses L, L, at the center of the circular hole in the baffle D mounted in the observation cell C. The aerosol enters the cell through one of the large tubes at the bottom, passes through the aperature in the baffle, and out through the other tube. The center of the converging cone of light from the lens system is cut out by means of the dark-field stop B, to give the hollow cone of light indicated by the dashed lines. In the absence of scattering material, the baffle prevents any direct light from reaching the collecting lens E. However, any scattering particles at the focus of the lens system are subjected to intense dark-field illumination, and the light scattered in the near-forward direction, between about 5° and 30° of the direction of the beam, reaches the collecting lens, passes through the oblique glass plate G, and falls on the photomultiplier tube P. This is essentially the optical system developed by LaMer and Sinclair (40).
"In order to compensate for any change in light intensity or photomultiplier sensitivity in the differential photometer, a glass plate H in the end of the cell allows some of the direct light from the lamp to pass through a series of filters F, whereby its intensity can be reduced to about that of the light scattered from the aerosol. This attenuated direct light is reflected by means of the inclined mirror I. A rotating shutter, actuated by the motor M, allows the scattered light to fall on the photomultiplier tube in the position shown. When it is rotated through 180°, the scattered light is cut off by means of the shutter, while the direct light reflected from the mirror passes through the aperture in the side of the shutter and falls on the glass plate G, which reflects a constant fraction of it onto the photomultiplier. In this apparatus we have found the 1P21 photomultiplier tube superior to the 931-A provided the output current is kept low and the two images cover as nearly as possible exactly the same portion of the cathode, which varies considerably in sensitivity from point to point. In this apparatus we use an output current of about 0.01 microampere, and the change of sensitivity of the photomultiplier is so small that, even for accurate measurement, a comparison with the attenuated direct light need be made only once a minute.
"Figure 19b shows a block diagram of this differential photometer, with its automatic self-compensating adjustment, and its output arranged to actuate a standard recorder or controller. When the shutter is in the position shown, the reference light falls on the photomultiplier tube. The output from the photomultiplier, which may be attenuated

-56-if necessary in the input circuit of the comparison voltmeter, is compared with tile reference voltage. Any unbalance passes through the standard Brown amplifier to operate a Brown recorder motor which varies the dynode voltage on the photomultiplier, and thus adjusts its sensitivity to rebalance the system. This is accomplished in two seconds, after which the cycle-control motor (not shown) moves the shutter up to throw the scattered light on the photomultiplier, and also changes the two switches so that the photomultiplier current due to the scattered light is connected directly to the comparison voltmeter, the output from which is amplified in a standard recorder and controller. This can be used to give a continuous record of the aerosol concentration, or to control it at the desired level by increasing or decreasing the amount of air used to dilute the stream of aerosol coming from the generator.
"The increased sensitivity and stability of this differential photometer allows us to use a gas in the cell at a known pressure as a simple and convenient standard of light scattering instead of an aerosol, the concentration of which would have to be determined each time the instrument was calibrated. It is even sensitive to the light scattered by the air molecules in the illuminated volume. Either helium, carbon dioxide, or methyl chloride could be substituted for the air in the cell, and the corresponding change in the background light would give a reference standard by which the instrument could be calibrated. The aspheric lenses used in the above-described differential photometer were inexpensive, only partially corrected for spherical aberration and not at all for chromatic aberration. Reduction in the stray light background may be obtained by the use of two pairs of achromatic lenses, the first of which focuses the light from the lamp filament on a slit which acts as a source of the image formed in the smoke cell. Undoubtedly tills arrangement would add to the convenience and probably also to the sensitivity of this instrument."
This instrument measures concentrations as low as 0.00002 microgram per liter of standard DOP test smoke with particle diameters of 0.3 micron. These lower limits of detection are lower than would likely be desired for automatic weather stations. The instrument could probably be adopted for use by decreasing the sensitivity so as to detect only the larger, more significant dust particles, and by adding miniature windshield wipers to the lens E and plate glass H to keep them clean.
Photo-electric Particle Counter. Figure 20a is a schematic diagram of the original photo-electric counter developed by Konski, Pickard, and Pitts for counting particles 0.6 micron in diameter and larger (2k).
"The optical system is almost identical with that used in the differential photometer previously described. It provides intense dark-field illumination at the point D inside the smoke cell. In this case, however, the aerosol is introduced in quite a different way through the tube, T1, while the stream of air flowing through T2 at the same linear rate provides a sheath around the aerosol stream which insures the passage of each aerosol particle through the focus, D,

-57-without recirculation, before it leaves the cell through the exhaust tube, T3. The flashes. of light scattered in the near-forward direction by the individual aerosol particles are collected upon a photosensitive cell and the resulting electrical impulses are amplified up to 200,000 times to fire a thyratron trigger circuit which operates a mechanical recorder. A black disk, B, inside the smoke cell was designed to prevent reflections of any stray light directly into the photosensitive cell, and the blacklined baffles, F and G, also reduced background illumination. Rigid construction of the whole unit and a heavy clamp holding the lamp, A, eliminate vibrations which might vary the intensity of the background light and lead to 'optical microphonics' and spurious counts.
"The counter was first operated successfully using a photosensitive element, the thalofide cell, which had been developed by Robert J. Cashman (39) in the physics department of Northwestern University. This cell has great stability and low background noise almost independent of the background illumination. Later we found that a 931-A photomultiplier tube, operated at 3O-5O volts per stage, was satisfactory when the background light had been reduced still further, and it had the advantage of a shorter response time than the thalofide cell.
"Careful design and construction were necessary in the electronic circuits, which were operated from a well-regulated power supply except for the phototube and amplifier tube heaters, which were battery operated. Great care was taken to use a low-microphonic input amplifier tube and to prevent feedback to this circuit from the final stage. The photocell and input amplifier tube was enclosed in a desiccated brass box to reduce leakage current and serve as an electrostatic shield. The response curve of the amplifier is essentially flat from about 10 to 5,000 cycles, falling to about one-half at 10,000 cycles. The gain is adjusted by means of potentiometers in the cathode circuits of the last two amplifer tubes, which vary the negative feedback.
"A type-885 thyratron tube was used in the trigger circuit with a self-quenching choke-condenser combination in the plate circuit. The thyratron grid bias was controlled by means of a discriminator potentiometer, calibrated in volts from zero at the firing point of the tube, so that the discriminator setting determined the size of the minimum pulse which would fire the tube;
(Figure 20b shows the detection chamber with the photocell and thyratron mounted on the same chassis.)
"The time-recorder circuit employs two mechanical counters for duplicate experiments, and an electric timing clock (figure 20c). When the starter button is depressed, the thyratron circuit is connected to one of the mechanical recorders while the timer is turned on simultaneously. At the end of one hundred counts the recorder actuates a relay which turns off botil the timer and the recorder. The operator then reads the time for. a hundred counts with the same statistical uncertainty in each experiment. The next time the starter button is pressed it automatically resets the timer before starting the new experiment. If longer counts are desired, the automatic shutoff circuit is switched off and each revolution of the primary counter actuates an auxiliary hundreds counter.
-58-"In operating the photo-electronic counter the cell is first swept
out with filtered air introduced at three liters per minute through the tube, T2, until the dust count has been reduced to one per minute or less; then the aerosol stream is introduced at one liter per minute. This is measured by difference between the flow through the exhaust tube and that of the sheath air, to obviate the necessity of introducing a flow meter in the aerosol line where it might cause the deposition of some of the suspended particles. A pressure somewhat above atmospheric is maintained in the counting cell to avoid contamination with the laboratory air which usually contains thousands of particles per liter."
One of the disadvantages of this instrument is that it requires a filtered supply of clean air through T2 to act as a sheath for the aerosol stream. If provided with a suitable filter arrangement, this woulbe one of the more desirable photo-electric devices for use in the automatic station because it detects particles from 0.6 micron to 100 microns in diameter, and the thyratron counter is convenient for coding as counts per unit of time.
Dust Measurement Conclusions and Recommendations
Guyton Electronic Particle Counter
From the standpoint of simplicity of the detector portion and adaptability to a wide variety of climatic conditions, it appears that the Guyton Electronic Particle Counter ranks first for use in the automatic weather station. This instrument utilizes the electrostatic charges created when a particle is impinged upon a wire. Advantages of this instrument are as follows:
1. The instrument does not have filters, fluids, or compartments that would require changing or cleansing.
2. The detector element is small and simple and can be remotely installed from the electronic counter.
3. Only a small vacuum pump is required to draw air past the detector wire during the time of operation.
4. By placing a charging voltage on the pickup wire, both dry and watery particles can be detected.
5. Power is only required at the time of observation.
6. The particle count per unit of time is ideally suited for coding for automatic reporting.
Disadvantages of the Guyton device include:
1. Under freezing weather conditions, the jet aperture is likely to become blocked with ice due to condensation or precipitation.

-59-2. The minimum particle size detected is approximately two
to three microns when the particles are impinged on a wire. This is slightly higher than the one micron size limit mentioned as being desirable in the discussion of sizes of airborne particles. However, the two to three micron minimum is low enough to catch the great mass of particles that are heavy enough to settle out of the atmosphere. This is considered to be adequate fulfillment of the automatic station requirements.
3. When impinging the particles against a wire, only a certain portion of the particles are counted and the smaller the particles the more likely they are to slip around the wire undetected. In the discussion of the instrument it was explained that a plate can be used instead of the wire if total particle counts above a certain size are desired. This is partly the solution to (2) above, if a lower threshold of detection is desired, because the smaller particles have less chance for escape around the plate.
The following recommendations are made with respect to this instrument:
1. A small heater winding should be placed around the jet in the detector element to prevent icing.
2. The detector element should be completely covered except at observation time.
3. Tests should be conducted using both the wire and plate type impingement surfaces to determine which is least likely to block the jet aperture, and whether the plate can be used for counting smaller particles successfully.
4. The charging voltage should not be applied to the detector wire or plate in order to confine the instrument to detection of dry particles. If the charging voltage were applied, the instrument could not distinguish between water droplets and dust particles.
Smith and Carlisle Dust Meter
The Smith and Carlisle Dust Meter seems to be the most adaptable photo-electric device for use in the automatic station. It employs the Tyndall beam or light scattering principle.
This instrument is somewhat more subject to contamination than the particle counter. There is some chance of dust, water or ice collecting on the lenses and in the sampling compartment. For this reason it is rated second to the particle counter. Recommendations include:
1. The instrument should be thoroughly sheltered and the intake tube should be closed except at observation time.
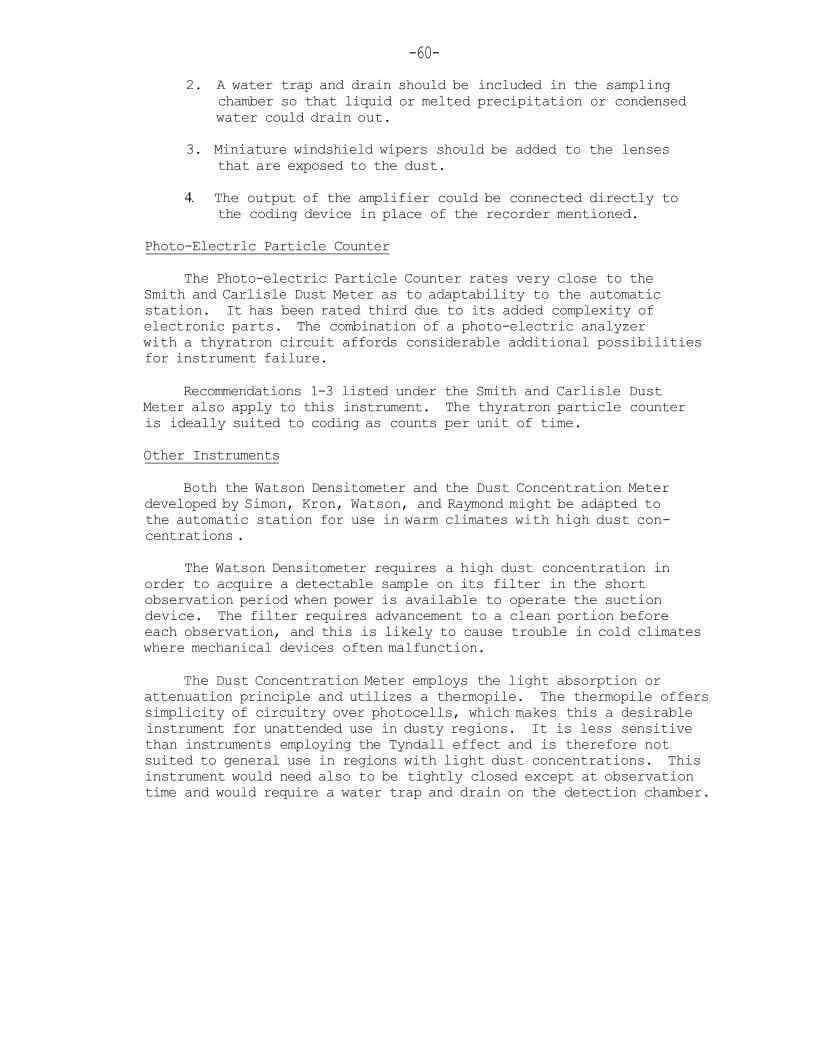
-60-2. A water trap and drain should be included in the sampling
chamber so that liquid or melted precipitation or condensed water could drain out.
3. Miniature windshield wipers should be added to the lenses that are exposed to the dust.
4. The output of the amplifier could be connected directly to the coding device in place of the recorder mentioned.
Photo-Electrlc Particle Counter
The Photo-electric Particle Counter rates very close to the Smith and Carlisle Dust Meter as to adaptability to the automatic station. It has been rated third due to its added complexity of electronic parts. The combination of a photo-electric analyzer with a thyratron circuit affords considerable additional possibilities for instrument failure.
Recommendations 1-3 listed under the Smith and Carlisle Dust Meter also apply to this instrument. The thyratron particle counter is ideally suited to coding as counts per unit of time.
Other Instruments
Both the Watson Densitometer and the Dust Concentration Meter developed by Simon, Kron, Watson, and Raymond might be adapted to the automatic station for use in warm climates with high dust concentrations .
The Watson Densitometer requires a high dust concentration in order to acquire a detectable sample on its filter in the short observation period when power is available to operate the suction device. The filter requires advancement to a clean portion before each observation, and this is likely to cause trouble in cold climates where mechanical devices often malfunction.
The Dust Concentration Meter employs the light absorption or attenuation principle and utilizes a thermopile. The thermopile offers simplicity of circuitry over photocells, which makes this a desirable instrument for unattended use in dusty regions. It is less sensitive than instruments employing the Tyndall effect and is therefore not suited to general use in regions with light dust concentrations. This instrument would need also to be tightly closed except at observation time and would require a water trap and drain on the detection chamber.

FIG. 7 AIRBORNE PARTICLE SIZES AND SETTLING RATES
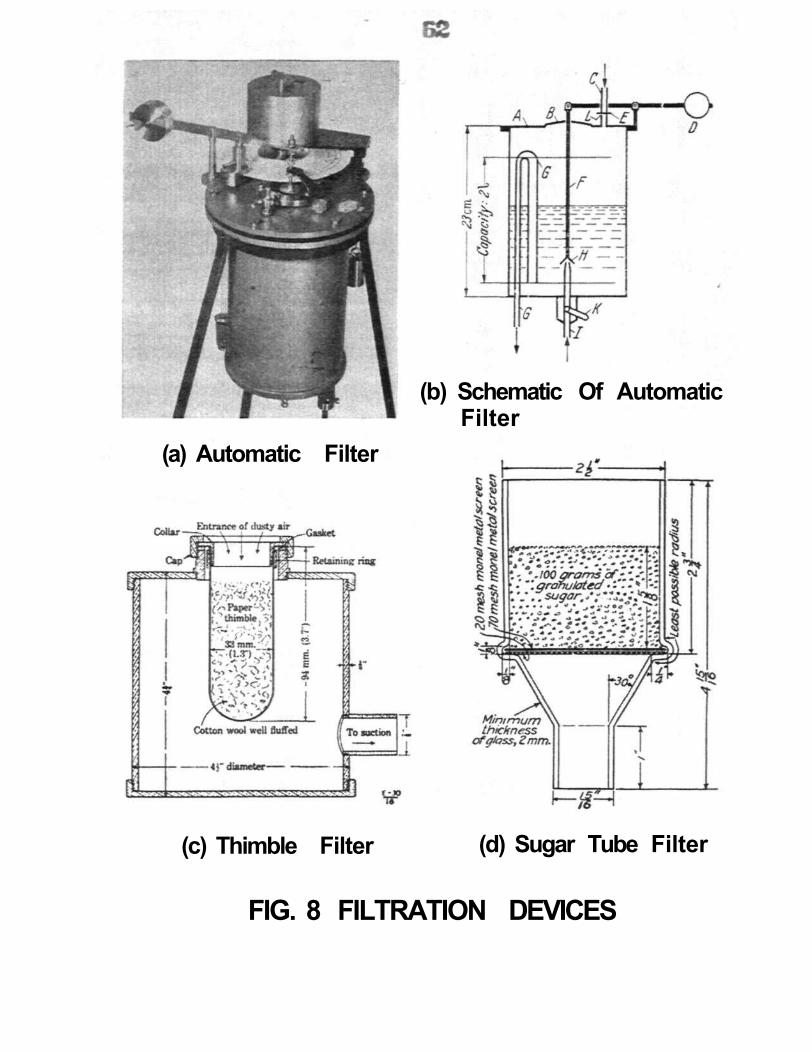
(c) Thimble Filter (d) Sugar Tube Filter
FIG. 8 FILTRATION DEVICES
(a) Automatic Filter
(b) Schematic Of Automatic Filter

(a) Complete Instrument (b) Hot Wire Element
FIG.II THERMAL PRECIPITATOR
FIG. 9 SETTLEMENT DEVICE FIG. 10 WASHING DEVICE

(a) Electrical (b) Sonic
(c) Resonating Chamber And Magnetostrictive Vibrator
For (b) Above
(d) Circuit Diagram For (b) Above
FIG. 12 PRECIPITATING DEVICES

(a) Kotze Konimeter (b) Greenburg-Smith Impinger
(c) Owens Jet Dust Counter (d) Aitken Counter
FIG. 13 IMPINGEMENT DEVICES
65

FIG. 14 ELECTRICAL DIAGRAM OF THE PARTICLE COUNTER
(b) Circuit Details Of Amplifier
FIG. 15 SMITH AND CARLISE RECORDING DUST METER
66
(a) Diagram Of Sampling Unit
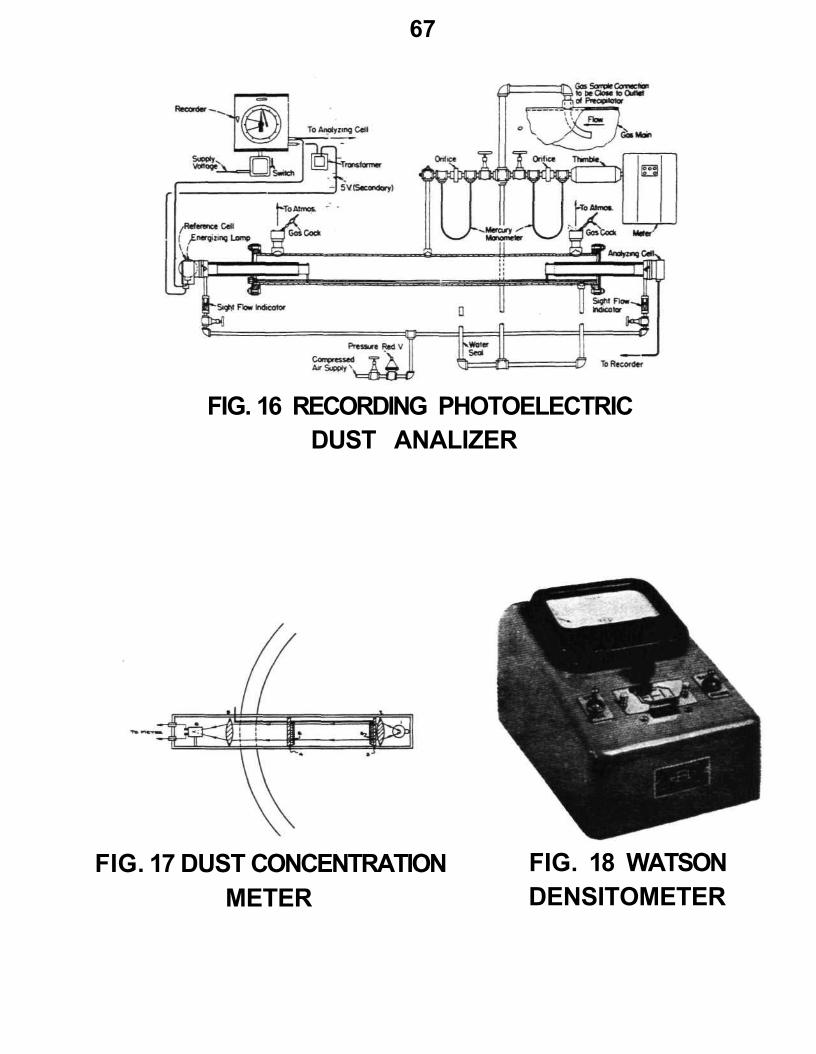
67
FIG. 16 RECORDING PHOTOELECTRIC DUST ANALIZER
FIG. 17 DUST CONCENTRATION METER
FIG. 18 WATSON DENSITOMETER

FIG. 20 PHOTOELECTRIC PARTICLE COUNTER
68
(a) Optical System (b) Block Diagram Showing Automatic Self-Compensating
System
FIG. 19 PETERSON DIFFERENTIAL PHOTOMETER
(a) Schematic Diagram (b) Detection Chamber
(c) Time Recorder And Power Supply
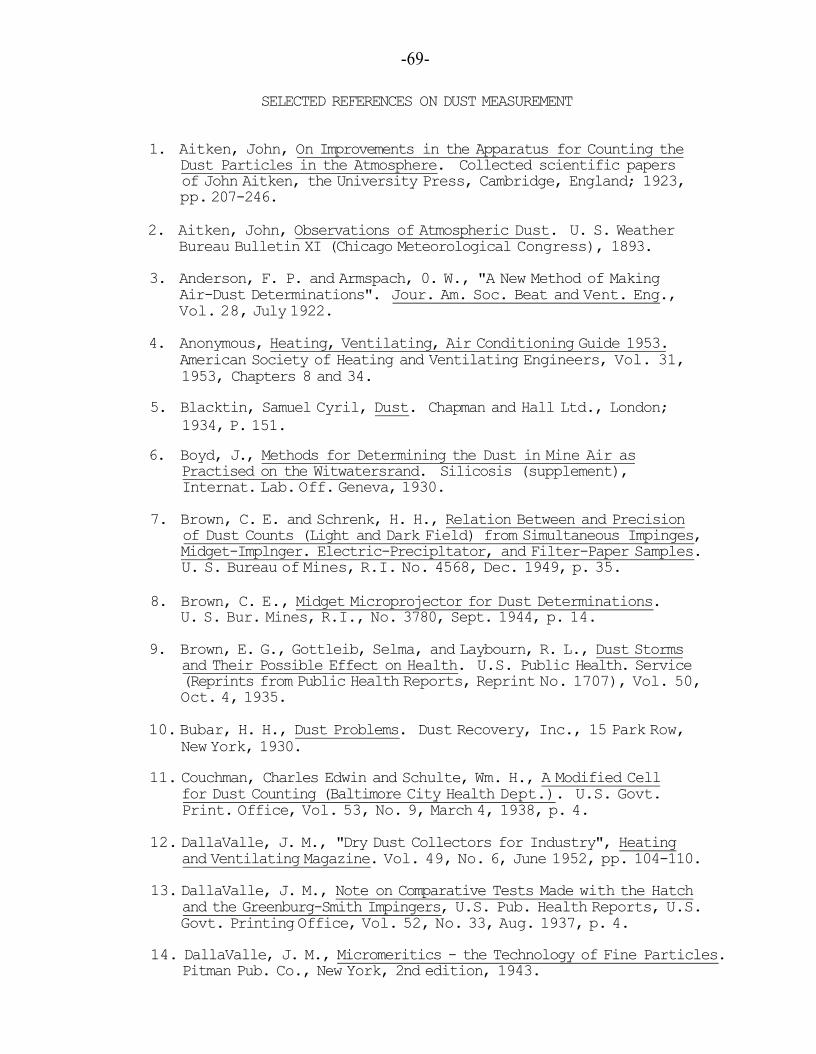
-69-
SELECTED REFERENCES ON DUST MEASUREMENT
1. Aitken, John, On Improvements in the Apparatus for Counting the Dust Particles in the Atmosphere. Collected scientific papers of John Aitken, the University Press, Cambridge, England; 1923, pp. 207-246.
2. Aitken, John, Observations of Atmospheric Dust. U. S. Weather Bureau Bulletin XI (Chicago Meteorological Congress), 1893.
3. Anderson, F. P. and Armspach, 0. W., "A New Method of Making Air-Dust Determinations". Jour. Am. Soc. Beat and Vent. Eng., Vol. 28, July 1922.
4. Anonymous, Heating, Ventilating, Air Conditioning Guide 1953. American Society of Heating and Ventilating Engineers, Vol. 31, 1953, Chapters 8 and 34.
5. Blacktin, Samuel Cyril, Dust. Chapman and Hall Ltd., London; 1934, P. 151.
6. Boyd, J., Methods for Determining the Dust in Mine Air as Practised on the Witwatersrand. Silicosis (supplement), Internat. Lab. Off. Geneva, 1930.
7. Brown, C. E. and Schrenk, H. H., Relation Between and Precision of Dust Counts (Light and Dark Field) from Simultaneous Impinges, Midget-Implnger. Electric-Precipltator, and Filter-Paper Samples. U. S. Bureau of Mines, R.I. No. 4568, Dec. 1949, p. 35.
8. Brown, C. E., Midget Microprojector for Dust Determinations. U. S. Bur. Mines, R.I., No. 3780, Sept. 1944, p. 14.
9. Brown, E. G., Gottleib, Selma, and Laybourn, R. L., Dust Storms and Their Possible Effect on Health. U.S. Public Health. Service (Reprints from Public Health Reports, Reprint No. 1707), Vol. 50, Oct. 4, 1935.
10. Bubar, H. H., Dust Problems. Dust Recovery, Inc., 15 Park Row, New York, 1930.
11. Couchman, Charles Edwin and Schulte, Wm. H., A Modified Cell for Dust Counting (Baltimore City Health Dept.). U.S. Govt. Print. Office, Vol. 53, No. 9, March 4, 1938, p. 4.
12. DallaValle, J. M., "Dry Dust Collectors for Industry", Heating and Ventilating Magazine. Vol. 49, No. 6, June 1952, pp. 104-110.
13. DallaValle, J. M., Note on Comparative Tests Made with the Hatch and the Greenburg-Smith Impingers, U.S. Pub. Health Reports, U.S. Govt. Printing Office, Vol. 52, No. 33, Aug. 1937, p. 4.
14. DallaValle, J. M., Micromeritics - the Technology of Fine Particles. Pitman Pub. Co., New York, 2nd edition, 1943.

-70-
15. Doyle, J. T., "Types, Applications and Limitations of Dust Precipitators." Eng. Jour., Vol. 32, No. 11, Nov. 1949, pp. 720-6.
16. Drinker, P. , "Alternating Current Precipitator for Sanitary Air Analysis." Jour. Ind. Hyg., Vol. 14, 1932, p. 364.
17. Drinker, P. and Hatch, T., "Determination of Dust Concentration." Industrial Dust, McGraw Hill Book Co., New York, 1936, Chapters
18. Drinker, P. , Thomson, R. M., and Fitchet, S. M., "Atmospheric Particulate Matter, The Use of Electric Precipitation for Quantitative Determinations and Microscopy." Jour. of Ind. Hyg., Vol. 5, 1923, p . 162.
19. Fieldner, Arno Carl, The Sugar-tube Method of Determining Bock Dust in Air, Comparative Tests of Instruments for Determining Atmospheric Dust. U.S. Public Health Bul. No. 144, Jan. 1925, p . 42.
20. Green, H. L. , "Some Accurate Methods of Determining the Number and Size-Frequency of Particles in Dust." Jour. Ind. Hyg., Vol. 16, No. 29, 1934.
21. Green, H. L. and Watson, H. H., Physical Methods for the Estimation of the Dust Hazard in Industry, with Special Reference to the Occupation of the Stone Mason. Med. Council of the Privy Council, Special reprint 199, H.M. Stationery Office, London, Eng., 1935.
22. Greenburg, L. and Smith, G. W., A New Instrument For Sampling Aerial Dust. U.S. Bureau of Mines, R.I . 2392, 1922.
23. Griffin, V. P. and Breisky, J. V., "Photo-electric Smoke Recorder." American Society Mechanical Engineers Trans., Vol. 52 (1), 1930.
24. Gucker, Frank T., J r . , Determination of Concentration and Size of Particulate Matter by Light Scattering and Sonic Techniques. Proceedings of the Firs t National Air Pollution Symposium, 1950, pp. 14-25.
25. Gucker, Frank T., J r . , Instrumental Methods of Measuring Mass Concentration and Particulate Concentration in Aerosols. Air Pollution, Proceedings of the U.S. Technical Conference on Air Pollution, 1952, pp. 617-633.
26. Guyton, A.C., "Electronic Counting and Size Determination of Particles in Aerosols." Jour. of Industrial Hygiene and Toxicology, Vol. 28, No. 4, July 1946, pp. 133-135.
27. Hardy, A. C, "A Recording Photoelectric Color Analyser." Jour. Optical Soc. Am. and Rev. Sci. Ins t . , 1929.

-71-28. Hazard, W. (J., "An Atmospheric Dust Recorder." Jour. Frank.
Inst., Vol. 217, May 1934.
29. Hill, E. V., "Quantitative Determination of Air Dust." Heating and Ventilating Mag.. Vol. 14, No. 6, 1917, p. 6.
30. Holt, P. F., "Stuay of Dusts in Industrial Atmospheres." Metallurgia, Vol. 43, No. 257, Mar. 1951, pp. 151-152.
31. Holt, P. F., "Study of Dusts in Industrial Atmospheres." Metallurgia, Vol. 43, No. 258, Apr. 1951, pp. 203-204.
32. Holt, P. F., "Study of Dusts in Industrial Atmospheres." Metallurgia. Vol. 43, No. 259, May 1951, pp. 258-259.
33. Holt, P. F., "Study of Dusts in Industrial Atmosphere." Metallurgia, Vol. 44, No. 262, Aug. 1951, pp. 108-109.
34. Holt, P. F., "Determination of Mass Concentration of Air-Borne Dusts: Electric Sampling Pump for Use with Volatile Filters." Inst. Mining and Metallurgia Transactions, Vol. 61, Oct. 1951, pp. 15-20.
35. Hooper, W. J., "The Deposition of Dust on Walls." Physics, Vol. 1, 1931.
36. Kamack, H. J., "Particle Size Determination by Centrifugal Pipet Sedimentation." Analytical Chemistry, Vol. 23, No. 6, June 1951, pp. 844-50.
37. Kellogg, C. E., Soil Bloving and Dust Storms. U. S. Dept. of Agriculture, Miscellaneous Publication No. 221, March 1935.
38. Kunkel, W. B. and Hansen, J. W., "Dust Electricity Analyzer." Beview of Scientific Instruments, Vol. 21, No. 4, Apr. 1950, pp. 308-14.
39. LaMer, V. K., and Barnes, M.D., "Monodispersed Hydrophobic Colloidal Dispersions and Light Scattering Properties." Jour. of Colloidal Science, Vol. 1, 1946, pp. 71-77.
40. LaMer, V. K. and Sinclair, D., OSRD Beport 1857. Office of Publications Board, U.S. Dept. of Commerce, Beport 944, 1944.
41. Lissman, M. A., "An Analysis of Mechanical Methods of Dust Collection." Chemical and Metallurgical Engineer, Vol. 37, 1930, pp. 630-634.
42. Meetham, A. B., Atmospheric Pollution, Its Origins and Prevention. Pergamon Press, London, 1952, p. 151.
43. Miners' Phthisis Prevention Committee, Final Beport, Union of South Africa, Johannesburg, Jan. 10, 1919.
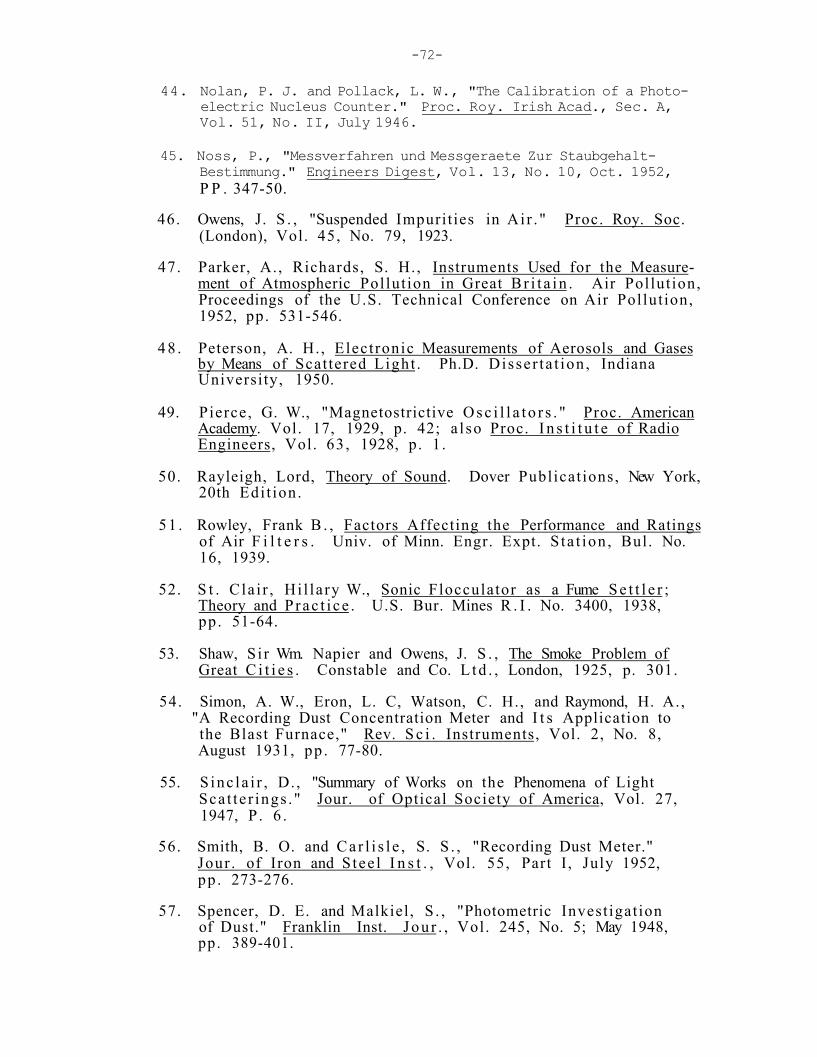
-72-
44. Nolan, P. J. and Pollack, L. W., "The Calibration of a Photoelectric Nucleus Counter." Proc. Roy. Irish Acad., Sec. A, Vol. 51, No. II, July 1946.
45. Noss, P., "Messverfahren und Messgeraete Zur Staubgehalt-Bestimmung." Engineers Digest, Vol. 13, No. 10, Oct. 1952, P P . 347-50.
46. Owens, J. S . , "Suspended Impurit ies in Ai r . " Proc. Roy. Soc. (London), Vol. 45, No. 79, 1923.
47. Parker, A., Richards, S. H., Instruments Used for the Measurement of Atmospheric Pollut ion in Great B r i t a in . Air Pollut ion, Proceedings of the U.S. Technical Conference on Air Pollut ion, 1952, pp. 531-546.
48 . Peterson, A. H., Electronic Measurements of Aerosols and Gases by Means of Scattered Light . Ph.D. Disser ta t ion , Indiana University, 1950.
49. Pierce, G. W., "Magnetostrictive O s c i l l a t o r s . " Proc. American Academy. Vol. 17, 1929, p. 42; a l so Proc. I n s t i t u t e of Radio Engineers, Vol. 63, 1928, p. 1.
50. Rayleigh, Lord, Theory of Sound. Dover Publicat ions, New York, 20th Edi t ion.
51 . Rowley, Frank B . , Factors Affecting the Performance and Ratings of Air F i l t e r s . Univ. of Minn. Engr. Expt. S ta t ion , Bul. No. 16, 1939.
52. S t . Cla i r , Hi l la ry W., Sonic Flocculator as a Fume S e t t l e r ; Theory and P rac t i ce . U.S. Bur. Mines R . I . No. 3400, 1938, pp. 51-64.
53. Shaw, S i r Wm. Napier and Owens, J. S . , The Smoke Problem of Great C i t i e s . Constable and Co. L t d . , London, 1925, p. 301.
54. Simon, A. W., Eron, L. C, Watson, C. H., and Raymond, H. A., "A Recording Dust Concentration Meter and I t s Application to the Blast Furnace," Rev. S c i . Instruments, Vol. 2, No. 8, August 1931, pp . 77-80.
55. S inc la i r , D. , "Summary of Works on the Phenomena of Light Sca t te r ings ." Jour. of Optical Society of America, Vol. 27, 1947, P . 6 .
56. Smith, B. O. and Car l i s l e , S. S . , "Recording Dust Meter." Jour . of Iron and S tee l I n s t . , Vol. 55, Part I, July 1952, pp . 273-276.
57. Spencer, D. E. and Malkiel, S . , "Photometric Invest igation of Dust." Franklin Inst. Jou r . , Vol. 245, No. 5; May 1948, pp. 389-401.
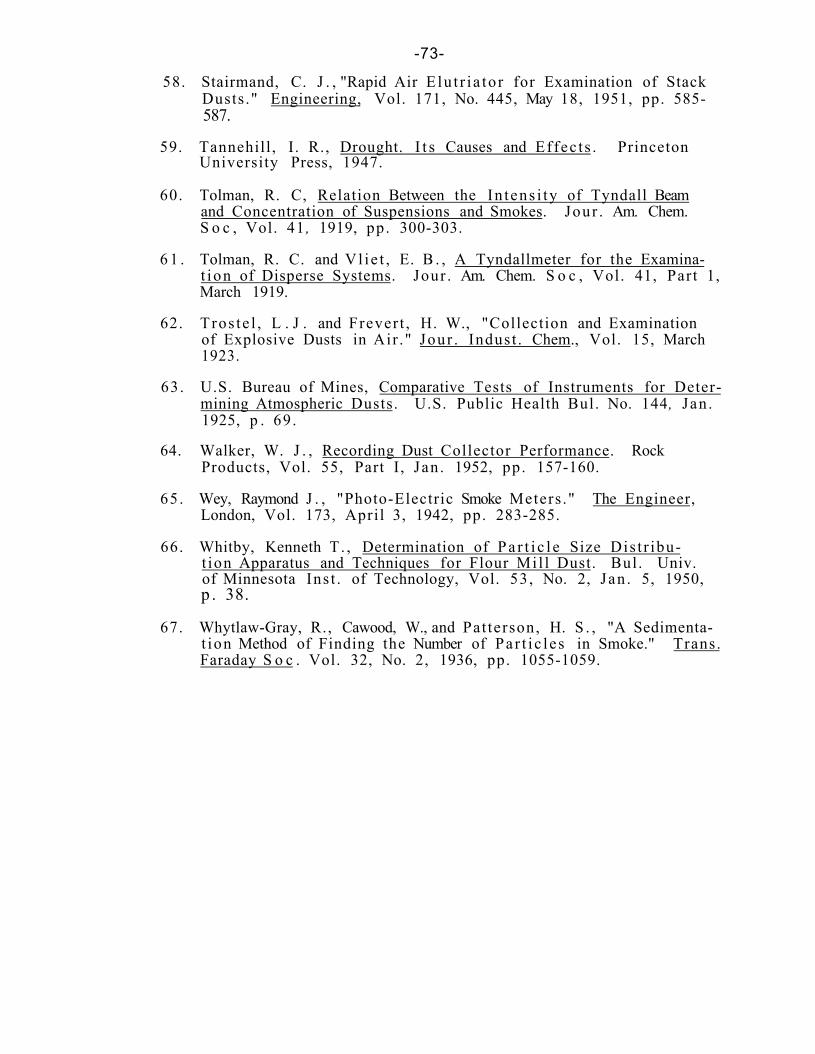
-73-
58. Stairmand, C. J . , "Rapid Air E lu t r i a to r for Examination of Stack Dusts ." Engineering, Vol. 171, No. 445, May 18, 1951, pp. 585-587.
59. Tannehill , I . R., Drought. I t s Causes and Effec t s . Princeton University Press, 1947.
60. Tolman, R. C, Relation Between the In tens i ty of Tyndall Beam and Concentration of Suspensions and Smokes. Jour . Am. Chem. S o c , Vol. 41 , 1919, pp. 300-303.
6 1 . Tolman, R. C. and Vl ie t , E. B . , A Tyndallmeter for the Examinat ion of Disperse Systems. Jour . Am. Chem. S o c , Vol. 41, Part 1, March 1919.
62. Tros te l , L . J . and Frever t , H. W., "Collection and Examination of Explosive Dusts in Air ." Jour . Indust . Chem., Vol. 15, March 1923.
63. U.S. Bureau of Mines, Comparative Tests of Instruments for Determining Atmospheric Dusts. U.S. Public Health Bul. No. 144, Jan . 1925, p . 69.
64. Walker, W. J . , Recording Dust Collector Performance. Rock Products, Vol. 55, Part I, Jan . 1952, pp. 157-160.
65 . Wey, Raymond J . , "Photo-Electric Smoke Meters ." The Engineer, London, Vol. 173, April 3, 1942, pp. 283-285.
66. Whitby, Kenneth T. , Determination of Pa r t i c l e Size Dis t r ibut ion Apparatus and Techniques for Flour Mi l l Dust. Bul . Univ. of Minnesota Ins t . of Technology, Vol. 53, No. 2, Jan . 5, 1950, p . 38.
67. Whytlaw-Gray, R., Cawood, W., and Pat terson, H. S . , "A Sedimentat ion Method of Finding the Number of Pa r t i c l e s in Smoke." Trans. Faraday S o c . Vol. 32, No. 2, 1936, pp. 1055-1059.
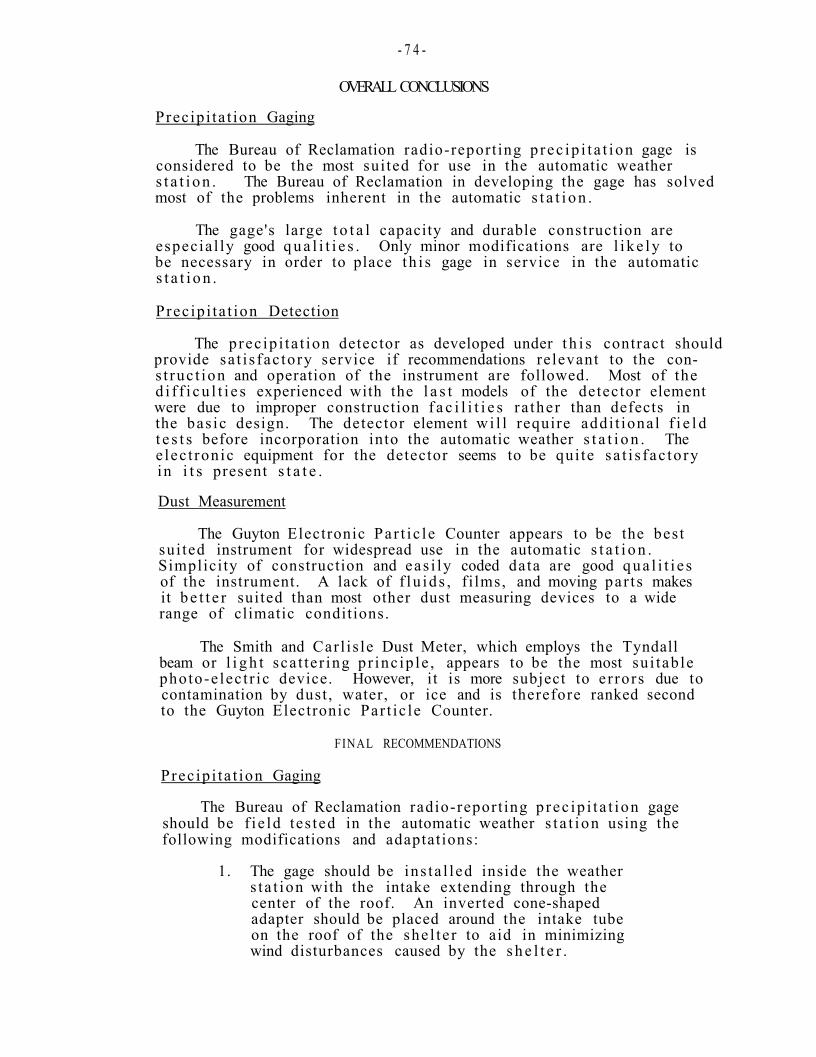
- 7 4 -
OVERALL CONCLUSIONS
Prec ip i ta t ion Gaging
The Bureau of Reclamation radio-report ing p rec ip i t a t i on gage is considered to be the most sui ted for use in the automatic weather s t a t i o n . The Bureau of Reclamation in developing the gage has solved most of the problems inherent in the automatic s t a t i o n .
The gage's large t o t a l capacity and durable construction are especia l ly good q u a l i t i e s . Only minor modifications are l i ke ly to be necessary in order to place th i s gage in service in the automatic s t a t i o n .
Prec ip i ta t ion Detection
The prec ip i ta t ion detector as developed under t h i s contract should provide sa t i s fac tory service if recommendations relevant to the cons t ruc t ion and operation of the instrument are followed. Most of the d i f f i c u l t i e s experienced with the l a s t models of the detector element were due to improper construction f a c i l i t i e s ra ther than defects in the bas ic design. The detector element w i l l require addi t ional f i e l d t e s t s before incorporation into the automatic weather s t a t i o n . The e lec t ronic equipment for the detector seems to be qui te sa t i s fac to ry in i t s present s t a t e .
Dust Measurement
The Guyton Electronic Par t i c le Counter appears to be the best sui ted instrument for widespread use in the automatic s t a t i o n . Simplicity of construction and eas i ly coded data are good qua l i t i e s of the instrument. A lack of f l u ids , f i lms, and moving par t s makes it b e t t e r suited than most other dust measuring devices to a wide range of climatic conditions.
The Smith and Carl is le Dust Meter, which employs the Tyndall beam or l i g h t sca t te r ing pr inc ip le , appears to be the most su i table photo-e lec t r ic device. However, i t is more subject to er rors due to contamination by dust , water, or ice and is therefore ranked second to the Guyton Electronic Par t ic le Counter.
FINAL RECOMMENDATIONS
Prec ip i ta t ion Gaging
The Bureau of Reclamation radio-report ing p rec ip i t a t ion gage should be f i e ld tes ted in the automatic weather s t a t i on using the following modifications and adaptations:
1. The gage should be ins ta l led inside the weather s t a t ion with the intake extending through the center of the roof. An inverted cone-shaped adapter should be placed around the intake tube on the roof of the she l te r to aid in minimizing wind disturbances caused by the s h e l t e r .

-75-
2. The gage's coding system should be modified so tha t p rec ip i t a t i on can be read to the nearest 0.01 inch.
3. A thermostat ical ly-control led heat exchanger, similar to t ha t used by the Bureau of Reclamat ion , should be ins ta l l ed on the she l t e r heater in order to heat the exter ior portions of the intake tube when temperatures are between 20° F and 40° F. This should be coupled to the gage so as to apply heat only when prec ip i ta t ion is occurring.
4. The "on-cal l" telemetering system employed by the Bureau of Reclamation should be f i e ld t e s t ed . This system would eliminate time er rors in observations and would avoid the use of clocks in the automatic s t a t i o n . Also, by making frequent ca l ls during suspected heavy prec ip i ta t ion , some informat ion as to the r a t e of p rec ip i ta t ion could be obtained.
Prec ip i ta t ion Detector
The p rec ip i t a t i on detector needs further f i e ld t e s t ing and the following refinements:
1. Better methods of producing the detector element are required . Production defects can r e su l t in future shor t c i r cu i t s in the detector element. The present water seals seem to be inadequate and improved mater ia l and methods should be sought.
2. Water t i g h t connections should be made in a l l of the cables .
3. For use in most p laces , the detector element should be covered, except at observation time, in order to reduce the col lec t ion of dust and other contaminants upon i t .
Dust Measurement
The Guyton Elect ronic Pa r t i c l e Counter should be f i e ld tes ted and modified for use in the automatic weather s t a t i o n , as follows:
1. Test without a charging voltage on the pickup wire or p la te so tha t only dry pa r t i c l e s w i l l be detected.
2. Test with a charging voltage on the pickup wire or p la t e to determine if watery pa r t i c l e s detected in t h i s manner give a di f ferent s ignal than dry ones. This device might be able to dis t inguish between wet and dry p a r t i c l e s .

-76-3. Test with a pickup wire and with a pickup plate
to see which gives the most desirable count and the most trouble-free operation.
4. The detector element should be completely covered except at observation time.
5. A small heater winding should be placed around the je t in the detector element to see if this is satisfactory for prevention of icing.