precise visualization method for cultural heritage …
TRANSCRIPT

* Corresponding author
PRECISE VISUALIZATION METHOD FOR CULTURAL HERITAGE-THE CASE OF HIGH-RESOLUTION READ RELIEF IMAGE MAP USED FOR STUDY OF ROYAL
CITY OF ANGKOR THOM, CAMBODIA
T.Chiba a,* , Shimoda b, T. Haraguchi c, M. Shimoda d
a Research Institute, Asia Air Survey Co., Ltd., Kawasaki, Japan – [email protected] b Cultural Properties, Department, Agency for Cultural Affairs, Tokyo, Japan –[email protected]
c Graduate School of Science Biology and Geosciences, Osaka city University ,Osaka, Japan – [email protected] d Waseda Research Institute for Science and Engineering, Tokyo, Japan– [email protected]
Commission II, WG II/6
KEY WORDS: Airborne Laser Scanning, Visualization, Urbanism, Water Management, Red Relief Image Map ABSTRACT: To precisely visualize the Royal City of Angkor Thom, Cambodia, we used a new method in field of cultural heritage study. Read Relief Image Map (RRIM, Chiba et al., 2008) is a powerful method which has been used for geomorphological studies. In this study, using the LiDAR data conducted at the Angkor Archaeological Park in Cambodia in April 2012 (Evans et al., 2013), we visualized the Royal City of Angkor Thom and its vicinity (Shimoda et al., 2016). The RRIM provided a new visualization method of localizing, minute topographical changes in regions with large undulations over a wide area. It has proved to be effective in mapping, on a single wide-area map, the numerous buried remains that exist as comparable height differences or minute undulations measuring less than 1 meter in height, and provides a unique aerial view of their widespread distribution. Based on the RRIM map, past archaeological studies were referenced to reconstruct the layout of the water channel network system. Past studies revealed that a large number of ponds had been dug inside Angkor Thom. The RRIM expanded the investigation and revealed the existence of many ponds outside the royal capital indicating that a residential community had flourished outside the moat surrounded capital city
1 INTRODUCTION
The royal capital of Angkor Thom at the 12th century, lies in the tropical forest of the Angkor Archaeological Park. The royal city, surrounded by a 3 km-square enclosure was developed as the center of the Angkor Empire’s expansive territory.
The Khmer Archaeology LiDAR Consortium, composed of a team of international researchers, utilized airborne laser scanning (LiDAR) technology to survey an area of 370km2 in April 2012 that included the Angkor Archaeological Park, the Koh Ker site, and part of Mt. Kulen. As a result, it was found a large number of hydraulic structures including water channels and ponds previously not identified as land features inside and out- side the dense forest of Angkor Thom (Evans et al., 2013). The authors used a topographical data processing technology called Red Relief Image Map (RRIM) to map the topographical features of the Angkor area so the features could be more visually recognizable. A map was produced that allowed micro topographic features to be identified where they could not be identified from conventional contour maps, color contour maps, and shaded reliefs. The map also provided an aerial view of micro topographical features over the entire survey area. Capturing subtle undulations in the present landscape created by remains that lay buried over a wide area proved to be extremely effective in assessing the shape, layout and interrelationship of hydraulic structures, and other such structural elements. Shimoda et al.(2016) discussed the hydraulic structures in and around
Angkor Thom which have come to light through the RRIM interpretation. In this paper, We discuss the usage of recent progress of RRIM on cultural heritage.
2 RED RELIEF IMAGE MAP
From the LiDAR digital elevation model (DEM), a three dimensional visualization method known as Red Relief Image Map or RRIM was produced effectively representing 3D topographic information without any additional devices and stereopsis ability for its audience (Chiba et al., 2008, Chiba and Has,2016). The RRIM was originally developed for visualization of DEMs produced by LiDAR, but is also suitable for a wide variety of such high resolution three dimensional data such as ASTER-GDEM, SRTM3, GTOPO30 and ETOPO2. This method can visualize the topographic slope, concavities and convexities at the same time. The RRIM combines an image that expresses slope by different intensities of red and an image that expresses altitude by brightness; areas are redder as the gradient becomes steeper, areas near ridges are brighter the closer they are to the ridge, and valleys are darker the deeper they become. Height and depth, or ridges and valleys, are obtained by subtracting underground openness from aboveground openness and dividing the remainder by 2. Positive and Negative openness are parameters proposed by Yokoyama (2002), which take into consideration the fractal nature of the terrain and adjust images to match the upper size limit of the terrain that is to be mapped. One of the advantages of the RRIM is that it can clearly visualize localized, subtle topographical changes even in regions with large undulations over a wide area. In other words, the RRIM represents not only
The International Archives of the Photogrammetry, Remote Sensing and Spatial Information Sciences, Volume XLI-B2, 2016 XXIII ISPRS Congress, 12–19 July 2016, Prague, Czech Republic
This contribution has been peer-reviewed. doi:10.5194/isprsarchives-XLI-B2-383-2016
383
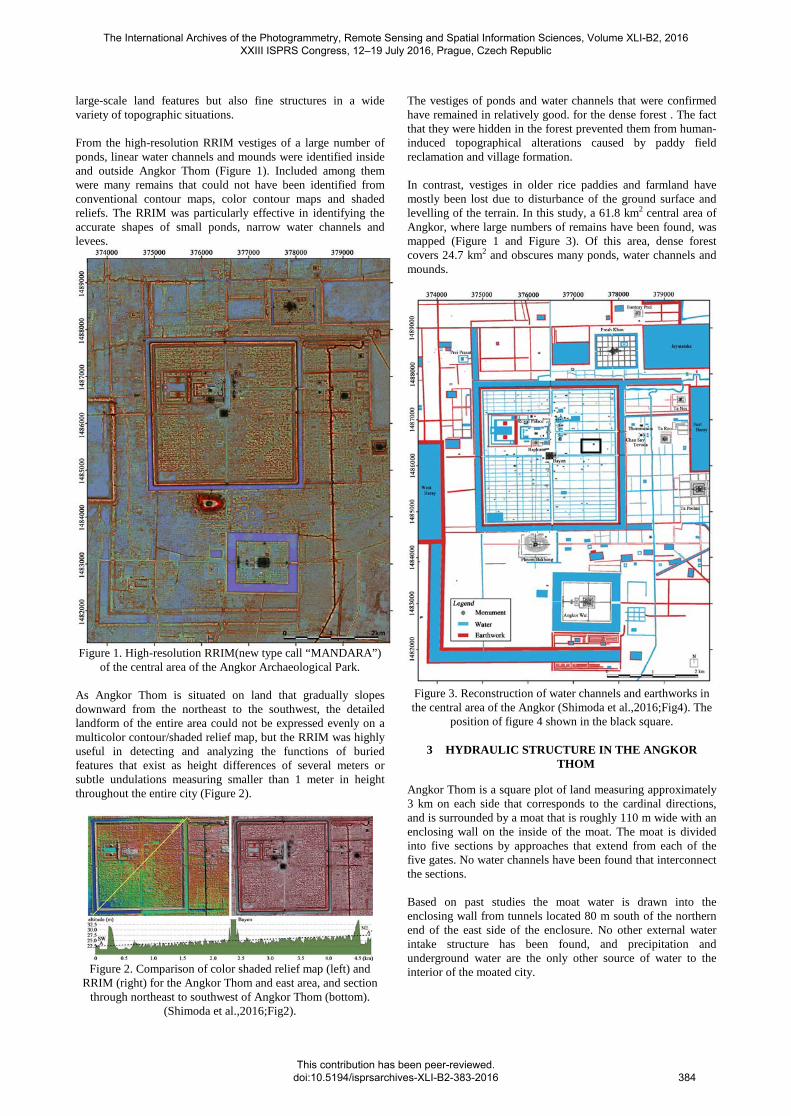
large-scale land features but also fine structures in a wide variety of topographic situations. From the high-resolution RRIM vestiges of a large number of ponds, linear water channels and mounds were identified inside and outside Angkor Thom (Figure 1). Included among them were many remains that could not have been identified from conventional contour maps, color contour maps and shaded reliefs. The RRIM was particularly effective in identifying the accurate shapes of small ponds, narrow water channels and levees.
Figure 1. High-resolution RRIM(new type call “MANDARA”)
of the central area of the Angkor Archaeological Park. As Angkor Thom is situated on land that gradually slopes downward from the northeast to the southwest, the detailed landform of the entire area could not be expressed evenly on a multicolor contour/shaded relief map, but the RRIM was highly useful in detecting and analyzing the functions of buried features that exist as height differences of several meters or subtle undulations measuring smaller than 1 meter in height throughout the entire city (Figure 2).
Figure 2. Comparison of color shaded relief map (left) and
RRIM (right) for the Angkor Thom and east area, and section through northeast to southwest of Angkor Thom (bottom).
(Shimoda et al.,2016;Fig2).
The vestiges of ponds and water channels that were confirmed have remained in relatively good. for the dense forest . The fact that they were hidden in the forest prevented them from human-induced topographical alterations caused by paddy field reclamation and village formation. In contrast, vestiges in older rice paddies and farmland have mostly been lost due to disturbance of the ground surface and levelling of the terrain. In this study, a 61.8 km2 central area of Angkor, where large numbers of remains have been found, was mapped (Figure 1 and Figure 3). Of this area, dense forest covers 24.7 km2 and obscures many ponds, water channels and mounds.
Figure 3. Reconstruction of water channels and earthworks in the central area of the Angkor (Shimoda et al.,2016;Fig4). The
position of figure 4 shown in the black square.
3 HYDRAULIC STRUCTURE IN THE ANGKOR THOM
Angkor Thom is a square plot of land measuring approximately 3 km on each side that corresponds to the cardinal directions, and is surrounded by a moat that is roughly 110 m wide with an enclosing wall on the inside of the moat. The moat is divided into five sections by approaches that extend from each of the five gates. No water channels have been found that interconnect the sections. Based on past studies the moat water is drawn into the enclosing wall from tunnels located 80 m south of the northern end of the east side of the enclosure. No other external water intake structure has been found, and precipitation and underground water are the only other source of water to the interior of the moated city.
The International Archives of the Photogrammetry, Remote Sensing and Spatial Information Sciences, Volume XLI-B2, 2016 XXIII ISPRS Congress, 12–19 July 2016, Prague, Czech Republic
This contribution has been peer-reviewed. doi:10.5194/isprsarchives-XLI-B2-383-2016
384

Figure 4. Distribution of ponds in a specific area of Angkor Thom surrounded by water channels(Shimoda et al.,2016;Fig7). The location of this area is shown in Figure 3. In this area, it is particularly difficult to distinguish the shape of each pond, as it
is thought that ponds were dug overlapping each other, and also due to erosion and sedimentation. (Above left: map of field survey by Gaucher, 2004, Figure 17; above right: Shaded relief and contour lines (1 m) based on LiDAR data; below left: High-
resolution RRIM; below right: Reconstruction of ponds from High-resolution RRIM).
The internal linear structure is located 80 - 100 m inside the enclosure. Excavation surveys have found that it is bounded by a tiered embankment made of sandstone upper tiers and laterite lower tiers. Measured at the top- most tier of the embankment, the moat is 24 - 28 m wide and the embankment is 2.2 m high. As with the moat on the outside of the enclosure, the internal linear structure is also interrupted by five large approaches
4 PONDS IN THE MOATED CITY
Among the hydraulic features in the moated city, the numerous ponds are important elements in addition to water channels. Gaucher counted a total of 2895 ponds (Gaucher, 2004). They include Beng Thom and other large ponds, but most are less than 1000m2. The ponds generally have a ground plan that is rectangular in the east-west direction, with the long side measuring 20 - 40 m and short side measuring around 20 m. In terms of depth, many are around 1 - 2 m as present land features (Figure 4). Ponds in the southeast quadrant are relatively deeper than the other areas. However, future survey is essential to elucidate the depth of the initial pond bottom located beneath the sedimentary soil. The ponds are deformed due to long years of erosion, soil and sand deposits. The new topographical map has confirmed the outlines of roughly 2000 ponds in the royal city .
This figure differs from Gaucher’s figure, but the new figure counts adjacent ponds that have become a single pool as one, and does not count ponds near the main approaches extending to the south and north from Bayon whose traces are unclear. Figure 4 shows how difficult it is to identify the initial shape of ponds by comparing, for example, the area around the four water channels of N0E, N1E, E3N, and E4N according to Gaucher’s distribution map and the RRIM. The ponds are frequently located as though to form a continuous row in the east-west direction. They probably took on this elongated shape due to the later addition that overlapped with existing ponds
5 IMPROVEMENT OF RRIM
Red Relief Image Map was invented at 2002 by Tatsuro Chiba. This method is revolutionary visualization technology for field work of dense forest, specialized for DEM data of LiDAR, at lava field of Fuji volcano central Japan. The surface of lava flow have small and caotic feature . But the feature of Angkor Tom smaller than lava surface feature. For the field work in dense and flat tropical forest , ordinary RRIM was better but not best. Then We try to improve the creation process (Figure 6).This process is new idea stage , We want to discuss to number of researchers.
The International Archives of the Photogrammetry, Remote Sensing and Spatial Information Sciences, Volume XLI-B2, 2016 XXIII ISPRS Congress, 12–19 July 2016, Prague, Czech Republic
This contribution has been peer-reviewed. doi:10.5194/isprsarchives-XLI-B2-383-2016
385

Figure 6. Various images required to making Red Relief Image Map. 1: positive openness map with bright as higher value of positive openness, 2: negative openness map with bright as lower value of negative openness, 3:ridge and valley map with bright as
higher RV parameter. The convex range is bright and concave range is dark (3=1+2), 4:red colored slope angle , redder as the gradient becomes steeper, 5:”Red Relief Image Map”(5=3+4), 6: CIE-L*a*b* colored type of RRIM(6=1*3*4), 7:yellow colored slope angle, 8: rainbow-colored negative openness, bluer as the gradient becomes higher value of negative openess ,9:Red Relief
Image Map (MANDARA type )with rainbow colored negative openness(9=5+6+7+8)
REFERENCES
Chiba, T., Kaneta, S., & Suzuki, Y., 2008. Red Relief Image Map: New Visualization Method for Three Dimensional Data. In: The International Archives of the Photogrammetry, Remote Sensing and Spatial Information Sciences, Beijing, China , Vol. XXXVII, Part B2 , pp.1071-1076. Evans, D. et al., 2013. Uncovering Archaeological Landscapes at Angkor Using LiDAR. Proceedings of the National Academy of Sciences of the United States of America, 110, pp.12595-12600.
Gaucher, J., 2004. Angkor Thom, une utopie réalisée? Structuration de l’espace et modèle indien d’urbanisme dans le Cambodge ancien. Arts Asiatiques, 59, pp. 58-86. Shimoda, I., T. Haraguchi, T. Chiba and M. Shimoda., 2016. The Advanced Hydraulic City Structure of the Royal City of Angkor Thom and Vicinity Revealed through a High-Resolution Red Relief Image Map, Archaeological Discovery , 4(1), pp.22-36. Yokoyama, R., Sirasawa, M., & Pike, R., 2002. Visualizing Topography by Openness: A New Application of Image Processing to Digital Elevation Models. Photogrammetric Engineering and Remote Sensing, 68, pp.257-265.
The International Archives of the Photogrammetry, Remote Sensing and Spatial Information Sciences, Volume XLI-B2, 2016 XXIII ISPRS Congress, 12–19 July 2016, Prague, Czech Republic
This contribution has been peer-reviewed. doi:10.5194/isprsarchives-XLI-B2-383-2016
386