precisely probability - buffalo state collegemath.buffalostate.edu/~it/projects/kucsmas.pdf · 1...
TRANSCRIPT

1
Precisely Probability
By: Kyle Kucsmas
Grade Level: 8
Time Span: 5 Instructional Days
Tools:
• 100 Snap Cubes (ten different colors)
• 1 Paper Bag
• 12 Dice
• 6 Spinners
• 6 Pennies
• 6 Decks of Standard Playing Cards
• Classroom set of Rulers
• Graph Paper
• TI-83 Calculator (preferably one per student)
• TI View Screen
• Probability Simulation Application for TI-83
• 6 Transfer Wires for TI-83
2
Objectives for the Unit
The students will be able to:
• Define probability vocabulary terms including Experiment, Event, Outcome,
Probability, and Sample with 90% accuracy.
• Calculate probabilities of card, spinner, coin, and dice simulations with 90%
accuracy.
• Convert fractional probabilities into decimal and percent form.
• Determine which events are more likely to occur by comparing calculated
probabilities with 90% accuracy.
• Record and predict outcomes of an experiment.
• Construct visual representations of complex experiments to calculate
probabilities.

3
Standards
NCTM:
• Number and Operations
• Data Analysis and Probability
• Problem Solving
• Communication
• Connections
• Representation
NYS Key Ideas:
• 1B. Make and evaluate conjectures and arguments, using appropriate language.
• 2B. Understand and apply ratios, proportions, and percents through a variety of
hands-on explorations.
• 3G. Apply concepts of ratio and proportion to solve problems.
• 4F. Use concrete materials and diagrams to describe the operations of real-world
processes and systems.
• 4G. Develop and explore models that do not rely on chance.
• 6A. Use estimation to check the reasonableness of results obtained by
computation, algorithms, or the use of technology.
• 6B. Use estimation to solve problems for which exact answers are inappropriate.
• 6C. Estimate the probability of events.
• 6D. Use simulation techniques to estimate probabilities.

4
Resources
Internet:
http://education.ti.com/educationportal/
http://www.chem.unl.edu/zeng/joy/mclab/mcintro.html. By Joy Woller 1996.
http://www-stat.stanford.edu/~susan/surprise/
Books:
Linn, Charles. (1972). Probability. New York: Thomas Y Crowell Company.
Razzell, Arthur R and K.G.O. Watts. (1964). Probability: The Science of Chance. Garden
City, New York: Doubleday & Company Inc.
Witt, Judith A. ed. Et al. (1994). The World Book of Math Power. Chicago: World Book
Encyclopedia, Inc.
Technology:
Probability Simulation Version 1.1 2001. C/o Corey Taylor and Rusty Wagner
downloaded free from http://education.ti.com/educationportal/ .

5
Unit Outline
I). LESSON ONE:
A). Vocabulary and Calculation
1. Terms Experiment, Outcome, Event, and Probability defined and recorded by
students.
2. Simple probabilities are calculated using dice, coins, playing cards, and spinners.
II). LESSON TWO:
A). More Likely and Less Likely
1. Students calculate more advanced probabilities from similar experiments as
mentioned in Lesson One.
2. Students will convert the fractional probabilities into decimal and percents for
comparison of which is more likely to occur.
III). LESSON THREE
A). Sample
1. Students will define and record the vocabulary term Sample.
2. Students will perform experiments and predict probabilities of rolling dice,
flipping a coin, drawing cards, and spinning spinners.
3. Each team of students will perform the experiment several times with and without
replacement, when applicable, and record the outcomes in table format.
IV). LESSON FOUR
A). Monte Carlo Method and TI-83 Calculator
1. Each student will use Probability Simulation Application on TI-83 Calculator.
6
2. Each student will transfer and receive the application through the TI transfer wire.
3. Students will run application for three experiments mentioned in Lesson Three.
4. Outcomes will be recorded and analyzed by the students on graph paper.
V). LESSON FIVE
A). It’s a-MAZE-ing Probability
1. Students will be given a maze with more than one desired outcomes and will be
asked to find the probability of a desired event.
2. Students will construct representation of all outcomes by drawing a rectangle on
graph paper and dividing the shape accordingly for each possible outcome.
3. Students will calculate probability using the visual representation.
7
LESSON ONE
Vocabulary and Calculation
Summary: This lesson is designed as an introduction to probability. Students will become
familiar with terminology used and methods of calculating probabilities. Manipulative
devices used include snap cubes, dice, coins, spinners, and playing cards.
Grade Level: 8
Duration: 50 minutes
Class Size: 24-28
Student Ability: Heterogeneous
Materials: 2 dice, 1 spinners, 1 penny,20 snap cubes, 1 paper bag, 1 deck of standard
playing cards, one penny, I Chart for each student (See Sheet 1), Worksheet for each
student (See Sheet 2), Homework (See Sheet 3).
Objectives:
• Students will be able to define and properly use key vocabulary terms
experiment, event, outcome, and probability.
• Students will be able to use definition of probability to calculate probabilities of
simple experiments.
NCTM Standards: Number and Operations, Data Analysis and Probability, Problem
Solving, Communication, Connections, Representation
NYS Key Ideas: 1B, 2B, 3G, 6A
Anticipatory Set:
• The teacher will place ten snap cubes of two different colors into the paper bag
and ask each student to write “will happen” or “will not happen” on a sheet of
paper prior to drawing a desired color.
• Ten more cubes are added to the bag and “will happen/will not happen” is to be
replaced with “likely,” “very likely,” or “not likely.”
Procedure/Developmental Activity:
• Each student receives I Chart (See Sheet 1) for vocabulary recording.
• Class/Student definitions and textbook definitions are recorded.
• Spinner, dice, coin, and playing card outcomes discussed and listed in student

8
notebooks.
• Vocabulary terms discussed for each simulation.
• Teacher demonstrates procedure for calculating one event per experiment.
• Each student receives worksheet (See Sheet 2) for independent practice
calculating probabilities.
• Manipulative devices available for use during independent practice.
• Answers are to be reviewed near end of class time.
Assessment: Teacher will refer to the Anticipatory Set by requiring students to calculate
probabilities of drawing particular colors in their notebooks. Each student will record
answers on separate sheet of paper and submit them to the teacher at the end of class.
Closure: The teacher will review with the class the four vocabulary terms and give
examples of the terms in each simulation.
Homework: (See Sheet 3)

9
(Sheet 1)
Name:Date:
I Chart for Probability
Vocabulary Term Student/ClassDefinition
Textbook Definition(page number)

10
(Sheet 2)
Name:___________________________________________Date:___________________
P (event) = Number of ways the Event can happen Total number of Outcomes
Experiment: Flipping a coin
1) List all the possible outcomes for flipping one coin:
2) Total number of outcomes=
Find the probabilities for the following.
3) P (landing on heads) =
4) P (landing on tails) =
5) P (landing on heads and tails) =
6) P (not landing on heads) =
Experiment: Rolling dice
7) List all the possible outcomes when rolling one die:
8) Total number of outcomes=
Find the probabilities for the following.
9) P (rolling a 4) =
10) P (rolling a number less than 5) =
11) P (rolling a 7) =
12) P (rolling a number less than 9) =
13) P (rolling an even number) =
14) P (rolling an odd number less than 3) =

11
(Sheet 2 continued)
(Spinners A, B, and C drawn on front board)
Experiment: Spinner
15) List all the possible outcomes for spinner A:
Find the probabilities for the following.
16) P (landing on green) =
17) P (landing on blue) =
18) P (landing on brown) =
19) P (landing on red) =
20) List all the possible outcomes for spinner B:
Find the probabilities for the following.
21) P (landing on red) =
22) P (landing on blue) =
23) P (landing on brown) =
24) P (landing on yellow) =
25) List all the possible outcomes for spinner C:
Find the probabilities for the following.
26) P (landing on letter C) =
27) P (landing on letter A) =
28) P (landing on letters A, B, and C) =
29) P (landing on letter A, B, or C) =
30) P (landing on letter B) =

12
(Sheet 3)
Name:
Date:
Probability Vocabulary Homework
Label the following statements with the vocabulary term that best matches the sentence.Use the terms Experiment, Outcome, Event, or Probability.
1. You are trying to get a red ball from a bag. _____________________________
2. The end of a basketball game can result with a winning team and a losing team.
__________________________________
3. A spinner can be used to demonstrate probability._____________________________
4. Trying to roll a four on a die is an example of _______________________________.
5. Heads or tails are the only two ways a coin can land. __________________________
6. The chance or likelihood something will happen is known as
____________________.
7. Rolling dice can be used to demonstrate probability. ________________________
Calculate the probabilities for the following standard devices:
8. P (red card)
9. P (Jack)
10. P (club)
11. P (landing on heads)
12. P (rolling a 6)
13. P (rolling even number)
14. P (rolling number greater than 8)
15. P (rolling odd number less than 5)
16. Construct a spinner with ten outcomes and four colors. Be sure to make the
probabilities P (color 1) = (2/10), P (color 2) = (5/10), P (color 3) = (1/10), and P (color
4) = (2/10).

13
LESSON ONE ANSWER KEY
Sheet 2
1. heads, tails2. 23. 1/24. 1/25. 0/26. 1/27. 1,2,3,4,5,68. 69. 1/610. 4/611. 0/612. 6/613. 3/614. 1/615. red, green, blue, yellow16. 1/417. 1/418. 0/419. 2/420. red, blue, green, white, black, yellow21. 1/822. 3/823. 0/824. 2/825. A, B, C26. 3/1227. 7/1228. 0/1029. 12/1230. 2/12
Sheet 31) Event 9) 4/522) Outcome 10) 13/523) Experiment 11) 1/24) Event 12) 1/65) Outcome 13) 3/66) Probability 14) 0/67) Experiment 15) 2/68) 26/52 16) (spinners may vary)

14
LESSON TWO
More Likely and Less Likely
Summary: This lesson is designed to incorporate methods of long division and
percentages for calculating and comparing probabilities. Ideas including likely and less
likely can be defined mathematically.
Grade Level: 8
Duration: 50 minutes
Class Size: 24-28
Student Ability: Heterogeneous
Materials: Sheet 2 and Sheet 3 from Lesson 1
Objectives:
• Students will be able to calculate simple probabilities.
• Students will be able to convert the fractional probabilities into decimals and
percents.
• Students will be able to compare probabilities of separate experiments and events
to determine which are more likely to occur.
NCTM Standards: Number and Operations, Data Analysis and Probability, Problem
Solving, Communication, Connections, Representation
NYS Key Ideas: 2B, 3G, 6A
Anticipatory Set:
• The teacher will recite the following to the class: “The weather man predicted
58% chance of rain for today. Would you carry an umbrella? If not, what
percentage could the weather man predict for you to carry one?”
• Each student will write in their notebooks a response to the posed questions.
• The teacher will also ask the students to write an explanation supporting their
decisions.
Procedure/Developmental Activity:
• The teacher will demonstrate four examples involving the procedures necessary
for converting fractions into decimals.

15
• Long division and percentages will be modeled.
• Students will copy the examples into their notebooks for future reference.
• The teacher will instruct the students to convert the probabilities found in Sheet 2
of Lesson One into decimals and percents in their notebooks.
• Discussions including how to compare decimals will follow.
• Likely, less likely, and more likely discussed using greater than and less than
characteristics.
Assessment: Answers to Lesson One’s homework given verbally by teacher. Students
correct their answers and convert the probabilities into decimal and percent form on a
separate sheet of paper. The teacher circulates the room checking for proper procedures
and understanding.
Closure: The teacher will refer to the anticipatory set by asking the students for
reasonable answers to the posed questions, using ideas and procedures discussed during
Lesson Two.
Homework: None.
16
LESSON THREE
Sample
Summary: This lesson is an interactive self-discovery lesson involving dice, cards, coins,
and spinners. The students will perform probability experiments, collect data, and use
Sample as a tool for predicting probability.
Grade Level: 8
Duration: 50 minutes
Class Size: 24-28
Student Ability: Heterogeneous
Materials: Sheet 1 from Lesson 1, 1 copy of worksheets per student (See Sheet 4, Sheet
5, Sheet 6, Sheet 7), 30 snap cubes of 4 different colors, 1 paper bag, 12 standard dice, 6
spinners, 6 decks of standard playing cards, 6 pennies.
Objectives:
• Students will be able to define and properly use the vocabulary term Sample.
• Students will be able to collect probability data and calculate probabilities from
the Sample.
NCTM Standards: Number and Operations, Data Analysis and Probability, Problem
Solving, Communication, Connections, Representation.
NYS Key Ideas: 1B, 2B, 4F, 6A, 6B, 6C, 6D
Anticipatory Set: Each student will write about a personal situation in which a sample of
some particular product was distributed to them for consumption or use. They will give
an explanation regarding whether or not the sample was sufficient to persuade them to
buy the product.
Procedure/Developmental Activity:
• Probability vocabulary term Sample will be discussed and recorded on I Chart for
Probability (Sheet 1) of Lesson One.
• The teacher will place thirty snap cubes into the paper bag.
• A student will be asked to volunteer to record the colors drawn out of the bag on
the board or overhead.
• Probabilities of particular colors are estimated and calculated from the sample and
recorded in student notebooks.

17
• The teacher demonstrates the differences in probabilities regarding “with” and
“without replacing” cubes.
• Students will be separated into about six groups of three or four by the teacher.
• Each group will receive two dice, one spinner, one deck of cards, and one penny.
• Each student will receive one worksheet per experiment (See Sheet 4, Sheet 5,
Sheet 6, and Sheet7).
• Each group of students will make a prediction prior to performing the probability
experiments.
• Students will compare original predictions to data collect in experiments.
• The teacher will circulate to each group to ensure students remain on task and to
assist in any confusion that may occur for the students.
Assessment: The teacher will ask for volunteers to read their findings to the class.
Questions to the students will follow.
Closure: The teacher will review the vocabulary term Sample with the class and ask for
suggestions when it is appropriate to use.
Homework: Students will be asked to write a one page paper giving positive and negative
reasons for using Sample in probability. Students will be encouraged to relate the
experiments to real- world situations that use Sample as a means of prediction.

18
(Sheet 4)
Name: Date:
Experiment: Flipping a coin using Sample.
1) List all of the possible outcomes for flipping one coin.
2) Make a prediction as to which outcome, (if any), will occur more often than the otheroutcomes after 20 flips. Explain you reasoning.
3) Record your results for 20 trials of one coin in the table below.
Trial 1 2 3 4 5 6 7 8 9 10
Outcome
Trial 11 12 13 14 15 16 17 18 19 20
Outcome
4) Using your data, predict the outcome for trial 21. Give the probability of that outcome.Perform the experiment for trial 21. Compare these results.
5) Compare your original prediction to your table. Summarize your findings.

19
(Sheet 5)
Name: Date:
Experiment: Rolling 2 dice using Sample.
1) List the possible outcomes one die can have when rolled.
2) List all the sums two dice can have when rolled.
3) Make a prediction as to which sum(s), (if any), will occur more often than the othersums after 20 rolls. Explain you reasoning.
4) Record your results for rolling two dice in 20 trials.Trial 1 2 3 4 5 6 7 8 9 10
Outcome(Sum)
Trial 11 12 13 14 15 16 17 18 19 20
Outcome(Sum)
5) Using your data, predict the sum for trial 21. Give the probability of that outcome.Perform the experiment for trial 21. Compare these results.
6) Compare your original prediction to your table. Summarize your findings.
20
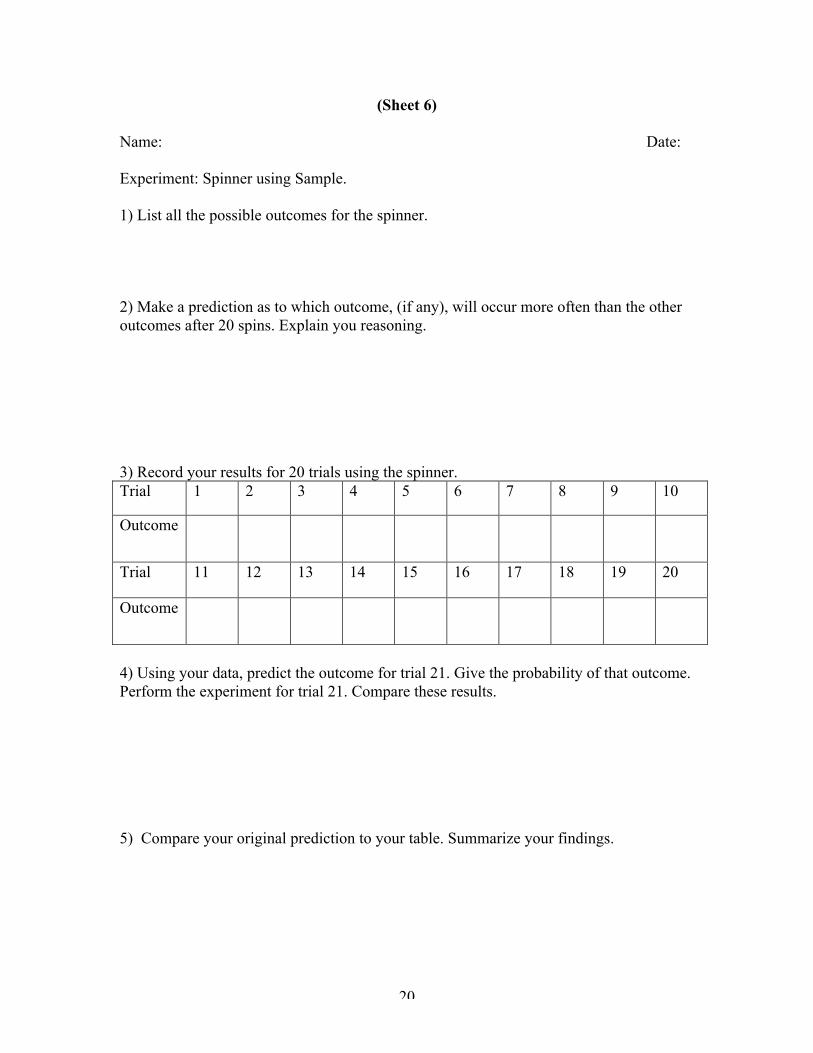
(Sheet 6)
Name: Date:
Experiment: Spinner using Sample.
1) List all the possible outcomes for the spinner.
2) Make a prediction as to which outcome, (if any), will occur more often than the otheroutcomes after 20 spins. Explain you reasoning.
3) Record your results for 20 trials using the spinner.Trial 1 2 3 4 5 6 7 8 9 10
Outcome
Trial 11 12 13 14 15 16 17 18 19 20
Outcome
4) Using your data, predict the outcome for trial 21. Give the probability of that outcome.Perform the experiment for trial 21. Compare these results.
5) Compare your original prediction to your table. Summarize your findings.

21
(Sheet 7)
Name: Date:
Experiment: Drawing one card from a standard deck of playing cards using Sample.
1) Choose ten cards randomly from a standard deck. List the cards below.
2) Predict the suit (heart, club, spade, or diamond) for the next card to be drawn from theremaining 42 cards. Record your prediction. Calculate the probability of your predictedsuit occurring.
3) Draw a card randomly from the remaining 42 and record it below. Continue to drawcards until your predicted suit is found. How many more cards (not counting the originalten) did you need to draw until you found your predicted suit?
4) Replace all the cards back into the deck and shuffle. Predict the suit that will be drawnthe most after randomly choosing 20 cards. Do not replace these cards back into theoriginal deck while choosing. Record and compare your results to the prediction.
5) Write a value (Ace through King) of a card below. Predict how many cards you willdraw until that value is found. Perform the experiment with and without replacement ofthe cards. Was it easier with or without replacement? Be sure to count the number ofcards drawn for each circumstance. Record and compare your results to your prediction.

22
LESSON FOURMonte Carlo Method and TI-83 Calculator
Summary: This lesson is designed to give students hands-on experience with the TI-83
Calculator and using the Monte Carlo Method in probability. Students will receive and
transfer the free application downloaded from TI education website to one another. The
calculator will be used to simulate experiments when the number of trials are too large
and too time consuming to be performed by hand. Students will use the data from the
simulations to create bar graphs.
Grade Level: 8
Duration: 50 minutes
Class Size: 24-28
Student Ability: Heterogeneous
Materials: Classroom set of Rulers, Graph Paper, TI-83 Calculator (preferably one per
student), TI View Screen, Probability Simulation Application for TI-83 from
http://education.ti.com/educationportal/, 6 Transfer Wires for TI-83, TI reference
document from http://education.ti.com/educationportal/ (See Sheet 8) and activity
directions (See Sheet 9) for each student.
Objectives:
• Students will be able to receive and transfer Probability Simulator Application to
one another.
• Students will simulate experiments in probability.
• Students will create tables on graph paper to record data into graphs.
• Students will be able to interpret the graphs and data from the calculator with
respect to probabilities and outcomes.
NCTM Standards: Number and Operations, Data Analysis and Probability, Problem
Solving, Communication, Connections, Representation.
NYS Key Ideas: 1B, 2B, 3G, 4F, 4G, 6D
Anticipatory Set: The teacher will remind the students of the previous lesson in which
students collected data from probability experiments. The teacher will ask the students to
write an approximation in their notebooks of the time needed to roll one dice 500 times
and record all the outcomes.

23
Procedure/Developmental Activity:
• The teacher will connect TI-83 Calculator to the TI View Screen.
• Selection number 6, Random Numbers, will be highlighted and selected.
• Teacher will press “Draw” button to demonstrate how the application runs.
• The teacher will perform several trials to create a sample of random numbers.
• Selection 1, Toss Coin, is also demonstrated for the students.
• The teacher will demonstrate “Table” and “Graph” buttons for the students.
• The teacher will demonstrate “Set” and “ADY” features for the students.
• The teacher will demonstrate proper procedures for transferring the application by
using the TI Transfer Wire and a student’s calculator.
• Students will receive TI informational documents (See Sheet 8) regarding sending
and receiving information for reference.
• Each student will receive a ruler, graph paper, and TI-83 application Probability
Simulation through one of six transfer wires.
• Each student will receive activity directions (See Sheet9).
Assessment: The teacher will circulate the classroom to address concerns and questions.
Guided questions can be asked by the teacher to the students during that time.
Closure: The teacher will collect all materials from the students. The teacher will use TI
View to run one final simulation for the class. Questions will be asked of the class
regarding the data on the graph and table.
Homework: None.

24
(Sheet 8)

25
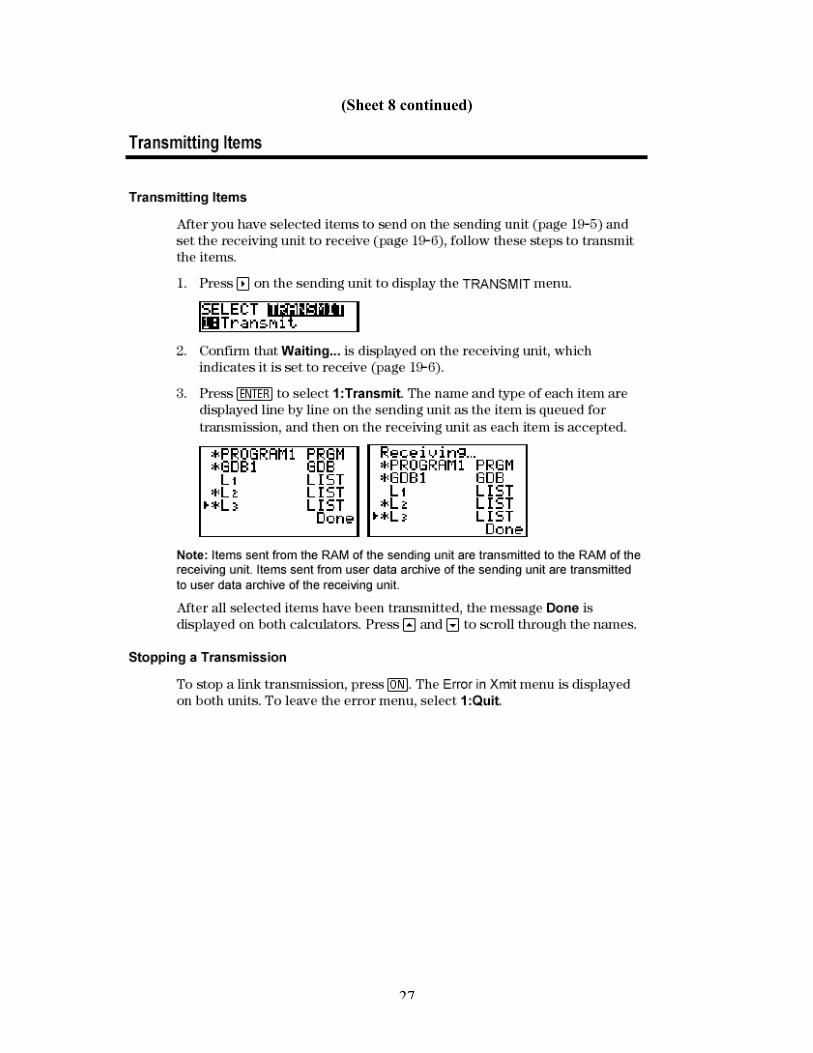
(Sheet 8 continued)

26
(Sheet 8 continued)
27
(Sheet 8 continued)
28
(Sheet 9)
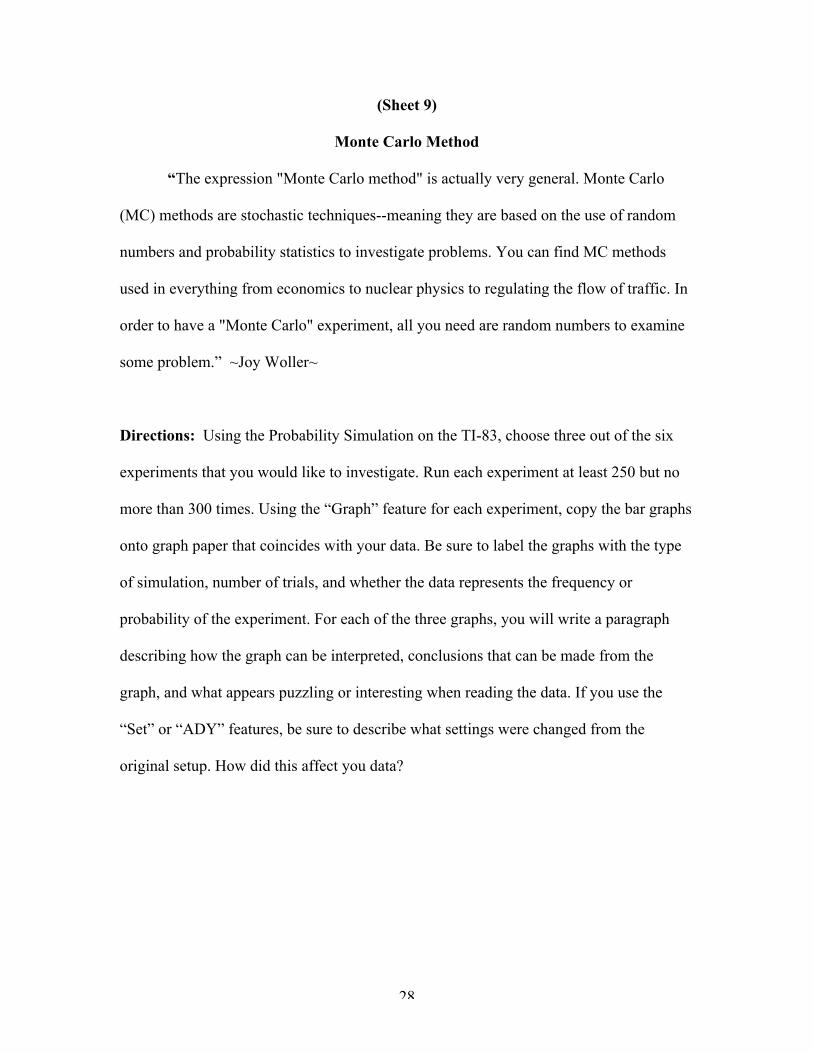
Monte Carlo Method
“The expression "Monte Carlo method" is actually very general. Monte Carlo
(MC) methods are stochastic techniques--meaning they are based on the use of random
numbers and probability statistics to investigate problems. You can find MC methods
used in everything from economics to nuclear physics to regulating the flow of traffic. In
order to have a "Monte Carlo" experiment, all you need are random numbers to examine
some problem.” ~Joy Woller~
Directions: Using the Probability Simulation on the TI-83, choose three out of the six
experiments that you would like to investigate. Run each experiment at least 250 but no
more than 300 times. Using the “Graph” feature for each experiment, copy the bar graphs
onto graph paper that coincides with your data. Be sure to label the graphs with the type
of simulation, number of trials, and whether the data represents the frequency or
probability of the experiment. For each of the three graphs, you will write a paragraph
describing how the graph can be interpreted, conclusions that can be made from the
graph, and what appears puzzling or interesting when reading the data. If you use the
“Set” or “ADY” features, be sure to describe what settings were changed from the
original setup. How did this affect you data?

29
LESSON FIVE
It’s a-MAZE-ing Probability
Summary:
Grade Level: 8
Duration: 50 minutes
Class Size: 24-28
Student Ability: Heterogeneous
Materials: Maze for each student (See Sheet 10), Overhead Unit, “The Lady or the
Tiger” by Frank R Stockton for each student (See Sheet 11), Maze activity (See Sheet 12)
for each student, Graph paper, rulers.
Objectives:
• Students will construct representation of all outcomes by drawing a rectangle on
graph paper and dividing the shape accordingly for each possible outcome.
• Students will calculate probability using the visual representation.
• Students will construct their own maze and find probabilities associated with that
maze.
NCTM Standards: Number and Operations, Data Analysis and Probability, Problem
Solving, Communication, Connections, Representation
NYS Key Ideas: 1B, 2B, 3G, 4F, 4G, 6B
Anticipatory Set: Each student will complete the maze (See Sheet 10) distributed by the
teacher. The key idea of making choices within the maze will be discussed.
Procedure/Developmental Activity:
• Students will read the “Lady and the Tiger” (See Sheet 11) followed by a class
discussion.
• Each student will receive maze activity (See Sheet 12).
• The teacher will demonstrate how to calculate the probability by drawing a
rectangle on a graph on the overhead.
• Each possible choice divides a portion of the rectangle equally.
• Labeling outcomes of given choices is the key to calculating the probability.
• Probability found by dividing total area of event by total area of rectangle
(geometric probability).

30
• Students will copy procedure into notes.
• Graph paper and rulers are to be distributed to each student
• Students will calculate the probabilities on graph paper of similar mazes using the
visual rectangular representation method.
Assessment: Students will be asked to place their results on the board for evaluation.
Closure: The teacher will collect all materials from the students. The teacher will suggest
several known locations which include multiple ways of getting there. Students will make
suggestions how to apply this method of calculating probability within their school.
Homework: Students will be asked to create a similar maze on graph paper and to
calculate the probabilities on a separate sheet of paper. During the next lesson, students
will exchange homework assignments and calculate the probabilities.

31
(Sheet 10)
Find your way through the maze.
**Start**
32
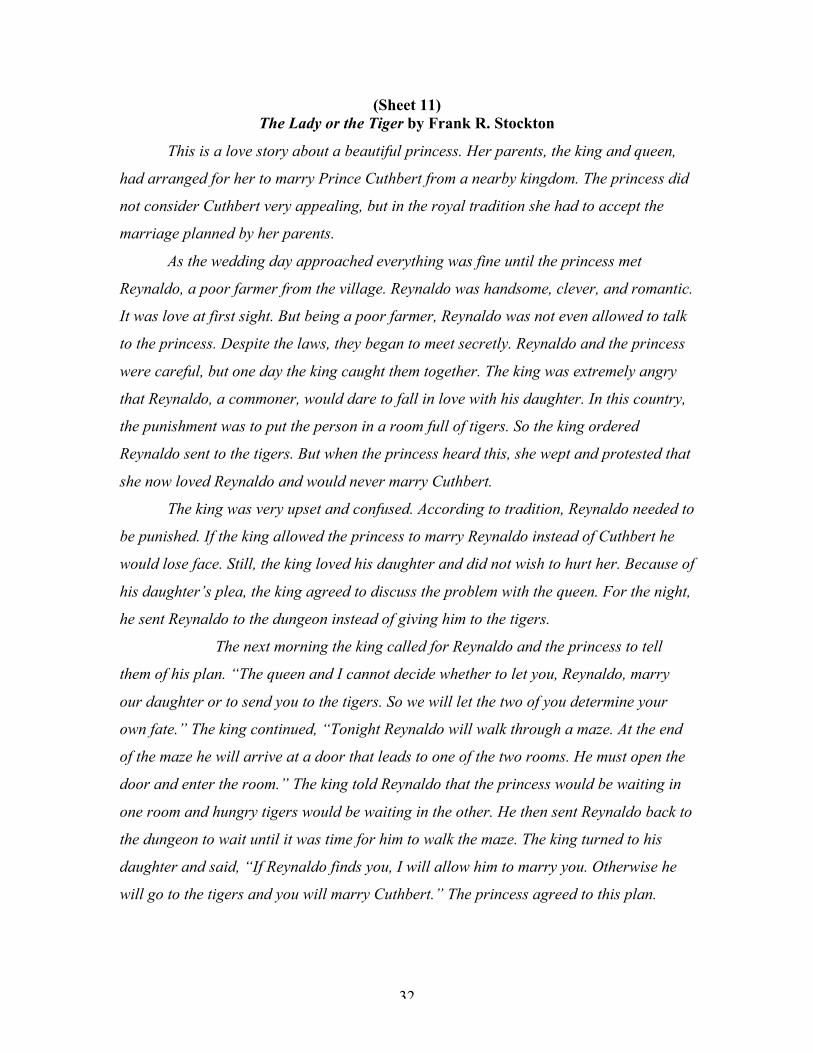
(Sheet 11)The Lady or the Tiger by Frank R. Stockton
This is a love story about a beautiful princess. Her parents, the king and queen,
had arranged for her to marry Prince Cuthbert from a nearby kingdom. The princess did
not consider Cuthbert very appealing, but in the royal tradition she had to accept the
marriage planned by her parents.
As the wedding day approached everything was fine until the princess met
Reynaldo, a poor farmer from the village. Reynaldo was handsome, clever, and romantic.
It was love at first sight. But being a poor farmer, Reynaldo was not even allowed to talk
to the princess. Despite the laws, they began to meet secretly. Reynaldo and the princess
were careful, but one day the king caught them together. The king was extremely angry
that Reynaldo, a commoner, would dare to fall in love with his daughter. In this country,
the punishment was to put the person in a room full of tigers. So the king ordered
Reynaldo sent to the tigers. But when the princess heard this, she wept and protested that
she now loved Reynaldo and would never marry Cuthbert.
The king was very upset and confused. According to tradition, Reynaldo needed to
be punished. If the king allowed the princess to marry Reynaldo instead of Cuthbert he
would lose face. Still, the king loved his daughter and did not wish to hurt her. Because of
his daughter’s plea, the king agreed to discuss the problem with the queen. For the night,
he sent Reynaldo to the dungeon instead of giving him to the tigers.
The next morning the king called for Reynaldo and the princess to tell
them of his plan. “The queen and I cannot decide whether to let you, Reynaldo, marry
our daughter or to send you to the tigers. So we will let the two of you determine your
own fate.” The king continued, “Tonight Reynaldo will walk through a maze. At the end
of the maze he will arrive at a door that leads to one of the two rooms. He must open the
door and enter the room.” The king told Reynaldo that the princess would be waiting in
one room and hungry tigers would be waiting in the other. He then sent Reynaldo back to
the dungeon to wait until it was time for him to walk the maze. The king turned to his
daughter and said, “If Reynaldo finds you, I will allow him to marry you. Otherwise he
will go to the tigers and you will marry Cuthbert.” The princess agreed to this plan.

33
(Sheet 12)
The following is a map of the maze Reynaldo must navigate. The princess
has chosen to wait in the center room, indicated by the P. The lions are placed in
the other room indicated by the L. Each dark line represents a door for Reynaldo
to pass through. The first door that Reynaldo chooses is the door he must enter
through. The doors lock behind him once Reynaldo passes through the doorway,
preventing Reynaldo from a retreat to a different path. Having no map of his own,
Reynaldo can only guess which paths to take. Calculate the probability of
Reynaldo being reunited with the princess.
(Sample student work)

34
LESSON FIVE ANSWER KEY
Sheet 12
(Sample student work)
P (Princess) = (1/2) (1/3) + (1/3) + (1/3) (1/3) = 11/18 or .611
P (Lions) = (1/2) (1/3) + (2/3) (1/3) = 7/18 or .389

35
Kyle Kucsmas I2T2 Project 11/30/04