precision topography of a reversing sand dune at bruneau
TRANSCRIPT
Icarus 230 (2014) 29–37
Contents lists available at ScienceDirect
Icarus
journal homepage: www.elsevier .com/locate / icarus
Precision topography of a reversing sand dune at Bruneau Dunes, Idaho,as an analog for Transverse Aeolian Ridges on Mars
0019-1035/$ - see front matter Published by Elsevier Inc.http://dx.doi.org/10.1016/j.icarus.2013.08.004
⇑ Corresponding author. Fax: +1 202 786 2566.E-mail addresses: [email protected] (J.R. Zimbelman), [email protected]
(S.P. Scheidt).
James R. Zimbelman ⇑, Stephen P. ScheidtCenter for Earth and Planetary Studies, National Air and Space Museum, MRC 315, Smithsonian Institution, Washington, DC 20013-7012, USA
a r t i c l e i n f o a b s t r a c t
Article history:Available online 13 August 2013
Keywords:Mars, SurfaceMarsEarthGeological processesData reduction techniques
Ten high precision topographic profiles across a reversing dune were created from a differential globalposition system (DGPS). The shapes of the profiles reveal a progression from immature to transitionalto mature characteristics moving up the dune. When scaled by the basal width along each profile, shapecharacteristics can be compared for profiles whose horizontal scales differ by orders of magnitude. Thecomparison of width-scaled Bruneau Dunes profiles to similarly scaled profiles of Transverse AeolianRidges (TARs) on Mars indicates that many TARs are likely similar to transitional or mature reversingsand dunes.
Published by Elsevier Inc.
1. Introduction
A reversing sand dune is defined to be ‘‘a dune that tends to de-velop unusual height but migrates only a limited distance becauseseasonal shifts in direction of the dominant wind cause it to movealternately in nearly opposite directions’’ (Jackson, 1997, p. 545).The seasonal wind pattern is therefore bidirectional for reversingdunes, where the two dominant winds from nearly opposite direc-tions are balanced with respect to strength and duration (McKee,1979). The Bruneau Dunes in central Idaho are an excellent placeto conduct a study of reversing sand dunes because here the duneshave grown to impressive heights in a wind regime that supportsthe development of reversing dunes rather than horizontallymigrating dunes. The dunes are protected from off-road vehiculartraffic because the main dune complex is located within theboundaries of the Bruneau Dunes State Park (Zimbelman and Wil-liams, 2007). The Bruneau Dunes are a 1.5-h drive SE from Boise,and they are only 29 km (18 mi) south of the city of MountainHome.
Recent data from Mars has stimulated interest in the collectionof detailed topographic information about reversing dunes. TheHigh Resolution Imaging Science Experiment (HiRISE) camera onthe Mars Reconnaissance Orbiter spacecraft has returned over20,000 images that reveal the martian surface in exquisite detail,with many of the images achieving a ground spatial resolution of25 cm per pixel (McEwen et al., 2007). Early HiRISE images in-cluded some dramatic examples of aeolian bedforms that have
been given the non-genetic name ‘Transverse Aeolian Ridges’(TARs), a general term proposed for linear to curvilinear aeolianfeatures that could be the result of either dune or ripple formationprocesses (Bourke et al., 2003). Profiles derived from photoclinom-etry of TARs in HiRISE images showed that TARs larger than 1 m inheight compared favorably to profiles of reversing dunes at CoralPink Sand Dunes State Park in southern Utah, while TARs less than0.5 m in height were very distinct from the reversing dune profilesbut consistent with measured profiles of megaripples (Zimbelman,2010).
In order to provide a test of the reversing dune hypothesis forlarge TARs on Mars, we collected a series of precision topographicprofiles across one of the large reversing dunes at the BruneauDunes, as first reported at the Third Planetary Dunes workshop(Zimbelman and Scheidt, 2012). The resulting profiles providevaluable new information about probable stages of formationencountered during the growth of reversing dunes, as well as apossible tool for evaluating the relative state of evolution of revers-ing dunes. The profile series provides a template for evaluating thepossible stages of evolution of individual TARs on Mars, under theworking hypothesis that large TARs have profile shapes compara-ble to that of reversing dunes.
2. Background
The Bruneau Dunes State Park was formed in order to preserve avery unique natural area, as well as provide protection for thewildlife that make use of two lakes on the northwest side of thedunes (inset, Fig. 1). Established in 1970, the park covers19.4 km2 (4800 acres), including the tallest single-structured (i.e.,not braced against other dunes or mountains) sand dune in North

Fig. 1. Google Earth image mosaic of the study location at the southern end of theBruneau Dunes, Idaho (11/1/06). North is to the top. Inset shows all of the largestdunes, and the lakes at their northern end.
30 J.R. Zimbelman, S.P. Scheidt / Icarus 230 (2014) 29–37
America, which has 143 m (470 ft) of relief from the summit of thetallest dune to the lake level (for information about the park, seeparksandrecreation.idaho.gov/parks/bruneau-dunes or www.ida-hoparks.org/state-parks/bruneau-dunes-state-park). The largestdunes are interpreted to be reversing dunes (Murphy, 1973), butfeatures on the sides of the largest dunes suggest possible formflow interactions that can move sand in directions at large anglesrelative to the regional wind direction (Howard et al., 1978). Thereare some visual similarities between features observed on the Bru-neau Dunes and patterns present on the arms of star dunes (e.g.,Lancaster, 1989), where sand transport occurs oblique to crest ori-entation. The sheer size of the main Bruneau Dunes may inducecomplex local wind patterns on the sides of dunes.
The Bruneau Dunes are located approximately in the center ofan old cut-off meander of the Snake River, now called Eagle Cove,that was carved into lacustrine sediments of the Glenns Ferryand Bruneau Formations, which are from Upper Pliocene to MiddlePleistocene (respectively) in age (Murphy, 1973). The close prox-imity of Eagle Cove to the present day channel of the Snake Rivercontributes significantly to a constraint for the probable initiationof the sand accumulation represented by the current large sanddunes.
The Snake River is the main drainage pathway for water to exitthe southern portions of Idaho. This large river has carved a sub-stantial canyon into the basalt lava flows that comprise the surfacematerials of the Snake River Plains, the largest physiographic prov-ince within southern Idaho. There is abundant geologic evidencethat the present day Snake River is but a mere shadow of the majorflood that passed through this river system during the Pleistocene(Malde, 1968). Glacial Lake Bonneville attained a level that over-topped its rim at Red Rock Pass in southeastern Idaho, leading torapid downcutting at the site of the breach and the rapid releaseof 4700 km3 of water onto the Snake River Plains; erosional fea-tures and flood deposits along the Snake River Canyon indicate thatthe peak discharge during this catastrophic flood was most likely�935,000 m3/s, so that a minimum duration of about 8 weekswas needed to move the total volume of released water throughthe canyon at the peak discharge rate (Jarrett and Malde, 1987;O’Connor, 1993). The massive Bonneville Flood occurred about15,000 years ago (Jarrett and Malde, 1987), and it is presumed thatthe flood would have easily removed any aeolian sand depositsfrom Eagle Cove that pre-dated the flood (Murphy, 1973). The sandat the Bruneau Dunes consists (by volume) of 62% quartz, 26% feld-spar, and 12% basaltic (iron-rich) particles, indicating a closer affin-ity to the nearby Bruneau and Glenns Ferry Formation sedimentsthan to the basalts and other rocks exposed upstream of Eagle Cove
(Murphy, 1973). Aeolian or fluvial activity would not have neededto transport the sand very far to get it into Eagle Cove. However,once sand got into Eagle Cove, the wind pattern is such that itlikely could not have easily exited later.
Reversing sand dunes form under a bidirectional wind regime,where two dominant winds come from directions that are almostdirectly opposite of each other (McKee, 1979). The Remote Auto-mated Weather Station (RAWS) system, operated by the U.S. gov-ernment, has >1900 individual instrumented weather stations (asof 2002) spread throughout the conterminous United States, Alas-ka, and Hawaii (Zachariassen et al., 2003, p. 2). The MountainHome Air Force Base (MHAFB) RAWS station is located about21 km NW of the Bruneau Dunes. Using a web-based access page,we obtained MHAFB RAWS data from 2010, which clearly demon-strates a strong bimodal annual wind regime for the region,although minor winds can blow from a variety of directions duringspring and fall (Fig. 2). It is justifiable to ask whether wind recordsobtained 21 km away from the study site reflect the wind condi-tions experienced at the dunes. We attempted to address this issueby installing an inexpensive weather-proof timelapse digital cam-era (known commercially as a ‘GardenWatchCam’) to obtainhourly images of the study site at the Bruneau Dunes. Use of time-lapse digital cameras has proved to be a cost-effective method formonitoring sand mobility in previous aeolian studies (Lorenz,2011; Lorenz and Valdez, 2011). During more than 2 years of Gar-denWatchCam monitoring of the study site (from April 27, 2011,through August 31, 2013), images of bidirectional intense saltationoccurring at the south end of the dunes (Figs. 3 and 4) correlatevery well with strong wind events (taken here to be >6 m/s averagewinds sustained for >3 h) recorded at the MHAFB RAWS site, pro-viding on-site validation that the bimodal wind pattern that dom-inates the RAWS data (Fig. 2) is consistent with the major sand-driving events observed to take place at the dunes.
In order to obtain precise topographic profiles of the sanddunes, we utilized a Differential Global Positioning System (DGPS).The equipment used in this project was a Trimble R8 Total Station,a carrier-phase DGPS system consisting of a stationary base recei-ver and a roving receiver to collect the individual survey points;this system provides horizontal accuracy of 1–2 cm and verticalaccuracy of 2–4 cm, relative to the base station location (Zimbel-man and Johnston, 2001). When combined with field notes andphotographs tied to survey point locations, DGPS topographic datahave proved to be very useful in addressing diverse geomorphictopics (e.g., Zimbelman and Johnston, 2001; Irwin and Zimbelman,2012; Zimbelman et al., 2012). Precise topographic profiles acrossaeolian depositional features at diverse scales has proved to bevery helpful in distinguishing between alternative formationmechanisms that have acted to generate the features (Zimbelmanet al., 2012).
Topographic information for TARs on Mars have recently beenderived from HiRISE image data (Zimbelman, 2010; Shockey andZimbelman, 2013), generating profiles that can be compared tothe measured profiles of aeolian features on Earth (Zimbelmanet al., 2012). The study project at the Bruneau Dunes was carriedout specifically in order to obtain a well constrained topographicdata set for a reversing sand dune, to serve as a guide for evaluatingthe hypothesis that TARs > 1 m in height are most similar toreversing dunes (Zimbelman, 2010).
3. Methodology
The DGPS surveys were carried out across the southernmostreversing dune at the Bruneau Dunes (Fig. 1). This location waschosen for the study because this dune progresses steadily froma low sand ridge into a large reversing dune (going north),
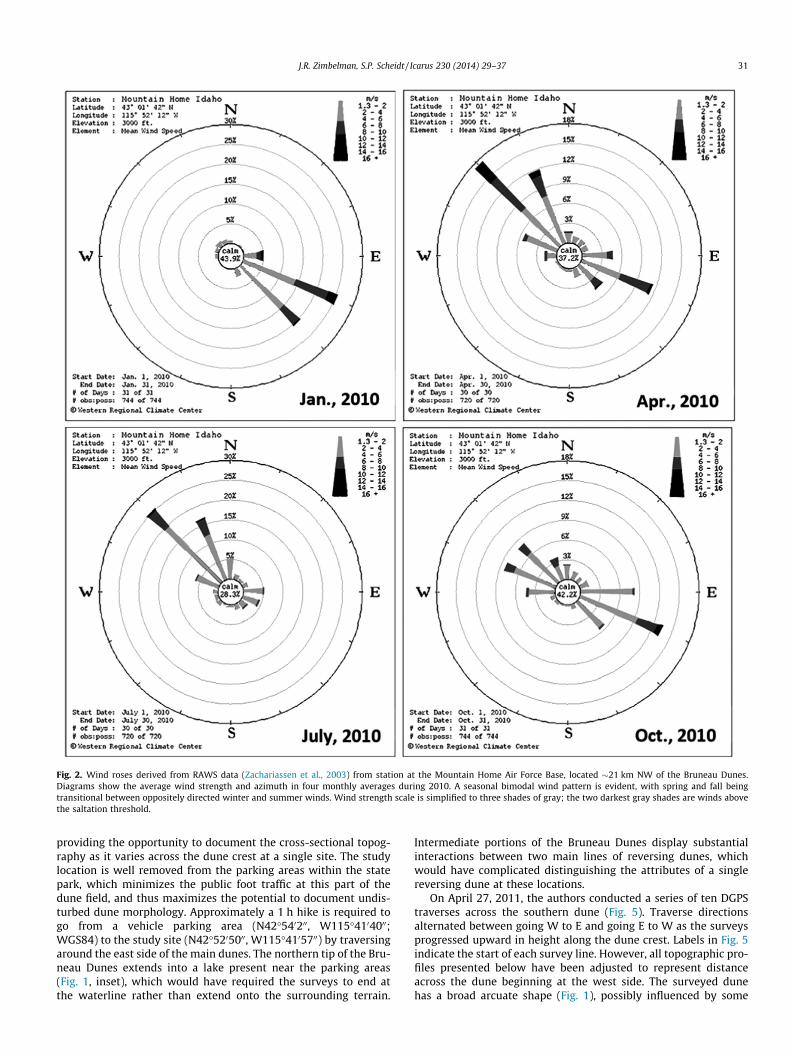
Fig. 2. Wind roses derived from RAWS data (Zachariassen et al., 2003) from station at the Mountain Home Air Force Base, located �21 km NW of the Bruneau Dunes.Diagrams show the average wind strength and azimuth in four monthly averages during 2010. A seasonal bimodal wind pattern is evident, with spring and fall beingtransitional between oppositely directed winter and summer winds. Wind strength scale is simplified to three shades of gray; the two darkest gray shades are winds abovethe saltation threshold.
J.R. Zimbelman, S.P. Scheidt / Icarus 230 (2014) 29–37 31
providing the opportunity to document the cross-sectional topog-raphy as it varies across the dune crest at a single site. The studylocation is well removed from the parking areas within the statepark, which minimizes the public foot traffic at this part of thedune field, and thus maximizes the potential to document undis-turbed dune morphology. Approximately a 1 h hike is required togo from a vehicle parking area (N42�540200, W115�4104000;WGS84) to the study site (N42�5205000, W115�4105700) by traversingaround the east side of the main dunes. The northern tip of the Bru-neau Dunes extends into a lake present near the parking areas(Fig. 1, inset), which would have required the surveys to end atthe waterline rather than extend onto the surrounding terrain.
Intermediate portions of the Bruneau Dunes display substantialinteractions between two main lines of reversing dunes, whichwould have complicated distinguishing the attributes of a singlereversing dune at these locations.
On April 27, 2011, the authors conducted a series of ten DGPStraverses across the southern dune (Fig. 5). Traverse directionsalternated between going W to E and going E to W as the surveysprogressed upward in height along the dune crest. Labels in Fig. 5indicate the start of each survey line. However, all topographic pro-files presented below have been adjusted to represent distanceacross the dune beginning at the west side. The surveyed dunehas a broad arcuate shape (Fig. 1), possibly influenced by some
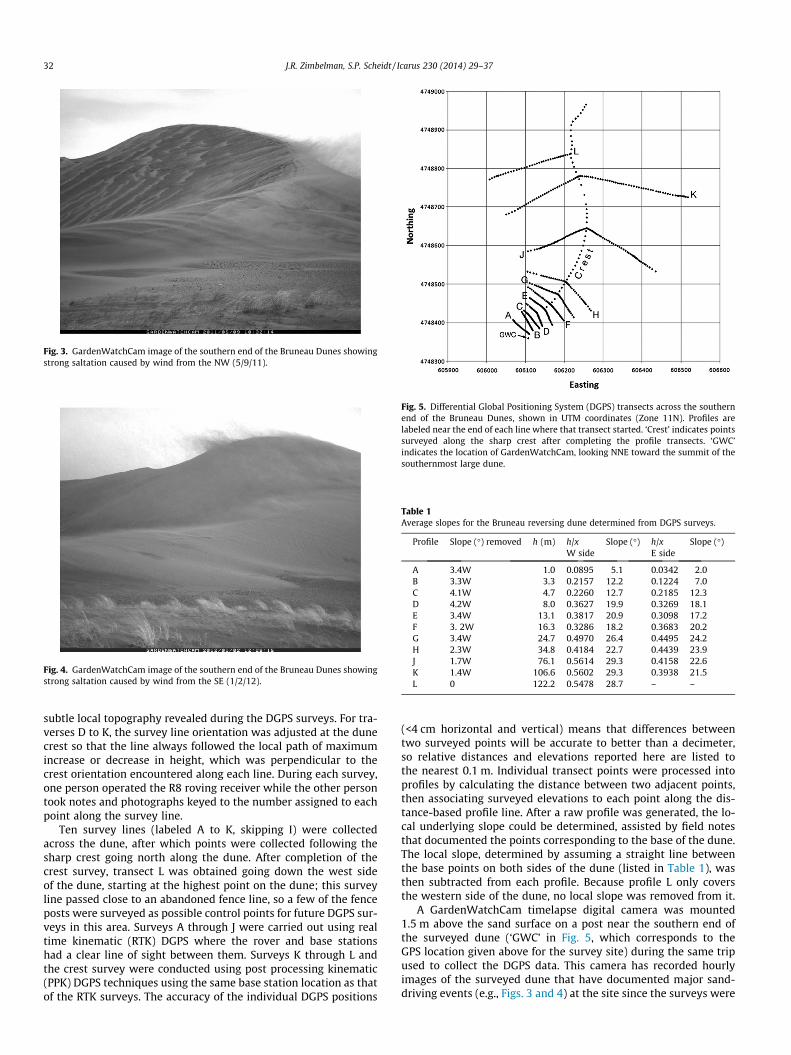
Fig. 3. GardenWatchCam image of the southern end of the Bruneau Dunes showingstrong saltation caused by wind from the NW (5/9/11).
Fig. 4. GardenWatchCam image of the southern end of the Bruneau Dunes showingstrong saltation caused by wind from the SE (1/2/12).
Fig. 5. Differential Global Positioning System (DGPS) transects across the southernend of the Bruneau Dunes, shown in UTM coordinates (Zone 11N). Profiles arelabeled near the end of each line where that transect started. ‘Crest’ indicates pointssurveyed along the sharp crest after completing the profile transects. ‘GWC’indicates the location of GardenWatchCam, looking NNE toward the summit of thesouthernmost large dune.
Table 1Average slopes for the Bruneau reversing dune determined from DGPS surveys.
Profile Slope (�) removed h (m) h/x Slope (�) h/x Slope (�)W side E side
A 3.4W 1.0 0.0895 5.1 0.0342 2.0B 3.3W 3.3 0.2157 12.2 0.1224 7.0C 4.1W 4.7 0.2260 12.7 0.2185 12.3D 4.2W 8.0 0.3627 19.9 0.3269 18.1E 3.4W 13.1 0.3817 20.9 0.3098 17.2F 3. 2W 16.3 0.3286 18.2 0.3683 20.2G 3.4W 24.7 0.4970 26.4 0.4495 24.2H 2.3W 34.8 0.4184 22.7 0.4439 23.9J 1.7W 76.1 0.5614 29.3 0.4158 22.6K 1.4W 106.6 0.5602 29.3 0.3938 21.5L 0 122.2 0.5478 28.7 – –
32 J.R. Zimbelman, S.P. Scheidt / Icarus 230 (2014) 29–37
subtle local topography revealed during the DGPS surveys. For tra-verses D to K, the survey line orientation was adjusted at the dunecrest so that the line always followed the local path of maximumincrease or decrease in height, which was perpendicular to thecrest orientation encountered along each line. During each survey,one person operated the R8 roving receiver while the other persontook notes and photographs keyed to the number assigned to eachpoint along the survey line.
Ten survey lines (labeled A to K, skipping I) were collectedacross the dune, after which points were collected following thesharp crest going north along the dune. After completion of thecrest survey, transect L was obtained going down the west sideof the dune, starting at the highest point on the dune; this surveyline passed close to an abandoned fence line, so a few of the fenceposts were surveyed as possible control points for future DGPS sur-veys in this area. Surveys A through J were carried out using realtime kinematic (RTK) DGPS where the rover and base stationshad a clear line of sight between them. Surveys K through L andthe crest survey were conducted using post processing kinematic(PPK) DGPS techniques using the same base station location as thatof the RTK surveys. The accuracy of the individual DGPS positions
(<4 cm horizontal and vertical) means that differences betweentwo surveyed points will be accurate to better than a decimeter,so relative distances and elevations reported here are listed tothe nearest 0.1 m. Individual transect points were processed intoprofiles by calculating the distance between two adjacent points,then associating surveyed elevations to each point along the dis-tance-based profile line. After a raw profile was generated, the lo-cal underlying slope could be determined, assisted by field notesthat documented the points corresponding to the base of the dune.The local slope, determined by assuming a straight line betweenthe base points on both sides of the dune (listed in Table 1), wasthen subtracted from each profile. Because profile L only coversthe western side of the dune, no local slope was removed from it.
A GardenWatchCam timelapse digital camera was mounted1.5 m above the sand surface on a post near the southern end ofthe surveyed dune (‘GWC’ in Fig. 5, which corresponds to theGPS location given above for the survey site) during the same tripused to collect the DGPS data. This camera has recorded hourlyimages of the surveyed dune that have documented major sand-driving events (e.g., Figs. 3 and 4) at the site since the surveys were
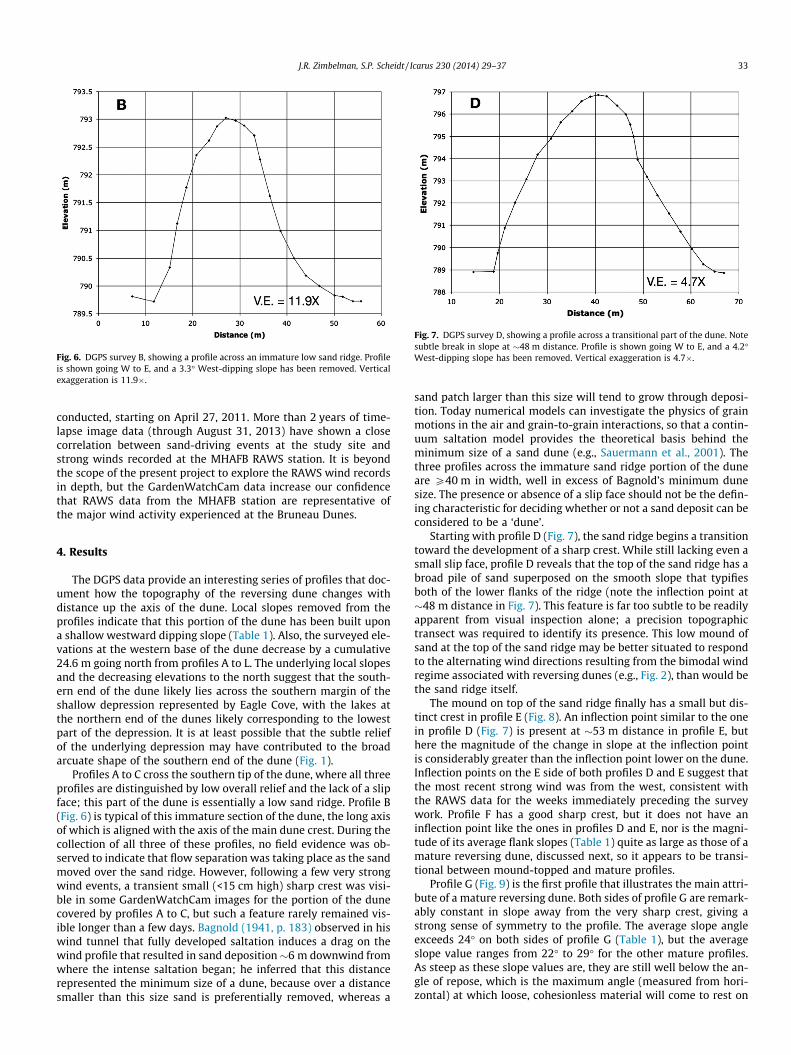
Fig. 6. DGPS survey B, showing a profile across an immature low sand ridge. Profileis shown going W to E, and a 3.3� West-dipping slope has been removed. Verticalexaggeration is 11.9�.
Fig. 7. DGPS survey D, showing a profile across a transitional part of the dune. Notesubtle break in slope at �48 m distance. Profile is shown going W to E, and a 4.2�West-dipping slope has been removed. Vertical exaggeration is 4.7�.
J.R. Zimbelman, S.P. Scheidt / Icarus 230 (2014) 29–37 33
conducted, starting on April 27, 2011. More than 2 years of time-lapse image data (through August 31, 2013) have shown a closecorrelation between sand-driving events at the study site andstrong winds recorded at the MHAFB RAWS station. It is beyondthe scope of the present project to explore the RAWS wind recordsin depth, but the GardenWatchCam data increase our confidencethat RAWS data from the MHAFB station are representative ofthe major wind activity experienced at the Bruneau Dunes.
4. Results
The DGPS data provide an interesting series of profiles that doc-ument how the topography of the reversing dune changes withdistance up the axis of the dune. Local slopes removed from theprofiles indicate that this portion of the dune has been built upona shallow westward dipping slope (Table 1). Also, the surveyed ele-vations at the western base of the dune decrease by a cumulative24.6 m going north from profiles A to L. The underlying local slopesand the decreasing elevations to the north suggest that the south-ern end of the dune likely lies across the southern margin of theshallow depression represented by Eagle Cove, with the lakes atthe northern end of the dunes likely corresponding to the lowestpart of the depression. It is at least possible that the subtle reliefof the underlying depression may have contributed to the broadarcuate shape of the southern end of the dune (Fig. 1).
Profiles A to C cross the southern tip of the dune, where all threeprofiles are distinguished by low overall relief and the lack of a slipface; this part of the dune is essentially a low sand ridge. Profile B(Fig. 6) is typical of this immature section of the dune, the long axisof which is aligned with the axis of the main dune crest. During thecollection of all three of these profiles, no field evidence was ob-served to indicate that flow separation was taking place as the sandmoved over the sand ridge. However, following a few very strongwind events, a transient small (<15 cm high) sharp crest was visi-ble in some GardenWatchCam images for the portion of the dunecovered by profiles A to C, but such a feature rarely remained vis-ible longer than a few days. Bagnold (1941, p. 183) observed in hiswind tunnel that fully developed saltation induces a drag on thewind profile that resulted in sand deposition�6 m downwind fromwhere the intense saltation began; he inferred that this distancerepresented the minimum size of a dune, because over a distancesmaller than this size sand is preferentially removed, whereas a
sand patch larger than this size will tend to grow through deposi-tion. Today numerical models can investigate the physics of grainmotions in the air and grain-to-grain interactions, so that a contin-uum saltation model provides the theoretical basis behind theminimum size of a sand dune (e.g., Sauermann et al., 2001). Thethree profiles across the immature sand ridge portion of the duneare P40 m in width, well in excess of Bagnold’s minimum dunesize. The presence or absence of a slip face should not be the defin-ing characteristic for deciding whether or not a sand deposit can beconsidered to be a ‘dune’.
Starting with profile D (Fig. 7), the sand ridge begins a transitiontoward the development of a sharp crest. While still lacking even asmall slip face, profile D reveals that the top of the sand ridge has abroad pile of sand superposed on the smooth slope that typifiesboth of the lower flanks of the ridge (note the inflection point at�48 m distance in Fig. 7). This feature is far too subtle to be readilyapparent from visual inspection alone; a precision topographictransect was required to identify its presence. This low mound ofsand at the top of the sand ridge may be better situated to respondto the alternating wind directions resulting from the bimodal windregime associated with reversing dunes (e.g., Fig. 2), than would bethe sand ridge itself.
The mound on top of the sand ridge finally has a small but dis-tinct crest in profile E (Fig. 8). An inflection point similar to the onein profile D (Fig. 7) is present at �53 m distance in profile E, buthere the magnitude of the change in slope at the inflection pointis considerably greater than the inflection point lower on the dune.Inflection points on the E side of both profiles D and E suggest thatthe most recent strong wind was from the west, consistent withthe RAWS data for the weeks immediately preceding the surveywork. Profile F has a good sharp crest, but it does not have aninflection point like the ones in profiles D and E, nor is the magni-tude of its average flank slopes (Table 1) quite as large as those of amature reversing dune, discussed next, so it appears to be transi-tional between mound-topped and mature profiles.
Profile G (Fig. 9) is the first profile that illustrates the main attri-bute of a mature reversing dune. Both sides of profile G are remark-ably constant in slope away from the very sharp crest, giving astrong sense of symmetry to the profile. The average slope angleexceeds 24� on both sides of profile G (Table 1), but the averageslope value ranges from 22� to 29� for the other mature profiles.As steep as these slope values are, they are still well below the an-gle of repose, which is the maximum angle (measured from hori-zontal) at which loose, cohesionless material will come to rest on

Fig. 8. DGPS survey E, showing a profile across a transitional part of the dune, witha mound present on top of a sand ridge base. Profile is shown going W to E, and a3.4� West-dipping slope has been removed. Vertical exaggeration is 4.9�.
Fig. 9. DGPS survey G, showing a profile across a mature symmetric part of thedune, with 24.7 m of total relief. Profile is shown going W to E, and a 3.4� West-dipping slope has been removed. Vertical exaggeration 3.3�.
Fig. 10. DGPS survey K, showing a profile across a mature symmetric part of thedune, with 106.6 m of total relief. Profile is shown going W to E, and a 1.4� West-dipping slope has been removed. Vertical exaggeration is 3.2�.
Fig. 11. All DGPS profiles at the Bruneau reversing dune, shown at the same scale.Successive profile starting points are offset 5 m horizontally and 10 m vertically, forclarity. Vertical exaggeration is 1.8�.
34 J.R. Zimbelman, S.P. Scheidt / Icarus 230 (2014) 29–37
a pile of similar material (Jackson, 1997, p. 25). The angle of reposereported in the literature for dry sand on dune slip faces varies lit-tle from 33 ± 1� (Cooke and Warren, 1973, p. 276). Hence, theslopes of reversing dunes are not really very close to the slopefound on a slip face, which is not surprising since sand will be mov-ing back and forth across the dune crest, and thus cannot be nearthe angle of repose on both flanks at the same time. The sense ofsymmetry continues through profile K (Fig. 10) even as the totalheight and total width of the dune has steadily increased by morethan a factor of four from profile G to K (Table 1). While not a com-plete profile, transect L documents that this reversing dune attainsa maximum height of 122.2 m (Table 1).
It is difficult to appreciate the large change in scale that takesplace across the surveyed profiles. When shown at the same hori-zontal and vertical scales (Fig. 11), the very low relief of the imma-ture sand ridge profiles makes them almost indiscernible, althoughthe large size of the mature profiles is readily apparent. Previouswork has demonstrated that scaling both the horizontal and verti-cal dimensions by the feature width (defined as the distance
between the basal breaks in slope on both sides of the feature) isan effective way to preserve profile detail while comparing fea-tures that may differ by more than three orders of magnitude inabsolute scale (Zimbelman et al., 2012). Fig. 12 shows the ten com-plete profiles for the Bruneau reversing dune when they have beenscaled by the feature width (listed for each profile inside parenthe-ses in the symbol key). Symbols and line styles help to distinguishbetween the three classes of profiles discussed above: immaturesand ridge profiles in solid symbols and solid lines, transitionalprofiles in large dashed lines, and mature profiles in open symbolsand small dashed lines. Along with preserving shape detail for eachprofile, this representation shows the steady increase in the scaledheight for each profile; maximum height divided by feature widthis therefore a key parameter for determining where along the‘maturity’ continuum any single profile may lie, aided by detailsof the profile shape. It is particularly interesting to see how similarthe four mature profiles appear, particularly on their west (left)side, which is consistent with the west being the windward sidefor the most recent strong winds. There is considerable variationin where the dune high point occurs along the scaled distance axis,
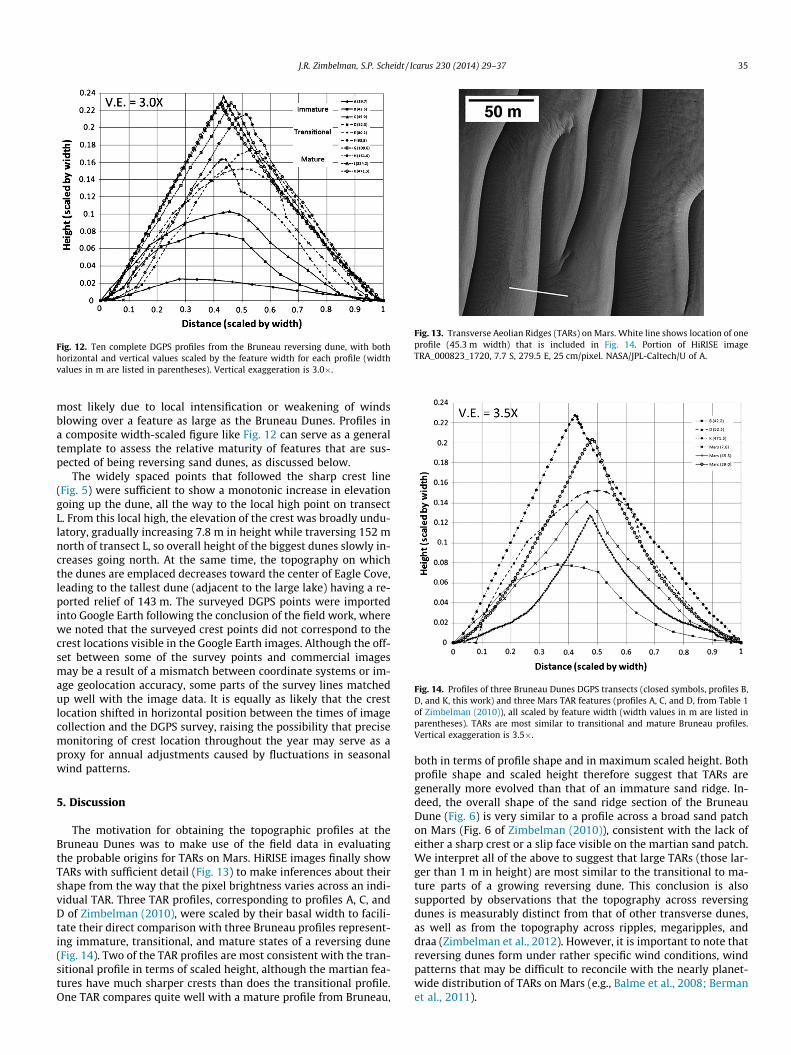
Fig. 12. Ten complete DGPS profiles from the Bruneau reversing dune, with bothhorizontal and vertical values scaled by the feature width for each profile (widthvalues in m are listed in parentheses). Vertical exaggeration is 3.0�.
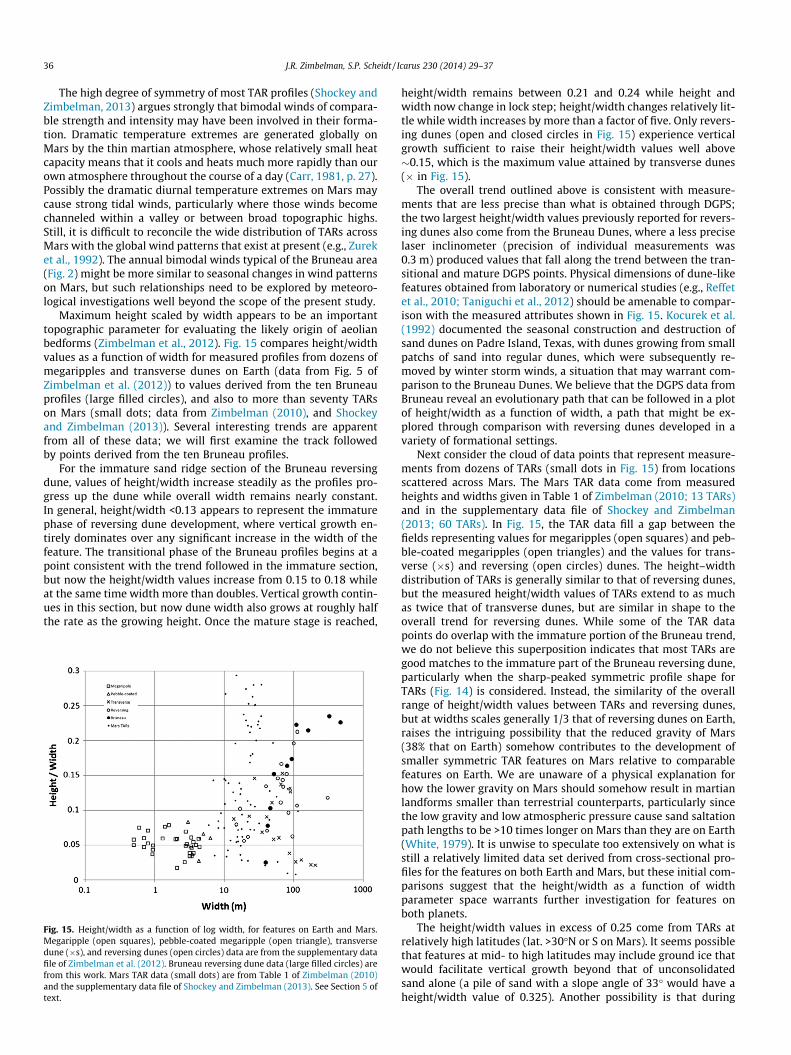
Fig. 13. Transverse Aeolian Ridges (TARs) on Mars. White line shows location of oneprofile (45.3 m width) that is included in Fig. 14. Portion of HiRISE imageTRA_000823_1720, 7.7 S, 279.5 E, 25 cm/pixel. NASA/JPL-Caltech/U of A.
Fig. 14. Profiles of three Bruneau Dunes DGPS transects (closed symbols, profiles B,D, and K, this work) and three Mars TAR features (profiles A, C, and D, from Table 1of Zimbelman (2010)), all scaled by feature width (width values in m are listed inparentheses). TARs are most similar to transitional and mature Bruneau profiles.Vertical exaggeration is 3.5�.
J.R. Zimbelman, S.P. Scheidt / Icarus 230 (2014) 29–37 35
most likely due to local intensification or weakening of windsblowing over a feature as large as the Bruneau Dunes. Profiles ina composite width-scaled figure like Fig. 12 can serve as a generaltemplate to assess the relative maturity of features that are sus-pected of being reversing sand dunes, as discussed below.
The widely spaced points that followed the sharp crest line(Fig. 5) were sufficient to show a monotonic increase in elevationgoing up the dune, all the way to the local high point on transectL. From this local high, the elevation of the crest was broadly undu-latory, gradually increasing 7.8 m in height while traversing 152 mnorth of transect L, so overall height of the biggest dunes slowly in-creases going north. At the same time, the topography on whichthe dunes are emplaced decreases toward the center of Eagle Cove,leading to the tallest dune (adjacent to the large lake) having a re-ported relief of 143 m. The surveyed DGPS points were importedinto Google Earth following the conclusion of the field work, wherewe noted that the surveyed crest points did not correspond to thecrest locations visible in the Google Earth images. Although the off-set between some of the survey points and commercial imagesmay be a result of a mismatch between coordinate systems or im-age geolocation accuracy, some parts of the survey lines matchedup well with the image data. It is equally as likely that the crestlocation shifted in horizontal position between the times of imagecollection and the DGPS survey, raising the possibility that precisemonitoring of crest location throughout the year may serve as aproxy for annual adjustments caused by fluctuations in seasonalwind patterns.
5. Discussion
The motivation for obtaining the topographic profiles at theBruneau Dunes was to make use of the field data in evaluatingthe probable origins for TARs on Mars. HiRISE images finally showTARs with sufficient detail (Fig. 13) to make inferences about theirshape from the way that the pixel brightness varies across an indi-vidual TAR. Three TAR profiles, corresponding to profiles A, C, andD of Zimbelman (2010), were scaled by their basal width to facili-tate their direct comparison with three Bruneau profiles represent-ing immature, transitional, and mature states of a reversing dune(Fig. 14). Two of the TAR profiles are most consistent with the tran-sitional profile in terms of scaled height, although the martian fea-tures have much sharper crests than does the transitional profile.One TAR compares quite well with a mature profile from Bruneau,
both in terms of profile shape and in maximum scaled height. Bothprofile shape and scaled height therefore suggest that TARs aregenerally more evolved than that of an immature sand ridge. In-deed, the overall shape of the sand ridge section of the BruneauDune (Fig. 6) is very similar to a profile across a broad sand patchon Mars (Fig. 6 of Zimbelman (2010)), consistent with the lack ofeither a sharp crest or a slip face visible on the martian sand patch.We interpret all of the above to suggest that large TARs (those lar-ger than 1 m in height) are most similar to the transitional to ma-ture parts of a growing reversing dune. This conclusion is alsosupported by observations that the topography across reversingdunes is measurably distinct from that of other transverse dunes,as well as from the topography across ripples, megaripples, anddraa (Zimbelman et al., 2012). However, it is important to note thatreversing dunes form under rather specific wind conditions, windpatterns that may be difficult to reconcile with the nearly planet-wide distribution of TARs on Mars (e.g., Balme et al., 2008; Bermanet al., 2011).
36 J.R. Zimbelman, S.P. Scheidt / Icarus 230 (2014) 29–37
The high degree of symmetry of most TAR profiles (Shockey andZimbelman, 2013) argues strongly that bimodal winds of compara-ble strength and intensity may have been involved in their forma-tion. Dramatic temperature extremes are generated globally onMars by the thin martian atmosphere, whose relatively small heatcapacity means that it cools and heats much more rapidly than ourown atmosphere throughout the course of a day (Carr, 1981, p. 27).Possibly the dramatic diurnal temperature extremes on Mars maycause strong tidal winds, particularly where those winds becomechanneled within a valley or between broad topographic highs.Still, it is difficult to reconcile the wide distribution of TARs acrossMars with the global wind patterns that exist at present (e.g., Zureket al., 1992). The annual bimodal winds typical of the Bruneau area(Fig. 2) might be more similar to seasonal changes in wind patternson Mars, but such relationships need to be explored by meteoro-logical investigations well beyond the scope of the present study.
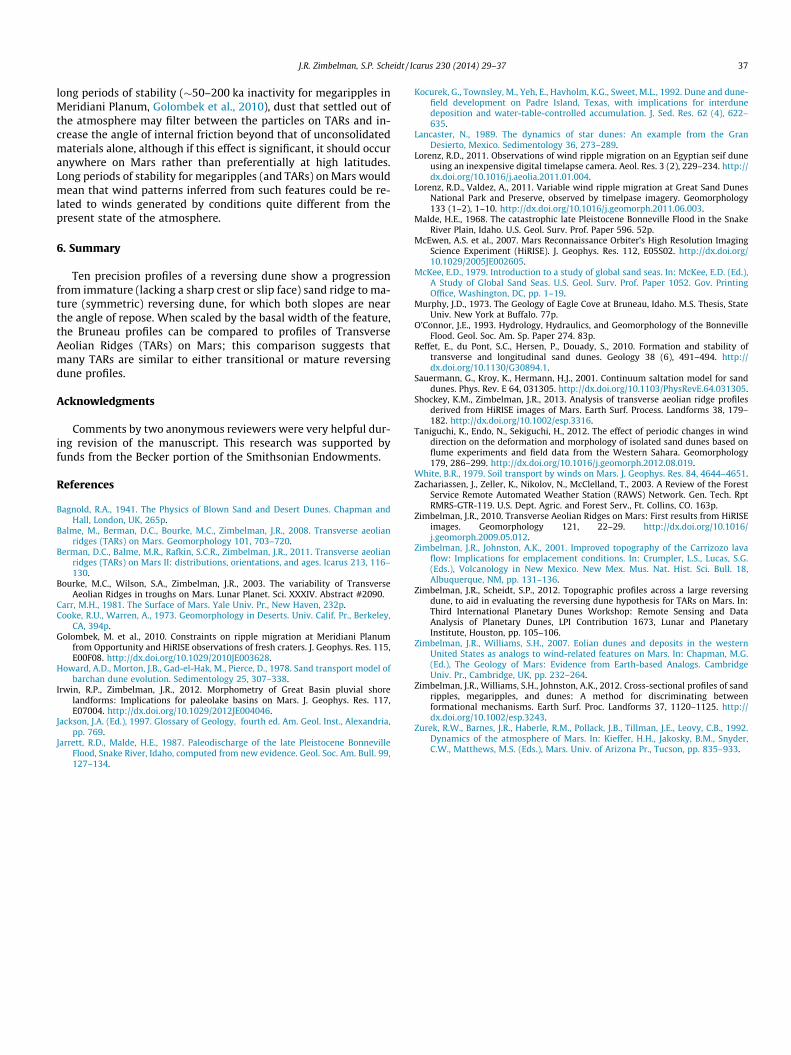
Maximum height scaled by width appears to be an importanttopographic parameter for evaluating the likely origin of aeolianbedforms (Zimbelman et al., 2012). Fig. 15 compares height/widthvalues as a function of width for measured profiles from dozens ofmegaripples and transverse dunes on Earth (data from Fig. 5 ofZimbelman et al. (2012)) to values derived from the ten Bruneauprofiles (large filled circles), and also to more than seventy TARson Mars (small dots; data from Zimbelman (2010), and Shockeyand Zimbelman (2013)). Several interesting trends are apparentfrom all of these data; we will first examine the track followedby points derived from the ten Bruneau profiles.
For the immature sand ridge section of the Bruneau reversingdune, values of height/width increase steadily as the profiles pro-gress up the dune while overall width remains nearly constant.In general, height/width <0.13 appears to represent the immaturephase of reversing dune development, where vertical growth en-tirely dominates over any significant increase in the width of thefeature. The transitional phase of the Bruneau profiles begins at apoint consistent with the trend followed in the immature section,but now the height/width values increase from 0.15 to 0.18 whileat the same time width more than doubles. Vertical growth contin-ues in this section, but now dune width also grows at roughly halfthe rate as the growing height. Once the mature stage is reached,
Fig. 15. Height/width as a function of log width, for features on Earth and Mars.Megaripple (open squares), pebble-coated megaripple (open triangle), transversedune (�s), and reversing dunes (open circles) data are from the supplementary datafile of Zimbelman et al. (2012). Bruneau reversing dune data (large filled circles) arefrom this work. Mars TAR data (small dots) are from Table 1 of Zimbelman (2010)and the supplementary data file of Shockey and Zimbelman (2013). See Section 5 oftext.
height/width remains between 0.21 and 0.24 while height andwidth now change in lock step; height/width changes relatively lit-tle while width increases by more than a factor of five. Only revers-ing dunes (open and closed circles in Fig. 15) experience verticalgrowth sufficient to raise their height/width values well above�0.15, which is the maximum value attained by transverse dunes(� in Fig. 15).
The overall trend outlined above is consistent with measure-ments that are less precise than what is obtained through DGPS;the two largest height/width values previously reported for revers-ing dunes also come from the Bruneau Dunes, where a less preciselaser inclinometer (precision of individual measurements was0.3 m) produced values that fall along the trend between the tran-sitional and mature DGPS points. Physical dimensions of dune-likefeatures obtained from laboratory or numerical studies (e.g., Reffetet al., 2010; Taniguchi et al., 2012) should be amenable to compar-ison with the measured attributes shown in Fig. 15. Kocurek et al.(1992) documented the seasonal construction and destruction ofsand dunes on Padre Island, Texas, with dunes growing from smallpatchs of sand into regular dunes, which were subsequently re-moved by winter storm winds, a situation that may warrant com-parison to the Bruneau Dunes. We believe that the DGPS data fromBruneau reveal an evolutionary path that can be followed in a plotof height/width as a function of width, a path that might be ex-plored through comparison with reversing dunes developed in avariety of formational settings.
Next consider the cloud of data points that represent measure-ments from dozens of TARs (small dots in Fig. 15) from locationsscattered across Mars. The Mars TAR data come from measuredheights and widths given in Table 1 of Zimbelman (2010; 13 TARs)and in the supplementary data file of Shockey and Zimbelman(2013; 60 TARs). In Fig. 15, the TAR data fill a gap between thefields representing values for megaripples (open squares) and peb-ble-coated megaripples (open triangles) and the values for trans-verse (�s) and reversing (open circles) dunes. The height–widthdistribution of TARs is generally similar to that of reversing dunes,but the measured height/width values of TARs extend to as muchas twice that of transverse dunes, but are similar in shape to theoverall trend for reversing dunes. While some of the TAR datapoints do overlap with the immature portion of the Bruneau trend,we do not believe this superposition indicates that most TARs aregood matches to the immature part of the Bruneau reversing dune,particularly when the sharp-peaked symmetric profile shape forTARs (Fig. 14) is considered. Instead, the similarity of the overallrange of height/width values between TARs and reversing dunes,but at widths scales generally 1/3 that of reversing dunes on Earth,raises the intriguing possibility that the reduced gravity of Mars(38% that on Earth) somehow contributes to the development ofsmaller symmetric TAR features on Mars relative to comparablefeatures on Earth. We are unaware of a physical explanation forhow the lower gravity on Mars should somehow result in martianlandforms smaller than terrestrial counterparts, particularly sincethe low gravity and low atmospheric pressure cause sand saltationpath lengths to be >10 times longer on Mars than they are on Earth(White, 1979). It is unwise to speculate too extensively on what isstill a relatively limited data set derived from cross-sectional pro-files for the features on both Earth and Mars, but these initial com-parisons suggest that the height/width as a function of widthparameter space warrants further investigation for features onboth planets.
The height/width values in excess of 0.25 come from TARs atrelatively high latitudes (lat. >30�N or S on Mars). It seems possiblethat features at mid- to high latitudes may include ground ice thatwould facilitate vertical growth beyond that of unconsolidatedsand alone (a pile of sand with a slope angle of 33� would have aheight/width value of 0.325). Another possibility is that during
J.R. Zimbelman, S.P. Scheidt / Icarus 230 (2014) 29–37 37
long periods of stability (�50–200 ka inactivity for megaripples inMeridiani Planum, Golombek et al., 2010), dust that settled out ofthe atmosphere may filter between the particles on TARs and in-crease the angle of internal friction beyond that of unconsolidatedmaterials alone, although if this effect is significant, it should occuranywhere on Mars rather than preferentially at high latitudes.Long periods of stability for megaripples (and TARs) on Mars wouldmean that wind patterns inferred from such features could be re-lated to winds generated by conditions quite different from thepresent state of the atmosphere.
6. Summary
Ten precision profiles of a reversing dune show a progressionfrom immature (lacking a sharp crest or slip face) sand ridge to ma-ture (symmetric) reversing dune, for which both slopes are nearthe angle of repose. When scaled by the basal width of the feature,the Bruneau profiles can be compared to profiles of TransverseAeolian Ridges (TARs) on Mars; this comparison suggests thatmany TARs are similar to either transitional or mature reversingdune profiles.
Acknowledgments
Comments by two anonymous reviewers were very helpful dur-ing revision of the manuscript. This research was supported byfunds from the Becker portion of the Smithsonian Endowments.
References
Bagnold, R.A., 1941. The Physics of Blown Sand and Desert Dunes. Chapman andHall, London, UK, 265p.
Balme, M., Berman, D.C., Bourke, M.C., Zimbelman, J.R., 2008. Transverse aeolianridges (TARs) on Mars. Geomorphology 101, 703–720.
Berman, D.C., Balme, M.R., Rafkin, S.C.R., Zimbelman, J.R., 2011. Transverse aeolianridges (TARs) on Mars II: distributions, orientations, and ages. Icarus 213, 116–130.
Bourke, M.C., Wilson, S.A., Zimbelman, J.R., 2003. The variability of TransverseAeolian Ridges in troughs on Mars. Lunar Planet. Sci. XXXIV. Abstract #2090.
Carr, M.H., 1981. The Surface of Mars. Yale Univ. Pr., New Haven, 232p.Cooke, R.U., Warren, A., 1973. Geomorphology in Deserts. Univ. Calif. Pr., Berkeley,
CA, 394p.Golombek, M. et al., 2010. Constraints on ripple migration at Meridiani Planum
from Opportunity and HiRISE observations of fresh craters. J. Geophys. Res. 115,E00F08. http://dx.doi.org/10.1029/2010JE003628.
Howard, A.D., Morton, J.B., Gad-el-Hak, M., Pierce, D., 1978. Sand transport model ofbarchan dune evolution. Sedimentology 25, 307–338.
Irwin, R.P., Zimbelman, J.R., 2012. Morphometry of Great Basin pluvial shorelandforms: Implications for paleolake basins on Mars. J. Geophys. Res. 117,E07004. http://dx.doi.org/10.1029/2012JE004046.
Jackson, J.A. (Ed.), 1997. Glossary of Geology, fourth ed. Am. Geol. Inst., Alexandria,pp. 769.
Jarrett, R.D., Malde, H.E., 1987. Paleodischarge of the late Pleistocene BonnevilleFlood, Snake River, Idaho, computed from new evidence. Geol. Soc. Am. Bull. 99,127–134.
Kocurek, G., Townsley, M., Yeh, E., Havholm, K.G., Sweet, M.L., 1992. Dune and dune-field development on Padre Island, Texas, with implications for interdunedeposition and water-table-controlled accumulation. J. Sed. Res. 62 (4), 622–635.
Lancaster, N., 1989. The dynamics of star dunes: An example from the GranDesierto, Mexico. Sedimentology 36, 273–289.
Lorenz, R.D., 2011. Observations of wind ripple migration on an Egyptian seif duneusing an inexpensive digital timelapse camera. Aeol. Res. 3 (2), 229–234. http://dx.doi.org/10.1016/j.aeolia.2011.01.004.
Lorenz, R.D., Valdez, A., 2011. Variable wind ripple migration at Great Sand DunesNational Park and Preserve, observed by timelpase imagery. Geomorphology133 (1–2), 1–10. http://dx.doi.org/10.1016/j.geomorph.2011.06.003.
Malde, H.E., 1968. The catastrophic late Pleistocene Bonneville Flood in the SnakeRiver Plain, Idaho. U.S. Geol. Surv. Prof. Paper 596. 52p.
McEwen, A.S. et al., 2007. Mars Reconnaissance Orbiter’s High Resolution ImagingScience Experiment (HiRISE). J. Geophys. Res. 112, E05S02. http://dx.doi.org/10.1029/2005JE002605.
McKee, E.D., 1979. Introduction to a study of global sand seas. In: McKee, E.D. (Ed.),A Study of Global Sand Seas. U.S. Geol. Surv. Prof. Paper 1052. Gov. PrintingOffice, Washington, DC, pp. 1–19.
Murphy, J.D., 1973. The Geology of Eagle Cove at Bruneau, Idaho. M.S. Thesis, StateUniv. New York at Buffalo. 77p.
O’Connor, J.E., 1993. Hydrology, Hydraulics, and Geomorphology of the BonnevilleFlood. Geol. Soc. Am. Sp. Paper 274. 83p.
Reffet, E., du Pont, S.C., Hersen, P., Douady, S., 2010. Formation and stability oftransverse and longitudinal sand dunes. Geology 38 (6), 491–494. http://dx.doi.org/10.1130/G30894.1.
Sauermann, G., Kroy, K., Hermann, H.J., 2001. Continuum saltation model for sanddunes. Phys. Rev. E 64, 031305. http://dx.doi.org/10.1103/PhysRevE.64.031305.
Shockey, K.M., Zimbelman, J.R., 2013. Analysis of transverse aeolian ridge profilesderived from HiRISE images of Mars. Earth Surf. Process. Landforms 38, 179–182. http://dx.doi.org/10.1002/esp.3316.
Taniguchi, K., Endo, N., Sekiguchi, H., 2012. The effect of periodic changes in winddirection on the deformation and morphology of isolated sand dunes based onflume experiments and field data from the Western Sahara. Geomorphology179, 286–299. http://dx.doi.org/10.1016/j.geomorph.2012.08.019.
White, B.R., 1979. Soil transport by winds on Mars. J. Geophys. Res. 84, 4644–4651.Zachariassen, J., Zeller, K., Nikolov, N., McClelland, T., 2003. A Review of the Forest
Service Remote Automated Weather Station (RAWS) Network. Gen. Tech. RptRMRS-GTR-119. U.S. Dept. Agric. and Forest Serv., Ft. Collins, CO. 163p.
Zimbelman, J.R., 2010. Transverse Aeolian Ridges on Mars: First results from HiRISEimages. Geomorphology 121, 22–29. http://dx.doi.org/10.1016/j.geomorph.2009.05.012.
Zimbelman, J.R., Johnston, A.K., 2001. Improved topography of the Carrizozo lavaflow: Implications for emplacement conditions. In: Crumpler, L.S., Lucas, S.G.(Eds.), Volcanology in New Mexico. New Mex. Mus. Nat. Hist. Sci. Bull. 18,Albuquerque, NM, pp. 131–136.
Zimbelman, J.R., Scheidt, S.P., 2012. Topographic profiles across a large reversingdune, to aid in evaluating the reversing dune hypothesis for TARs on Mars. In:Third International Planetary Dunes Workshop: Remote Sensing and DataAnalysis of Planetary Dunes, LPI Contribution 1673, Lunar and PlanetaryInstitute, Houston, pp. 105–106.
Zimbelman, J.R., Williams, S.H., 2007. Eolian dunes and deposits in the westernUnited States as analogs to wind-related features on Mars. In: Chapman, M.G.(Ed.), The Geology of Mars: Evidence from Earth-based Analogs. CambridgeUniv. Pr., Cambridge, UK, pp. 232–264.
Zimbelman, J.R., Williams, S.H., Johnston, A.K., 2012. Cross-sectional profiles of sandripples, megaripples, and dunes: A method for discriminating betweenformational mechanisms. Earth Surf. Proc. Landforms 37, 1120–1125. http://dx.doi.org/10.1002/esp.3243.
Zurek, R.W., Barnes, J.R., Haberle, R.M., Pollack, J.B., Tillman, J.E., Leovy, C.B., 1992.Dynamics of the atmosphere of Mars. In: Kieffer, H.H., Jakosky, B.M., Snyder,C.W., Matthews, M.S. (Eds.), Mars. Univ. of Arizona Pr., Tucson, pp. 835–933.