precision trading - cabafx.comcabafx.com/trading-ebooks-collection/newpdf/precision trading...
TRANSCRIPT

PRECISION TRADING WITH STEVENSON
PRICE AND TIME TARGETS
J.R. STEVENSON
Traders Press, Inc.® PO Box 6206
Greenville, SC 29606
Serving Traders Since 1975 http://www.traderspress.com

Copyright© September 2004 by J.R. Stevenson
Published by Traders Press, Inc.®
All rights reserved. Printed in the United States of America. No part of this publication may be reproduced, stored in a retrieval system, or transmitted, in any form or by any means, electronic, mechanical, photocopying, recording, or otherwise , without the prior written permission of the publisher.
ISBN: 0-934380-94-5
This publication is designed to provide accurate and authoritative information with regard to the subject matter covered. It is sold with the understanding that the publisher is not engaged in render ing legal, accounting, or other professional advice. If legal advice or other expert assistance is re quired, the services of a competent professional person should be sought. No representation is made that the methods presented in this book are or will be profitable. Any person acting on the ideas herein is responsible for his own actions, and acts at his own risk.
Editor: Maria Dobson
Layout and Cover Design by: Teresa Darty Alligood Traders Press, Inc. ®
Traders Press, Inc.® PO Box 6206
Greenville, SC 29606
Serving Traders Since 1975 http://www.traderspress.com

TABLE OF CONTENTS
Terms and Abbreviations Used in This Manual Impor tant Information What This Manual Will or Will Not Do For You Publisher's Foreword In troduction
The Farmer and the Mule Overview of Concepts Chart 1 Chart 2 Chart 3
1 3 4 5 6
Chart 4 7 Regular and Inverted Cycles 9 Chart 5 : Regular Cycles in an Uptrend 1 0 Chart 6: Inverted Cycles in an Uptrend 1 1 Chart 7: Regular and Inverted Cycles in a Downtrend 1 2 Concept # 1 : PTT [Price and Time Target] 1 3 Units 1 5 Procedure for Making a PIT in Real Time 1 7 How to Trade PIT's in Real Time 1 9 Concept #2: CTL [Cyclic Trend Line] 2 1 Chart 8 : Concept 2 23 Chart 9: Concept 2 24 How to Select the Best Cycle to Trade 25 How to Tell When a Cycle Has Ended 27
What ifthe PIT Misses? 2 9
Basic Questions 3 1
Chart 1 0: Failure and Success 33 Chart 1 1 34 Chart 1 2 3 5 Chart 1 3 : Real Time Analysis for a PIT 36 Chart 14: Results from Previous Chart 3 7 Chart 1 5 : Cycles in the Pre -Market Chart 38 Chart 1 6: Concept 2 3 9 Chart 1 7: Real Time Trading 40 Chart 1 8 4 1 Chart 1 9: As the Day Progressed 43 Chart 20: Multiple Bars at the Same Chart Point 44 About Cycles 45 Chart 2 1 : Counting Bars 47 Chart 22: Guidance Through the Day 48 Chart 23 : Current Update 4 9 Cycles 50 Cycle Units 5 1 Trading Tips 53 Points of Emphasis in this Manual 5 5 S umrruuy 57 Tes timonials 5 9


TERMS AND ABBREVIATIONS USED IN THIS MANUAL
PTT-PRICE AND TrME TARGET
TR-TREND-the general direction that the price is moving
TL-TREND LINE drawn between two or more points
DT-DoUBLE Top - Two or more price bars that have approximately the same price highs.
DB--DoUBLE BOTTOM - Two or more price bars with approximately the same price low.
SR-SPIKE REVERSE - A higher high and a lower close near the low of the bar; or a lower low and a higher
close with the close near the high of the bar.
MP-MIDPOINT of a bar
RB--REVERSAL BAR - A higher high with a lower close or a lower low with a higher close. Often is seen at a
PIT. PT-POINT - if a high point, there will be a lower price bar on each side of the high bar. If a low point, there will
be a higher price bar on each side of the low bar. Note: the low or high bar can have two or more bars
with equal price high or low bars.
IP-IMPLIED POINT - A point that develops between two or more high points or between two or more low
points that may not have a point as described above. Will show an example of this as we get into the
manual. See chart 1 4. CYC-CYCLE - As used in this manual, a cycle is defmed as the price action that develops between two low
points or between two high points.
CL-CYCLE LENGTH - The number of price bars between any two low points or between any two high points.
CT -CYCLE Top - The high point between any two low points.
CB-CYCLE BOTTOM - The low point between any two high points.
RC-REGULAR CYCLE -Has two low points with a high point in between.
IC-INVERTED CYCLE -Has two high points with a low point in between.
UNIT-Regular cycle followed by an inverted cycle: or an inverted cycle followed by a regular cycle. [Many
examples will be illustrated]
RU-REGULAR UNIT -If analysis starts at a low paint on a regular cycle, it is aRU. ARU is always labeled
A-B-C-D.
IV-INVERTED UNIT -If analysis starts at a high point on an inverted cycle, it is an IU. AnIU is always labeled
B-C-D-A.
CTL-A parallel trend line (Cyclic Trend Line) to the basic trend line BTL that normally touches only one
price bar, as used in Concept #2. BTL-BASI C TREND LINE, as used in Concept #2 , drawn from point B to point C on a regular cycle or a trend
line drawn from point C to point D on an inverted cycle. This BTL is then cloned to get the Cyclic
Trend Line (CTL.)

IMPORTANT INFORMATION
Trading the e-mini futures has large potential profit possibility but also large potential losses. You must
be aware of the risks and be willing to limit your losses with the use of stops. The concepts presented in this
manual are to be considered additional tools to aid you in your trading experience. The PIT's have absolutely
no influence on the price action and are to be considered as markers or sign posts as to where the market may
trade as a result of a certain cycle market. Properly used , they should help in your analysis of the market that
you are trading.
Past results are not necessarily an indication of fut ure results. However , all examples in this manual ,
except the GE stock example, were selected after this manual was started , to show that the concepts were
valid in the markets that are ahead. Current examples will be shown on any future printings ofthis manual.
There is no guarantee or assurance that your e -mini trading will be profitable. You are responsible for
your own trading decisions.

WHAT THIS MANUAL WILL OR WILL NOT Do FOR You
1 . On a 5 minute chart of Mini S&P's, you will be able to look ahead 20, 30, 60 or even
several hours and predict where the price should be at a certain time. [PTT]
2. You will be able to tell which cycles are moving the market trend.
3 . You will b e able t o give a PIT for any cycle from 3 bars o n up in length.
4. You will be able to reduce your trading to just a few trades per session to prevent over
trading, if you desire.
5 . You will b e able to tell when a reaction, or a rally against the trend i s about t o stop.
6. You will see why chart patterns form and how PIT's can confirm their targets.
7. By using concept #2, you should be able to tell when a new cycle direction is confIrmed.
8. The markets differ in character from day to day. PTT's should help you trade trend days or
trading range type markets.
9. The PIT's will not make the market move to them. They are guide posts or signs to help
guide you on your journey.


PUBLISHER'S FOREWORD
My wife Maria and I are proud to make this book available to you, and hope that the ideas it presents will
make you a more astute market analyst and a more profitable trader. It is our hope that this book will be a valuable
contribution to the literature of technical analysis.
Maria and I had the good fortune and privilege to spend the better part of two days with JR Stevenson in
my trading room, where he shared with us his PTT concept and showed us through many examples during the
day how it worked in real time. We are grateful to him for all the time he spent with us, and feel honored to be
associated with him and to help him in his goal of sharing his market knowledge with other traders.
JR's knowledge of how markets behave is truly amazing. It is, I am confident, the result of decades of
close and careful study of price action. He is equally gifted in his ability to develop simple and workable methods
for trading. Readers may find it of interest that, 80 years young, JR is still an active trader for his own account,
concentrating on the intra-day action in the S&P E-mini market, using five minute charts. He has many other
excellent ideas which he has developed over the years, which may be revealed in future books.
In order for you to employ this method, you will need access to trading software that can clone a trend
line in length and slope. I was delighted to learn that the software I have used for years, Ensign, has a study called
the Fonnations Tool which does this job nicely. JR has used Q-Charts for years in his own trading and analysis
(http://www.qcharts.com) and he advises that in his opinion this is the best choice for those interested in this
approach.
I wish to express my deep appreciation and gratitude to my wonderful wife Maria (who is a trader and an
avid student of markets, charts, and market action) for all her help and effort in editing this manuscript and helping
to prepare it for publication: She has taken a special interest in this approach and is looking forward to using it in
her own market analysis, in conjunction with her own methods which she developed over years of hard work and
study.
After you have studied this manual, if you have any questions concerning the methods presented, JR has
graciously consented to help readers to better understand these ideas and how they may be used. He may be
contacted at [email protected].
May the trend be with you,
Edward Dobson Traders Press, Inc. Greenville, SC October, 2004
Edward and Maria Dobson


INTRODUCTION
The TOOL you are about to put in your "tool box" is so simple and easy to use that you may be
tempted to discard it before trying, however "simplicity often leads to success."
In order to make a PIT [price-time tar get] all you need is:
1. A charting software package that allows you to draw on trendline on a 5 minute chart (or
any time frame) of an e-mini mar ket, and to clone the trendline.
2. Recognize by observation, the appearance of a REGULAR CYCLE and that of an
INVERTED CYCLE.
3 . Connect the two cycles, again b y observation, draw two trendlines and the price and time
target PIT will be given at the end of the cloned trendline, plotted right on the chart.
There are no calculations, no expensive software needed, no formulas or complicated rules to follow
and the same procedure is used on any chart of your choosing.
You can choose any length cycle you wish to trade that will give you the profit!loss ratio that suits your
money management policy. This step is the only subjective decision you need to make to arrive at the PIT.
Proof of the above statements ar e in the pages to follow. Please read with an open and creative mind
and you will be amazed as to how often near perfect results are obtained.
Perhaps even more important is the mar ket analysis that is possible when the target is missed in price,
time, or both. Many times you will be able to correctly predict the next move in the market because of a failure
of the market to reach the PTT.
"My interest is in the future, because I am going to spend the rest of my life there!" -Charles F. Kettering


PRECISION TRADING WITH STEVENSON PRICE AND TIME TARGETS
THE FARMER AND THE MULE
Every day, before starting to plow, the fanner would hit the mule over the head several times with a ball
bat and bring the mule to his knees. This went on day after day so fmally someone asked the farmer "why do
you hit the mule with a ball bat every day before you start plowing?" The farmer answered, "well, you see, I
have to get his ATTENTION- then he will plow for me!"
To get your ATTENTION, you will be shown how quickly and accurately you can make a PTT [price
and time target] on any chart, of any time frame as long as the char t reflects good trading volume and liquidity.
After a couple of examples, and if! still have your ATTENTION, I will give you the concepts for
making PTT's (price and time targets) . Many more examples will be presented, all of which have been charted
since the time I decided to write about these concepts on June 27, 2003. I have used these concepts since
1 974, and I have many examples of the PTT's in my files but to prove that the concepts are still valid in today's
market, only charts after the June 27 starting date of this book will be used. There is no optimization and the
same procedure is used in every time frame on every chart. I will not use old charts to prove that the concepts
are valid. PTT's look to the future, not back in time!
Concept # 2 is a very useful tool to help determine when one cycle has ended and another one has
started. This concept can be a "stand-alone" tool for trading and has produced great results on some days.
Many examples will be shown of this tool.


PRECISION TRADING WITH STEVENSON PRICE AND TIME TARGETS
OVERVIEW OF CONCEPTS
The conce pts that will be presented , are original , and have been used to give " price and time targets"
{PIT } for all future markets since 1 974. These conce pts were the basis of a ma rket let ter produced in the 70 's
and 80 's called "Conti Cyclic Projections."
The conce pts are to be considered as TOOLS to aid in you r trading and analyzing the ma rkets , and
not a trading method. It is to be assumed that readers ofthese conce pts have a basic knowledge of trading and
have their own method of trading. Any knowledge of cycles will be hel pful but should not be required in using
these conce pts.
In the 70 's , when these conce pts were founded , the PIT 's were derived from pa per charts , using only
a "see -through ruler" and a sha rp pencil. With the advent ofthe present charting packages and the ease of
d rawing lines , it was found that the very same conce pts that were used on daily charts , we re just as accu rate
when used on 1 , 3 , 5 and 60 minute charts. The conce pts will be effective on any chart that has cyclic
characteristics with enough volume to allow timely entries and exits. The same conce pt is used on every char t
of any time period without being o ptimized. The conce pts should be timeless fo r the futu re !
CONCEPT 1: By using two lines of the same length and slo pe , the PIT will be given for any length cycle that is isolated from the price action. The model used fo r this conce pt was designed to be ve ry accu rate. (Every cycle will give a time in the future when the price will be exactly at the target.) IMPOSSIBLE , OUTRAGEOUS , CAN 'T BE DONE , RANDOM MA RKETS , NEWS , ETC. , ETC. Those are some comments that will be made. Will the projection be EXACT every time ? OF COURSE NOT, nothing is perfect in the real wo rld , B UT you will be am azed how many times the PIT 's do turn out to be accurate , often to the very tic. [ proof will be presented.] Even more im por tant is when the PIT 's miss their mark , as this will often give info rmation as to the fut ure direction of prices.
CONCEPT 2: By using a line that has only ONE contact point with the price action , the end of one cycle and the s tart of anothe r cycle can often be dete rmined. This conce pt is a great hel p in knowing when prices will reverse and a new PIT can be made. [ proof will be given.] This conce pt could also be develo ped into a "stand alone" method of trading the markets.
3

J .R. STEVENSON
E-Mini S& . T ' 500 (Sep 2003), 5 minute - QCharts ©2001 Quote.com 08/17/03 14:31:48 " " " • 'I . . . ! . ; , . , '�986.00
j; i
984.00 i: ; i
. i ·
976.00
974.00
�-----�...;..'.;..' ��-...:...:...:...:.W972 .00 t
970.00
, . , . 968.00
966.00
("1'\11).'11 1' ::'1111-1 ()lI"l" I I I \II II�hh IL"LI\Ld (.II h.llh (11111 I' .1 11.ldL·lll.llk ,Ii ()II"k I I ( .1 I \u" '\L'\II"lk 1"1111'.111 \ \ 1 1 "lhL' 1 1 100,k'll.llb ,L'\ IIHlh 111. .. '1 1..'111 .lIe (1\\lh.'d In 111 1..' 11 h .. • ... pl..·!",.\I\I..· \)\\111..'\'" I IlL' Lid!.1 .... IHI\\1l 111 till .... Lh,1l1 I .... 11 1 ... \\\1 11 ... 11 d.II.1. ,llld 11(11 1.. 1I1h .. 'll t 11l1{Htll.lll(lll··
CHARTl
Let's assume that on this day, August 1 7 th, 2003 at about 2:00 PM ET, we decide to put on a trade
duri ng the last couple of hours of trading. This chart is what is seen at that time of the day. You would see that
the high had been made at 9:50, that a low had been made at 1 2:00, and that the market was trading near the
high again at 1 4:00. Maybe the potential double top, the price action and concept #2 [explained later] would
have to ld you to sell short. What would the PIT be ? (The price target and the time it will be reached .)
1 . We mark high pt. as "B" 2. We mark the low pt. as "C ' 3 . We mark the last high as "D" 4. We draw a TL from B to D 5 . We CLONE this TL [meaning the same length and slope] 6. We move the cloned TL to point C and the end of the cloned TL is our PTT !
7 . Look at chart 2 for the end of trading at 16: 1 5 ET
4
PRECISION TRADING WITH STEVENSON PRICE AND TIME TARGETS
CHART 2
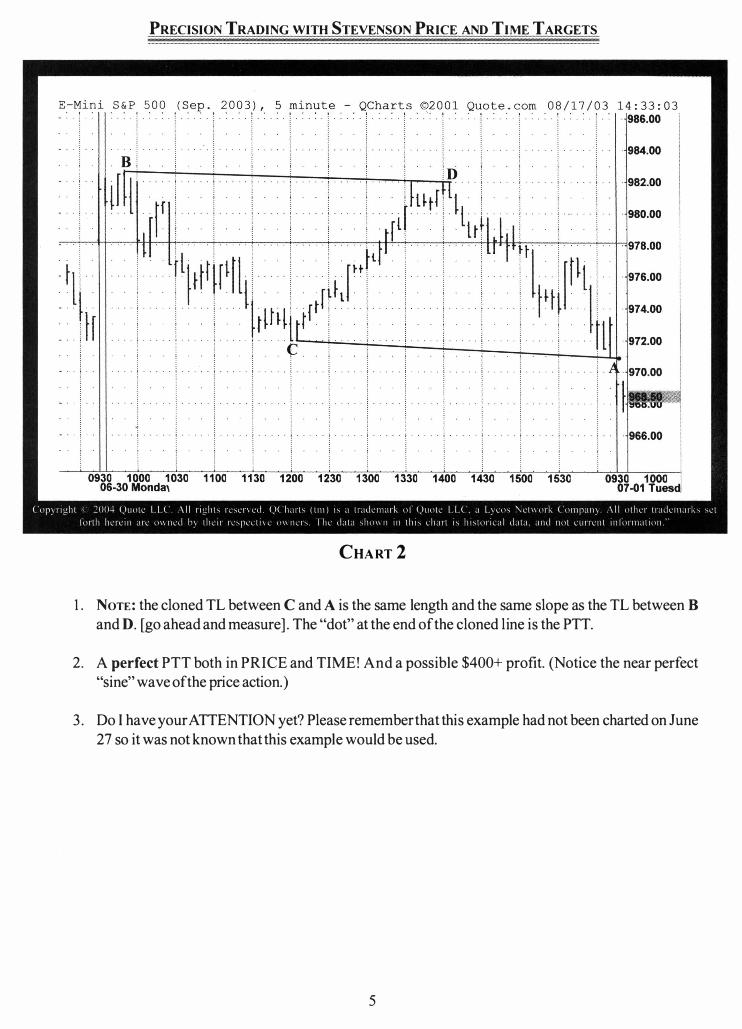
1. NOTE: the cloned TL between C and A is the same length and the same slope as the TL between B
and D. [go ahead and measure] . The "dot" at the end of the cloned l ine is the PTT.
2. A perfect PTT both in PRICE and TIME ! And a poss ible $400 + profit. (Not ice the near perfect "s ine" wave ofthe price act ion.)
3. Do I have your ATTENTION yet ? Please remember that th is example had not been charted on June 27 so it was not known that th is example would be used.
5
J .R. STEVENSON
Gen Electric Co, Daily - QCharts ©20 0 1 Quote.com 0 8 / 17/03 1 4:4 0 : 5 6
_ . . ....... !. . . . . .
................... , ................. B·· .. . . . ....... . .. . 30.0000
. . . . . . . . . .. . f ,h
l·
fut[lttlh III1W�H. t· . . 28.0000 lilt lr H tH It II i t I e
fIr It� ... ... . .... .... 26.0000
I
rt!llr·············,················ . ·24.0000
.............. i······ . . 22.0000
21 27 3 10 18 24 3 10 17 24 31 7 14 21 28 5 12 19 Feb Mar ADr Mav
(tll'\
PRECISION TRADING WITH STEVENSON PRICE AND TIME TARGETS
0 8 / 17/03 14 : 4 3 : 3 4
·32.0000
. .... . . . . . . ; ... . ..... . . . .. . . 26.0000
. . .. . . . . . . . 24.0000
. i
24 31 7 14 21 28 5 12 19 27 2 9 16 23 30 7 14 21 Apr Mav Jun Jul
("I1\l1eI1l' clill" 1.l1I"lc I I ( \1 1 Ilellh IC',c'l\c'd (.I( il.lIh 111111" ,I 11,ldc·III,"i.. 01 (.I""iL' I I ( ,I I ,,,,, '\c·I""d .. (""11'."1\ \11 olilcl 11,ldclll.Ili.., 'c'l
t(nlh hl..'II..'1I1 .111.. ()\\Ih.d h\ 1111..'11 11.." 1'1..·1..11\\..· (\\\111..'1" Ill\..' d,II,] .... 111\\\11 til thl .... 1.. 11,111 1-.. 111 .... 1111 11..,11 d,I!.] ,IIHlll\lt 1..1Jllll11 111!\11111,1111111
CHART 4
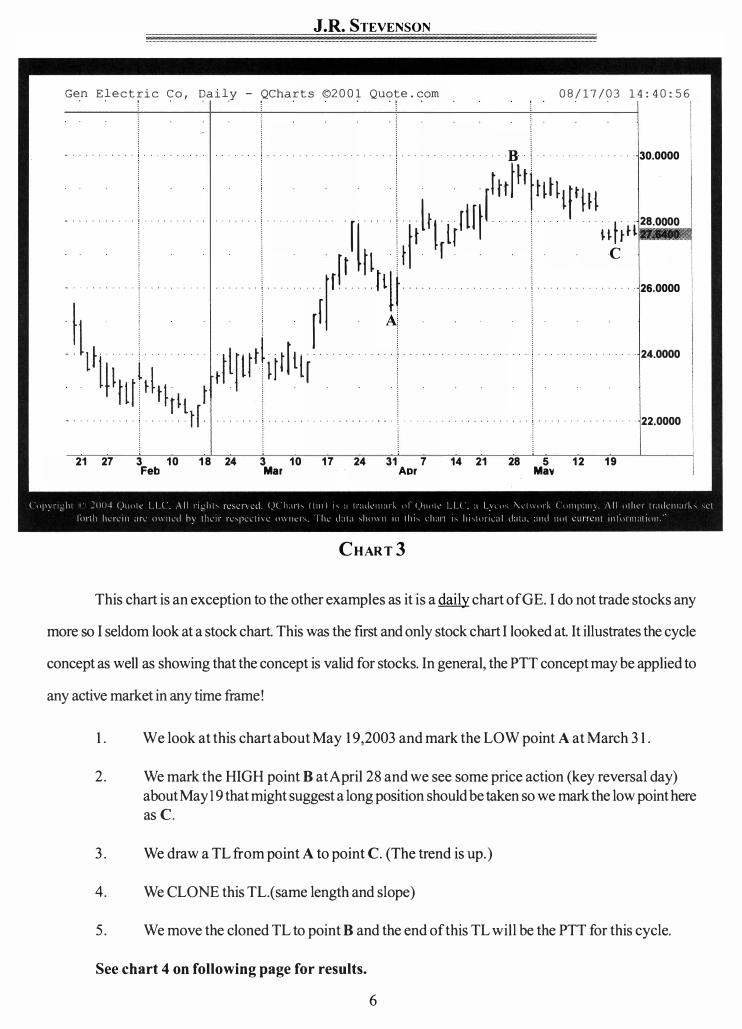
1. Voila: The end ofthe cloned TL is anothe r accu rate PTT. The length ofthe CYCLE from A to C is 36 ba rs, and the length of the CYCLE from B to Dis 36 ba rs.
2. Amazing ! And the PTT was known almost a MONTH in adv ance !
3. Now of cou rse eve ry PTT will not be as accu rate as these two exam ples. You have hea rd many times that no one knows what the ma rket will do in the futu re but you will be amazed how many times you will see nea r pe rfect PIT 's, which a re against tremendous odds of being that accu rate just by guessing o r "good luck."
7


PRECISION TRADING WITH STEVENSON PRICE AND TIME TARGETS
REGULAR AND INVERTED CYCLES
Before showing more exam ples and the PTT conce pt, the following terms must be illustrated and
ex plained to fully gras p the conce pt that will be presented.
1. In chart 1, the price action from B to D is an I NVERTED CYCLE. [Starts at a high point B, has a low point C and another high point D.] The length is 52 bars.(The number of price bars between B and D.)
2. In chart 2, the price action between C and A is a REGULAR CYCLE . [Starts at a low point C, has a high point B and another low point A.] The length is 51 bars.
3. The TL that is drawn from A to C on a RC or the TL that is drawn from B to D on an IC, illustrates the trend of THAT cycle by the slo pe ofthe TL. It will be either u p, down, or sideways [ flat].
In order to fully understand and visualize the REGULA R and INVERTED cycles, the next two char ts
should hel p. For exam ple: Charts 5 and 6 will show regular and inverted cycles in an u ptrend. Chart #7 will
illustrate what the RC and IC look like in a downtrend .
IMPORTANT: It is im por tant to be able to recognize the RC and IC and the trend for each cycle rather
quickly so orders can be entered in a timely manner.
9

J .R. STEVENSON
CMEO: E?�3U,O ? m�rmte: :- ,Q�t:-ar�so ©2 0 0 1 9uoo�e.com ! .
. i
B2 . . . . . i .
!A2
. . . . .
. . i . . . . . i .
; .
; . i . : : : : ..... i····· I . • • • . ! ..... ! . . . . . i·····!
1130 1200 1230 1300 1330 1400 1430 1500
0 8 / 2 4 03 1 8 : 37 : 27 o , . !
0 0 0 0 0 0 . 0 0 . 0 . 0 0 984.00
� . . 982.00 O f 0 0
. rt till C 4 i,, � U 980.00
978.00
974.00
972.00
970.00
968.00
966.00
« (ll1\l l� .. dll I ..:'(Hll ()llIlI\.' [I ( \11 1 1,,111 -- ]I. .. 'Ll\u! ()( 11,11t--. (till) h ,I tt,ldL'l11.lIk 01 ()W1lL' I I ( .1 I �Uh '\",:1\\,111... (\I111P,ll1\ \11 (Ith!...'! 1 t.ldl'1l1.1d"" ,,1...1 1\11111 ih.1L'11l .III.. n\\ lh.d h\ 11h.'ll '\,."P\.'LII\l,.' \1\\ I1L'I" IhL' d,lLI .... IHl\\ 1l III thl .... Lh.lI! h hl .... lpI1I. .. . 1I d,Il.1. dlld Ililt LUII\..'llt IIlIIIIIll,lthlil
CHARTS
REGULAR CYCLES IN AN UPTREND
On Monday, August 4, 2003, there are four [4] REGULAR CYCLES [RC] illustrated on th is char t.
1 . All REGULAR CYCLES in all the exam ples are MARKED A-B-C.
2. All RC 's are in an u ptrend as shown by the slo pe of the TL drawn between A and C. RC 's can be in u ptrends, downtrends, or s ideways trends.
3 . Note the length of the regular cycles: 20 bars, 1 1 bars, 1 4 bars and 1 7 bars. [The first bar is counted as # 1 ]
There are many other regular cycles on th is chart but these stand out and are clearly shown.
1IINr: Not ice the clear s pace ABO VE the TL and BELOW the pr ice bars. Th is illus trates a regular cycle of "X" number of bars between two PT's A and C.
1 0

PRECISION TRADING WITH STEVENSON PRICE AND TIME TARGETS
CME.: E?�3U,. 5 minut� - QCharts ©2001 Quote. com 0 8 / 2 4 / 0 3 1 8 : 37:27
'! .
. 1 . . . . . . " ! "
. i
. . i· · · • .
. . . . . i .
. . . . . 1 .
0930 1000 1030 1100 1130 1200 1230 1300 08"()4 Monda\
CHART 6
! . . ! • • ! • . ! ' " , '
INVERTED CYCLES IN AN UPTREND
984.00
982.00
980.00
968.00
966.00
1 . This is the same cha rt as the one last viewed, but only th ree [3] INVERTED CYCLES (IC) are illust rated .
2. All INVERTED CYCLES in all exam ples a re ma rked B-C-D.
3 . All inve rted cycles a re in an u pt rend as shown by the slo pe of the TL that is d rawn between point B and D.
NOTE THE LENGTH OF THE CYCLES: 1 0 ba rs, 1 4 ba rs , 1 7 ba rs. Also note the length ofthe RC 's on the previous cha rt.
Notice that the clea r s pace is BELOW the TL and above the price ba rs on INVERTED CYCLES. This s pace hel ps to quickly identi fy the IC o r the RC.
The re are many othe r inve rted cycles not shown on this cha rt. Can you find an inve rted cycle that is 20 ba rs in length ?
1ItNr: Label the 1 0:00 ba r as B, the 1 0:30 ba r C and the 1 1 :35 ba r as D. Now you see the IC = the 20 ba r RC on the previous page ! Remembe r, the IC should have a pproximately the same numbe r of ba rs as the RC.
1 1

. . � . - . ! .
. j . ! J A
t�JI " . i .... !,.
J.R. STEVENSON
. ;
08 /27/03 • I ' • . . . . . . . .
"':'8'3:" · · · · · ! · · · · · ! · · · · · ! · · · · · ; · · · · · i 12 : . . : ��! . ! ! . �
2 .. ; 24
; , ! : : . ; t .
. • . tl �llJr���f+i t . »ilt1�f� �t� ; iiil , Ul, ,4Jj , I f "
PIT. ; , C4PlIT. . . C3 <=�li 4 .
. , .
.. ..
, ..
: ...
.. ! .. . .. ! ..... : .
'! A � . ; PTE . . ! .... ! .. ; .. ; . . ! . .. j . .. ! . . . . .
.
. . . . . . : . ; .... j ... . . j . .. . . j ..... . . ! " ... i . . . i . .
, . ! . . . ! ... .. !
978.00
976.00
974.00
972.00
970.00
:::::.JI 1530 0930 1000 1030 1100 1130 1200 1230 1300 1330 1400 1430 1500 1530
!08-O8 Frida, 0930 1000 108·11 Monda\
(\ll'\l l,,111 I �IHI� ()lltlll I I ( \11 11:"_"11'-. Il'lt\ul ()< h,lI\--. 111111 I" ,[ l!.ld"- IlLllk ill ()lltlll. II ( ,I I \Uh '\l[\\\llk «(1111]1 111\ \1111 1111..1 \l.ldl'lll,llh." ", .. '1 1\lIlh 11ll\..'111 ,III.: (\\\ Ih.:d 11\ tlll,1t tl.."11llll\ l \)\\ lll1"" 1 111..: d,l!.! ,1111\\ 11 1111 111'- lh,111 1-.. I1h\(111\..,11 d,l!.! .1IHI 11Il( llllll'llt 11lIt)11ll,1l1l11l
CHART 7
REGULAR AND INvERTED CYCLES IN A DOWNTREND
1 . Not ice the down slo ping l ines on the first two [2] REGULAR cycles A-B-C. Th is shows that these two cycles are in a downtrend. The first is 9 bars in length and the second is 1 2 bars in length.
2. Not ice that there are two [2] INVERTED cycles B-C-D w ith down slo ping l ines. The first is 12 bars in length and the second is 1 2 bars in length.
3. Not ice also another INVERTED cycle B3-C3-D3 that starts at the 11 :45 bar and ends at the 13:45 bar. What is the trend of th is INVERTED cycle ? Answer: The slo pe ofTL between B3 and D3.
4. There are many other regular and inverted cycles not marked on th is chart.
5. We do not determ ine the PTT 'S ofthese cycles, as at th is po int, as it is MORE IMPORTANT that you reco gnize the REGULAR and INVERTED cycles qu ickly a nd eas ily.
6. After the conce pts are g iven, then you can re turn to th is chart and determ ine the PTT of each cycle. Your attent ion should be renewed if you do th is exerc ise.
7 . Note the PTT at 1 2:20 ET was not reached, suggest ing a stronger market, wh ich is what develo ped unt il the close.
12

PRECISION TRADING WITH STEVENSON PRICE AND TIME TARGETS
CONCEPT #1 PTT [PRICE AND TIME TARGET]
1. A REGULAR cycle will ALWAYS follow an INVERTE D cycle and/or an INVERTE D cycle will ALWAYS follow a REGULAR cycle.
2. The regular and the inverted cycles are expected to be approximately the same length. [Number of price bars or time.]
3. The regular and the inverted cycle must ALWAYS be CO NNECTE D to each other and considered as a UNIT for a PTT. A regular UNIT is marked as A-B-C-D and an inverted cycle UNIT is marked as B-C-D-A in all the examples.
4. A TL drawn between points A and C of a REGULAR cycle, CLONE D [meaning same length and slope] and moved to point B, will indicate the PIT for that cycle unit [CU] at the end of the cloned TL.
5. A TL drawn between points Band D of an INVERTE D cycle, CLONE D and moved to point C, will indicate the PIT for that cycle unit [CU] at the end of the cloned TL.
6. MOST IMPORTANT! Expect every PIT to produce ACCURATE RESULTS, EVERY TIME in both price and time. EVERY TIME!
7. Comment: A bas ketball player when shooting hoops, expects the ball to go in the hoop every time, not 50% not 90%, not most of the time, but every time. Li kewise, the PIT's are expected to be correct every time, BUT of course this is not possible. However by expecting perfection, when failure comes, much valuable information can be derived as to the fut ure direction of prices.
8. There are many cycles and cycle units of different lengths on every chart. This concept , when fully grasped, will let the trader select the length cycle to trade, thereby choosing an acceptable profi tlloss ratio that suits the trader.
9. A PTT is for one cycle unit. The larger the selected cycle is, the more time that is needed to reach the price target. There may be one or more smaller cycle units [CU] within the larger unit. [See examples]
13


PRECISION TRADING WITH STEVENSON PRICE AND TIME TARGETS
UNITS
The ke y to the PIT (price and time target) concept is understanding the concept that an IC (inve rte d
cycle) will follow a RC (regular cycle) and that the two cycles are connected with the same price action. The
two cycles will generally have about the same number of bars but this is not an absolute in the futures market
due to contracts ending and in some cases trading being stopped. In an Inverted Unit the connection is be
tween point C and point D and in a Regular Unit t he connection is be tween point B and point C.
Another point that is di fficult to grasp is that t he cycles grow from one point to another. For example:
from one low point early in the trading day, there might be another point 1 0 bars away and later in the day,
another low point develops 30 bars from the flrst point. T his 30 bar RC will become far more important in
giving a larger PIT and more time to get there than the smaller cycles. Examples given should help ma ke this
point more clear. The l Obar cycle and the 30 bar cycle may have the same starting point, but there will be 2
di fferent PIT's plotted.
Ifthe 30 bar cycle should develop when the l Obar cycle ends, then there could be 3 PIT's drawn: a
1 0 bar PIT, a 30 bar PIT an d a 40 bar PIT . There should be inverted cycles [IC 's] of 1 0, 30 an d 40 bars
also.
1 5


PRECISION TRADING WITH STEVENSON PRICE AND TIME TARGETS
PROCEDURE FOR MAKING A PTT IN REAL TIME
1 . Inspect the last few bars on the chart for either a high point or a low point. If price is ma king a high point, then
2 . Loo k bac k in time 1 5 -20 (or more) bars and see if another high point has been made. If so,
3 . Loo k for a low point between the two highs. What you have is an Inverted Cycle [IC] B-C-D.
4. Draw a TL between Band D, CLONE it and move to the low point C and the time and price a t the end ofthe cloned TL will be the target!
OR
1 . If the price in going down and appears to be ma king a low point then
2. Loo k bac k in time 1 5 -20 (or more) bars and see if another low point has been made. If so,
3 . Loo k for a high point between these two lows. What you have is a Regular cycle [RC] A-B-C.
4. Draw a TL between A and C, CLONE it, move it to point B, and the end ofthe cloned line is the PIT.
5 . NOTE: A cycle can be 3 bars or more in length but a cycle selection ofless than 8 -1 0 bars will not provide enough price movement to ma ke the trade profitable in most cases.
6. Generally spea king, the larger the cycle selected, the more accurate the PTT will be and the more profit will be available.
IMPORTANT
If the C point of a regular cycle is penetrated downside with a close, after a new PTT has been projected, then the PTT is ne gated, and should be deleted from the chart!
If the D point of an inverted cycle is penetrated upside with a close, after a new PTT has been projected, then the PTT is ne gated, and should be deleted from the chart!
1 7


PRECISION TRADING WITH STEVENSON PRICE AND TIME TARGETS
How TO TRADE PTT's IN REAL TIME
As previously stated, the PTT concept is not a trading method!
1 . Buy or sell as soon as the Cyclic Trend Line [CTL] is bro ken with a close or on the test ofthe CTL after a close above the CTL. See concept #2, page 2 1 .
2 . Buy or sell at the PIT, expecting a reversal at that point.
3 . Continue holding the position, in line with the trend of that cycle.
4. Trade the reactions or rallies caused by the small cycles, expecting the larger cycles to give more pro fit.
5 . USE a moving average method and enter when the moving average i s moving in the direction of the PIT.
6. Trade with the trend. The PIT will always give the trend of the UNIT that you have chosen to trade.
IMPORTANT
It is strongly suggested you enter the mar ket with your own trading method and THEN loo k to the
PIT's to help you manage the trade. If your entry is in line with the PTT, the odds are greatly increased that
your trade will be pro fitable. The use of stops is always advisable.
Once you become experienced in drawing the cloned TL's on the small and large cycle units, you will
be able to watch and understand market action and use it to your advantage.
Remember, the PIT's are derived from pure market action so what the market gives, is what you will
get. If the PIT's fall short, accept it, analyze the market, and plan the next move.
1 9


PRECISION TRADING WITH STEVENSON PRICE AND TIME TARGETS
CONCEPT #2 CTL [CYCLIC TREND LINE]
This concept was discovered while working with concept # 1 as a tool to confinn when one cycle has
ended and a new cycle [trend] has started. It can at times be used as a "stand alone" trading method. The proof
of the validity of this concept is in the results. It was also found that the trend line is generally ''tested'' before the
new trend starts. The fact that most technical patterns, or points of resistance or support are "tested" at least
once is well known by market technicians.
Normally this concept will be used to draw a trend line from point C to point D when analyzing an
inverted cycle unit to determine when the inverted cycle has ended and\or to draw a TL between point B and
C to determine when the regular cycle has ended.
This concept can be used on very small cycles but more accurate results will be obtained by using it on
cycle lengths of 1 0 or more bars Note: Examples will make this last comment more clear.
Originally this concept was called "cyclic trend line" [CTL] as it has validity in cycle analysis. What is
unique in this concept is that only one point of contact of the market action with the "cloned" line is needed. The
normal trend line in technical analysis requires two or more contacts to be a valid trend line. Occasionally, the
cloned line will have 2 points of contact with the price action, adding confinnation to the importance of this line.
You will notice, after seeing examples that more often than not, a break of the CTL line by a close will
be followed by a pull back, touching the line [test] before resuming in the direction of the breakout. Patience,
waiting for this "test" will often be rewarded with some low risk entry points.
Drawing the CTL: At the extreme high of point B draw a line to the extreme low point at point C. This
basic line is then cloned [meaning same slope] [length is not important]. Now slide the cloned line to the right
until it touches a price bar that is the largest distance from the basic line between points B and C. When a close
breaks this line, the trend direction should change. See example on the page 23 .
2 1

J .R. STEVENSON
For a change from a trend going up to a downtrend, draw a line from the extreme low price at point C
to the extreme high price at point D. Clone this line and move it to the right of the base line until it touches one
point that is the largest distance from the base line. When a close breaks the cloned line, the odds are high that
the trend will change. See example on page 24.
NOTE: Users of this concept have found excellent entry points by the breaking of the CTL or on the
retest of the CTL, often it is broken. The two minute charts often reflect some good profitable
entry points with good profit potential. Stops are suggested for all entries!
22

PRECISION TRADING WITH STEVENSON PRICE AND TIME TARGETS
.......... i'" . � .
a .. \: .
c
0 8 / 2 4 / 0 3 1 9:38:14 . . .
............ ! .............. . ···32.0000 ;
···26.0000
17 24 31 7 14 21 28 5 12 19 27 2 9 16 23 30 7 14 21 28 ADr Mav Jun Jul
CHART 8
CONCEPT 2
This is chart #4 revisited. Likewise here, to detennine if the cycle from B to C had ended, a TL was
drawn from point B to point C. This TL is then CLONED and shifted to the right until it touches a single price
bar, as shown. A close above this TL suggests quite strongly that the cycle from B to C has ended and the first
part of the regular cycle has started up.
Other examples will show this is a very valuable tool to help make timely entries or exits from the
market.
Caution is suggested in drawing the basic TL too quickly on small cycles. A good rally, or correction
should be present between the basic TL starting points to avoid "stopouts." A reversal or spike reversal bar is
also helpful in drawing the basic TL.
23

. . ! .
J.R. STEVENSON
0 8 / 2 4 0 3 1 9 : 3 4 : 1 9
! !
c
j � j . . . . ! . . . . . i . . . . . � . . . . . ! . . . i . . . . . i . .
! . i ! . . ! . . . . . i · ! . . . . ! , . ! . . . . . ! .
1100 1130 1200 1300 1330 1400 1430 1500 1530
CHART 9
CONCEPT 2
. . l:ID4.uu
. . · · 982.00
· · 980.00
· · 978.00
. . 976.00
974.00
· · 972.00
. . 970.00
968.00
0930 1000 07-01 Tuesda
Let's revisit chart 2. We had mentioned that concept #2 might have helped you decide to go short near
point D.
Concept 2 is as follows:
1 . A basic TL is drawn between the point C and point D. [The length is not important in this concept but
the slope is.]
2. This TL is then CLONE D and the cloned line is shifted to the right until a price bar is touched as shown.
3 . When the price closes under this trend line, the odds are high that the previous cycle has ended and the last part ofthe regular cycle has started.
NOTE: the TL drawn from the extreme low point C to the extreme high point D is a valid TL as it shows exactly when the TR started up and when it ended. The CLONE D line therefore, by association, is a valid TL. Also, when a PT exists as at point "D," the basic TL should be drawn to the last bar of the PT.
24

PRECISION TRADING WITH STEVENSON PRICE AND TIME TARGETS
How TO SELECT THE BEST CYCLE TO TRADE
1. Let the market tell you!
2. If the mar ket has been very volatile , smaller cycles around 8-10 bars may work the best.
3 . On a rather slow moving "trading range" type market , longer cycles above 1 5-20 bars are more accurate and provide more profit possibilities. See chart 23 for example.
4. Generally cycles 8 bars or less are not tradable but do provide good mar ket analysis.
5 . To prevent over trading, select cycles 20 bars in length or more.
6. Small cycles can be used to counter trade the trend of a larger UNIT.
7. Try to select a cycle UNIT where the PIT will fall within the day trading hours.
8. By dropping down to a shorter time frame , the PTT's may become more accurate and easier to observe.
25

PRECISION TRADING WITH STEVENSON PRICE AND TIME TARGETS
How TO TELL WHEN A CYCLE HAS ENDED
1 . Use the CTL method or concept 2.
2. When time and price has run out on the current cycle.
3 . Watch for certain price patterns to develop around or near a PIT.
4. Watch for "spike reversal" or reversal bars after an extended move.
5 . Watch for volume spikes, which often develop at the PIT's, especially if a very oversold or
overbought condition exists.
6. When the momentum dries up after an emotional large move, especially if a PIT is near.
7. After an extended move of 5- 1 0 points, study the market swings for indication of a reversal
as noted above.
27

PRECISION TRADING WITH STEVENSON PRICE AND TIME TARGETS
WHAT IF THE PTT MISSES?
USING THE PTT AS AN ANALYTI CAL TOOL: Even though every PTT is EXPECTED to be on ta rget ,
both in time and p rice, the reality of the ma rket place gives diffe rent results. Since the re is un known news ,
suppo rt and resistance levels , di ffe rent trends, p rofit ta king, sell and buy p rograms , and a million othe r reasons
fo r trading, it is amazing that even one pe rfect PTT can be on ta rget. On some days it has been obse rved and
p rojected 3 o r mo re nea r pe rfect PTT's. Of cou rse the re a re many p rojections that do not reach the ta rget so
how can this appa rent "MISS" be used to the t rade rs advantage? Are these "MISSES" to be conside red
failu res? Do we say the concept is wo rthless? Befo re it is thrown in the t rash can, a few othe r inte rp retations
will be suggested:
1 . The p rice target falls sho rt in a regula r cycle unit: often indicates that the cycle selected is wea ke r than expected and the market may decline with a possible trend change if point C is ta ken out. See cha rt 10.
2. The price ta rget falls sho rt in an inve rted cycle unit: often indicates the cycle selected is st ronge r than expected and the ma rket may rally with a possible trend change if point Dis ta ken out. See cha rt 7.
3. In a regula r cycle unit , ove r shooting the ta rget , suggests a la rge r cycle is dominate and long positions should be held: conve rsely, ove r shooting on the inve rted unit suggest a weak ma rket and sho rt positions should p robably be held.
4. A p rice ta rget of a regula r cycle that is hit ea rly could indicate a wea kening market o r an accele rating ma rket and this depends on the trend ofthe large r cycle in the ma rket.
5 . A p rice ta rget of an inve rted cycle that comes ea rly , could indicate a strengthening ma rket o r an accele rating trend to the down side.
6. The time ta rget is gene rally mo re reliable than the p rice targets , as trade r's habits and emotions are mo re firmly established in the market place. To illustrate this point, notice how many cycles have app roximately the same numbe r of ba rs !
7. NOTE: The re a re many othe r possibilities that exist with the PTT's. A study of the conven-tional cycle theo ry would be helpful but good obse rvational habits should se rve the trade r ve ry well.
29


PRECISION TRADING WITH STEVENSON PRICE AND TIME TARGETS
BASIC QUESTIONS
The chart examples that will be shown in the balance of this manual should answe r most ofthe follow -
ing questions. You will need a cha rt se rvice that allows quick and easy const ruction of t rend lines and be able
to CLONE the lines. No othe r tools a re needed fo r the PTT's but I have found that a 5 ba r RSI and a l Oba r
moving ave rage to be helpful and suppo rtive at times when trading , but the indicato rs a re not used fo r signals.
Q. Do you sta rt with a regula r o r an inve rted cycle?
A. See Cha rt 1 3.
Q. How do you know when a p rice move [cycle] has ended?
A. See cha rts 4, 5 and 1 6.
Q. What length cycles should I look fo r to t rade from a 5 minute cha rt?
A. See cha rt 1 5.
Q. How do you know which cycle will wo rk?
A. See cha rt 1 7.
Q. Can a la rge cycle have smalle r cycles within it?
A. Yes, see cha rt 1 4.
Q. How do you know whe re to sta rt the analysis of a cycle?
A. See cha rt 1 3.
Q. Do I use the same length cycle th roughout the day?
A. No, the cycle lengths will expand.
3 1

J.R. STEVENSON
Q. Are there price patterns to look for at the turning points?
A. See chart 8 and also page 27.
Q. Will cycles keep me from over trading?
A. Selecting larger cycles will reduce trading.
Q. Is the PTT concept a trading plan?
A. Not normally.
Q. Is night data used for PTT's?
A. No, because volume is not large enough.
Q. Can the data from one day be used to find PTT's for the next day?
A. This is not recommended for day trading.
Q. When a CT or CB has multiple bars with the same price high or low, how is the correct point
chosen?
A. Have the TR extended to cover all the bars that are equal.
Q. Why is perfection expected of every PTT?
A. See page 3 , "Overview of Concepts."
Q. What do you mean when you say that a regular and an inverted cycle must be connected.
A. See page 1 5, "Units."
Q. Will knowledge of conventional cyclic theory help in working with the PIT concept?
A. Not necessary.
Q. How can the PIT help confirm other technical patterns that develop in the market?
A. See chart 1 8 .
Q. What makes cycles work?
A. See page 45.
Q. Can more than one PTT be drawn at the same time?
A. Yes, see charts 1 4 and 23.
Q. What about countertrend trading?
A. See Trading Tips on page 53.
32

� . ! .
PRECISION TRADING WITH STEVENSON PRICE AND TIME TARGETS
5 0 0
' ! i .
. . .. ;
. .. ;
. . .
©2 0 0 1 Quo t e . com 0 9 / 0 1 / 0 3 2 0 : 0 1 : 3 5 . .
. . • I • •
. . , .. . . . . . . . . • . • . i fl • t.j .�, , : I I 4I . ! .
1006.00
1004.00
I 1002.00
. I · · · · · I · · · · · i .
..
.
. ; . · . . · i . • . . . . . . . . 1000.00
! ' ! ' . !
998.00
40.00
( �)I)\llghl ( ,2()O-'+ ()unll' I I ( \11 1 1 �_dlt ... 1l.· ... ".:I\ l.·d ()( 11.1It-. ( 1 m ) 1 ... ,\ 1t.ldLlll,llk nl ()U(I!I,: I I ( ,I 1\1".\1..., '- 1..[\\ \11 k ( (1111 1',11\\ \ 1 1 ( 1 l 1 1 l. 1 \1 IlI .... lll ll k ... .... 1..1 I'llth Ih .. ' l l.'1I1 ,II i..' \1\\ IlL'd \1\ tl1l'lI h .. • ... pl.'LtI\ I.· ()\\ Ih.'t" 1 111...' d,ll.l ... hl)\\ 11 111 thl'" I...ILll l 1-. hl ... l\llll.. .tI 11 111 11111 \Jll[ \,.1111 ... lll 111 1 1 11111 111(111
CHART 10
FAILURE A ND SUCCESS
1 . A trend line fro m A to C was drawn and then CLONED.
2. This cloned TL was attached to point B and the end of the TL is the PTT for the cycle.
RESULT: A high point was made at point D [one of the three bars] but the price target fell way short, suggesting weakness and a likely decline. Note the TR of the RC was u p fro m A to C but the TR of the IC turned down,
also suggesting a change.
3 . A TL is drawn between Band D and this TL cloned.
4. This cloned line is attached to point C and the PTT was hit right on.
NOTE: The TL ofthe next s maller RC is nearly flat, suggesting that another change may be ahead. As can be seen, an 8 point rally did develo p. These cycles are generally too s mall to trade, but they illustrate the points of "failure and success."
33

J.R. STEVENSON
5 minute - QCharts ©20 0 1 Quote . com
. 1 . . . ' . . . . . . .
� . . . . . . ! . . . . .
. . . . . . . . . . . . . .
i
. !
. : . : . . t . : . . : . : . . : . : . . ! . ! . : .
. . . . l . !
. . . . ! . . . . .
;
i .
. . . . . i · · · · · i ' "
CHART 1 1
1 0 : 32 : 4 6 . : . : .
. ! . . . .
07/ 1 5/03 started with small cycles and rather "choppy" market action. These small cycles are not
tradable but going to a one minute chart can be helpful! See next chart.
34

PRECISION TRADING WITH STEVENSON PRICE AND TIME TARGETS
CME : ES 0 3 U , 1 minute - QCha rts ©2 0 0 1 Quote . com 0 7 / 1 5 / 0 3 1 0 : 3 0 : 5 3 -"'�""''''''!---- . . . j_ . . • • • • • • • • • • • i· · · · · · · · · ·�-:-:-:r:·:·:·:·�":·:··:�:·��-
·i:-:-:=· . . . . . . . . . . . . . . . . -!"'-" '-¥'::'�':': . : .. :�.:.:.: .. :.:.�.:.� .. :.:.¥ . :".�':. :":':'7'_" __ . . �; . . . . . . i · · · · · · · 1012.00
. . i
-. . . . . ' 1 " , - , _ .
. . j
. . !
. . i
1500
. l . . . · : · . . · · · · · · · · · 1 · · · · · · · · · · · · ! · · · · . . . . . . . . . ! . . . . . . . . . . . . . . . . � . . . . , ! . . . . . . . . . . . . . ; . ! . . 1010.00
· · · · · 1 · . . . . . . . . . . . . . .
j . . . � . . . . . . . . . . .
. . � . . . . . , ; , . .
!
. . . !
. . . . . ! . . . , . . . . . . . . . . . . . . . . . . .
, . · · · · · · ! · · · · · · · · · · · · · · 1 · · · · · ·
·· · · · · · · ! · · . . . . . . ! . . . . "
· · ; · · · · . . ·· · · · · ·
· 1 i •
· · · · · · i · · · · · · · · · · · · · · ; · · . . . . . . . . . . . : .
1515
. !
1530 1545 1600
. . · · · · · . . . . . . . i . . . . . . . . . . . . . . i . • .
. . j . . . . . . . . . . . . . !
. .Le " ' i ' . · . . . . · . . . . . i
. . ; . . . . . . . j · · · · · 1008.00 I I • . . . . . . : . . .. . . . . . . . . . . L . . . . . 1006.00
i . . . . . . . ! . . . . . ! . . . . . . 1004.00
" j . . . . . . 1002.00
. . . . . . 1000.00
. j . . . . ! . . . . . . 998.00
. . . ; " ' ! " . . . . . . . . . . . ! . . . . . . . . ' ' ' ' ' 1 - 996.00
: i : � . . . . . A::B::(:>= lRtCULAR CYCLE i · · · · · · . , . . . . . . . . . .. . . , . 994.00
B-C-D � IlNVEinED CYCLE i , A-B-C-D = 1!tiE'Gu'i1Rtji�ii iN A DOWN TiulND · 992.00 . . ! . . I ' • ! . . ! . . ! . . ! .
0930 0945 1000 '07-15 Tuesda\
1015 1030 1045 1100
« (ll" "' Ill ' 1tHI� ( 1 IHll\. I I ( \ 1 1 I I ' hI-- 1 1.. .... \,. 1 \ 1....1 (.It h,l l h ( Itll ) h .1 11.llk-m.1 I "- (ll ()unll..' I I ( . • 1 I \ u)" ' I..:l\\ lli k « (II11p.lI1\ \11 (11111..' 1 1t .ltiL'lll,l l k, "I..! I, Q 111 1 1 1.. 1 1.. 1 11 t i l,. ')\\ lluI 11\ l i ll i l 1 l'''I'I..I..! I \ 1.. \1\\ 111.. 1 " I lll.. lLIl.t ... 1 II 1\\ 1 1 1 11 th l .... ll1,1 1 1 [ -. 11 , .... 111 1 11.. ,1 1 d,II,1. ,lIlll rHll 1..11 1 1 LIlI 1 1l I nl lll,ItI(lIl "
CHART 12
The regular cycle A-B-C gave a near perfect PTT on this 1 minute chart. A-B-C-D is a good example
of a regular unit [ RU ] in a down trend. Soon after the printing of point D, a small regular cycle [RC] was
fonned with an uptrend, suggesting higher prices.
This RU was tradable as 2-3 points were possible if you had a timely entry near point C.
35

. . . l .
. ! . . i . . . . i · ' ! ' . . j .
J.R. STEVENSON
0 8 / 10 / 0 3 1 6 : 37 : 3 1 , . , . ! . , . � I O.VV
- ;
- 976.00
« lP\ Ilt'lli ( .:'I JI I� 1)II(lk I I ( \ 1 1 Ilelih I C-"-I\ c-d 1.1l 1i.l I h 1 1111 1 " .1 1 1 .ldclll.l I k (II ()II(lIC I 1 ( _ " [ �l(" '\ c'III (ll k « llllp.lll� \ 1 1 (lilic-I l i ddclll.lI k, 'ci
hu lll 11\..'1 \..' 1 11 .1I 1,.' U\\ lh.'d 1)\ [111.. 1 1 h . ... pl..'lI l \ \.. \1\\ 111..· 1 .... I h\..' ddt.1 .... 110\\ 11 III til l " dld l t h h l :-.1ul h.:.i I ddt.! . • 1Ilt! nul ult l L'Il1 I Il I PI Ill.ll li.l1l ,-
CHART 13
REAL TIME ANALYSIS FOR A PTT
At 1 3 : 1 5 ET this cha rt would be available to analyze. A quick glance would show the t rend on the
regular cycle [RC] [A-C] was up and the re was a high point B between the two low points. Since all the RC
since 1 0 1 5 had been up and the last cycle was a RC, we would expect that an inve rted cycle [ IC] would
follow with about the same length cycle as the RC.
A t rendline was d rawn from A to C, moved and then cloned to point B. The end of this cloned line is
the PTT.
Befo re looking at the next cha rt, caution is advised to use stops because of the small double top [DT]
that existed between 1 2 :30 and 1 3 :00. You might also note that the re were 1 3 ba rs between A and C. [the
fi rst ba r A is counted as 1 ] .
36

PRECISION TRADING WIlli STEVENSON PRICE AND TIME TARGETS
c�� : �s:o �u ! :5 min:U�e . -: qChaor�s . c:3��h9fO�� . <?O!O · !
• j
· !
· !
_ i .
l � , . . . . : . . . . . ! . . . . ' 1 "
! •
. . : . . . . . i · · · · · ! · · · · · :
1400 1430 1500 1530
CHART 14
RESULTS FROM PREVIOUS CHART
. ! � . • 0
�
. . . . i 974.00
. ! 966.00
The fIrst PIT [# 1 ] fell short in price but did form a "time" point. After the fIrst cycle ended, another
small cycle formed by an IMPLIED POINT [IP] forming on the 1 3 : 1 5 time bar. This resulted in a large trend
line [TL] fram A to the 1 3 : 1 5 bar and another PIT for 1 3 :30. This also was short but then the trend line TL
from A to the 1 4:04 bar resulted in a PTT that only missed by about 2 tics.
The falling short of several PIT's soon resulted in a large decline until the close. Note the fIrst small
inverted cycle [IC] after the 3rd PIT had a downtrend, as did all the other cycles that followed.
37

J.R. STEVENSON
CME : ES 0 3 U , 5 minute ( all sess ions ) - QCharts ©20 0 1 Quote . com 0 8 / 12 /0 3 0 8 : 35 : 31 _ I • l • ! . I • I • ! . I • I • ! . I • I • ! . I • I • ! . I • I • ! . , . t • ! . I • I • � • I • I • ! . I • I • ! . I • , • !
' ! ' ! ! i ' . ! . . . . i ' " . . ! . . . . . i . . . . . ! . . . ! . . . . . ! . . . . . ! . . . . . l . . . . . i .
. . . . ! . . . . . i · · · · · ! ·
. . . i · · · . • ! • • • • • i . · · · · i · · · · · ! · · · · · i · . • · · i · · · · · ! · . ,
CHART 15
. . ; .
CYCLES IN THE PRE-MARKET CHART
I • t • I • I • I • I • I • �ut).uu
. . . . ! . . . . . ! . . . . . !
i i
· 980.00
. . . . 979.00
, . . . . . 80.00
. . . · · 60.00
There has not been enough volume in the night trading to produce good cycles or entry points. How
ever, from time to time, I do check the "all sessions" chart as was done on 8112/03 and a couple of good PIT's
were available. The one marked 1 was made first and then CLONED. The target fell a tic short as did the 2
PTT when the chart was printed.
NOTE: The volume and liquidity in the night trading seems to be increasing, so it may develop some good PIT's in the pre-market trading. However, the data from night trading cannot be used to develop
a PTT for the day session.
38

PRECISION TRADING Willi STEVENSON PRICE AND TIME TARGETS
E-Mini, S & P 50� ( SeI? ' , 2 0 � 3 ) 5 minute - QCharts ©20 0 1 Quote . com 0 8 / 1 1 / 0 3 1 9 : 22 : 2 4
. i
1100
• • I • • • • • I • • . . . . . : . . . . . I · · · · · • . . • • • . • • . • • • . . I ' "
. . . . . � . .
« ( I I)\ ! I ...! l 1 ! ' ' I ) ( I � (.)\ I \ ' I L 1 [ ( \ 1 1 1 1 1 1 1 -.. 1 "' ''I.. [ \ l. l [ (,l( 1 1 , 1 1 1-.. 1 ( 1 1 1 ) I " , \ I t , ll ll(1 ) I I !,. , , 1 (.) I J I 1 l l I I ( I 1 \ \,. \ 1 '-. '\ ,, [ \\ \ l l k ( , 1111 1 ' 1 1 1 \ \ 1 1 \ 1 1 1 1 1.. 1 1 1 il IL t l l , [ I !" " "I.. I
1 ( 1 1 1 1 1 1 11.. 1 1.. 1 1 1 I I \.. ('\\ th.,! I" 1 1 1 1.. 1 1 I I. "I'Ll.. 1 1 \ I.. \1\\ 1 1\.. 1 " 1 11 1.. d,I!. 1 .., 1 1( 1\\ 11 1 1 1 , 1 1 1 -.. 1..11 1 1 1 1 -.. 1 1 \ '> 1 1 ' 1 11. tI d I l l 1 1 111 1 1 I l ( 1..11 1 1 l 1I \ 1 11 1 ' 1 I 1 1 1 1 1 HlIl
CHART 16
CONCEPT 2
A basic trend line is drawn from the highest point at point B to the lowest point at point C. This shows
where the uptrend stopped at point B and where it stopped going down at point C. This basic trend line [BTL]
is cloned and shifted to the right until it just touches one point on the 1 1 :35 bar. The high point of this bar puts
the cloned line the farthest from the basic line. When a close develops above this CTL, the chances are good
that a new cycle has begun.
The same procedure is performed from point C and point D to tell when a down move might develop.
The move did not continue far on the last CTL but with stops the trader would not have lost. The CTL's are
found to be more effective on the larger cycles.
39

J.R. STEVENSON
( "1'\ 11,"1 1 1 ' .:'I III� ()1I"iL' I I ( \ 1 1 "t,(lh I c''C'" C''' ()( h " , h 1 1 111 1 " " I I ,Ilklll,l I " "I ()lI"lc' I 1 ( , " I \ u" '\c'I" "' " ( " "'1',1 1" \ 1 1 "Ihc" 1 ' ,Ilk,"" II .... 'C'I
1 \ l l tl1 hC1 1..' 1 1 l .lI l.' U\\Ih:d 11\ th l..' l 1 I L· .... PI..'ll l \ L· p'\ lh .. · t .... I he ddt.! .... IHl\\ 1l III til l .... lIl,1 I 1 I ... 1 1 I .... lll l l l·.I 1 d.II.1. .1I11l llut Ull t L' t l l l l l l lll l ll. lt lll ll · ·
CHART 17
REAL TIME TRADING
This PIT was made in a chat room about 1 4: 1 5 ET and was witnessed by 8- 1 0 traders. The PIT was
for the price to be at 994.25 by 1 440, about 1 hour 25 minutes in advance. On 1 440 the price was hit to the
very tic and then rallied over 9 points.
Another call was made soon after the PIT for a close near 1 002.50. This is another good example of
how the I C is connected to the RC as the price action from C to D is the last half of the I C and also the fIrst half
of the RC from C to D.
This CONNECTION is the KEY as to why the PTT concept works so accurately.
40

PRECISION TRADING WITH STEVENSON PRICE AND TIME TARGETS
� . . . t f , j
. . . ; . . . . . � .
·R
0 8 / 2 9 / 0 3 1 0 : 20 : 20
1 ! " i 1 · · · · · 1 · · · · · i · · · · · j .
. , :I:I:I.uu
. , 998.00
· 994.00
· 993.00
· 992.00
7'-��+--::;r+-t---i---hPr-i----;"-�--+-t=�H-+;'-'--..i--+---+--+--';"'-1· 80.00
' ! ' . 1500 1530 0930 1000 1030 1100 1130 1200 1230
D8-27 Wednesda\
. . 60.00
1500 1530
( "P� I I !,!hl ( �()()-+ (.llI"l� I I ( \ II I I!,!hh I �,�n L't! ()( h'lI h ( 1 m ) I' .I II dlk-m,I I " 01 (.llIlllC I I ( . ,I I � Cll' 1\cl\\ "I � ( " mp,lll� \ II lllh�1 II ,llk-m,1I b 'ci
I tllth h�l l' l ll ,I l l' U\\ I lL'd h\ thelt I l· .... 'K·Lt I \ L' O\\ t1L· ' .... I h l' ddt,\ ... IHH\ 11 I II t h l .... LiI.!1 1 , .... il istul lL',iI d,II.! . .I11<.l l1ul ll l l l L' 1 l 1 1I1 I o l lll.ilHlIl "
CHART 18
This call was also witnessed i n a chat room. The measured target from the small double top [DT] was
994.50. After the small Ie formed, a PTT was made at 994.50, the exact same price target from the DT. The
PIT confirmed the DT objective! There were many other PTT's available during the day.
4 1


PRECISION TRADING WITH STEVENSON PRICE AND TIME TARGETS
. s . ?':r::easu�y Bonds I::-Ie,l . ( ?E7P .. . 2.00 3) , { .o�l,a¥l.O t , . � ,m�nu�e -:-. Q<0 8 1.2 1 0 3 2 0 : 30 : 54= . c :.-'-'..+'-+-'--'-'----+-'-'-i----+-in't'::'l:'-::'�'-'-'-!_"_'_�+_'i -'--'-'-,+,' '
C-'-' -'-' .
'-'-.�. '-'-' • -'-' '--" +' �,--,+i
.-...:..-...........
'
, . 107 '00 I
. ! . . . . . . . " ! "
- If . i . .
' 1
o
. : • • . • • " ' " I .
i .
. i .
'1
. . .
· 106 '24
· 106 '16
· 106 '08
· 106 '00
· 105 '24
· 105 '16
���--�+-�---H����Hr--��
�--����--�--+_���_+�--�---· ·�!�· 80.00
· 60.00 , .
. . . . , . . . ' . ! . . . . . ! . . . . . ! . . . j . . . . , . . . . . j . . . . . j . 20.00 1000 1030 1100 1130 1200 1230 1300 1330 1400 1430 0830 0900 0930 1000
108-27 Wednesda\
( np\l lL'ht ( �()()-l ()llPII.' I I ( \ 1 1 1 1 !. ... dl h ! \,. • ..,\....!\ \ .. ·d <,)( h,l I \-. ( 1 111 1 ' .... ,I I I. I dl... III I l k ,d ()lhl(1... I I ( ,\ I \ L,h '\ I..\\\ ill !.. « (11111),111\ \ 1 1 illhl..' ! ILldl..,Ill,l l k .... .... L't lill ll1 1 11. 1 1..' 1 11 ,II I..' ,1\\ lll'd h\ :llI.. 1 I I l"lh. 1..1 1 \ \. \1\\ 11\..1 .... 1 1li.. d \1 1 ... llil\\ t1 I II t il l '" \.. 11.1 1 1 \ ... 1 1 1" \ 11 1 1 1.. ,1 1 d,ILI ,llld Ilill 1..11 1 1 \..' 111 1 11 1 111 111.1 1 1 1)11 '
CHART 1 9
As THE DAY PROGRESSED
The TL's marked with a number and C are CLONED trendlines in sequence as the day progressed.
Note that the slopes ofthe TL's are up except for #2, which is sideways.
Note also that a PIT made from a regular unit [RU], will have an expected high and if drawn from an
inverted unit [IU], the expected PIT will be a low. There are four PIT's in about 3 hours time. Could you have
profited with this advance information?
Can you fmd the longer cycles that would give you more time to enter and to reach the PTT?
HINT: Draw a line from the 1 0:20 low to the 1 3 :45 low and clone it from the high at 1 1 :05.
43

. . ! .
! .
' " i . . . .
. !
1530
! . ! .
. . : .
. i · 1 " . . · ! . . . . . j .
• • j
0930 1000 1030 1100 1130 08-25 Monda\
J.R. STEVENSON
. j
! •
CHART 20
o / 2 5 / 0 3 2 1 : 5 6 : 1 5 . , . , . , :J:JO.uu
, . ! . . • • . • • • . . • • . . . 996.00
� . . :
, . . ' > ' Pri· l · ...
: m»�tf 62.00
f. . . . . , . . . 990.00
i . . . . . . . . . . . 988.00
! . . j
. . • . • j . . . . ! . . . . . ! . . . 986.00
1430 1500 1530
MULTIPLE BARS AT THE SAME CHART POINT
Point A has 3 bars with equal lows. Point C has two bars of equal lows. In a situation like this, the TL
A-C is drawn to include all the bars, to make the line as long as possible. When the PTT is drawn the PTT
should fall within the maximum length of the cloned TL. In this example the PIT fell one bar short of the TL.
In this example, the A starting point could have been on the 1 1 :45 bar and the cloned line would have
given a perfect PIT on the last bar ofthe day. It is impossible to determine which of the 4 bars at point A is the
exact cycle low. By enclosing all ofthe bars, a PIT should fall within the cloned TL!
44

PRECISION TRADING WITH STEVENSON PRICE AND TIME TARGETS
ABOUT CYCLES
What are cycles? Where do they come from? What causes them to work in the market? What is the
cycle theory? Many questions like these have been asked. lt is beyond the scope of this manual to discuss the
conventional theory of cycles but I will try and explain a few points that may help you in using the PTT
concepts.
As a starting point, some have stated a cycle is an event that repeats in a somewhat regular interval of
time. For use in this manual, an event is when the price stops going up and forms a high PT or stops going down
and forms a low PT. (See glossary for explanation ofPT.)
Understanding the PIT concept does not require knowing the reason behind this change in EVENT.
Cycles are caused by people putting in orders to buy or sell for a thousand different reasons so you would
imagine that the market place would be completely random (some think it is) but careful observation suggests
that habits are formed and patterns are established.
Conventional cycle theory suggests, for example, that if there is a price low [pt] every two hours, there
should be another low in two more hours, which may be a larger low since it is also a four hour low. Not all
cycles will have harmonics but many do.
lt is also assumed that the longer a cycle is in length, that the number of points from the low to the top
will be greater. This is true most often, but many small cycles can have very large amplitude, if fueled by
emotion.
Cycles are not always symmetrical, that is the high does not always come half way between the two
lows. Depending on the interaction oflarger or smaller cycles, forming a trend, the highs may come very early
or very late in the cycle. This is called "Translation." The PTT concept handles this complicated characteristic
by analyzing the failure to reach the target or by the fact of reaching the target sooner then expected. [see page
29 about "WHAT IF THE PTT MISSES?"]
45

J .R. STEVENSON
For further reading and study on cycles the following sources are suggested:
1 . Cycles: Selected Writings, Edward R. Dewey 2. How To Make Money in Commodities, W.D. Gann 3 . The Magic a/Stock Transaction Timing, 1.M. Hurst 4. Explore the many web sites containing information about cycles.
These and other books on cycles are available at http://www.traderspress.com.
46

PRECISION TRADING WITH STEVENSON PRICE AND TIME TARGETS
s e s s i ons ) ! . . ! .
- QCharts ©2 0 0 3 Quot e . com . ! . . ! . . ! . . ! . . I • • I • . .
1 1 / 0 1 / , .
'I-I _""""'"-_""""'"-_""""'"-..::IL42"'---___________ --I1 : ]...;....; . .............. "'O"'-"'-.............. Zjr.lj6t;....;. . .......... ....... ;...;....; . .......... ..j...fl
. I : 14 1 , , , � � : , . ,
16
. . . . . . . . . .. .. . . . .. . . . .. .. . ..
16 I 16
3 1 9 : 0 5 : 4 9
' j I · .,1 054.00 ; I . .
: . . 1 052.00
· . 1 050.00
la . 1 048.00 · � . ' .
' I 1----+-�L....;._+_-..... --......t_---' ......... 01----'--__;r_;_-.......... !---_+_-....... -'---_+_-....a.;...<--�: 1 046.00
I · ' 11044.00
'----:-L------'-,...,.--.J-.-...--.-..... i .... , •. " . ,." ." " ,_,i.,_::--�, :-::-----::::,=i -::--:-:,,::-i =----:-::,=i . �._ .. �_ ... _.L ... _,_ ... _�i -::---:-:,,::-i =-----..l�-:'_:_c_--1 1 00 1 1 30 1 200 1 230 1300 1330 1 400 1430 1 500 1 530 1830 1 1 �2 Sun
( (1 11\ I I , I l l � ' ( ) ( I . ()llll[\.. I I ( \ I I I I ' I ll" h. "l I \ I. d t )( I I I I I" I 1 1 1 1 ) I " I 1 1 1\ I� III I I I, \ d ( h II l( I. I I ( I I \ l \ h ,, \,. ( \\ \ I I k ( (I I nl' III \ \ I I \ i l i ll I I Lldl.. 1ll. 1 t k .... "LI [ l l l l l , I ll l l l ll I I I il\\ tl\d I�\ I lh . 1 1 1 " "' I'll l l \ , ' \\ ll l l " ! I II (1 1 1 1 "lhl\\ 11 III 1 1 1 1 " .. Il i i t 1 -.. 1 1 1 -,1 \ 1 1 1 1. I I 1I I I I 1 1 1 1 1 1 1 1 1 \ l ll l l lill 1 1 1 1 1 1 ] 1 1 1 ,1 1 1 \ 1 1 1
CHART 21 COUNTING BARS
The PIT concept states "A regular cycle will follow an inverted cycle and/or an inverted cycle will
follow a regular cycle and each cycle unit will have approximately the same number of bars.
In the above chart of October 3 1 , 2003, the RC lengths are shown across the bottom and the IC
lengths are shown across the top.
Whether you start counting with a RC or an IC, the UNIT will have approximately the same number of
bars. The longer 26 bar cycle and the 42 bar cycle also illustrate the validity of the concept statement.
When there are several bars forming a single point, including all the bars will in most cases be the
correct count.
Notice that the TIME targets are often even more accurate than the PRICE targets.
Adding a price pattern requirement to the time targets might provide a timely way to enter the market
at the PTT or CTL and with trend consideration.
It is suggested that the bars be counted each day for a while to confIrm that RC and IC have approxi
mately the same number of bars and that the market is not random!
47

: 1
- No 4 fell short,subgesting higher n\kt · . , , .
all 0 rPTT"� [6] hit their targets
1 6 I 10 1 1 11 0-24 Fridav
J.R. STEVENSON
12 13 1 4 1 5
1 0 / 4 /0 3 1 6 : 27 : 5 5
1 028 . 00
1 02 6 . 00
. " 1 024 . 00
. ; , 1 022 . 00
, ; , , 1 02 0 . 00
" , ' 1 0 1 8 . 00
' " 1 0 1 6 . 00
1014 . 00
1 6 ---I 1 0 -27 MoncU1
( nl'\ I I " 1 I 1 ( )(1 1 1 1 ' 1111" ,,- I I ( \ 1 1 I I ,hi, I �, .. I \ ,,-d ( I( 11.11 1'-. 1 1 111 1 I" ,I tl.hlllll ll k , I ( 1III'l\. I I ( I I \ � (h ',\.. 1 \\ 1 1 1 1, t (lilli' t tl\ \ J ! \ l l lll[ I r ,ld ... lll l r k , "I..!
1 1 1 1 111 1 h.. 1 1. 1 1 1 , I ll �)\\ Ikd \1\ 1 1 10._ 1 1 1 "-"' 1'1.1.1 1 \ 1,. \1\\ 1 1\,. [ , I ll ... d, ILI ,11\1\\ 1 1 I II till" \. 1 1 , 1 1 1 h h I - ttl! !>. . . !! \1.11.1 , ! l Id Ililt ... 1l ! l llll ! ! 1 I 1 ) I IIt.lt l , 1 I 1
CHART 22
GUIDANCE THROUGH THE DAY
At the 1 0:35 bar, the first PTT could have been drawn as shown at the end of the TL I e. From that
point on, the PIT's were drawn as the chart unfolded during the trading day. Notice the trend changing as you
follow the slope ofthe TL on the regular cycles. Since every PIT is expected to be accurate, the "falling short"
at #4 was very important in analyzing the future direction ofthe market.
48

PRECISION TRADING WITH STEVENSON PRICE AND TIME TARGETS
, . ! . .
. . i · · ·
1500 1530
, . � . .
, , , , , 1 1 32.00
1 130.00
' 1 128.00 i
, , , 1 1 26.00
, , , 1 124.00
, , ' 1 122.00 I
, 1 1 20.00
<- 1I 1H I l ! ... dll ( �()(14 ()llll!l.. 1 ( \ 1 1 I I :....'h h 1 1..· .... L·! \ \ ... d ()( 1l.1 I t--. 0111 ) I .... d I t .ldl..'lll.l l k \ 1 1 ()WI!L I I ( d I \ L\I .... '\1..l\\ \II 1-. ( \lllIp.lll\ \ 1 1 nlIJl' ! 1 1 .ldl..· Ill.l I k .... "1..'1
I,n th 111.. 1 1.. 111 ,I l l 11\\ lh.d h\ I I 1l 1 1 1 1..' .... 1'1..·1..1 1 \ \.: \1\\ 111.. 1 .... I h I..' d.l!.l ... IH1\\ ll 1 11 t h , .... Lh.l l ! , .... 11 ' .... hll ll..,11 d,ri.t ,llld thi( LlI l l l'lll 1 1l 1 11 1 11l.llhlll ··
CHART 23
CURRENT UPDATE
Since it is over a year that this manual was written, an update just before publication should be interest
ing, in order to confirm the concepts presented. The last completed 5 minute chart was on 1 0/ 1 /04. The
following points were observed:
1 . All the numberd TL's are cloned lines and the end points are the PTT's that developed as the trading day progressed.
2. Please note the small "misses" ofthe PIT on lines 1 , 2 and 4 which suggests a trading range developing. In fact the total range after the fast run up was only 6 points for the rest of the day.
3 . The PTT's 3 , 5, 6, 7 , 8 and 9 , were nearly perfect as the result of concept 1 .
4. The 'Basic" TL for concept 2 was drawn at 1 4: 1 0 ET, then cloned for a CTL and a buy signal was given at 1 4:20 for a PTT at 1 l 32.75 to be reached at 1 6:05. This was hit perfectly at 1 6:05 and was also confirmed by the 9 PTT.
5 . Nearly every important point made in the manual over a year ago can be confirmed by the analysis of this chart. This fact should add confidence to the validity of the concepts as presented.
49

J.R. STEVENSON
CYCLES
B
A c A
REGULAR CYCLE IN A SIDE TREND REGULAR CYCLE IN AN UP TREND
B B
c c
REGULAR CYCLE IN A DOWN TREND INVERTED CYCLE IN A SIDE TREND
T B
T
c c
INVERTED CYCLE IN AN UP TREND INVERTED CYCLE IN A DOWN TREND
50

PRECISION TRADING WITH STEVENSON PRICE AND TIME TARGETS
A c
REGULAR CYCLE UNIT FLAT TREND
c
INVERTED CYCLE UNIT UP TREND
B
C REGULAR CYCLE UNIT
DOWN TREND
CYCLE UNITS
5 1
T
A
REGULAR CYCLE UNIT UP TREND
B
T 1
INVERTED CYCLE UNIT DOWN TREND
B T
c T1
INVERTED CYCLE UNIT SIDE TREND


TRADING TIPS
If you want to trade with the trend ofthe cycle you selected:
If the RC trend is up--Buy a CTL break If the RC trend is down-sell the PTT Ifthe IC trend is up--buy the PTT Ifthe IC trend is down-sell the CTL break
If you want to counter trend trade the cycle you selected:
Ifthe RC trend is up--sell the PTT Ifthe RC trend is down-buy the CTL break If the IC trend is up--sell the CTL break Ifthe IC trend is down-buy the PTT
Remember, the trend of the cycle you selected to trade is determined by the slope of the A -C line of
an RC or the slope of the B-D line of an Ie.
Many traders counter trend the markets. If you are so inclined, following the above listed tips should
be of value as you will know the cycle that is being traded and when the move might be over.
53


POINTS OF EMPHASIS IN THIS MANUAL
1 . A market truth. Derived from price bars only. No calculations, no formula, no indicators, no opinions, no bias.
2. Simplicity-<irawing of two trend lines and picking the length of the cycle to trade.
3 . Accuracy-Ifthe market was a perfect sine wave, the PTT would always b e correct. Of course this is not the case in real time trading. The odds of guessing where the market will trade at a time in the future would be enormous. However, the concepts produce several price and time targets through out the day that are accurate, sometimes to the very tic.
4. You must always expect a regular cycle (RC) to follow an inverted cycle (lC) or an inverted cycle (lC) to follow a regular cycle (RC) and each cycle will have approximately the same number of bars.
5 . Always EXPECT the PIT's to be accurate EVERY TIME! Every miss will give analysis help.
55


SUMMARY
Many trading methods do not seem to work after they are sold. The PIT concepts should always be
valid as long as the markets stay liquid with enough traders that form habits. The PIT's have served me well for
30 years and they continue to be valid. (See updated chart 23.)
There is no "track" record for percent right or wrong. The PIT's are derived only from the price bars
and cannot be changed ifthe same procedure is used every time. Every PTT constructed should aid in the
analysis of future market action. By plotting the PIT's on the chart as the day progresses, this should provide
insight on how cycles affect the market and that the market is not random.
Good trading to all of you. If you have questions, e-mail me [email protected].
J.R. Stevenson
57


TESTIMONIALS
"I first met J R. Stevenson in 1 981 . .. he was my boss at my first job out of college, with ContiCommodity. I was lucky to be in a situation where I spent th.e first couple of years on the job learning technical and cyclical analysis from a man who, I quickly realized, had a very unique insight into market behavior. Among the techniques he taught me then was one he called cyclic projection or vectors, the Price Time Targets that this book is based on. This is the single most effective trading and analysis tool I have ever encountered, and I have never looked at a price chart since without plotting out afew of these PTT's to see where that market should go. For wirious reasons, I drifted away from the futures markets for a number of years, but the PIT's worked equally well in helping me with my stock purchases and sales. Recently I resumed futures trading, and immediately saw that these PIT's are just as effective an,d accurate on 2, 5, or 15 minute bar charts as they are on daily or weekly charts. As a reader of this b09k, consider yourself very fortunate that J R. decided to share this technique with you. So enjoy this book, take the time to learn the material here, practice and get comfortable with using PIT's, and you will learn to trust them. Good trading! "
-Reid Hampton
"Buy this manual. It is a guide to the cyclical behavior of markets and is elegant in its simplicity and accuracy It is a method of depicting the collective behavior of market participants in both time and price and provides an invaluable complement to your current trading methodology. It is not about the psychological and money management aspects of trading. Nor is it a self-contained method of trading, although some of its principles could form the basis of a trading system. It will sharpen your trading skills and add an element of joy to your day. Happy fishing. "
-M.P.
"Thanks for your PIT manual and your assistance in applying the principles it teaches. I have been tradingfor more than six years and this is the most powerful tool I have ever used. I enter with my own system; however ruse the PTT's as a guide to manage my trade. l am a strong believer in managing a trade in order to be a successful trader. This has increased my winnings substantially by reducing my losses and increasing my winnings. This is a must-have manualfor all traders. I certainly would recommend it to anyone. "
-John Boese
"This unique method of trading is simple and easy to use. Yet it gives me valuable insights into market cycles. I am amazed that I can draw lines to precise price and time targets (PTT's) and then sit back and watch it hit precisely on that target. The PIT's coupled with the entry methods described in the manual are the most effective trading method I 've found! "
-Walt Whittington
"Just wanted to say, "Thank you, thank you, thank you! " I can 't believe how simple it is! They can keep all the "fluff and stuff" market indicators. I like this simple method and will keep yours ... "
-Jo Ann Kitagawa
"Please take your crystal ball home with you over the weekend so it will be safe. Boy, you have been calling these markets great! A !'pecial thank you for the individual help you continue to give me. "
-Kathy Farrer
59

"Just wanted to drop you a line and tell you L for some time now, have found your cyclic projections and analysis to be of tremendous value in my trading. I keep bar charts together with a momentum chart on seven commodities and T-Bonds. These combined with your cyclic letter are all of the inputs I want or need. Keep up the good work. "
-Ed Detrixhe
"JR., concerning your cyclic projections, I have followed Hal Cycles, MB&H, McMasters, Morgan Maxfield, James Sinclair, Bruce Gould, etc. etc. for a long time and I have found your work to be as good as any in the industry for my existing clients, as well as for soliciting new prospects . .. "
-John T.
"Thanks to JR. Stevenson for his fabulous comments on the grains. A ll our customers appreciate his comments and this is echoed from the entire 49th trading floor in Continental Grain. As far as we 're concerned, JR. is the BEST So if that isn 't a compliment, I don 't know what is. If JR. would like to start handling some business on grains only, L believe I couldfind him quite afew accounts which he could manage. Many thanks for a job well done. "
-Miles (fonner broker at Continental Grain Company)
"I 'd like to take this opportunity to tell you what a fabulous job JR. Stevenson and Reid Hampton, the Commodity Division s Technical Analysts, are doing. In my opinion they are the best thing that has happened in the firm in the 11 years that I have been here. "
-Fonner Prudential broker
"This work is concise, well-prepared, and very understandable. The discipline they carry into their trading keeps any losses small and allows profits to run. This probably is the most difficult thing to do in futures trading. Besides having a fine grasp of the daily fluctuations in the markets, their strongest point is the ability to do an excellent job of long-term forecasting ... a rather difficult task. "
-Joseph A. Fineman
60
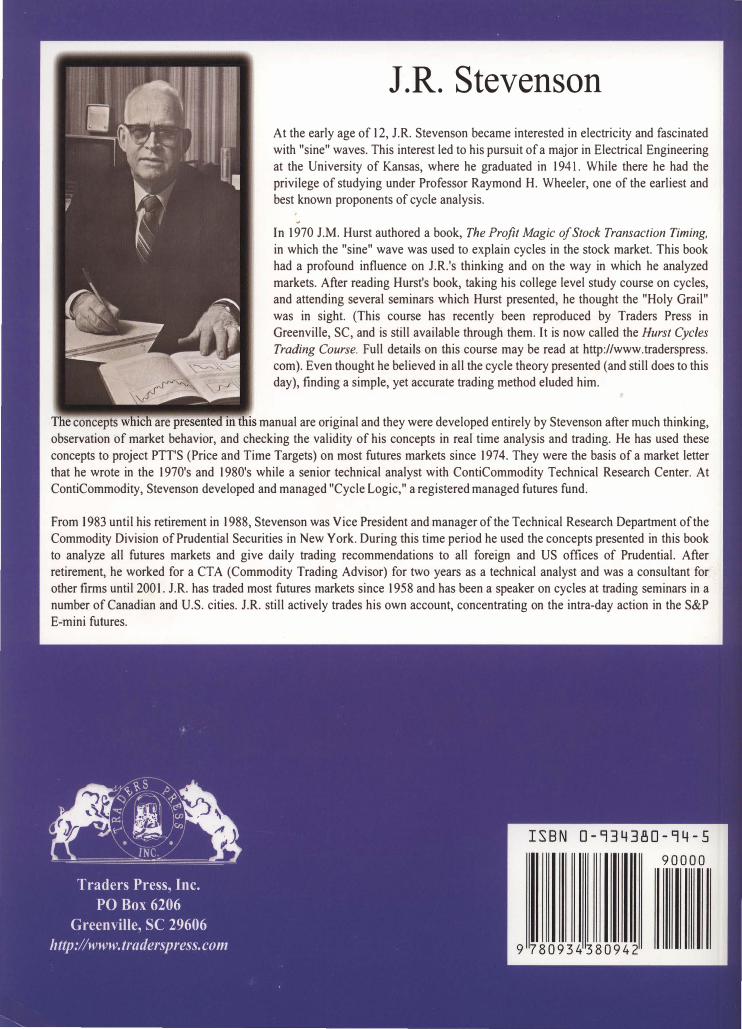
J.R. Stevenson At the early age of 12, lR. Stevenson became interested in electricity and fascinated
with "sine" waves. This interest led to his pursuit of a major in Electrical Engineering
at the University of Kansas, where he graduated in 1941. While there he had the
privilege of studying under Professor Raymond H. Wheeler, one of the earliest and
best known proponents of cycle analysis.
�
In 1970 lM. Hurst authored a book, The Profit Magic of Stock Transaction Timing, in which the "sine" wave was used to explain cycles in the stock market. This book
had a profound influence on lR.'s thinking and on the way in which he analyzed
markets. After reading Hurst's book, taking his college level study course on cycles,
and attending several seminars which Hurst presented, he thought the "Holy Grail"
was in sight. (This course has recently been reproduced by Traders Press in
Greenville, SC, and is still available through them. It is now called the Hurst Cycles Trading Course. Full details on this course may be read at http://www.traderspress.
com). Even thought he believed in all the cycle theory presented (and still does to this
day), finding a simple, yet accurate trading method eluded him.
concepts are manual are original and they were developed entirely by Stevenson after much thinking,
observation of market behavior, and checking the validity of his concepts in real time analysis and trading. He has used these
concepts to project PIT'S (Price and Time Targets) on most futures markets since 1974. They were the basis of a market letter
that he wrote in the 1970's and 1980's while a senior technical analyst with ContiCommodity Technical Research Center. At
ContiCommodity, Stevenson developed and managed "Cycle Logic," a registered managed futures fund.
From 1983 until his retirement in 1988, Stevenson was Vice President and manager of the Technical Research Department of the
Commodity Division of Prudential Securities in New York. During this time period he used the concepts presented in this book
to analyze all futures markets and give daily trading recommendations to all foreign and US offices of Prudential. After
retirement, he worked for a CT A (Commodity Trading Advisor) for two years as a technical analyst and was a consultant for
other firms until 2001. lR. has traded most futures markets since 1958 and has been a speaker on cycles at trading seminars in a
number of Canadian and U.S. cities. lR. still actively trades his own account, concentrating on the intra-day action in the S&P
E-mini futures.