preconstruction noise report for: the east … 17_3.pdfpreconstruction noise report for: the ......
TRANSCRIPT

Preconstruction Noise Report for:
THE EAST AVENUE LOOP Burlington, Vermont
Prepared for:
Velco and Burlington Electric Department
5 October 2006

TABLE OF CONTENTS
1. INTRODUCTION.....................................................................................................................................1
2. MEASURING THE EXISTING SOUND LEVELS.....................................................................................1
2.1 MCNEIL SUBSTATION ......................................................................................................................2
2.3 EAST AVENUE SUBSTATION...........................................................................................................6
3. MODELING OF SUBSTATION NOISE ................................................................................................10
3.1. MODELING METHODOLOGY ........................................................................................................10
3.2 MCNEIL SUBSTATION ....................................................................................................................11
3.3 EAST AVENUE SUBSTATION.........................................................................................................11
4. POST-CONSTRUCTION MONITORING ..............................................................................................19
5. SUMMARY AND CONCLUSIONS .......................................................................................................19

1. INTRODUCTION
Vermont Electric Company (VELCO) is proposing its East Avenue Loop project to upgrades substations in Burlington to improve service reliability. Resource Systems Group was retained to evaluate the noise impacts from the existing and proposed infrastructure. The substations evaluated in this report include McNeil, Lake Street, and East Avenue. This report includes:
• pre-construction noise monitoring
• post-construction noise forecasts
• recommendations for mitigation
2. MEASURING THE EXISTING SOUND LEVELS
RSG staff conducted sound level monitoring at three substations. These included: 1) McNeil Station,
2) Lake Street, and
3) East Avenue.
We monitored sound levels at distances of 0.3 meters/2 meters,1 and 15 meters from each substation transformer and at the fence line. Various sound level meters were used, including:
1) Cesva 310, ANSI Type I integrating sound level meters and analyzer
2) Brüel and Kjaer 2238, ANSI Type I integrating sound level meter and analyzer
3) Brüel and Kjaer 2236, ANSI Type I integrating sound level meter and analyzer
Sound level meters were calibrated before and after the measurements and fitted with windscreens. Table 1 identifies when the substations were monitored and the weather conditions observed.
Table 1: Monitoring Information for Three BED Substations
Temperature Wind Ground SkiesMcNeil Jun. 21, 2006 Yes Yes 20-22 ºC calm to 5 MPH Clear ClearLake Street Jun. 21, 2006 Yes Yes 20-22 ºC calm to 5 MPH Clear ClearEast Avenue Jun. 5, 2006 No Yes 17-20 ºC 5-11 MPH Clear Clear
Weather CondidionsSubstation
Date Monitored
Dummy Mic
Pre & Post Calibration
High electro-magnetic fields can affect the sound level meter readings by creating a phantom electronic signal that the meter interprets as sound. Given the potential for electro-magnetic fields within the substations, we fitted each sound level meter with a Gras 20 pF ½ inch dummy microphone. At each site, the sound level meters detected no electro-magnetic noise.
1 The measurements were made according to the IEC 60076-10 standard, which require measurements at 0.3 meters from the transformer, or 2 meters from operating fans.

Velco East Avenue Loop Noise Report Resource Systems Group, Inc.
5 October 2006 page 2
Each existing substation consists of one active transformer as well as other ancillary equipment with negligible noise emissions. At the transformer, sound levels were recorded at both 1/3 and 2/3 of the transformer height at 1 meter increments 0.3 meters from the transformer with the cooling fans off.1 The cooling fans were then turned on and we recorded at both 1/3 and 2/3 height, but at 2 meters away for points near the activated cooling fans. The total sound power level for each transformer was calculated according to IEC 60076-10 (“Power Transformers – Part 10: Determination of Sound Levels”).
Directionality of sound was calculated using sound level measurements taken 10 to 15 meters from and 90 degree increments around each transformer. We measured sound levels along the fence line to further understand the sound propagation from the source.
The results for each substation are described in the following sections.
2.1 MCNEIL SUBSTATION
Figure 1 shows the sound power levels at each octave band at the transformer.2 The sound levels were highest between the 125 Hz and 250 Hz octave bands. These correspond with the magneto-restriction frequency of the transformer of 120 Hz (twice the current cycle of 60 Hz) and the lower order harmonic of 240 Hz. The warm day prevented a test with cooling fans turned off. However, the sound power levels are always higher when the cooling fans are in operation.
Figure 2 shows the results from 50’ measurements taken around the transformer. At this distance, the transformer was not readily audible due to the noise from the power plant. The values presented in Figure 2 are primarily a result of plant operations in addition to the unloading of wood chips from the train and the plant cooling towers.
1 This follows the guidelines set forth in IEEE Standards Test Code for Liquid-Immersed Distribution, Power, and Regulating Transformers (IEEE Std. C57. 12.90-1999). The IEEE code sets forth larger setbacks for the fan side when they are operating. A Cesva 310 Type I integrating sound level meter was used to record 1/1 octave band sound levels. Property line and fence line measurements were taken using a Bruel & Kjaer 2238 Type I integrating sound level meter, recording 1/1 octave band levels. The McNeil transformer was measured only with fans on since the transformer was operating under FOA capacity conditions. Turning the fans off would have overheated the transformer.
2 Background noise from the power plant was subtracted from these measurements.

Velco East Avenue Loop Noise Report Resource Systems Group, Inc.
5 October 2006 page 3
Figure 1: Sound Power Levels (Lw) for the McNeil Substation Transformer with Cooling Fans
0
20
40
60
80
100
120
31.5 63 125 250 500 1K 2K 4K 8K
Frequency (Hz)
Soun
d Po
wer i
n dB
(Lw)

Velco East Avenue Loop Noise Report Resource Systems Group, Inc.
5 October 2006 page 4
Figure 2: Sound Pressure Levels 50’ from Existing McNeil Transformer

Velco East Avenue Loop Noise Report Resource Systems Group, Inc.
5 October 2006 page 5
Sound level measurements were made at the nearest residential areas to measure the sound from McNeil’s existing transformer. Figure 3 identifies the monitoring locations and summarizes the measurements. Station 1 was near the BHA Housing along Riverside Avenue to the south of the McNeil site. The observer noted that the transformer noise was not audible during the 15 minute measurement period. Station 2 was directly to the East of the cooling towers, behind a building along Intervale Road. Again, other sources of noise, including the cooling towers, dominated the sound levels. The transformer was not audible at this location. Third octave band levels at each station are shown in Figure 4
Figure 3: Results from Sound Monitoring at Two Residential Locations near McNeil Substation
.

Velco East Avenue Loop Noise Report Resource Systems Group, Inc.
5 October 2006 page 6
Figure 4: Third Octave Band Sound Levels at the McNeil Property Line
0.0
10.0
20.0
30.0
40.0
50.0
60.0
70.0
80.020 25 31.5 40 50 63 80 100
125
160
200
250
315
400
500
630
800
1000
1250
1600
2000
2500
3150
4000
5000
6300
8000
1000
0
1/3 Octave Band Center Frequency (Hz)
Soun
d Pr
essu
re L
evel
(dBZ
)
Riverside Ave Intervale Road
2.3 EAST AVENUE SUBSTATION
Figure 5 summarizes the sound power levels for East Avenue’s existing transformer. As expected, the fans-on condition (FOA) is louder than the no-fans condition (OA). The sound levels were highest in the 125 Hz and 250 Hz octave bands. These correspond with the magneto-restriction frequency of the transformer of 120 Hz (twice the current cycle of 60 Hz) and the lower order harmonic of 240 Hz associated with the 120 Hz frequency.

Velco East Avenue Loop Noise Report Resource Systems Group, Inc.
5 October 2006 page 7
Figure 5: Sound Power Levels (Lw) for the East Avenue Substation Transformer
40
50
60
70
80
90
100
31.5 63 125 250 500 1K 2K 4K 8K
Frequency (Hz)
Soun
d Po
wer (
Lw) in
dB
East Ave OA East Ave FOA
Figure 6 summarizes the measurements take at 90 increments around the transformer. Typically, these measurements are taken at 50’, but due to site limitations, some were adjusted. The fans-on condition appear in parentheses.
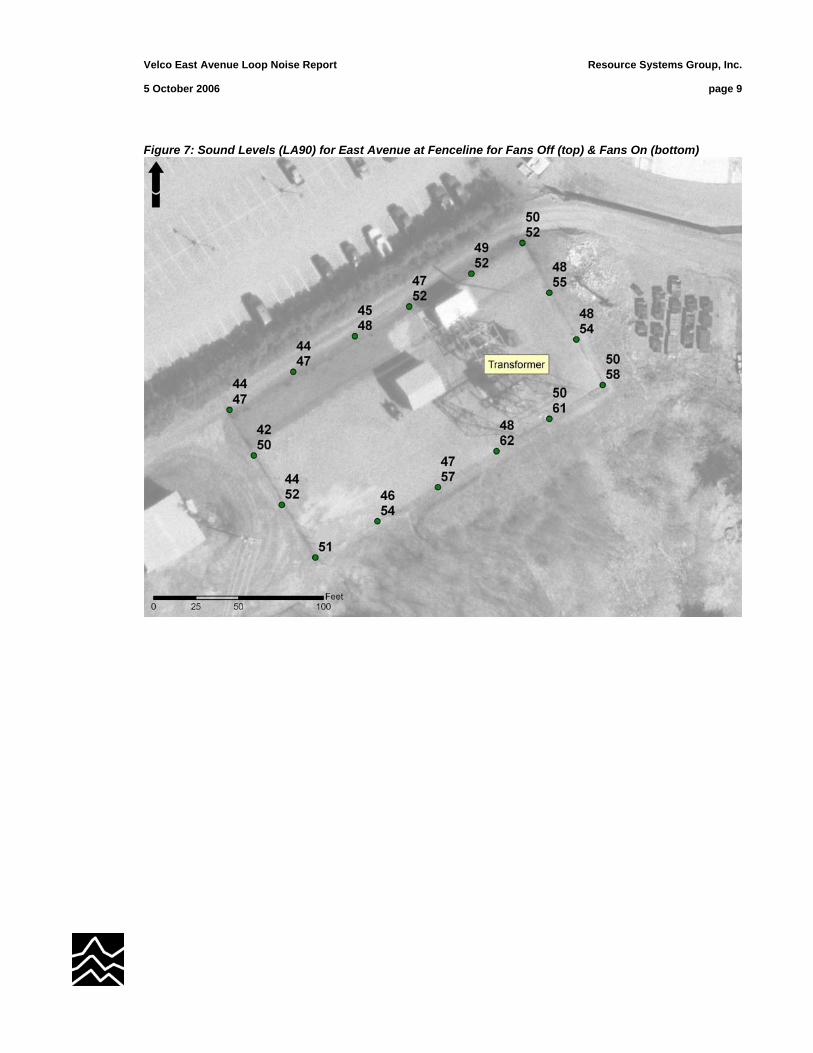
Further directional measurements were taken at the substation fence-line for both fans-off and fans-on conditions. These measurements are summarized in Figure 7. Note that at many of the measurement stations, especially those behind buildings and on the west and south portions of the substation, the transformer was not readily audible in the OA setting. During the measurement period, other sources of noise tended to dominate the fenceline measurements. These include peepers to the south, Centennial Field to the north, and distant traffic and airplane overflights. Therefore, we can also say that during the measurement period, the background sound level corresponds with the lowest sound level measured. This would be 42 dBA.
The third octave band sound levels near the substation gate to the west are shown in Figure 8. As noted above, under OA conditions, the transformer is inaudible. The chart shows that under FOA conditions, the relatively broadband fan noise is added to the background noise.

Velco East Avenue Loop Noise Report Resource Systems Group, Inc.
5 October 2006 page 8
Figure 6: Sound Level Measurements for East Avenue for Fans Off and (Fans On)
Velco East Avenue Loop Noise Report Resource Systems Group, Inc.
5 October 2006 page 9
Figure 7: Sound Levels (LA90) for East Avenue at Fenceline for Fans Off (top) & Fans On (bottom)

Velco East Avenue Loop Noise Report Resource Systems Group, Inc.
5 October 2006 page 10
Figure 8: Third Octave Band Sound Levels near Substation Gate for Fans Off and Fans On
0.0
10.0
20.0
30.0
40.0
50.0
60.0
20 2531
.5 40 50 63 80 100
125
160
200
250
315
400
500
630
800
1000
1250
1600
2000
2500
3150
4000
5000
6300
8000
1000
0
1/3 Octave Band Center Frequency (Hz)
Soun
d Pr
essu
re L
evel
(dBZ
)
fans off fans on
3. MODELING OF SUBSTATION NOISE
Sound level modeling was conducted at the East Avenue substation. The purpose of the modeling was to determine sound levels at neighboring properties for both the current conditions and the proposed conditions following the system upgrades. We based the sound emissions from these sources on the monitoring of the existing transformers and National Electrical Manufacturers Association (NEMA) TR-1 sound level standards for transformers.1
3.1. MODELING METHODOLOGY
Modeling was completed for the project using CADNA A acoustical modeling software. This modeling tool, made by Datakustik GmbH, is an internationally accepted acoustical model, and is used by many other noise control professionals in the United States and abroad. The software has a high level of reliability and follows methods specified by the International Standards Organization in their ISO 9613-2 standard, “Acoustics – Attenuation of sound during propagation outdoors, Part 2: General Method of Calculation.” The standard states,
“This part of ISO 9613 specifies an engineering method for calculating the attenuation of sound during propagation outdoors in order to predict the levels of environmental noise at a distance from a variety of sources. The method predicts the equivalent continuous A-weighted sound pressure level … under meteorological conditions favourable to propagation from sources of
1 “NEMA Standards Publication No. TR-1-1993 (R2000), Transformers, Regulators and Reactors,” NEMA, 2000
Velco East Avenue Loop Noise Report Resource Systems Group, Inc.
5 October 2006 page 11
known sound emissions. These conditions are for downwind propagation … propagation under a well-developed moderate ground-based temperature inversion, such as commonly occurs at night.”
The model takes into account source sound power levels, surface reflection and absorption, atmospheric absorption, geometric divergence, meteorological conditions, walls, barriers, berms, and terrain.
A 5 meter by 5 meter grid of receivers was set up covering several acres around each site. In addition, modeled receivers were placed adjacent the nearest residential homes.
Note that the results of the modeling shown in the following pages do not include background sounds. That is, they only represent the sound sources at the individual substations.
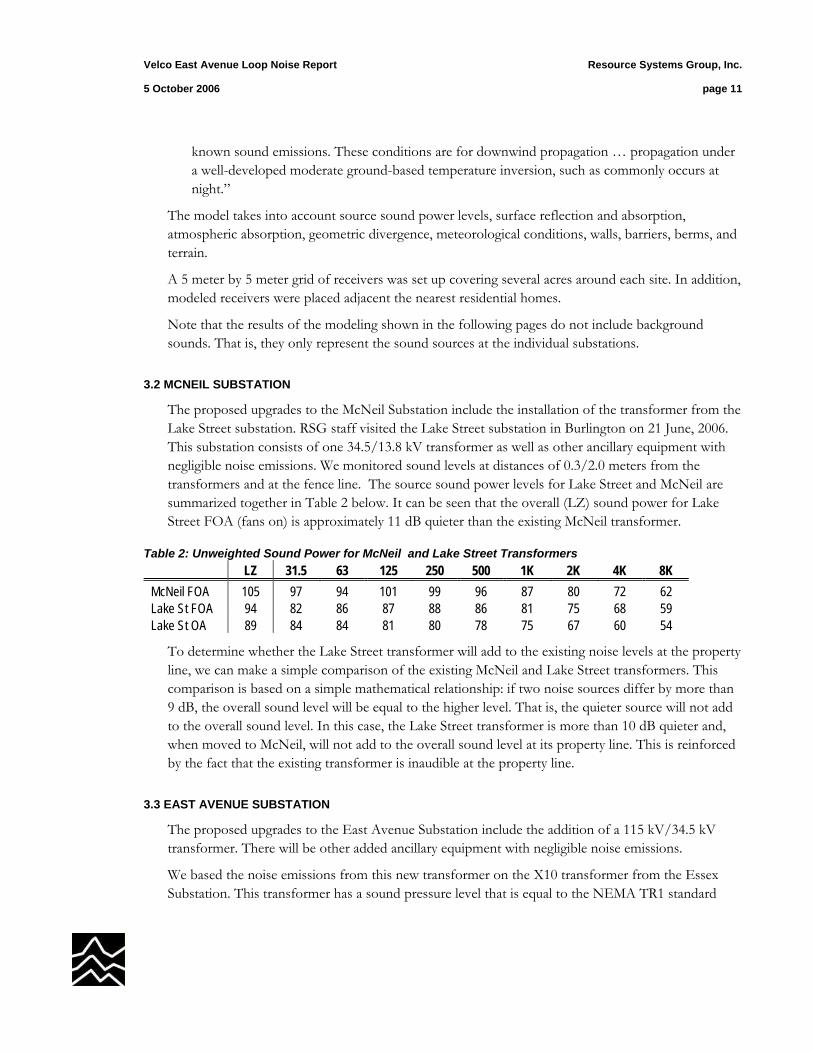
3.2 MCNEIL SUBSTATION
The proposed upgrades to the McNeil Substation include the installation of the transformer from the Lake Street substation. RSG staff visited the Lake Street substation in Burlington on 21 June, 2006. This substation consists of one 34.5/13.8 kV transformer as well as other ancillary equipment with negligible noise emissions. We monitored sound levels at distances of 0.3/2.0 meters from the transformers and at the fence line. The source sound power levels for Lake Street and McNeil are summarized together in Table 2 below. It can be seen that the overall (LZ) sound power for Lake Street FOA (fans on) is approximately 11 dB quieter than the existing McNeil transformer.
Table 2: Unweighted Sound Power for McNeil and Lake Street Transformers LZ 31.5 63 125 250 500 1K 2K 4K 8K
McNeil FOA 105 97 94 101 99 96 87 80 72 62 Lake St FOA 94 82 86 87 88 86 81 75 68 59 Lake St OA 89 84 84 81 80 78 75 67 60 54
To determine whether the Lake Street transformer will add to the existing noise levels at the property line, we can make a simple comparison of the existing McNeil and Lake Street transformers. This comparison is based on a simple mathematical relationship: if two noise sources differ by more than 9 dB, the overall sound level will be equal to the higher level. That is, the quieter source will not add to the overall sound level. In this case, the Lake Street transformer is more than 10 dB quieter and, when moved to McNeil, will not add to the overall sound level at its property line. This is reinforced by the fact that the existing transformer is inaudible at the property line.
3.3 EAST AVENUE SUBSTATION
The proposed upgrades to the East Avenue Substation include the addition of a 115 kV/34.5 kV transformer. There will be other added ancillary equipment with negligible noise emissions.
We based the noise emissions from this new transformer on the X10 transformer from the Essex Substation. This transformer has a sound pressure level that is equal to the NEMA TR1 standard

Velco East Avenue Loop Noise Report Resource Systems Group, Inc.
5 October 2006 page 12
under OA (fans off) conditions and 2 dB lower than the NEMA standard1 under FOA (fans on) conditions.
Before modeling the improvements, the model was calibrated to existing conditions. We compared the monitored levels along the eastern and southern fenceline to modeled levels. We found the model overestimated sound levels by an average of 1 dB with a standard deviation of 2 dB.
Three scenarios were modeled. In the first, the existing condition was modeled to validate the model inputs. Both cooling fans (daytime worst-case) and no cooling fans (most of the day and all of the night) scenarios were modeled. The results are shown in Figures 9 and 10. In those figures, the substation and surrounding residential streets are labeled. The resulting sound levels are color coded, with yellow representing sound levels between 45 and 50 dBA. As shown, modeled sound levels from the transformers can be up to 34 dBA with the cooling fans and 23 dBA without the cooling fans at the worst-case residence. We also modeled second story windows at homes to the west. At these windows, the worst-case sound levels were 36 dBA with the cooling fans and 24 dBA without.
In the second scenario, the proposed layout of the substation is modeled. The results, shown in Figures 11 and 12, indicate that the sound level from the transformers could reach 48 dBA with the cooling fans and 43 dBA without the cooling fans at some residential properties. At second story windows, these levels are 0 to 2 dB higher.
In the third scenario, the proposed layout of the substation is modeled with noise mitigation. Figure 13 and 14 show sound levels assuming that the new transformer is installed that has a guaranteed loaded and unloaded noise level that is at least 10 dB below the NEMA TR-1 standard. As shown, the sound levels drop to 41 dBA with fans on and 34 dBA with fans off. At the second story windows, these levels are 1 to 2 dB higher.
1 “NEMA Standards Publication No. TR-1-1993 (R2000), Transformers, Regulators and Reactors,” NEMA, 2000

Velco East Avenue Loop Noise Report Resource Systems Group, Inc.
5 October 2006 page 13
Figure 9: Modeled Sound Levels – Existing Conditions without Cooling Fans
22
21
11
10
13
232323
24
2424
12
1118
2424
23
24
24
12
11
15
2424
22
13
11
12
23
22
2323
Centennial Field
Thibault Pkwy
University Rd
Latham Ct
Case Pkwy
Substation
18.4
21.5
21.1
20.7
22.421.9
20.6
22.7
19.6
445050
445050
445100
445100
445150
445150
445200
445200
445250
445250
445300
44530022
0100
2201
00
2201
50
2201
50
2202
00
2202
00
2202
50
2202
50
2203
00
2203
00
2203
50
2203
50
2204
00
2204
00
EAST AVENUE SUBSTATION
> -99.0 dB(A) > 35.0 dB(A) > 40.0 dB(A) > 45.0 dB(A) > 50.0 dB(A) > 55.0 dB(A) > 60.0 dB(A) > 65.0 dB(A) > 70.0 dB(A) > 75.0 dB(A) > 80.0 dB(A) > 85.0 dB(A)
vert. Area Source Road Building Barrier Foliage Ground Absorption Contour Line Receiver Building Evaluation Calculation Area
Sound Pressure Levels (dBA) from Existing Conditions
-Cooling Fans Off-

Velco East Avenue Loop Noise Report Resource Systems Group, Inc.
5 October 2006 page 14
Figure 10: Modeled Sound Levels – Existing Conditions with Cooling Fans
33
31
20
20
22
353535
36
3636
21
2129
3636
35
36
36
21
20
25
3636
34
23
20
21
34
34
3434
Centennial Field
Thibault Pkwy
University Rd
Latham Ct
Case Pkwy
Substation
29.0
33.6
33.0
33.1
34.033.3
31.5
34.0
31.2
445050
445050
445100
445100
445150
445150
445200
445200
445250
445250
445300
44530022
0100
2201
00
2201
50
2201
50
2202
00
2202
00
2202
50
2202
50
2203
00
2203
00
2203
50
2203
50
2204
00
2204
00
EAST AVENUE SUBSTATION
> -99.0 dB(A) > 35.0 dB(A) > 40.0 dB(A) > 45.0 dB(A) > 50.0 dB(A) > 55.0 dB(A) > 60.0 dB(A) > 65.0 dB(A) > 70.0 dB(A) > 75.0 dB(A) > 80.0 dB(A) > 85.0 dB(A)
vert. Area Source Road Building Barrier Foliage Ground Absorption Contour Line Receiver Building Evaluation Calculation Area
Sound Pressure Levels (dBA) from Existing Conditions
-Cooling Fans On-

Velco East Avenue Loop Noise Report Resource Systems Group, Inc.
5 October 2006 page 15
Figure 11: Modeled Sound Levels – Proposed Layout without Cooling Fans
44
43
32
30
33
444444
45
4544
32
3137
4545
44
44
44
31
30
34
4444
41
33
30
30
40
40
4141
43.4
43.4
42.5
39.1
37.637.2
36.4
38.6
38.5
Centennial Field
Thibault Pkwy
University Rd
Latham Ct
Case Pkwy
Substation
445050
445050
445100
445100
445150
445150
445200
445200
445250
445250
445300
44530022
0100
2201
00
2201
50
2201
50
2202
00
2202
00
2202
50
2202
50
2203
00
2203
00
2203
50
2203
50
2204
00
2204
00
EAST AVENUE SUBSTATION
> -99.0 dB(A) > 35.0 dB(A) > 40.0 dB(A) > 45.0 dB(A) > 50.0 dB(A) > 55.0 dB(A) > 60.0 dB(A) > 65.0 dB(A) > 70.0 dB(A) > 75.0 dB(A) > 80.0 dB(A) > 85.0 dB(A)
vert. Area Source Road Building Barrier Foliage Ground Absorption Contour Line Receiver Building Evaluation Calculation Area
Maximum Sound Pressure Levels (dBA) from Proposed Conditions
-Cooling Fans Off-

Velco East Avenue Loop Noise Report Resource Systems Group, Inc.
5 October 2006 page 16
Figure 12: Modeled Sound Levels – Proposed Layout with Cooling Fans
48
48
35
33
36
484848
49
4949
34
3440
4949
48
48
48
34
33
37
4848
44
36
33
33
44
44
4444
Centennial Field
Thibault Pkwy
University Rd
Latham Ct
Case Pkwy
Substation
47.8
47.7
46.8
42.7
41.240.7
39.8
42.3
42.7
445050
445050
445100
445100
445150
445150
445200
445200
445250
445250
445300
44530022
0100
2201
00
2201
50
2201
50
2202
00
2202
00
2202
50
2202
50
2203
00
2203
00
2203
50
2203
50
2204
00
2204
00
EAST AVENUE SUBSTATION
> -99.0 dB(A) > 35.0 dB(A) > 40.0 dB(A) > 45.0 dB(A) > 50.0 dB(A) > 55.0 dB(A) > 60.0 dB(A) > 65.0 dB(A) > 70.0 dB(A) > 75.0 dB(A) > 80.0 dB(A) > 85.0 dB(A)
vert. Area Source Road Building Barrier Foliage Ground Absorption Contour Line Receiver Building Evaluation Calculation Area
Sound Pressure Levels (dBA) from Proposed Conditions
-Cooling Fans On-

Velco East Avenue Loop Noise Report Resource Systems Group, Inc.
5 October 2006 page 17
Figure 13: Modeled Sound Levels – Proposed Layout without Cooling Fans and Mitigation
35
35
23
21
24
353545
36
3636
22
2228
3646
35
35
35
22
21
25
3545
32
24
21
21
31
32
3241
Centennial Field
Thibault Pkwy
University Rd
Latham Ct
Case Pkwy
Substation
34.3
34.3
33.4
30.0
28.928.5
27.7
29.8
29.4
445050
445050
445100
445100
445150
445150
445200
445200
445250
445250
445300
44530022
0100
2201
00
2201
50
2201
50
2202
00
2202
00
2202
50
2202
50
2203
00
2203
00
2203
50
2203
50
2204
00
2204
00
EAST AVENUE SUBSTATION
> -99.0 dB(A) > 35.0 dB(A) > 40.0 dB(A) > 45.0 dB(A) > 50.0 dB(A) > 55.0 dB(A) > 60.0 dB(A) > 65.0 dB(A) > 70.0 dB(A) > 75.0 dB(A) > 80.0 dB(A) > 85.0 dB(A)
vert. Area Source Road Building Barrier Foliage Ground Absorption Contour Line Receiver Building Evaluation Calculation Area
Sound Pressure Levels (dBA) from Proposed Conditions
-Cooling Fans Off-
With Low-Noise Transformer

Velco East Avenue Loop Noise Report Resource Systems Group, Inc.
5 October 2006 page 18
Figure 14: Modeled Sound Levels – Proposed Layout with Cooling Fans and Mitigation
41
41
28
26
29
414148
42
4242
28
2734
4249
41
41
41
27
26
30
4148
38
29
26
26
38
38
3844
Centennial Field
Thibault Pkwy
University Rd
Latham Ct
Case Pkwy
Substation
40.6
40.6
39.7
36.8
36.335.6
34.3
36.8
36.4
445050
445050
445100
445100
445150
445150
445200
445200
445250
445250
445300
44530022
0100
2201
00
2201
50
2201
50
2202
00
2202
00
2202
50
2202
50
2203
00
2203
00
2203
50
2203
50
2204
00
2204
00
EAST AVENUE SUBSTATION
> -99.0 dB(A) > 35.0 dB(A) > 40.0 dB(A) > 45.0 dB(A) > 50.0 dB(A) > 55.0 dB(A) > 60.0 dB(A) > 65.0 dB(A) > 70.0 dB(A) > 75.0 dB(A) > 80.0 dB(A) > 85.0 dB(A)
vert. Area Source Road Building Barrier Foliage Ground Absorption Contour Line Receiver Building Evaluation Calculation Area
Sound Pressure Levels (dBA) from Proposed Conditions
-Cooling Fans On-
With Low-Noise Transformer

Velco East Avenue Loop Noise Report Resource Systems Group, Inc.
5 October 2006 page 19
4. POST-CONSTRUCTION MONITORING
After construction is completed at these substations, post-construction sound level monitoring will be conducted. Sound monitoring will take place at the fenceline and/or property lines, depending on the site. Sound power measurements will be made for the new transformer at East Avenue to confirm that it meets a specification of 10 dB below the NEMA TR-1 standard
5. SUMMARY AND CONCLUSIONS
Sound level monitoring was conducted at three substations: McNeil, Lake Street, and East Avenue. At each station, sound power levels for each transformer were determined using IEC standard procedures. Measurements were made at 10 to 15 meters from the transformers to determine whether the sound emissions are directional. Finally, fenceline and/or property line measurements were made to establish levels further from the transformers.
During the measurements, it was noted that the transformer at the McNeil Station is inaudible at the property line, and, in fact, was inaudible 50 feet away from the transformer. The Lake Street transformer which will be moved to McNeil, is a relatively quiet transformer. It is more than 10 dB quieter than the existing McNeil transformer. As a result, when moved to the McNeil substation, it will not add to the overall sound level at the substation fenceline or the property line.
At the East Avenue substation, the existing transformer is also relatively quiet. It is 15 dB quieter than the NEMA TR-1 standard with no fans and 6 dB quieter under fan cooling. The transformer with no fans was inaudible at many locations to the west and south along the fenceline. The lowest background noise measured was 42 dBA.
Computer modeling of sound propagation was done at the East Avenue substation to determine the impacts of the changes proposed. It was found that by adding an additional transformer, residences to the north and west should not experience noise levels above 36 dBA at night and 42 dBA during the day at the worst-case second story window. These levels are generally below existing background noise. To achieve this level, the new transformer at the East Avenue substation must be specified to have a maximum loaded sound pressure level that is at least 10 dB below the NEMA TR-1 standard or no greater than 64 dBA OA and 67 dBA FOA.
We also recommend that post-construction monitoring will be conducted at the fenceline and/or property lines at each of the above sites. In addition, measurements will be taken at the new transformers proposed at East Avenue to confirm that it meets the above specification.