predictability of the floods caused by typhoon hagibisin
TRANSCRIPT

Predictability of the floods caused by Typhoon Hagibis in 2019 using Today's Earth
https://www.eorc.jaxa.jp/water/
Kei Yoshimura, Wenchao Ma, Yuta Ishitsuka, Akira Takeshima, Kenshi Hibino, Dai Yamazaki, Kosuke Yamamoto, Misako Kachi, Riko Oki, Taikan Oki
Institute of Industrial Science, The University of TokyoEarth Observation Research Center, JAXA
2020 Nov 11, Virtual GFP Conference Week 2

2015 Sep 10 17:00Misaka-cho, Joso city
Kanto/Tohoku Heavy Rain (Sep 2015)Heavy precipitation for 8 to 10 September 2015 over Tochigi and Ibaraki prefectures was caused by clustered linear rain bands influenced by Typhoon Etau (No 18) and Kilo (No 17). Over 40 km2 in Joso-city including 11,000 houses were inundated, evacuation orders were issued for more than 10,000 citizens, and over 2,000 people were rescued by helicopters and boats.
Moisture conv. and wind speed2015/9/10 3:00JST
Accumulated Rainfall for Sep 8-10 [mm]
Okunikko
Imaichi
Utsunomiya
Takanezawa
Maoka
Shimozuma
IkariTorofuEtau
Kilo

Maximum 48-hour rainfall
Flood occurred at 0:00
Evacuation order at 23:45
Evacuation alert at July 6 22:00
51 Death toll
Rainfall
Water level
Hydrograph at Sakatsu, Takahashi River
Immediate Danger levelEvacuation level
Upp
er b
asin
ave
’dPr
ecip
itati
on (B
ars)
Water level [m
]
West Japan Heavy Rain (July 2018)Because of long time halt of Baiu Front, which was influenced by powerful Pacific High and the Okhotsk High, it brought large amounts of precipitation across western Japan from July 5-8, 2018.In terms of 24-hour accumulated rainfall, some watersheds experienced rainfall on a multi-100-year scale, resulting in flood inundation and mudslides in many areas of western Japan. It killed 263 people in total.
Maximum 48-hour rainfallshows many record breaks.
Record breaking for whole periodRecord breaking for July
Pacific High
Okhotsk High
Baiu Front
Sea level Pressure @2018/7/6 9JST by JMA

4
Typhoon Hagibis (Oct 2019)Typhoon Hagibis (in Japan, No 19 in 2019) was emerged on Oct 6 and became category 5 on Oct 7. On 12 Oct 19:00JST, it made landfall on Izu peninsula, and it moved Kanto region to southern Tohoku region until early morning of 13 Oct. Hagibis caused extensive damages at more than 70 river systems and killed more than 100 people in the eastern part of Japan.
https://www.ecmwf.int/en/forecasts/charts/tcyclone/tc_strike_probability?facets=undefined&time=2019100812,0,2019100812&unique_id=25W_HAGIBIS_2019
Predicted by ECMWF at 21JST on Oct 8.24-hour accumulated rainfall on Oct 12.
� ������
��!��
���������������������
24

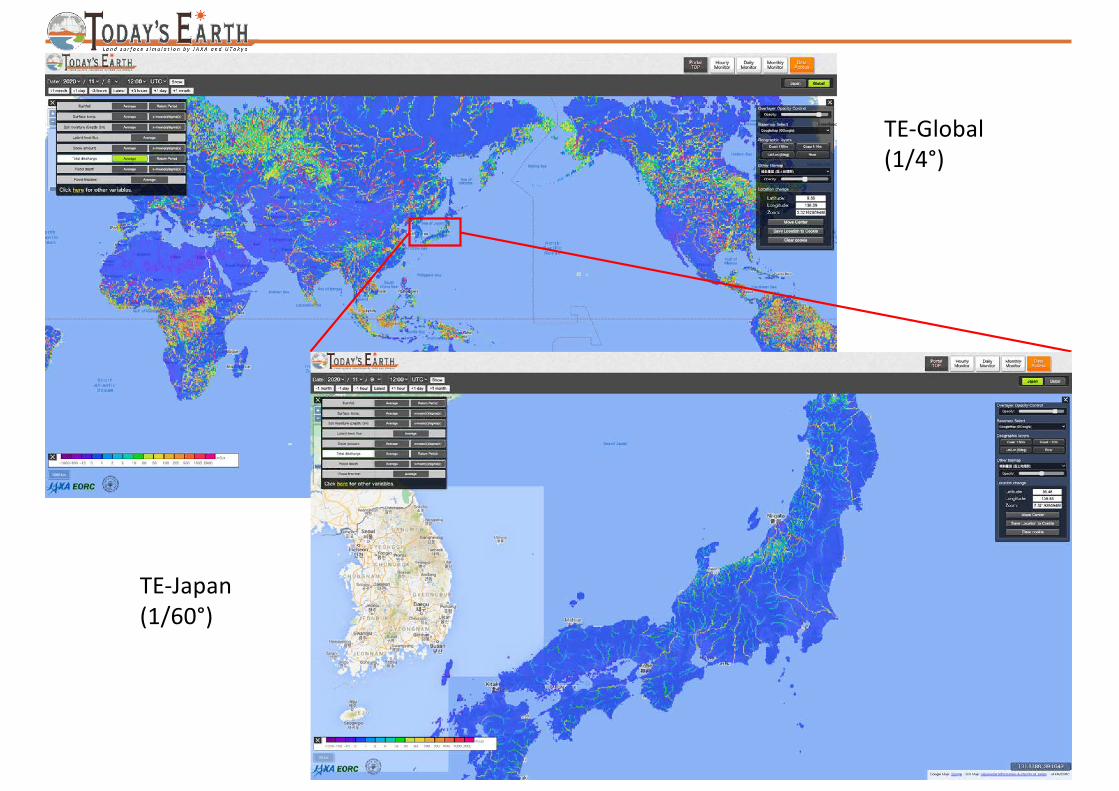
• Near real time land surface simulation system for global (1/4° res.) and Japan (1/60° res.).
• Forced by multiple satellite based atmospheric variables including GSMaPprecip, MODIS radiation.
• Data downloadable from 1958.
• Forecast versions are being tested.
Go to www.eorc.jaxa.jp/waterOr search “today’s earth”
Today’s Earth system Yoshimura et al., 2008Ma et al., in prep., etc.
6
TE-Global(1/4°)
TE-Japan(1/60°)

TE Data flow
7
SatelliteObserva,on Data Himawari-8GPM
GCOM &future satellites
JMA 55-year Reanalysis (global)JMA Numerical Weather Predic,on (Japan)
Precipitation Solar Radiation
Satellite Land Informa0on
Surface Weather Data• Temperature• Humidity• Precipitation
• Precipita,on• Solar Radia,on etc.
Land Surface Model (MATSIRO5)
River Rou,ng Model (CaMa-Flood)
Surface Hydrological Data
• Surface Temperature• Soil Moisture
• Total Runoff• Evapotranspira,on
etc.
River Informa0on
• River Discharge • Inundated Area etc. Risk Indices
Valida,on
• Wind Speed• Solar
Radiation etc.
Aqua
Terra

����
1 1.
.1 1
. 1
.
. -W BZ
HrHf
L
A
Af
Sr SfSf
A
Af
Topograp
hy
�����������"� ��� Z����������� � L����������� � W��������� ������ B�� ����� ����� A��������������"� ����������
f(Topography)��"���� ����� S r������������ ����� S r��"����� ������ � Hr�������������� � H f��!��� ������� A f
��
������
��
��� �
�
LandmodelMATSIROAGCMs
OGCMs COCO(Hasumi,2006)etc.
MIROC(Watanabeetal.,2010),NICAM(Satoetal.,2014)etc.Implementnewphysical
processes• Snowagingbydust/BC• Snow-fedwetlands• Riverinundationand
evaporation• Sub-gridsnowcover
parameterization
Modelsforwater-relatedhazards
Developmentof IntegratedLandSimulator (ILS)
Generalpurposecoupler�Jcup,Arakawaetal.,2011)
Next-generationrivermodelCaMa-Flood
Globalhydrologymodelwithanthropogeniceffects
H08
(Yamazakietal.,2011)
(Hanasaki etal.,2008)
(Takata etal.,2003;Nittaetal.,2014)
Contributing toimprovementofclimatemodels
Ensemble Weather Forecast Data.
Ensemble River Discharge Forecast
Probability of Flood Risk
Sophisticated UIIntegrated
Land Simulator
Satellite Obs. Data
��� ��� �������� �
In-situ Obs. Data
������ �Himawari-8
GPM
GCOM &future satellites
Aqua
Terra
) ) . (����� ������������������������� �� .1.2,
.) - .2 1 . 2( - )
) - ) .2 - . 21 . 2
Structure of Prediction using Today’s Earth
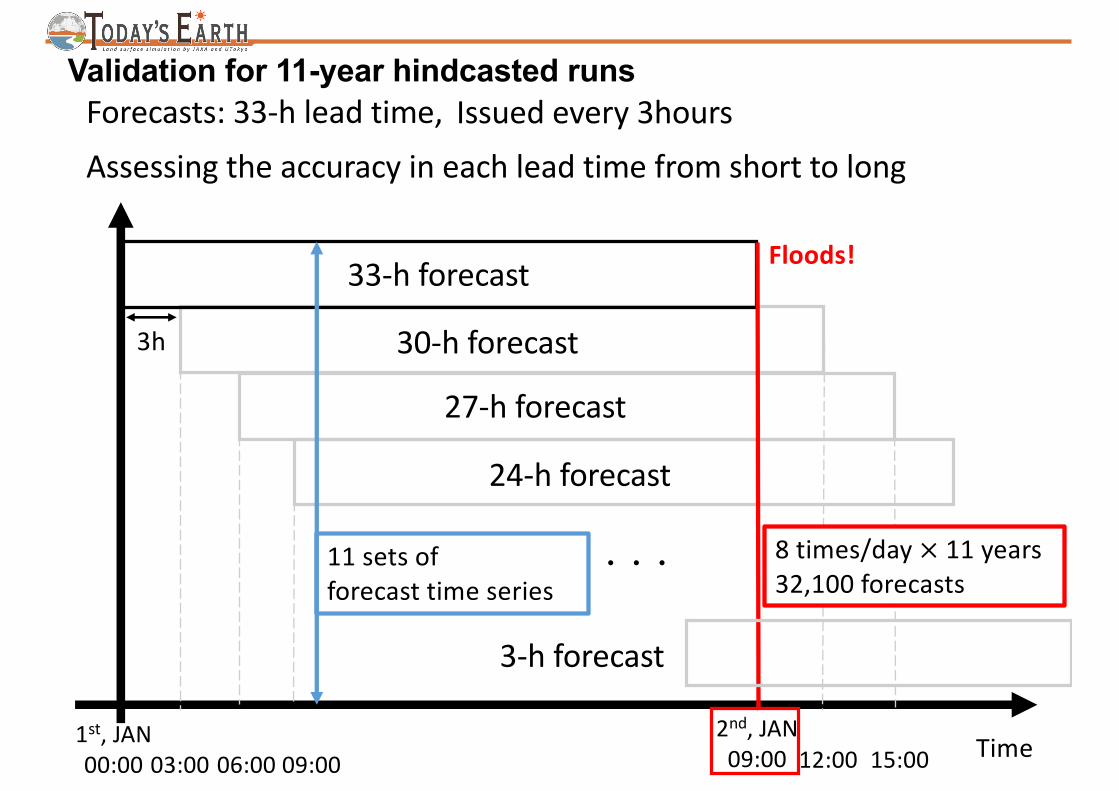
Validation for 11-year hindcasted runsForecasts: 33-h lead time, Issued every 3hoursAssessing the accuracy in each lead time from short to long
Time1st, JAN00:00
2nd, JAN09:0003:00 12:0006:00 15:0009:00
33-h forecast Floods!
3h 30-h forecast
27-h forecast
24-h forecast
3-h forecast
���11 sets of forecast time series
8 times/day × 11 years32,100 forecasts

N = 849 stations
Forecast ability for high flows
Forecast Leadtime(Short) (Long)
[2007 - 2017]
Reference Values[e.g., Addor et al., 2011; Alfieri et al., 2013]
Ø PSS ≥ 0.00 : Have a Predictability
00-03
03-0
606
-09
09-1
212
-15
15-1
818
-21
21-24
24-2
727
-30
30-3
3Ref.
1.0
0.8
0.6
0.4
0.2
0.0
-0.2
Forecasts 12-h before:
Having PSS > 0.25 at more than
50% out of 849 stations.
Forecasts 33-h before:
Having a positive PSS at more
than 90% out of 849 stations.
Ishitsuka et al., in prep.
Hit Rate�1�Miss Rate�
False AlarmRate
PSS = !"#
$%&'(%)) −+,
+,'-.

, 77
7, 747 7F 3 A DI D F 7
, A EF 9 D97E IF 79 I7A F7 7F
F7 7AA6 A EF 9 DI99 IAAL 97E IFADD FD ) DF
F 7 D 7 IE F 7
, 79I7 D A
-DF 97 A 7IE D D F ADD
1I
FD
DF
ADD
F
. 9F 7D F• I99 IAAL DF 97
7AA 7 ( M • 6 F7 DF AD 7AAL 7EEA 97 A• . F7 D 7 AA 7 7
AL F 7 D D
3F 9 E
9 7F
A 0 0 0E0 0 1: 0 02 5 5:0 5:5 20 A 20 A D 5 A 5: 5 1 AA A , .
, A DF 97 D ) DIF 7 72015’s case

Results from TE-Japan for 2018-Floods 30 059 073 59 60 0 0
7/5/9:00 7/6/0:00 7/6/12:00
1tile = 1hour
Recursive-year forecasts
01 0 5:9 073 /301432 09 3 01 0 5:9 73 37 30 059 073 0 540 45
01 0 5:9 : 23
7::2 :11 32
It could predict a high recursive-year water level from the forecasts 39 hours beforeIn
itial
date
ofth
e fo
reca
st
01 0 5:9 : 23
time
Note: Numbers in the cells represent recursive-years
TE-Japan GUI at 21:00 on July 5.
2018’s case

Prediction from 11 Oct 9JST by TE-Japan (1km-ver.)
13
River Discharge[m3/s]
Inundated area[fraction]
Courtesy of K. Hibino
2019’s case

Predictability for Floods by Hagibis
���')�"& �+'��,+!')"+/��+!�)��.�)�� ��$�-����)'#�&�*"+�*����0��(�&�*,���**�,$$/� �-��1�$�)+*2��+����*"+�*�"�������/)�.�+�)�$�-�$��."+!�*,��"�"�&+�$����+"%���"&��-�)� �������!',)*�����-��*�.�)����*+)'/�������!',)*�$�+�)�+!�&�+!��1�$�)+*2�
��$*���$�)%�)�+��"*���',+�����+���%���+����,+����)��*���+'����*"&�����%���+����&��)���!�������+��(%���+����.!�&���+,�$��$''�"& �*+�)+���+'�'��,)�
14
����������
©NHK
Hours between forecast initial time and alerts
Hours between alerts and Bank Breaks
Bank
Bre
ak L
ocat
ion
(pre
fect
ural
)Ba
nk B
reak
Loc
atio
n (n
atio
nal)
Ma et al., in prep.
X: Bank Break (142)Red Pin: Hit Alarm (129)White Pin: False Alarm (579)

Municipals started using prediction by TE-Japan
��
Because of Japanese law, it is NOT permitted to provide predicted results to public (Meteorological Service Act Article 17-1). Therefore, currently TE-Japan’s prediction is only used by municipals as a collaborative feasibility study. Member municipals of our collaborative feasibility study are as follows (as of Nov 2020):• Miyazaki city / Miyazaki• Saito city / Miyazaki• Takanabe city / Miyazaki• Nagano city / Nagano• Matsuyama city / Ehime• Masaki town / Ehime• Mito city / Ibaraki• Joso city / Ibaraki • Tsukuba city / Ibaraki• TsukubaMirai city / Ibaraki• Sakai town / Ibaraki• Hitachiomiya city / Ibaraki• Hitachiota city / Ibaraki• Wakayama pref.• Hitachinaka city / Ibaraki• Jori town / Ibaraki• Edogawa ward / Tokyo• Daigo town / Ibaraki• Ryugasaki city / Ibaraki• Tokushima city / Tokushima• Nagano Pref.• Bando city / Ibaraki
������������������������������ �������� �

Kyushu floods in July 2020 and Typhoon Haishen in Sept. 2020
16Hydrographs predicted from 9am July 3
Hitoyoshi
Saito
2020 July Heavy rain 2020 Sept. Haishen
Unit: m3/s
3500 550
8000 55
7/3 9am 7/5 9am 9/5 9am 9/7 9am
Hitoyoshi
Saito
Hydrographs predicted from 9am Sept. 6
Regarding the severe floods happened in July, even more significant damage was anticipated when Haishen’s approaching. However, as results, it did not cause too serious damage. This situation was somehow correctly predicted by TE-Japan.
Saito
Hito
yosh
i
2020/9/5 NHK Special
������ ��������� ���������
@2020/7/3 9am @2020/9/5 9am

Fusion with Satellite Observation (SAR) Ohki et al. 2020
https://www.eorc.jaxa.jp/ALOS-2/img_up/jdis_pal2_heavyrain_kyushu_20200706.htm
Better accuracy
↑
↓
Better efficiency
Probability of class i ! "#|% = )! "# !(%|"#∑*+,- .! "* !(%|"*
SAR data % =Co−event amplitudePre−event amplitudeCoherence difference∗
*co-event coherence − pre-event coherence
! %|"# = N(D#, F#)N�Gaussian Distribution
µ, S�Parameters of N
(should be set along
the incidence angle)
Prior probability Probability density function of SAR data for each classFlood simulation SAR data
↓Flood risk
↓
Rivers →
Lake↓
Flood occurred
in this area
Even though TE-J’s low resolution (i.e., 1km), using
predicted flood fraction as prior helps to improve
the SAR-based (3m) inundation estimates.
Estimate of inundation is promptly
announced in case of July flood 2020.
TE Satellite

Example of global view: TCs Linfa, Nangka, Saudel, Molave…
2020/9/1-30
2020/10/1-9
2020/10/10-17
AMSR2/GCOM-W TWV anomaly ratio
TC Linfa
(No15)
TC Nangka
(No16)
TC Saudel
(No17)TC Molave
(No18)
http://agora.ex.nii.ac.jp/digital-typhoon/
Courtesy of Mr.
Ohara (JAXA)Courtesy of Mr.
Yamamoto (JAXA)

Summary• We developed Today's Earth, or TE, a simulation system that provides
integrated estimates of physical quantities related to the water cycle on land (e.g., soil moisture content, river flows, evapotranspiration, and many others).
• Today's Earth utilizes the land surface simulation technology of the University of Tokyo and the satellite data analysis technology of JAXA/EORC, respectively, and enables us to continuously monitor global land conditions through the internet.
• In the Japanese region in particular, we have established a system to distribute real-time prediction with a resolution of 1/60° grid (about 1 km grid) to the public. It is called TE-Japan. Global version (TE-Global) has 1/4° grid (about 25km grid).
• We tested the performance of TE-Japan for some extreme events. In the case of Typhoon Hagibis in 2019, at 129 of the 142 sites where breaches were reported, the system predicted a once-in-200 years flood level (defined as an alert) for an average of 32.3 hours prior to the event.
• The false alarm rate was around 70% to 80 % throughout the period. This predictive information is being considered for use in a variety of fields, such as the distribution of disaster prevention information in the domestic media and public municipal offices.
• Fusion of TE and SAR makes the inundation area estimate better.
19
