predicted water quality in lake elsinore
TRANSCRIPT

Predicted Effects of Restoration Efforts on Water Quality in Lake Elsinore: Model Development and Results
Final Report
Submitted to:
Lake Elsinore-San Jacinto Watersheds Authority (LESJWA) Santa Ana Watershed Project Authority
11615 Sterling Avenue Riverside, CA 92503
Submitted by:
M.A. Anderson Dept. of Environmental Sciences University of California, Riverside
12 March 2006

Final Report: Lake Elsinore Model 12 March 2006 ______________________________________________________________________________________
Table of Contents
Executive Summary ........................................................................................................1
Introduction .....................................................................................................................2
Approach .........................................................................................................................3
External Loading ...........................................................................................................3
Bioturbation ...................................................................................................................5
Wind Resuspension ......................................................................................................7
Internal Loading ..........................................................................................................10
Steady-State Solution .................................................................................................13
Input Data....................................................................................................................13
Results ...........................................................................................................................15
Simulation Results: 1993-2004 ...................................................................................15
Model Sensitivity Analysis...........................................................................................17
Model Uncertainty Analysis.........................................................................................18
Evaluation of Lake Management Activities: Steady-State Analysis ............................20
(i) Effects of Supplemental Flows on Lake Level and Water Quality.....................20
(ii) Effects of Aeration and Carp Removal on Water Quality .................................24
Non-Steady State Analysis of Lake Restoration Techniques......................................26
Key Findings and Conclusions....................................................................................30
References.....................................................................................................................31
ii

Final Report: Lake Elsinore Model 12 March 2006 ______________________________________________________________________________________
List of Figures
Fig. 1. Processes affecting nutrient levels in Lake Elsinore…………………………………3 Fig. 2. Temporal trends in a) suspended solids concentrations and b) square of windspeed………………………………………………………………………………………...7 Fig. 3. Mixed layer depth as function of windspeed and fetch.……………………………..8 Fig. 4. Area of lake bottom prone to resuspension (type II and III sediments only) as a function of lake elevation………………………………………………………………………..9 Fig. 5. SRP flux measured during summer of 2001 vs. depth……………………………..10 Fig. 6. Average P recycling rate vs. water column TP concentration……………………..11 Fig. 7. Volume as function of lake surface area…………………………………………….13 Fig. 8. Meteorological and hydrological conditions: a) precipitation, b) evaporation, c) San Jacinto R. flow and d) other inflows……………………………………………………..14 Fig. 9. Total P concentrations of different inflows over time……………………………….14 Fig. 10. Daily TP inputs: a) San Jacinto R. and b) other inputs…………………………...15 Fig. 11. Predicted and observed: a) lake surface elevation and b) TP concentration…..15 Fig. 12. Phosphorus loading normalized to lake surface area from: a) external loading, b) internal loading, c) wind resuspension and d) bioturbation……………………………..16 Fig. 13. Model-predicted a) TP and b) chlorophyll concentrations for 2001……………..20 Fig. 14. Influence of supplemental flows on predicted: a) lake surface elevation, b) surface area, and c) mean depth……………………………………………………………..21 Fig. 15. Influence of supplemental flows on predicted: a) total P, b) chlorophyll, and c) Secchi depth…………………………………………………………………………………22 Fig. 16. Influence of supplemental flows on predicted loading from: a) EVMWD, b) EVMWD+treatment, c) EMWD, & d) island wells…………………………………………...23 Fig. 17. Influence of flow supplementation on: a) lake elevation and b) TP concentration……………………………………………………………………………………27 Fig. 18. Predicted TP concentrations over time with recycled water and well inputs. Effects of: a) aeration and b) carp removal………………………………………………….29
iii

Final Report: Lake Elsinore Model 12 March 2006 ______________________________________________________________________________________
List of Tables Table 1. Rainfall, lake elevation and derived runoff coefficients for 3 storms in 2001……5 Table 2. Predicted wave properties as a function of windspeed for a 3 km fetch………...8 Table 3. Updated area-volume-elevation data………………………………………………12 Table 4. Predicted annual loading (kg) of P to Lake Elsinore for 1993-2004……………17 Table 5. Results from model sensitivity analysis. Parameter values represent 2001 conditions.……………………………………………………………………………………….18 Table 6. Parameter values used in uncertainty analysis for 2001………………………...19 Table 7. Comparison of measured and model-predicted water quality: 2001…………...19 Table 8. Predicted median water quality and phosphorus loading under different lake management techniques………………………………………………………………………25 Table 9. Influence of supplemental flows on the frequency of days from 1993-2004 that the lake level declined below 1240 ft and when TP levels exceeded 0.1 mg/L…….27 Table 10. Effect of aeration and carp removal on frequency when TP>0.1mg/L…..29
iv

Final Report: Lake Elsinore Model 12 March 2006 ______________________________________________________________________________________
Executive Summary
A model was developed to predict the impacts on water quality in Lake Elsinore
from recycled water addition, groundwater inputs, aeration, lake level stabilization, and
carp removal. Results from recent nutrient budget and internal loading studies, fish
population surveys, monitoring data collected over the past decade, and other studies
were used to develop and parameterize the model. The differential form of the model
was found to accurately reproduce observed water quality over the period from 1993-
2004. Monte Carlo techniques were incorporated into a steady-state form of the model to
develop probabilistic descriptions of predicted water quality and estimates of uncertainty
in model predictions.
The steady-state form of the model was used to assess the impacts of recycled
water and groundwater inputs to the lake. Assuming Lake Elsinore received average
rainfall and runoff each year, the lake level was predicted to stabilize at 1222.7 ft above
MSL, have a mean depth <1 m, and TP concentrations near 1 mg/L. Against this
shallow, hypereutrophic lake condition, addition of supplemental water increased surface
elevation and mean depth and decreased predicted TP concentrations. About 6000 af/yr
of supplemental water was needed maintain the lake level at 1240 ft. The source of the
supplemental water affected the predicted TP levels; 6,000 af/yr inputs from EVMWD,
EMWD or the island wells yielded median predicted TP concentrations in the lake of
0.49, 0.28 and 0.28 mg/L, respectively. Chemical phosphorus removal at the EVMWD
plant to 0.5 mg/L lowered the median predicted TP concentration in Lake Elsinore to
0.35 mg/L. Even under conditions of high annual inflows with high TP concentrations,
internal loading dominated the predicted P budget for the lake.
Other restoration efforts also affected the predicted steady-state water quality in the
lake. Aeration was found to very favorably reduce median predicted TP and chlorophyll
concentrations; for example, aeration sufficient to reduce the internal recycling rate by
30% was predicted to lower the TP concentration from 0.377 mg/L to 0.148 mg/L and
reduce chlorophyll levels from 395 µg/L to 102 µg/L. Carp removal was less effective
than aeration at improving water quality (e.g., a 75% reduction in carp biomass lowered
the median predicted TP concentration to 0.26 mg/L).
1

Final Report: Lake Elsinore Model 12 March 2006 ______________________________________________________________________________________
Introduction
Lake Elsinore is a shallow, polymictic and highly eutrophic lake that is subject to
wide variations in lake elevation, nutrient concentrations, DO levels and algal
productivity. Recent studies have demonstrated the importance of internal sources of
nutrients to the overall nutrient budget in Lake Elsinore (Montgomery-Watson, 1997;
Anderson, 2001). For example, a nutrient budget developed for 2001 with limited runoff
(2520 af) indicated that external loading accounted for only 626 kg of total P inputs as
compared with 33,160 kg of P input to the water column in the dissolved form based
upon core-flux measurements (Anderson, 2001).
The mass of particulate P recovered in sediment traps exceeded the known inputs,
however, and thus implicated resuspension as an additional and important source of P
that delivered an estimated 50,606 kg of P to the water column. The shallow mean depth
of the lake at the time of these measurements (4.3 m) suggests that wind energy may
have resuspended sediments during periods of high winds (Carper and Bachman, 1984;
Scheffer, 1998). Moreover, the intense evaporative demand in the region removes an
average of 1.43 m of water each year from the lake; thus during droughts and other
periods of low total runoff to the lake, the lake experiences rapid declines in lake
elevation and mean depth. Declining lake level results in exposure of new sediments to
wind resuspension as the wave-mixed layer advances lower into the lake. Thus it follows
that lake elevation is an important factor in understanding the importance of wind-driven
sediment resuspension.
In addition to sediment resuspension by wind, bioturbation by benthivorous fish is
thought to be important. A recent fish population survey puts carp levels at about
700,000 – 1.5 million, or 1 fish for every 8 - 17 m2 of lake bottom (EIP, 2004). Carp and
other benthivorous fish are widely recognized for their ability to disturb and resuspend
substantial amounts of sediment during feeding (Scheffer, 1998).
Several efforts are planned or underway to improve water quality in the lake,
including lake level stabilization by supplemental recycled water and groundwater inputs,
aeration via axial flow pumps to improve DO levels in the subsurface to minimize fish
kills and reduce internal P recycling, and carp removal to reduce sediment resuspension
and associated effects on internal nutrient recycling, remove P and biomass, and help
balance the fishery.
2

Final Report: Lake Elsinore Model 12 March 2006 ______________________________________________________________________________________
The objective of this study was to evaluate the relative changes in water quality that
can be expected from these and other lake management efforts through development
and application of a water quality model for Lake Elsinore.
Approach
A model has been developed that incorporates known processes affecting total P
(TP) levels and resulting chlorophyll and transparency levels in the lake (Fig. 1). The
model is an extension of a preliminary model originally developed for the lake as part of
an agreement with CH2M-Hill that has also been used in recent TMDL efforts.
InternalRecycling
Resuspension by Wind Bioturbation
SettlingExternalLoading
Fig. 1. Processes affecting nutrient levels in Lake Elsinore.
External loading, internal recycling, and resuspension of bottom sediments by wind
and by bioturbation are all source terms that deliver dissolved and/or particulate forms of
P to the water column. Since the lake has not released water through outflow since the
El Nino of 1995, settling is functionally the only process by which P is lost from the water
column. Normalized to unit surface area, the P cycle can be described as a series of
fluxes that, when at steady-state, requires that the sources are balanced by losses.
Thus, it can be written that:
JS=JEL+JW+JIL+JB (1)
where JS is the settling flux rate, JEL is the external loading rate normalized to lake area,
JW is the resuspension flux due to wind, JIL is the internal loading rate, and JB is the flux
due to bioturbation by fish (principally carp). All flux rates are expressed in units of
mg/m2/d.
External loading (JEL)
The external loading of nutrients to the lake arises from inputs from the watershed,
which vary strongly depending upon precipitation inputs to the region. El Nino events
have typically produced substantial runoff, while average and below average rainfall (La
3

Final Report: Lake Elsinore Model 12 March 2006 ______________________________________________________________________________________
Nina years) yield very little runoff that is largely restricted to the local watershed. In an
effort to provide a more consistent source of water to the lake and thus limit net
evaporative losses during periods of low rainfall, recycled water addition was started in
July 2002. Groundwater inputs from the island wells have also recently begun. The
areally-normalized loading of P from these external sources, JEL, can be written as:
)2(A
CRPACQJ
w
n
1iwi
EL
∑=
+=
where Qi and Ci are the daily flow (m3/d) and average TP concentration (mg/m3) of
external source i (taken here as recycled water from EVMWD, recycled water from
EMWD, or groundwater from the island wells), P is the precipitation rate (m/d), Aw is the
area of the local watershed (m2), R is the runoff coefficient representing the fraction of
rainfall that runs off into the lake from the local watershed (m/m), and Cw is the
concentration of P in the runoff (mg/m3). The upper watershed, defined here as the
watershed upstream of the Canyon Lake dam, is accounted for in these calculations,
through the San Jacinto River flow reported at the USGS gage #11070500. This
contribution is especially important during El Nino years, while supplemental water from
recycled water and groundwater sources would be less needed.
The total annual flow of recycled water over the period July 2002 – June 2003 from
EVMWD was 2018 af, while EMWD released 1498 af over this period (Veiga-
Nascimento and Anderson, 2004). A target flow from EVMWD of up to 4500 af/yr is
planned, although volumes will be pumped as available. The average TP concentration
over this period was 1.99±1.03 mg/L, with all phosphorus in the dissolved form; adding
additional treatment to lower these levels is under consideration (CH2M, 2004).
The volume-weighted average runoff concentration of TP was 0.20 mg/L during the
2001 water year (Anderson, 2001). The atmospheric deposition rate for P is not known,
but is thought to be very low compared with other external and internal sources.
The runoff coefficient for the local watershed was estimated from lake elevation
changes following precipitation events. Rainfall and lake elevation changes were
evaluated for 3 storms in 2001 and used to derive runoff coefficients for each of these
events (Table 1).
The lake elevation increased by 2.26 – 3.36x the amount of precipitation falling
directly upon the lake surface, indicating contributions from the local watershed. (These
storms were not of sufficient intensity to generate any significant release from Canyon
4

Final Report: Lake Elsinore Model 12 March 2006 ______________________________________________________________________________________
Lake.) With a local watershed area of 54 km2 draining directly to the lake (TetraTech,
2003), one calculates total rainfall volumes of 1655, 2329 and 477 af that fell within the
local watershed during those 3 events (excluding that falling directly on the lake surface).
With an average lake elevation of 1241.75 ft, the lake surface area is very close to 3000
acres; thus the increases in lake elevation due to local watershed inputs for those 3
events correspond to 468, 676 and 253 af, respectively, for a total of 1397 af for the 3
storms (very close to the median annual value reported by CH2M-Hill for 1991-2000
(CH2M, 2004)). The runoff coefficients, defined simply as the volume of runoff to the
volume of rainfall striking the local watershed (assuming negligible subsequent flow from
the back basin), were thus calculated as 0.28, 0.29 and 0.53 (Table 1). As is expected,
the runoff coefficient increased over the 3 storms, reflecting both increased antecedent
moisture levels in the soils and shorter time intervals between the storms.
Table 1. Rainfall, lake elevation and derived runoff coefficients for 3 storms in 2001.
Date (2001) Rainfall (mm) Lake Elev (mm) Lake Elev/Rainfall Runoff Coeff
Feb. 12-14 37.8 85.3 2.26 0.28
Feb. 23-28 53.2 121.9 2.29 0.29
Mar. 6-10 10.9 36.6 3.36 0.53
Bioturbation (JB)
A number of researchers have demonstrated a linear increase in suspended solids
concentrations and resuspension flux with increased density of benthivorous fish (e.g.,
Meijer et al. 1989; Breukelaar et al., 1994). In the study by Breukelaar et al. (1994),
experimental data for a series of small ponds with varying densities of benthivorous carp
were well fit by a line through 0 with a slope of 0.24 g/m2/d per kg/ha. Assuming this
relationship also reasonably holds for carp in Lake Elsinore, and further assuming a total
population of 700,000 – 1,500,000 carp in about 3000 acres for a density of 233 - 500
fish per acre (or 576-1235 per ha), at a median mass of about 860 g (EIP, 2004), which
corresponds to 496 – 1062 kg/ha, one calculates a predicted bioturbation rate of 119 –
255 g/m2/d. A previous assessment of labile inorganic P following Rydin and Welch
(1999) found 273±32 µg/g sediment against a total sediment P content of 916±73 µg/g in
the fine organic type III sediments was potentially labile, although the short lifetime of
suspended sediment in the water column would limit the net amount released from the
particles. A smaller amount was loosely sorbed (85 µg/g). A linear partition coefficient
5

Final Report: Lake Elsinore Model 12 March 2006 ______________________________________________________________________________________
(Kd) describing the amount of loosely sorbed P (S) in local equilibrium with the porewater
at concentration (C) is given by:
Kd = S/C (3)
where Kd is the partition coefficient (L/g), S is the sorbed concentration (mg/g) and C is
the solution concentration (mg/L). At a loosely sorbed concentration of 85 µg/g or 0.085
mg/g and a porewater concentration of 6.0 mg/L, one calculates a Kd of 0.014 L/g.
Peeper measurements have shown that the porewater dissolved P (and NH4-N)
concentrations increase with depth beneath the sediment surface, from quite low values
(often 0.1 – 0.2 mg/L) to 2 – 6 mg/L approximately 10 cm deep into the sediments
(Anderson, 2001). Since most benthic organisms are located in the upper few cm of
sediment, we will assume that carp typically forage and disturb the uppermost 2-3 cm of
sediment. By linear extrapolation of porewater profiles from a number of sites and
throughout 2000-2001, the SRP concentration averaged 0.71±0.35 mg/L in the
uppermost 2-3 cm. With an average sediment dry-weight of approximately 0.12 g/g, this
corresponds to 7.3 mL of porewater released per dry-weight g sediment disturbed; with a
typical porewater concentration of 0.71 mg/L, this corresponds to release of 0.0052 mg
porewater SRP per g resuspended sediment (0.0052 mg/g). Further assuming that
essentially all of the loosely sorbed P, calculated from eq 3 using the Kd of 0.014 L/g and
C of 0.71 mg/L (0.010 mg/g), would also be released due to the mixing into the low
concentration overlying water, one calculates a total of 0.015 mg P is released upon
resuspension of 1 g of sediment (dry-weight) (0.015 mg P/g sediment).
With information about carp population density, the findings of Breukelaar et al.
(1994), and the bioavailable fraction of P released upon disturbance, one can propose
that the flux of bioavailable P due to bioturbation can be written as:
JB = fPMB (4)
where JB is the bioturbation flux rate of bioavailable P (mg/m2/d), f is the normalized
sediment resuspension flux rate of 0.24 g/m2/d per kg carp/ha (Breukelaar et al., 1994),
P is the fish population in the lake (fish/ha), M is the average mass of the carp (kg/fish),
and B represents the bioavailable P fraction of the resuspended sediment (mg/g).
6

Final Report: Lake Elsinore Model 12 March 2006 ______________________________________________________________________________________
Wind Resuspension (JW)
0
20
40
60
80
Sus
pend
ed S
olid
s (m
g/L)
Total SSAlgal SSNon-Algal SS
Jul Aug Sept Oct Nov Dec
0
10
20
30
40
50
Win
d S
peed
(m2 /s
2 )
The potential for wind-driven
resuspension of bottom sediments at
Lake Elsinore is high given its shallow
depth, relatively long fetch and periodic
strong winds. For example, elevated non-
algal turbidity levels were found in the late
fall of 2003 that coincided with an
increase in the square of the windspeed,
which is directly proportional to wind
shear acting on the lake surface (Fig. 2).
Non-algal turbidity was estimated from
total suspended solids (TSS)
concentrations using measured
chlorophyll values assuming that
chlorophyll comprises about 1.5% dry-
weight of an algal cell (APHA, 1998).
Jul Aug Sep Oct Nov DecDate
Fig. 2. Temporal trends in a) suspended solids concentrations and b) square of windspeed.
The potential for wind resuspension
can be evaluated theoretically as well.
Specifically, resuspension can occur
when deep-water waves enter water
shallower than one-half the wave length
(Bloesch, 1995). The wavelength, L, of a
deepwater wave is related to its period, T, by the relation:
π2gTL
2
= (5)
where g is the gravitational constant (Martin and McCutcheon, 1999). A wave’s period
can be estimated using the empirical equation developed by the US Army Coastal
Engineering Research Center (Carper and Bachmann, 1984) that states:
g
UgF0770U42
T
250
2⎥⎥⎦
⎤
⎢⎢⎣
⎡⎟⎠⎞
⎜⎝⎛
=
.
.tanh. π
(6)
where U is the wind speed and F is the fetch.
7
Final Report: Lake Elsinore Model 12 March 2006 ______________________________________________________________________________________
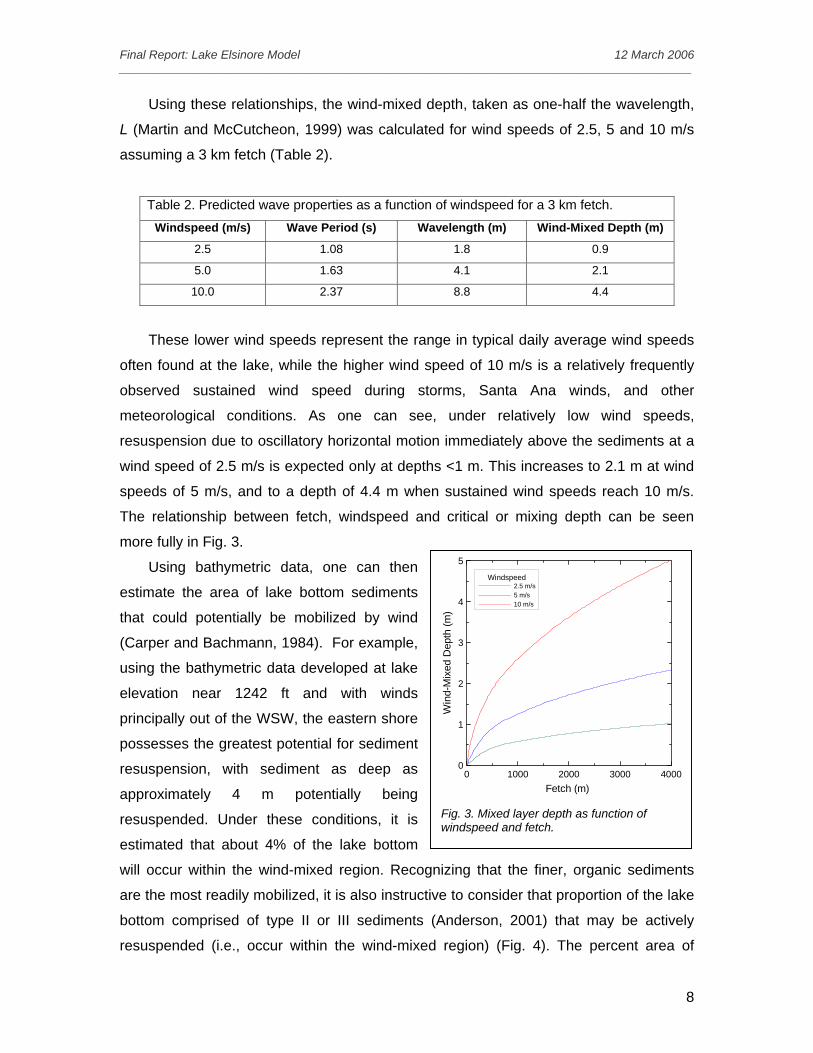
Using these relationships, the wind-mixed depth, taken as one-half the wavelength,
L (Martin and McCutcheon, 1999) was calculated for wind speeds of 2.5, 5 and 10 m/s
assuming a 3 km fetch (Table 2).
Table 2. Predicted wave properties as a function of windspeed for a 3 km fetch.
Windspeed (m/s) Wave Period (s) Wavelength (m) Wind-Mixed Depth (m)
2.5 1.08 1.8 0.9
5.0 1.63 4.1 2.1
10.0 2.37 8.8 4.4
These lower wind speeds represent the range in typical daily average wind speeds
often found at the lake, while the higher wind speed of 10 m/s is a relatively frequently
observed sustained wind speed during storms, Santa Ana winds, and other
meteorological conditions. As one can see, under relatively low wind speeds,
resuspension due to oscillatory horizontal motion immediately above the sediments at a
wind speed of 2.5 m/s is expected only at depths <1 m. This increases to 2.1 m at wind
speeds of 5 m/s, and to a depth of 4.4 m when sustained wind speeds reach 10 m/s.
The relationship between fetch, windspeed and critical or mixing depth can be seen
more fully in Fig. 3.
0 1000 2000 3000 4000Fetch (m)
0
1
2
3
4
5
Win
d-M
ixed
Dep
th (m
)
Windspeed2.5 m/s5 m/s10 m/s
Fig. 3. Mixed layer depth as function of windspeed and fetch.
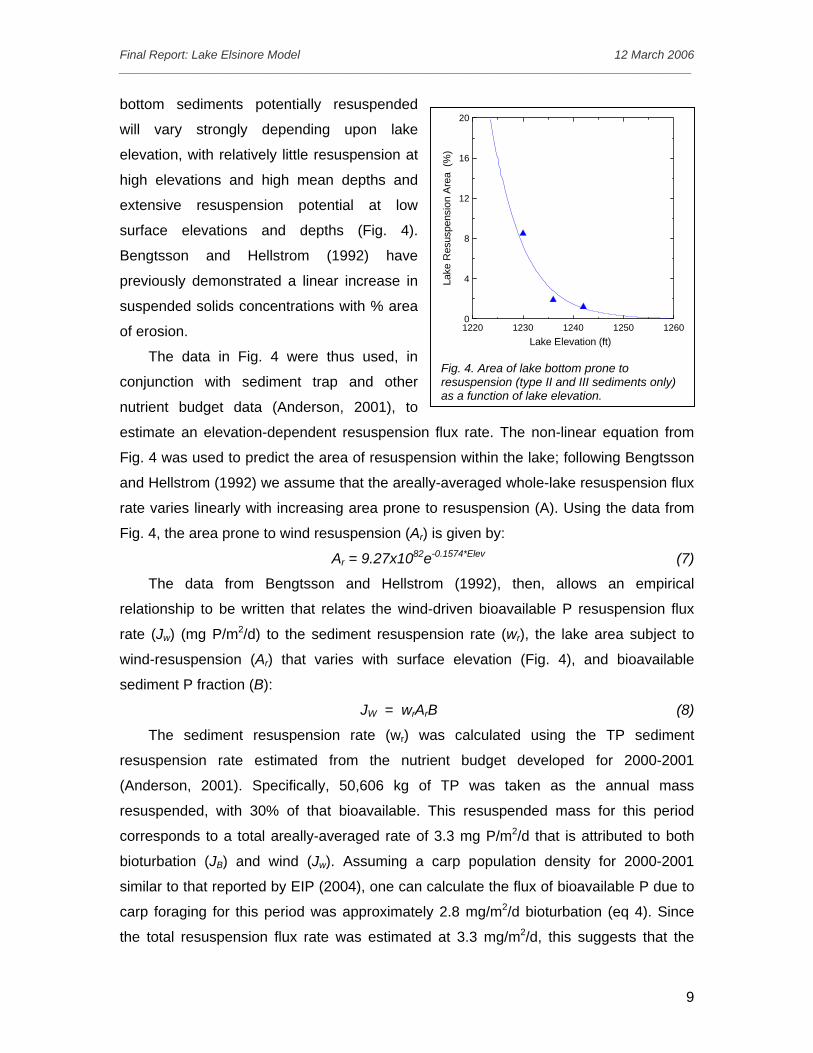
Using bathymetric data, one can then
estimate the area of lake bottom sediments
that could potentially be mobilized by wind
(Carper and Bachmann, 1984). For example,
using the bathymetric data developed at lake
elevation near 1242 ft and with winds
principally out of the WSW, the eastern shore
possesses the greatest potential for sediment
resuspension, with sediment as deep as
approximately 4 m potentially being
resuspended. Under these conditions, it is
estimated that about 4% of the lake bottom
will occur within the wind-mixed region. Recognizing that the finer, organic sediments
are the most readily mobilized, it is also instructive to consider that proportion of the lake
bottom comprised of type II or III sediments (Anderson, 2001) that may be actively
resuspended (i.e., occur within the wind-mixed region) (Fig. 4). The percent area of
8
Final Report: Lake Elsinore Model 12 March 2006 ______________________________________________________________________________________
bottom sediments potentially resuspended
will vary strongly depending upon lake
elevation, with relatively little resuspension at
high elevations and high mean depths and
extensive resuspension potential at low
surface elevations and depths (Fig. 4).
Bengtsson and Hellstrom (1992) have
previously demonstrated a linear increase in
suspended solids concentrations with % area
of erosion. 0
The data in Fig. 4 were thus used, in
conjunction with sediment trap and other
nutrient budget data (Anderson, 2001), to
estimate an elevation-dependent resuspension
Fig. 4 was used to predict the area of resuspens
and Hellstrom (1992) we assume that the areally
rate varies linearly with increasing area prone to
Fig. 4, the area prone to wind resuspension (Ar) i
Ar = 9.27x1082e-
The data from Bengtsson and Hellstrom
relationship to be written that relates the wind-
rate (Jw) (mg P/m2/d) to the sediment resuspen
wind-resuspension (Ar) that varies with surfac
sediment P fraction (B):
JW = wrArB
The sediment resuspension rate (wr) wa
resuspension rate estimated from the nutrie
(Anderson, 2001). Specifically, 50,606 kg of
resuspended, with 30% of that bioavailable. T
corresponds to a total areally-averaged rate of
bioturbation (JB) and wind (Jw). Assuming a c
similar to that reported by EIP (2004), one can c
carp foraging for this period was approximately
the total resuspension flux rate was estimated
1220 1230 1240 1250 126Lake Elevation (ft)
0
4
8
12
16
20
Lake
Res
uspe
nsio
n A
rea
(%)
Fig. 4. Area of lake bottom prone to resuspension (type II and III sediments only)as a function of lake elevation.
flux rate. The non-linear equation from
ion within the lake; following Bengtsson
-averaged whole-lake resuspension flux
resuspension (A). Using the data from
s given by: 0.1574*Elev (7)
(1992), then, allows an empirical
driven bioavailable P resuspension flux
sion rate (wr), the lake area subject to
e elevation (Fig. 4), and bioavailable
(8)
s calculated using the TP sediment
nt budget developed for 2000-2001
TP was taken as the annual mass
his resuspended mass for this period
3.3 mg P/m2/d that is attributed to both
arp population density for 2000-2001
alculate the flux of bioavailable P due to
2.8 mg/m2/d bioturbation (eq 4). Since
at 3.3 mg/m2/d, this suggests that the
9
Final Report: Lake Elsinore Model 12 March 2006 ______________________________________________________________________________________
wind-driven resuspension flux rate of bioavailable P for 2000-2001 was 0.5 mg/m2/d. At
an average elevation near 1241 ft, about 1.1% of the lake area would have been subject
to wind resuspension following eq 7. With a B value of 0.015 mg P/g sediment, wr is
about 3030 g sediment/m2/d, equivalent to wind resuspending the top 2.7 mm of
sediment.
Internal Loading (JIL)
Internal loading has previously been shown to be an important source of nutrients to
Lake Elsinore, especially during periods of limited external loading. Thus, in addition the
mathematical expressions to describe the contributions of external loading, wind
resuspension and bioturbation, it is necessary to quantitatively describe internal
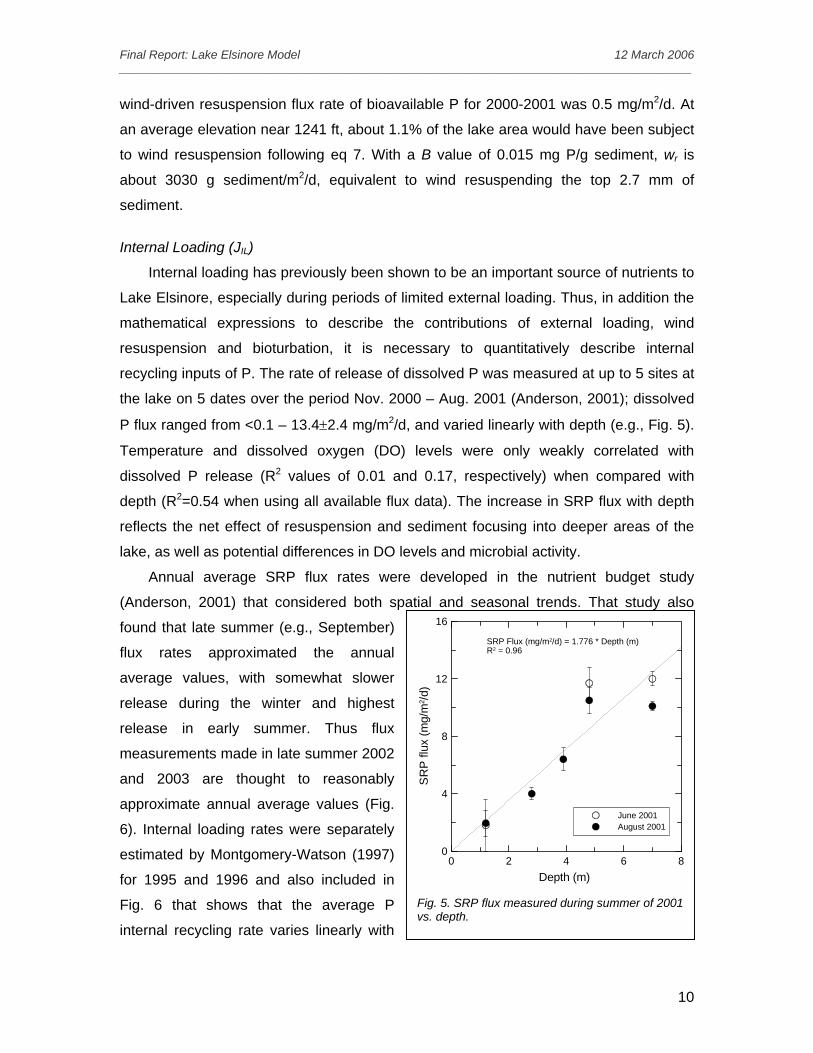
recycling inputs of P. The rate of release of dissolved P was measured at up to 5 sites at
the lake on 5 dates over the period Nov. 2000 – Aug. 2001 (Anderson, 2001); dissolved
P flux ranged from <0.1 – 13.4±2.4 mg/m2/d, and varied linearly with depth (e.g., Fig. 5).
Temperature and dissolved oxygen (DO) levels were only weakly correlated with
dissolved P release (R2 values of 0.01 and 0.17, respectively) when compared with
depth (R2=0.54 when using all available flux data). The increase in SRP flux with depth
reflects the net effect of resuspension and sediment focusing into deeper areas of the
lake, as well as potential differences in DO levels and microbial activity.
0 2 4 6 8Depth (m)
0
4
8
12
16
SR
P fl
ux (m
g/m
2 /d)
June 2001August 2001
SRP Flux (mg/m2/d) = 1.776 * Depth (m)R2 = 0.96
Fig. 5. SRP flux measured during summer of 2001 vs. depth.
Annual average SRP flux rates were developed in the nutrient budget study
(Anderson, 2001) that considered both spatial and seasonal trends. That study also
found that late summer (e.g., September)
flux rates approximated the annual
average values, with somewhat slower
release during the winter and highest
release in early summer. Thus flux
measurements made in late summer 2002
and 2003 are thought to reasonably
approximate annual average values (Fig.
6). Internal loading rates were separately
estimated by Montgomery-Watson (1997)
for 1995 and 1996 and also included in
Fig. 6 that shows that the average P
internal recycling rate varies linearly with
10

Final Report: Lake Elsinore Model 12 March 2006 ______________________________________________________________________________________
0 0.1 0.2 0.3 0.4Average TP Concentration (mg/L)
0
10
20
30
40
Av
the average TP concentration. This
observation has practical importance for a
number of reasons.
erag
Inte
e P
rnal
Loa
ding
Rat
e (m
g/m
2 /d)
1995
1996
2001
20022003
SRP Flux = 84.8*TP Concentration95% CI: 63.1 - 106.6R2=0.80
Fig. 6. Average P recycling rate vs. water column TP concentration.
First of all, many models developed
to describe the internal recycling of
nutrients from sediment involve fairly
elaborate descriptions of the sediment
properties and their transformation
reactions, even though the exact
sediment properties and the forms of P
involved in release are poorly understood.
Parameterization of such models requires
a great deal of information about the
sediments and a number of assumptions about these transformation reactions.
The approach adopted here does not require specific assumptions about the
sediment properties and transformation reactions; rather internal recycling rates are
proposed to be a linear function of TP in the water column (Fig. 6). This is intuitively not
unreasonable since the sedimentation flux rate, Js, is proportional to the water column
concentration, i.e.,
Js = ν C (9)
where ν is the settling velocity of algal-derived TP (m/d) and C is the water column
concentration (mg/m3). Moreover, this is consistent with available historical data that
shows directly measured (2001, 2002 and 2003) and estimated (1995, 1996) internal
loading rates increased with increased average water column TP concentrations (Fig. 6).
Since ν is 0.1 m/d (Anderson, 2002), the upward flux of dissolved nutrients (JIL)
averaged 84.8% of the downward total P flux (JS). That is, 84.8% of the TP that settles
out of the water column is recycled and only 15.2% is permanently lost from the water
column. Thus P is sequestered only slowly in Lake Elsinore. For comparison, it is
estimated that the P sequestration rate in the Salton Sea is 3x higher than Lake
Elsinore, with 46% of the P that settles out of the water column of the Salton Sea
permanently lost to the sediments.
On this basis then, the internal recycling rate of P (JIL), is simply given by:
JIL = iO C (10)
11
Final Report: Lake Elsinore Model 12 March 2006 ______________________________________________________________________________________
where i represents the slope of the fitted line in Fig. 6 (84.8 mg/m2/d per mg/L), O
represents a scalar to account for oxygenation or aeration effects, and C is the TP
concentration in the water column.
Substituting eqs 2, 4, 8, 9 and 10 into eq 1 and dividing both sides by mean depth
(H) allows eq 1 to be rewritten as a differential equation describing the change in P
concentration over time (dC/dt):
)11(H
CiOCBAwBMfPV
RCPACQ
dtdC rrfr
n
1iwwii υ−++
++
=∑
=
Calculation of the change in TP concentration over time with eq 11 requires
information about a number of variables. The model allows for external loading from both
well-defined sources, and from non-point local runoff that will vary in response to
precipitation inputs. Such inputs will also influence the volume of the lake (V), as well as
the surface area and mean depth (H). As a result, it is necessary to also write a related
hydrologic balance equation where the change in volume (V) over time (dV/dt) is:
)12(EAPRAPAQdtdV
iwi∑ −++=
where Qi reflects inputs due to San Jacinto
River, recycled water and island well flows
and losses due to channel outflow, P is the
precipitation rate, A is the surface area of
the lake, R is the runoff coefficient, Aw is the
area of the local watershed, E is the
evaporation rate, and A is lake surface
area. As a result, PA reflects direct
precipitation onto the lake surface, and
PRAw represents the contributions from
local runoff. Loss of water from the lake is
assumed to be chiefly due to evaporation
from the lake surface (EA), although
outflow at very high lake elevations
(>1255’) can also occur.
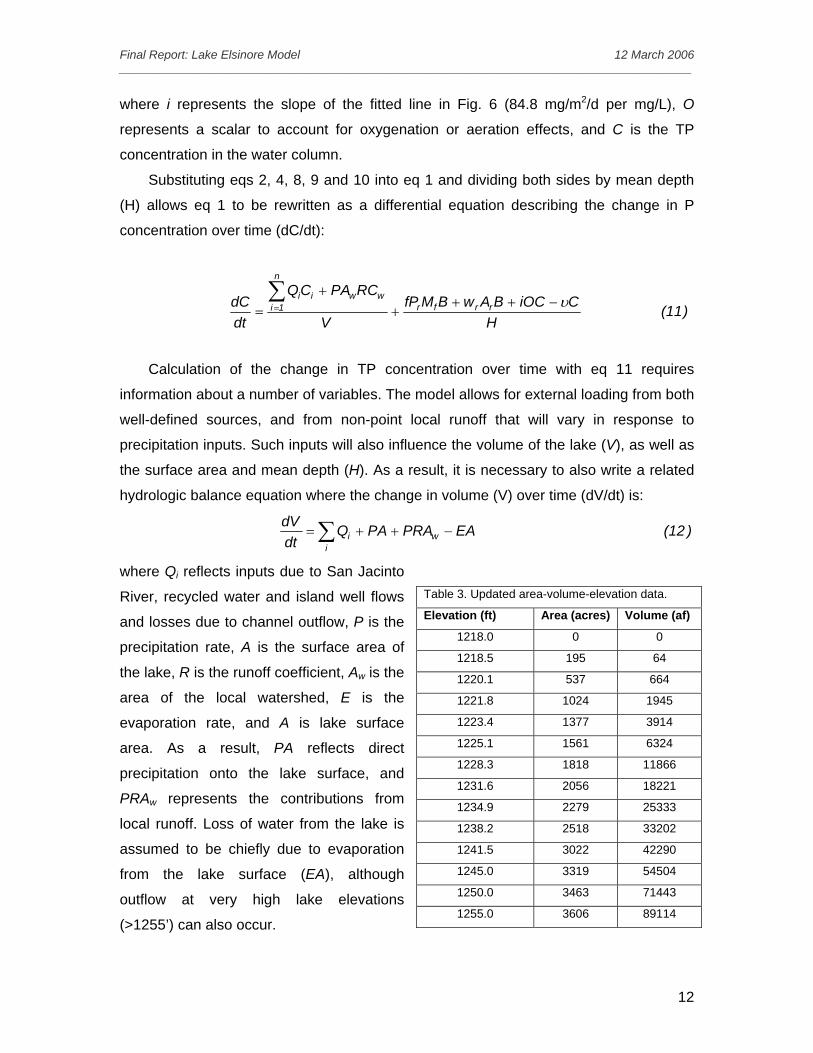
Table 3. Updated area-volume-elevation data.
Elevation (ft) Area (acres) Volume (af)
1218.0 0 0
1218.5 195 64
1220.1 537 664
1221.8 1024 1945
1223.4 1377 3914
1225.1 1561 6324
1228.3 1818 11866
1231.6 2056 18221
1234.9 2279 25333
1238.2 2518 33202
1241.5 3022 42290
1245.0 3319 54504
1250.0 3463 71443
1255.0 3606 89114
12

Final Report: Lake Elsinore Model 12 March 2006 ______________________________________________________________________________________
The original hypsographic data from
Black and Veatch (1995) were updated to
reflect bathymetric results from Anderson
(2001) (Table 3), which found a lower
minimum lake elevation (1218 ft) as
compared with Black and Veatch’s (1995)
value of 1223 ft. Bathymetric data (Fig. 7)
were then used to develop an empirical
relationship between lake surface area (A,
in acres) and volume (V, in acre-feet): 0
A =(V / 9.66x10⁻⁵)A0.4008 (13)
Steady-State Solution
Rearranging eq 11 and solving for the s
following expression:
V
)CPRACQ(H
Ci
wwii
ν
++
=
∑
where C is the predicted steady-state concen
dissolved and bioavailable P into the water c
to algal biomass.
Similarly, eq 12 can be solved for th
can be calculated:
PE
PQA i
i
−
+=
∑
The volume can in turn be estimated from the
Input Data
Solution to the differential equation desc
over time (eq 11) requires solution of the
result, meteorological and runoff data were u
0 1000 2000 3000 400Surface Area (acres)
0
20000
40000
60000
80000
100000
Vol
ume
(af)
Y = 9.66x10⁻⁵*X2.495
R2 = 0.982
Fig. 7. Volume as function of lake surface area.
teady-state case (i.e., dC/dt = 0) yields the
)14(BAwBMfPiOC rrff ++
tration of TP in the water column. Inputs of
olumn are assumed to be rapidly converted
e steady-state case where the lake area (A)
)15(RAw
predicted lake surface area using eq 13.
ribing the TP concentration in Lake Elsinore
hydrologic balance equation (eq 12); as a
sed as input for model calculations (Fig. 8).
13

Final Report: Lake Elsinore Model 12 March 2006 ______________________________________________________________________________________
Precipitation data were averaged from the CIMIS stations at UCR and Temecula (Fig.
8a), while evaporation data were taken from the UCR station (Fig. 8b).
0
0.02
0.04
0.06
0.08
0.1
0.12
Pre
cipi
tatio
n (m
/d)
1993 1995 1997 1999 2001 2003 2005Time
0
5
10
15
20
25
Inflo
ws
(cfs
)
EVMWDEMWDIsland Wells
0
0.002
0.004
0.006
0.008
0.01
Eva
pora
tion
(m/d
)
a) Precipitation
b) Evaporation
d) Other Inflows
0
1000
2000
3000
4000
5000
Run
off (
cfs)
c) SJR Flow
The large precipitation inputs to the region in 1993, 1995 and 1998 resulted in
substantial runoff to the lake from the San Jacinto River (USGS gaging station
#11070500) (Fig. 8c). Very little measurable runoff to the lake occurred over the period
1999 – 2002, although some significant
runoff occurred in the spring of 2003 and in
late 2004 (Fig. 8c). Recycled water and
island well flows (Fig. 8d) were minor in
relation to the very large flows from the
upper watershed that occurred occasionally
(note difference in y-axis values). Flows
were used with measured or assumed
concentrations (Fig. 9) to yield TP inputs for
the 4 external nutrient inputs to the lake
(i.e., the summation term on the rhs of eq
11). As implied by the very large differences
in flows to the lake from the watershed
during wet years relative to flows in 2002-
2004 from other sources (e.g., recycled
water), TP inputs also varied strongly
between the San Jacinto River inputs during
the high precipitation years and the drought
years, as well as the other inputs (Fig. 10).
1993 1995 1997 1999 2001 2003 2005Time
0
1000
2000
3000
TP C
onc
(mg/
m3 )
SJREVMWDEMWDIsland Wells
Fig. 8. Meteorological and hydrological conditions: a) precipitation, b) evaporation, c) San Jacinto R. flow and d) other inflows. Fig. 9. Total P concentrations of different inflows
over time.
14

Final Report: Lake Elsinore Model 12 March 2006 ______________________________________________________________________________________
Results Simulation Results: 1993-2004
5
The differential equations describing
the change in TP concentration (eq 11)
and lake volume (eq 12) were solved
used a daily timestep and the
meteorological, flow and other data (Figs.
8 and 9). Predicted lake volumes were
converted to predicted lake elevations
using the hypsographic data in Table 3.
The hydrologic model generally did a
very good job of reproducing the observed
changes in lake elevation (Fig. 11a); the
only strong deviation between the
predicted and observed values occurred
in the summer-fall of 1994, where the
model predicted lower surface elevations
(<1250’) than those recorded (1253’). The
reason for this deviation is not clear, but
given the good agreement found
throughout the remainder of the
simulation period, no further efforts were
made to reduce this variance.
Total phosphorus concentrations
were also quite well described by the
model (Fig. 11b). It correctly reproduced
the relatively rapid loss in TP over the
1993-1997 period, the relatively stable
water quality in 2000-2001, and the
increase in TP that began in the spring of
2002 (prior to recycled water addition). As
noted in other reports, this increase in TP
concentrations coincided with the lowest
lake elevations found since January 1993.
1993 1995 1997 1999 2001 2003 200Time
0
4
8
12
16
20
EVMWDEMWDIsland Wells
0
4000
8000
12000
TP In
put (
kg/d
)
a) SJR
b) Other Inputs
Fig. 10. Daily TP inputs: a) San Jacinto R. and b)other inputs.
1993 1995 1997 1999 2001 2003 2005Time
0
0.2
0.4
0.6
0.8
1
Tota
l P C
once
ntra
tion
(mg/
L)
1230
1235
1240
1245
1250
1255
1260
Ele
vatio
n (
PredictedObserved
a) Elevation
b) TP Concentration
ft)
Fig. 11. Predicted and observed: a) lake surface elevation and b) TP concentration.
15

Final Report: Lake Elsinore Model 12 March 2006 ______________________________________________________________________________________
Recycled water inputs (Fig. 10b) and continued low lake levels resulted in increases in
TP concentrations in the lake through 2004 (Fig. 11b). The development of a strong,
year-round dominance of the algal community by the buoyant blue-green alga
Oscillatoria that began in 2002 may have also contributed to the subsequent increased
TP levels by reducing the algal settling velocity (eq 11). In fact, it was necessary to
reduce by 4% the settling velocity (v) for 2003 and 2004 to fit the TP levels found at this
time (Fig. 11). In the absence of this correction for reduced settling velocity for the
buoyant Oscillatoria, the predicted TP concentration plateaued near 0.4 mg/L and did
not reach the 0.6 mg/L concentrations measured at the lake.
0
20
40
60
80
100
120
Phos
phor
us L
oadi
ng (m
g/m
2 /d)
External LoadingInternal Loading
1993 1995 1997 1999 2001 2003 2005Time
0
0.2
0.4
0.6
0.8
1
Wind ResuspensionBioturbation
Maximum Loading 710 mg/m2/d
a)
b)
Fig. 12. Phosphorus loading normalized to lake surface area from: a) external loading, b) internal loading, c) wind resuspension and d) bioturbation.
The contributions from each of the 4 types of inputs (external loading, internal
loading, wind-driven sediment resuspension and resuspension due to carp foraging, i.e.,
bioturbation), normalized to the lake surface area, are shown in Fig. 12. External inputs
due to storm runoff varied in direct response to runoff volumes, while internal loading
varied more slowly over time (Fig. 12a). Nonetheless, even in large runoff years, internal
loading dominated the annual predicted nutrient budget, accounting for 82.3 – 97.1% of
the total P loading to Lake Elsinore (Table 4). Since internal recycling is directly coupled
in this model with water column P concentrations, even very large external loading
events, as found in 1993, play a
seemingly modest role in the overall
nutrient budget, although it is the
influence of external loading on P
concentration in the lake, combined with
the slow relative rate of net sedimentation,
that triggers subsequent high internal
loading rates. Nutrient loading due to
sediment resuspension from wind and
bioturbation were predicted to be only
minor sources of P to the water column
(Table 4). Wind resuspension accounted
for <1% of the predicted annual P budget
except during those years of very low lake
level and low external inputs (Table 4).
The amount of P input into the water
column from bioturbation was assumed to
16

Final Report: Lake Elsinore Model 12 March 2006 ______________________________________________________________________________________
be constant through 2001 since the carp population was treated as at carrying capacity
(fish/ha) until carp removal began in 2002.
Table 4. Predicted annual loading (kg) of P to Lake Elsinore for the period 1993-2004.
Year Total Loading (kg)
External Loading (kg)
Internal Loading (kg)
Wind (kg)
Bioturbation (kg)
1993 588,839 99,487 (16.9%) 484,411 (82.3%) 179 (<0.1%) 4,762 (0.8%)
1994 274,162 2,948 (1.1%) 266,644 (97.3%) 193 (0.1%) 4,377 (1.6%)
1995 244,019 22,257 (9.1%) 216,724 (88.8%) 110 (<0.1%) 4,928 (2.0%)
1996 137,965 2,455 (1.8%) 131,093 (95.0%) 226 (0.2%) 4,191 (3.0%)
1997 96,744 3,816 (3.9%) 88,885 (91.9%) 317 (0.3%) 3,726 (3.9%)
1998 108,252 9,107 (8.4%) 94,679 (87.5%) 215 (0.2%) 4,250 (3.9%)
1999 74,356 1,207 (1.6%) 69,143 (93.0%) 325 (0.4%) 3,681 (5.0%)
2000 56,535 1,191 (2.1%) 51,840 (91.7%) 521 (0.9%) 2,984 (5.3%)
2001 52,696 2,330 (4.4%) 47,070 (89.3%) 727 (1.4%) 2,569 (4.9%)
2002 53,699 4,339 (8.1%) 46,349 (86.3%) 1,142 (2.1%) 1,869 (3.5%)
2003 130,359 8,593 (6.6%) 119,105 (91.4%) 909 (0.7%) 1,751 (1.3%)
2004 212,278 9,897 (4.7%) 199,753 (94.1%) 814 (0.4%) 1,814 (0.9%)
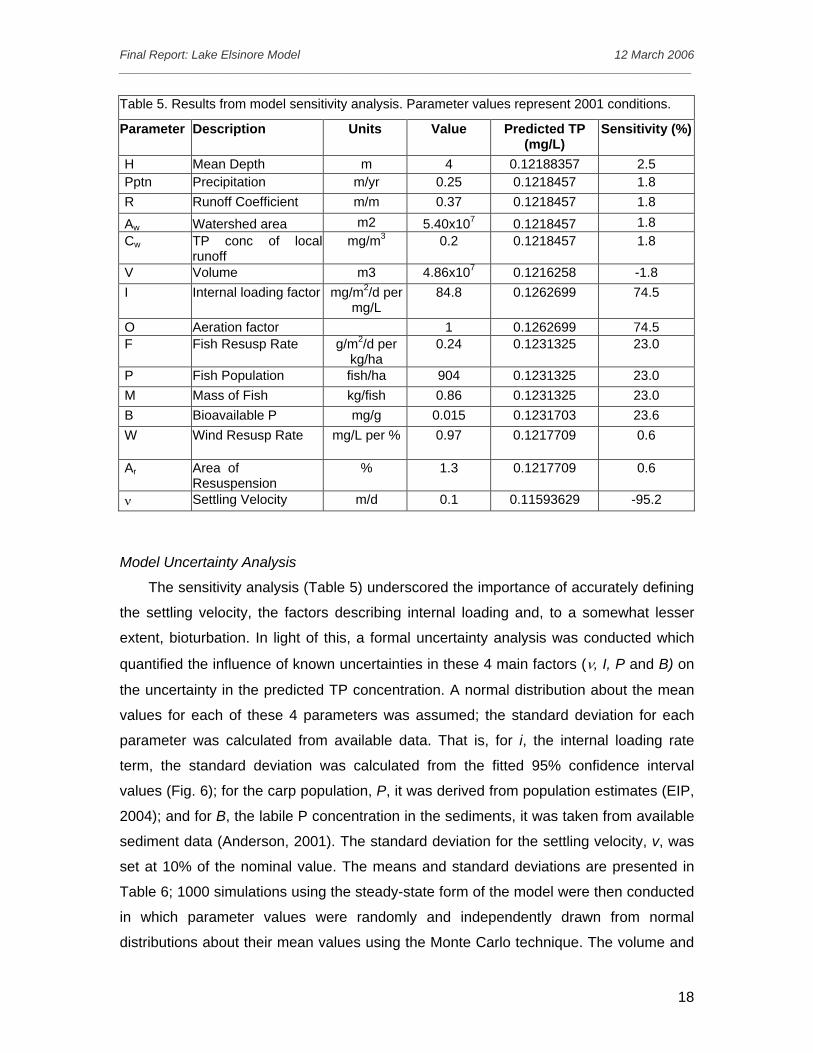
Model Sensitivity Analysis
The solution to the differential and steady-state forms of the lake TP model (eqs 11
and 14, respectively) requires definition of a number of parameters. A sensitivity analysis
of the model parameters was thus conducted in which parameters were systematically
varied by 5% from their 2001 mean values and compared to the concentration predicted
using the steady-state form of the model (eq 14) for the conditions present in 2001
(0.1217331 mg/L). The sensitivity analysis demonstrated that the model parameter with
the highest sensitivity was the particle settling velocity (ν), with a relative sensitivity of –
95.2% (indicating that predicted concentrations vary quite strongly and inversely with
changes in ν). That is, a 5% increase in ν resulted in a 4.76% decrease in predicted
concentration or a relative sensitivity of –95.2%. The factors associated with internal
loading (i and O) bore the next highest relative sensitivities at 74.5%, with lower
sensitivity of the model to the terms related to bioturbation (f, P, M and B) with relative
sensitivities of 23.0-23.6%%. The model was relatively insensitive to the remaining terms
(Table 5).
17
Final Report: Lake Elsinore Model 12 March 2006 ______________________________________________________________________________________
Table 5. Results from model sensitivity analysis. Parameter values represent 2001 conditions.
Parameter Description Units Value Predicted TP (mg/L)
Sensitivity (%)
H Mean Depth m 4 0.12188357 2.5 Pptn Precipitation m/yr 0.25 0.1218457 1.8 R Runoff Coefficient m/m 0.37 0.1218457 1.8
Aw Watershed area m2 5.40x10⁷ 0.1218457 1.8 Cw TP conc of local
runoff mg/m3 0.2 0.1218457 1.8
V Volume m3 4.86x10⁷ 0.1216258 -1.8 I Internal loading factor mg/m2/d per
mg/L 84.8 0.1262699 74.5
O Aeration factor 1 0.1262699 74.5 F Fish Resusp Rate g/m2/d per
kg/ha 0.24 0.1231325 23.0
P Fish Population fish/ha 904 0.1231325 23.0 M Mass of Fish kg/fish 0.86 0.1231325 23.0 B Bioavailable P mg/g 0.015 0.1231703 23.6 W Wind Resusp Rate mg/L per % 0.97 0.1217709 0.6
Ar Area of Resuspension
% 1.3 0.1217709 0.6
ν Settling Velocity m/d 0.1 0.11593629 -95.2
Model Uncertainty Analysis
The sensitivity analysis (Table 5) underscored the importance of accurately defining
the settling velocity, the factors describing internal loading and, to a somewhat lesser
extent, bioturbation. In light of this, a formal uncertainty analysis was conducted which
quantified the influence of known uncertainties in these 4 main factors (ν, I, P and B) on
the uncertainty in the predicted TP concentration. A normal distribution about the mean
values for each of these 4 parameters was assumed; the standard deviation for each
parameter was calculated from available data. That is, for i, the internal loading rate
term, the standard deviation was calculated from the fitted 95% confidence interval
values (Fig. 6); for the carp population, P, it was derived from population estimates (EIP,
2004); and for B, the labile P concentration in the sediments, it was taken from available
sediment data (Anderson, 2001). The standard deviation for the settling velocity, v, was
set at 10% of the nominal value. The means and standard deviations are presented in
Table 6; 1000 simulations using the steady-state form of the model were then conducted
in which parameter values were randomly and independently drawn from normal
distributions about their mean values using the Monte Carlo technique. The volume and
18

Final Report: Lake Elsinore Model 12 March 2006 ______________________________________________________________________________________
mean depth of the lake were set at those
found in 2001, when the lake was near an
apparent steady-state with respect to
water quality (Fig. 11b). The predicted TP
concentration was compared with the
observed mean concentration found in
2001.
Table 6. Parameter values used in uncertainty analysis for 2001. Parameter Units Mean ± s.d.
ν m/d 0.10±0.01
i mg/m2/d/mg/L 84.8±10.8
P Fish/ha 904±168
B mg/g 0.015±0.008
1000 simulations for the 2001 condition using randomly selected parameter sets
(Table 6), combined with fixed values for the remaining parameters (Table 5) yielded a
mean TP concentration of 0.123±0.021 mg/L. Chlorophyll a concentrations were
predicted from TP levels using the regression equation developed from monitoring data
for Lake Elsinore (Veiga-Nascimento and Anderson, 2004). The predicted mean TP and
chlorophyll concentrations were in reasonable accord with the observed annual average
values (e.g., observed mean TP concentration of 0.112±0.029) (Table 7). It should be
pointed out that the model was not calibrated to this data set, so the agreement between
the predicted and observed values is encouraging. The comparatively large standard
deviations for the observed data result from both spatial variability across the 3
monitoring sites at the lake and seasonal differences (this is especially true for
chlorophyll, when levels are typically much lower in the winter relative to the summer).
Table 7. Comparison of measured and model-predicted water quality: 2001.
Water Quality Parameter Predicted Observed
Total P Concentration (mg/L) 0.123 ± 0.021 0.112 ± 0.029
Chlorophyll Concentration (µg/L) 78.6 ± 19.6 80.4 ± 45.8
The results from the 1000 simulations are also presented graphically as probability
density functions (pdf) for TP (Fig. 13a) and chlorophyll (Fig. 13b). The predicted
concentrations do reasonably conform to a normal distribution, although there is a
relatively wide spread to the tails of the distribution (e.g., the 90% confidence interval
about the predicted mean TP concentration ranged from 0.089 – 0.166 mg/L). Predicted
chlorophyll concentrations also showed a fairly wide spread in their distribution; thus the
uncertainty in the key model parameters (Table 6) is propagated through the model to
yield predictions with significant uncertainty in average water column properties.
19

Final Report: Lake Elsinore Model 12 March 2006 ______________________________________________________________________________________
0.04 0.08 0.12 0.16 0.2TP Concentration (mg/L)
0
4
8
12
16
20Pr
obab
ility
(%)
a)
0 40 80 120 160
Chlorophyll Concentration (µg/L)
0
5
10
15
20
25
Pro
babi
lity
(%)
b)
Fig. 13. Model-predicted a) TP and b) chlorophyll concentrations for 2001.
Evaluation of Lake Management Activities: Steady-State Analysis
The deterministic, time-dependent model (eqs 11-12) reasonably reproduced lake
level and TP concentrations over the past decade (Fig. 11), while the steady-state form
of the model (eq 14) yielded good agreement with measured average TP and chlorophyll
concentrations in 2001 (Table 7). Monte Carlo analysis also allowed for the estimation of
the uncertainty in the predicted concentrations using values for key parameter with some
inherent uncertainty (Table 6).
The steady-state form of the model will now be used to evaluate the influence of
recycled water addition, aeration, carp removal, lake level, and island well groundwater
inputs on predicted water quality in Lake Elsinore. For this analysis, a Monte Carlo
analysis similar to that described above was conducted. That is, 1000 simulations were
conducted for each of a range of scenarios using unique parameter sets that involve key
model parameter values (υ, I P, and B) drawn from normal distributions about their mean
values (Table 6). Other model parameter values were assumed to be fixed (Table 5).
Given the low relative sensitivity of the model to most of these parameters, this
assumption is not expected to adversely affect the results and conclusions from this
analysis.
20

Final Report: Lake Elsinore Model 12 March 2006 ______________________________________________________________________________________
(i) Effects of Supplemental Flows on Lake Level and Water Quality
1220
1225
1230
1235
1240
1245
1250
Ele
vatio
n (ft
)
1000
1500
2000
2500
3000
3500
Surfa
ce A
rea
(acr
es)
0 2000 4000 6000 8000
Annual Supplemental Inflow (af/yr)
0
1
2
3
4
5
6
Mea
n D
epth
(m)
a) Surface Elevation
b) Surface Area
c) Mean Depth
Fig. 14. Influence of supplemental flows on predicted steady-state: a) lake surface elevation, b) surface area, and c) mean depth. A theoretical reference condition was chosen where the lake received mean annual rainfall and runoff, resulting in a very shallow eutrophic condition.
An analysis of the proposed lake management activities necessarily requires a
reference condition. The reference for this analysis was taken as the theoretical
condition that would exist if the lake consistently received the measured mean annual
rainfall and mean annual runoff from the San Jacinto River. Analysis of precipitation data
from the UCR weather station for the period 1986-2005 as reported by California
Irrigation Management Information System (CIMIS) yields a mean annual precipitation
rate of 0.25 m/yr. This rate is consistent with values reported for Lake Elsinore and
Canyon Lake in other sources. An annual evaporation rate for the region of 1.43 m/yr
was similarly derived from CIMIS (2005). Flow data reported by the USGS
(http://waterdata.usgs.gov/ca/nwis) for gage #11070500 (San Jacinto River near Lake
Elsinore, CA) for the period 1916-2003
yielded a geometric mean annual flow of
558 af/yr. This value was used for the
annual natural inflows there, with a
mean TP concentration of this inflow of
0.2 mg/L. (Initially, rainfall and runoff to
the lake were also modeled with
uncertainty, although the result was lake
levels that could readily vary from a dry-
lakebed to widespread flooding -
conditions present over the past 50
years at the lake. Against this backdrop
of widely variable hydrologic (and water
quality) conditions, it was not possible to
infer changes to Lake Elsinore from any
given management action.)
Under conditions of mean annual
rainfall and runoff, the model predicts a
theoretical steady-state lake surface
elevation of 1222.7 ft above MSL, a
surface area of 1190.3 acres, and a
mean depth of 0.96 m (Fig. 14). The
lake level was predicted to increase
21
Final Report: Lake Elsinore Model 12 March 2006 ______________________________________________________________________________________
nonlinearly with supplemental inflows, reaching 1240 ft with just over 6000 af/yr and
1247.8 ft with 8000 af/yr of additional water added to the lake (Fig. 14a). The lake
surface area increased approximately linearly with increasing supplemental inflow (Fig.
14b); mean depth also increased with inflows, from 0.96 m with no supplementation to
5.87 m with 8000 af/yr of supplemented water (Fig. 14c).
0
0.2
0.4
0.6
0.8
1
Tota
l P (m
g/L)
EVMWDEVMWD+TreatmentEMWDIsland Wells
a) Total P
b) Surface Area
0
400
800
1200
1600
Chl
orop
hyll
(µg/
L)
0 2000 4000 6000 8000Annual Supplemental Inflow (af/yr)
0
0.1
0.2
0.3
Sec
chi D
epth
(m) c) Secchi Depth
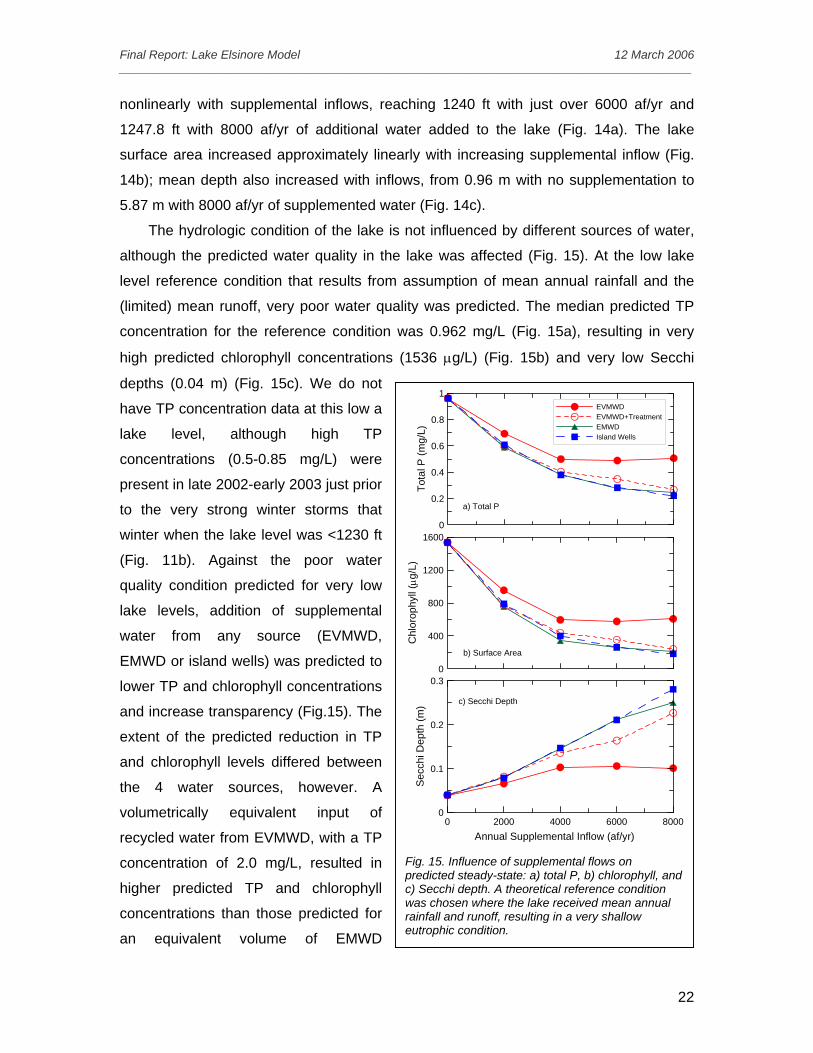
Fig. 15. Influence of supplemental flows on predicted steady-state: a) total P, b) chlorophyll, and c) Secchi depth. A theoretical reference condition was chosen where the lake received mean annual rainfall and runoff, resulting in a very shallow eutrophic condition.
The hydrologic condition of the lake is not influenced by different sources of water,
although the predicted water quality in the lake was affected (Fig. 15). At the low lake
level reference condition that results from assumption of mean annual rainfall and the
(limited) mean runoff, very poor water quality was predicted. The median predicted TP
concentration for the reference condition was 0.962 mg/L (Fig. 15a), resulting in very
high predicted chlorophyll concentrations (1536 µg/L) (Fig. 15b) and very low Secchi
depths (0.04 m) (Fig. 15c). We do not
have TP concentration data at this low a
lake level, although high TP
concentrations (0.5-0.85 mg/L) were
present in late 2002-early 2003 just prior
to the very strong winter storms that
winter when the lake level was <1230 ft
(Fig. 11b). Against the poor water
quality condition predicted for very low
lake levels, addition of supplemental
water from any source (EVMWD,
EMWD or island wells) was predicted to
lower TP and chlorophyll concentrations
and increase transparency (Fig.15). The
extent of the predicted reduction in TP
and chlorophyll levels differed between
the 4 water sources, however. A
volumetrically equivalent input of
recycled water from EVMWD, with a TP
concentration of 2.0 mg/L, resulted in
higher predicted TP and chlorophyll
concentrations than those predicted for
an equivalent volume of EMWD
22

Final Report: Lake Elsinore Model 12 March 2006 ______________________________________________________________________________________
recycled water (at 0.22 mg/L), island well water (at 0.12 mg/L), or EVMWD water
assuming chemical P removal to 0.5 mg/L (Fig. 15a). The relative benefit of
supplementation decreased within increased inflow, however (i.e., the
slope of the plots decreased with increased inflow). This was especially apparent for
supplementation with EVMWD water beyond 4000 af/yr, where, although increasing lake
level and mean depth (Fig. 14), further
inputs did not result in further reductions
in TP and chlorophyll. In fact, these water
quality parameters were predicted to
increase slightly above 6000 af/yr inputs
of regular EVMWD recycled water (Fig.
15). Supplementation with groundwater
from the island wells would be preferable,
since it has the lowest TP concentration,
although use of water from EMWD or
EVMWD water with chemical P removal
would all yield predicted median
chlorophyll concentrations below about
200 µg/L at annual inputs of 8000 af.
The predicted loading to the lake
under the different source and
supplementation scenarios can be
apportioned to external sources, internal
recycling, wind resuspension and
bioturbation from carp (Fig. 16). For the
reference case (supplementation of 0
af/yr), an areally averaged median loading
rate near 100 mg/m2/d was predicted, with
<1% due to external sources, 85% due to
internal recycling, 11.4% due to wind
resuspension, and 2.9% due to
resuspension from benthic foraging by
carp (Fig. 16). Addition of supplemental
water lowered the areally-averaged
0
20
40
60
80
100
External LoadingInternal LoadingWind ResuspensionBioturbation
c) EMWD
0 2000 4000 6000 8000Annual Supplemental Inflow (af/yr)
0
20
40
60
80
100
d) Island Wells
0
20
40
60
80
100
a) EVMWD
0
20
40
60
80
100
Phos
phor
us L
oadi
ng (m
g/m
2 /d)
b) EMWD+Treatment
Fig. 16. Influence of supplemental flows on predicted steady-state loading from: a) EVMWD,,b) EVMWD+treatment, c) EMWD, & d) island wells. A theoretical reference condition was chosen where the lake received mean annual rainfall and runoff, resulting in a very shallow eutrophic condition.
23
Final Report: Lake Elsinore Model 12 March 2006 ______________________________________________________________________________________
loading rates through reductions in wind resuspension and internal recycling. Wind
resuspension became relatively unimportant at higher annual flows, accounting for <3%
of the total loading (Fig. 16a) when lake levels exceeded about 1239 ft (Fig. 14a).
Internal loading rates were reduced through the feedback between water column
concentration and JiL (eq 10), since nutrient release into a greater volume of water
lowers the relative concentration, further lowering the predicted internal recycling rate.
External loading rates remained low even at the highest supplementation at the highest
TP concentrations, although it is again necessary to keep in mind the feedback between
water column concentration and internal recycling; thus input of higher TP EVMWD
recycled water results in higher internal recycling rates than an equivalent volume of
EMWD or island well water.
(ii) Effects of Aeration and Carp Removal on Water Quality
The effects of aeration and carp removal on TP levels, chlorophyll concentrations
and the steady-state loading budgets were compared against a different baseline
condition than that for the analysis of source water impacts on water quality. Here, the
reference was a lake level maintained at 1240 ft by annual addition of 4000 af of
EVMWD recycled water and 2,171 af of island well water at TP concentrations o f 2.0
and 0.12 mg/L to offset evaporative losses. Under this baseline condition, the model
predicted a median TP concentration of 0.377 mg/L, a chlorophyll concentration of 395
µg/L and 0.15 m transparency (Table 8). Under this scenario, external loading
(normalized to lake surface area) contributed 2.8 mg/m2/d (or 7.4% of the predicted total
loading of 37.7 mg/m2/d), while carp bioturbation contributed 2.6 mg/m2/d (6.9% of total),
and wind resuspension contributed 0.7 mg/m2/d (1.9%) (Table 8). As was the case for
the nutrient budget developed for 2000-2001, internal loading dominated the total input
of TP to the water column (31.6 mg/m2/d or 83.8%) (Table 8).
Aeration very favorably reduced the predicted steady-state TP and chlorophyll levels
in the lake; for example, assuming aeration reduces the TP internal recycling rate by
30%, as found in sediment core-flux measurements (Anderson, 2004), steady-state
water column TP concentrations were predicted to decline from 0.377 mg/L for the
baseline case to 0.148 mg/L (Table 8). Similarly, chlorophyll levels declined from 395 to
103 µg/L and Secchi depths increased from 0.15 m to 0.28 m (Table 8). Although
external loading remained the same (2.8 mg/m2/d) in all scenarios (since flows and
concentrations were fixed in these simulations), the steady-state internal recycling rate
24

Final Report: Lake Elsinore Model 12 March 2006 ______________________________________________________________________________________
was lowered from 31.6 mg/m2/d in the baseline case to 8.7 mg/m2/d assuming 30%
reduction due to aeration (Table 8). As a result of the lowered internal loading rate, the
total loading was reduced to a predicted median value of 14.7 mg/m2/d, with external
loading, wind resuspension and bioturbation contributing larger relative amounts (4.8 –
19%).
Table 8. Predicted median water quality and phosphorus loading under different lake management techniques. Scenario Water Quality Variables Phosphorus Loading (mg/m2/d)
TP (mg/L)
Chl (ug/L)
Zsd (m) External Internal Wind Carp Total
Baselinea 0.377 395 0.15 2.8 (7.4%)
31.6 (83.8%)
0.7 (1.9%)
2.6 (6.9%) 37.7
Aeration
15% 0.224 186 0.28 2.8 (12.6%)
15.9 (71.6%)
0.7 (3.2%)
2.8 (12.6%) 22.2
30% 0.148 102 0.42 2.8 (19.0%)
8.7 (59.2%)
0.7 (4.8%)
2.5 (17.0%) 14.7
50% 0.108 65 0.56 2.8 (25.9%)
4.5 (41.7%)
0.7 (6.5%)
2.8 (25.9%) 10.8
Carp Removal
50% 0.331 327 0.18 2.8 (8.5%)
27.9 (85.1%)
0.7 (2.1%)
1.4 (4.3%) 32.8
75% 0.260 231 0.23 2.8 (10.9%)
21.6 (83.7%)
0.7 (2.7%)
0.7 (2.7%) 25.8
Aeration+Carp
30%+50% 0.121 76 0.51 2.8 (23.5%)
7.0 (58.8%)
0.7 (5.9%)
1.4 (11.8%) 11.9
50%+75% 0.070 25 0.74 2.8 (39.4%)
2.9 (40.8%)
0.7 (9.9%)
0.7 (9.9%) 7.1
aBaseline condition taken as: EVMWD recycled water and island well pumping to maintain 1240 ft surface elevation (4000 and 2171 af, respectively) assuming mean annual values for rainfall (0.25 m/yr) and San Jacinto River flow (558 af/yr). Total P concentrations were as used elsewhere (2.0, 0.12 and 0.22 mg/L for recycled water, island wells groundwater and local runoff, respectively).
Reducing the internal recycling rate by 30% is equivalent to the assumption that a
larger fraction of particulate P reaching the sediments is buried and permanently lost
from the system. This greater burial efficiency results in less P being recycled to the
water column; with less TP in the water column, the sedimentation flux is reduced (eq 9),
and so even less is subsequently recycled (and so on). Thus, this feedback loop exists
wherein even quite modest reductions in the internal recycling rate (e.g., 15%) result in
50% net reduction in the steady-state internal loading of P (Table 8). Not unexpectedly
then, a 50% reduction in the internal recycling rate had the greatest benefit to predicted
water quality, yielding a predicted steady-state TP concentration of 0.108 mg/L, 65 µg/L
chlorophyll and Secchi depths exceeding 0.5 m (Table 8).
25

Final Report: Lake Elsinore Model 12 March 2006 ______________________________________________________________________________________
The removal of carp had less dramatic effects on predicted water quality; for
example, a 50% reduction in the carp biomass in the lake only lowered the predicted
median TP concentration from 0.377 mg/L to 0.331 mg/L (Table 8). A 75% reduction in
carp biomass had a greater beneficial effect, lowering predicted TP levels to 0.260 mg/L.
The lower relative benefit from carp removal compared with aeration is consistent with
the results of the model sensitivity analysis that found the model to be 3x more sensitive
to the internal loading parameters relative to those describing bioturbation (Table 5).
To achieve the greatest improvements in water quality, it is necessary to apply
multiple management actions. Maintaining the lake near 1240 ft surface elevation (or
above) will help minimize wind-driven sediment resuspension, while aeration and carp
removal help to lower these sources of nutrients to the water column. A 50% reduction in
internal loading rate coupled with a 75% reduction in carp biomass achieved a predicted
steady-state TP concentration 0.070 mg/L, with a corresponding chlorophyll level of 25
µg/L and transparencies exceeding 0.7 m (Table 8). Based on this analysis, it appears
that efforts to improve water quality should principally be directed at reducing external
loading to the lake combined with measures to lower internal recycling.
Non-Steady State Analysis of Lake Restoration Techniques
The above analyses evaluated the steady-state conditions that would result from
implementation of various management actions at the lake. The steady-state analysis
offered the clearest way to assess the relative water quality impacts resulting from
different supplemental inflows to the lake, aeration and carp removal. Of course, Lake
Elsinore is often far from any steady-state condition. For this analysis, then, the time-
varying model for the lake (eqs 11, 12) was used to simulate a 1993-2004 period subject
to the following conditions: (i) recorded rainfall, runoff and evaporation will be used as
model inputs as done previously (Fig. 8a-c); (ii) the actual supplemental flows added to
the lake that commenced in 2002 will be excluded (Fig. 8d); (iii) supplemental water will
be added to the lake whenever the lake level drops below 1247 ft; (iv) when
supplemental water is needed, recycled water from EVMWD will be supplied at daily
rates of 10.96 af/day (up to 4000 af/yr), while island well water will be pumped and
delivered to the lake when the level drops below 1240 ft (at a rate of 7.5 af/day). Thus,
up to 18.46 af/day could be added when the lake levels drops below 1240 ft. Due to the
uncertainty in the availability of EMWD recycled water, it was excluded in this analysis.
The TP concentrations in these sources were set at those used previously (2.0 and 0.12
26

Final Report: Lake Elsinore Model 12 March 2006 ______________________________________________________________________________________
mg/L, respectively). Additional simulations were also conducted assuming chemical P
removal at the EVMWD plant yielded effluent concentrations of 0.5 mg/L, and assuming
aeration (15, 30 and 50% reductions in internal recycling rates) and carp removal (50, 75
and 90% removal) were implemented.
1230
1240
1250
1260
Elev
atio
n (ft
)
1993 1995 1997 1999 2001 2003 2005Year
0
0.2
0.4
0.6
0.8
1
TP C
once
ntra
tion
(mg/
L) No Flow SupplementationEVMWDEVMWD+WellsEVMWD (O.5 mg/L)+Wells
1240 ft
1247 ft
0.1 mg/L
a)
b)
Fig. 17. Influence of flow supplementation on: a) lake elevation and b) TP concentration.
The predicted elevation of Lake
Elsinore using only natural precipitation,
local runoff and measured San Jacinto
River flows varied over the 1993-2004
period in a similar manner to that
observed (and predicted) (Fig. 11), even
without the supplemental flows initiated
in 2002 (Fig. 17a, black line).That is, the
modest inputs from recycled water and
the island wells did not substantially
alter the predicted lake level. If however,
recycled water was supplied whenever
the lake dropped below 1247 ft (e.g., in
the summer of 1997 and beginning
again in the summer of 1999), the lake
level was predicted to be noticeably
elevated (Fig. 17a, black line) relative to the no-supplementation case (Fig. 17a, red
line). Further flow augmentation with the island wells when the lake level declined below
1240 ft (Fig. 17a, green line) resulted in only a very slight deviation from that predicted
with only EVMWD recycled water was added. This occurred because of the limited time
that the lake was below 1240 ft with EVMWD supplementation (Fig. 17a; Table 9).
Table 9. Influence of supplemental flows on the frequency of days from 1993-2004 that the lake level declined below 1240 ft and when TP levels exceeded 0.1 mg/L. Supplementation Scenario # Days<1240 ft # Days TP >0.1 mg/L
No Flow Supplementation 1303 (29.7%)a 2516 (57.4%)
EVMWD 465 (10.6%) 4060 (92.7%)
EVMWD+Wells 415 (9.5%) 4060 (92.7%)
EVMWD (0.5 mg/L)+Wells 415 (9.5%) 3324 (75.9%) aTotal number of days in simulation period = 4381
27

Final Report: Lake Elsinore Model 12 March 2006 ______________________________________________________________________________________
That is, addition of EVMWD recycled water lowered the number of days during this
simulation period that the lake dropped below 1240 ft from 1303 days (29.7% of the
time) to 465 days (10.6% of the time). Further supplementation with groundwater from
the island wells lowered the number of days to 415 (9.5% of the time) (Table 9).
As previously noted, the TP concentration in the lake varied strongly over this
period. With natural inputs from precipitation, local runoff and San Jacinto River flows,
the TP concentration was predicted to decline strongly from the very high levels present
in early 1993 to <0.1 mg/L in 1999, and remain low for the next 4 yrs (Fig. 17b) due in
part to the very limited runoff during this period (Fig. 8c). Concentrations were then
predicted (and observed) to increase due increased external loading in the winter of
2003 that resulted in subsequent greater internal loading, with TP levels predicted to
reach 0.6 mg/L at the minimum lake level that year before declining due in part to
reduced wind resuspension and dilution with the early winter rains at the end of 2004.
Under this baseline condition of no flow supplementation, 2516 days out of 4381 (57.4%)
the predicted TP concentration was greater than 0.1 mg/L.
As indicated above, supplementation with EVMWD recycled water lowered the
number of days when the lake was below 1240 ft (from 29.7 to 10.6% of the time), (Fig.
17a; Table 9), but increased rather markedly the predicted TP concentrations (Fig. 17b;
Table 9). For example, the TP concentration near the end of the simulation period was
predicted to increase from about 0.6 mg/L to almost 1 mg/L (Fig. 17b). Moreover, the
period of comparatively good predicted (and observed) water quality from 1999-2002
under the baseline condition (no EVMWD inputs) with TP levels <0.1 mg/L would be
replaced with TP concentrations exceeding 2x that level (>0.2 mg/L) (Fig. 17b, red line).
The number of days in which the TP concentration exceeded 0.1 mg/L increased from
2516 days (57.4% of the time) to 4060 days (92.7% of the time) (Table 9). Further
supplementation with island well water when the lake level dropped below 1240 ft had
little effect on predicted TP concentrations; a small dilution lowered the predicted TP in
the lake slightly, but was not predicted to change the number of days when the lake
exceeded 0.1 mg/L, since island well supplementation occurred when the lake TP levels
were already substantially elevated due to recycled water inputs (Fig. 17b; Table 9).
Supplementation with reduced TP (0.5 mg/L) EVMWD water + island well water lowered
quite substantially the predicted TP concentration in the lake (Fig. 17b, dashed orange
line) relative to the level predicted for EVMWD + island well water (Fig. 17b, red line).
The predicted TP concentration actually followed fairly closely the TP concentration
28
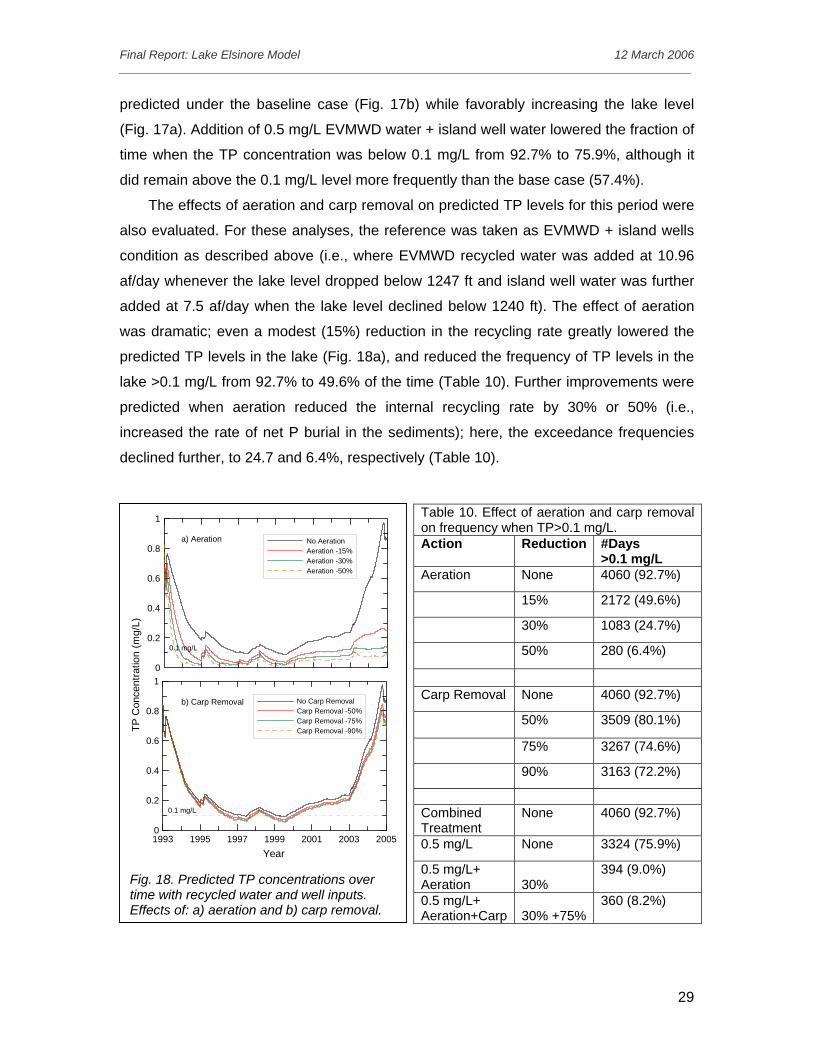
Final Report: Lake Elsinore Model 12 March 2006 ______________________________________________________________________________________
predicted under the baseline case (Fig. 17b) while favorably increasing the lake level
(Fig. 17a). Addition of 0.5 mg/L EVMWD water + island well water lowered the fraction of
time when the TP concentration was below 0.1 mg/L from 92.7% to 75.9%, although it
did remain above the 0.1 mg/L level more frequently than the base case (57.4%).
The effects of aeration and carp removal on predicted TP levels for this period were
also evaluated. For these analyses, the reference was taken as EVMWD + island wells
condition as described above (i.e., where EVMWD recycled water was added at 10.96
af/day whenever the lake level dropped below 1247 ft and island well water was further
added at 7.5 af/day when the lake level declined below 1240 ft). The effect of aeration
was dramatic; even a modest (15%) reduction in the recycling rate greatly lowered the
predicted TP levels in the lake (Fig. 18a), and reduced the frequency of TP levels in the
lake >0.1 mg/L from 92.7% to 49.6% of the time (Table 10). Further improvements were
predicted when aeration reduced the internal recycling rate by 30% or 50% (i.e.,
increased the rate of net P burial in the sediments); here, the exceedance frequencies
declined further, to 24.7 and 6.4%, respectively (Table 10).
Table 10. Effect of aeration and carp removal on frequency when TP>0.1 mg/L. Action Reduction #Days
>0.1 mg/L Aeration None 4060 (92.7%)
15% 2172 (49.6%)
30% 1083 (24.7%)
50% 280 (6.4%)
Carp Removal None 4060 (92.7%)
50% 3509 (80.1%)
75% 3267 (74.6%)
90% 3163 (72.2%)
Combined Treatment
None 4060 (92.7%)
0.5 mg/L None 3324 (75.9%)
0.5 mg/L+ Aeration
30%
394 (9.0%)
0.5 mg/L+ Aeration+Carp
30% +75%
360 (8.2%)
005
.
0
0.2
0.4
0.6
0.8
1
TP C
once
ntra
tion
(mg/
L)
No AerationAeration -15%Aeration -30%Aeration -50%
0.1 mg/L
1993 1995 1997 1999 2001 2003 2Year
0
0.2
0.4
0.6
0.8
1
No Carp RemovalCarp Removal -50%Carp Removal -75%Carp Removal -90%
0.1 mg/L
a) Aeration
b) Carp Removal
Fig. 18. Predicted TP concentrations over time with recycled water and well inputs. Effects of: a) aeration and b) carp removal
29

Final Report: Lake Elsinore Model 12 March 2006 ______________________________________________________________________________________
Carp removal was much less effective at reducing predicted TP levels than aeration,
however (Fig. 18b). Carp removal lowered predicted TP levels only modestly, but did
reduce the percentage of time predicted TP concentrations exceeded 0.1 mg/L (Table
10). Chemical P removal at the EVMWD plant to 0.5 mg/L favorably lowered predicted
TP levels in the lake relative to the effluent without P removal (Fig. 17b).
Aeration that achieves 30% reduction in the internal recycling rate further improved
predicted water quality, lowering the frequency that the lake exceeded 0.1 mg/L from
75.9 to 9.0% of the time (Table 10). With 75% carp removal, the exceedance frequency
declined to 8.2% of the time (Table 10).
Key Findings and Conclusions
A model that incorporated external loading, internal recycling, wind resuspension
and carp bioturbation was able to reproduce observed lake water quality over the period
from 1993-2004. The differential and steady-state forms of the model were then used to
assess the water quality impacts from recycled water and groundwater inputs, aeration
and carp removal. A number of conclusions can be drawn from these analyses. First of
all, the process of internal recycling dominates the annual loading of phosphorus to the
water column of Lake Elsinore, even during years with very strong inputs from the San
Jacinto River. Model results indicate that external loading contributed on average only
5.7% of the total annual P loading for the period from 1993-2004, while wind
resuspension and bioturbation from carp typically accounted for 0.6% and 3%,
respectively (Table 4). Even during the extreme runoff conditions of 1993, external
loading was predicted to account for only 16.9% of the total annual P loading to Lake
Elsinore. These statistics belie the impact of external loading on P concentrations and
lake water quality, however, since externally loaded P is recycled a number of times and
potentially over several years before it is finally buried. The lake does have some
capacity to sequester P in the sediments, with about 15% of the P settling to the
sediments thought to remain there. This capacity to remove P from the water column
can be seen from the monitoring data collected from 1993 – 1997, where the TP
concentration in the lake declined from almost 1 mg/L to about 0.2 mg/L (Fig. 11b); total
annual internal loading was predicted to decline more than 80%, from over 484 metric
tons to 89 metric tons of P for this period (Table 4).
30
Final Report: Lake Elsinore Model 12 March 2006 ______________________________________________________________________________________
A steady-state form of the model was used to assess the impacts of recycled water
and groundwater inputs to the lake using a theoretical reference condition based upon
the lake receiving mean annual rainfall and runoff. Under such a condition, the lake level
was predicted to drop to 1222.7 ft above MSL, have a mean depth <1 m (Fig. 14), and
TP concentrations near 1 mg/L (Fig. 15a). Against this shallow, hypereutrophic lake
condition, addition of supplemental water increased surface elevation, mean depth and
decreased predicted TP concentrations. About 6000 af/yr was predicted to increase the
lake level to 1240 ft (Fig. 14a). The source of the supplemental water affected the
predicted TP levels; inputs from EVMWD, EMWD or the island wells yielded median
predicted TP concentrations of 0.49, 0.28 and 0.28 mg/L, respectively (Fig. 15a).
Chemical phosphorus removal at the EVMWD plant to 0.5 mg/L lowered the median
predicted TP concentration in Lake Elsinore to 0.35 mg/L. As noted above, even under
conditions of high annual inflows with high TP concentrations, internal loading dominated
the predicted P budget for the lake due in large measure to the recycling of externally
loaded phosphorus.
Other restoration efforts also affected the predicted steady-state water quality in the
lake. Aeration was found to very favorably reduce median predicted TP and chlorophyll
concentrations; for example, aeration sufficient to reduce the internal recycling rate by
30% was predicted to lower TP from 0.377 mg/L to 0.148 mg/L and reduce chlorophyll
levels from 395 µg/L to 102 µg/L (Table 8). Carp removal was less effective than
aeration at improving water quality (e.g., a 75% reduction in carp biomass lowered the
median predicted TP concentration to 0.26 mg/L). It appears that reducing external
phosphorus loadings to the maximum extent practical, coupled with concerted efforts to
reduce internal phosphorus loading rates through in-lake treatments is the best
approach to consistently achieve water quality objectives.
References
Anderson, M.A. 2001. Internal Loading and Nutrient Cycling in Lake Elsinore. Final Report.
Santa Ana Regional Water Quality Control Board. 52 pp.
Anderson, M.A. 2002. Evaluation of Calcium Treatment for Control of Phosphorus in
Lake Elsinore. Final Report to LESJWA. 15 pp.
31

Final Report: Lake Elsinore Model 12 March 2006 ______________________________________________________________________________________
Anderson, M.A.. 2002. Water Quality in Lake Elsinore: Model Developments and
Results. Draft Report to CH2M-Hill. 10 pp.
Breukelaar, A.W., E.H. R. Lammens, J.G.P. Breteler and I. Tatrai. 1994. Effects of
benthivorous bream (Abramis brama) and carp (Cyprinus carpio) on sediment
resuspension and concentrations of nutrients and chlorophyll a. Freshwat. Biol. 32:113-
121.
APHA 1998. Standard Methods for the Examination of Water and Wastewater. 20th
Edition. American Public Health Association, Washington, D.C.
Bloesch, J. 1995. Mechanisms, measurement and importance of sediment resuspension
in lakes. Mar. Freshwater Res. 46:295-304.
Carper, G.L., and R.W. Bachmann. 1984. Wind resuspension of sediments in a prairie
lake. Can. J. Fish. Aquat. Sci. 41:1763-1767.
EIP. 2004. Fisheries Management Plan for Lake Elsinore. Draft Final Report to
LESJWA.
Martin, J.L., and S.C. McCutcheon. 1999. Hydrodynamics and Transport for Water
Quality Modeling. Lewis Publ., Boca Raton, FL. 794 pp.
Meijer, M.-L., I.deBoois, M. Scheffer, R. Portielje and H. Hosper. 1989. Biomanipulation
in shallow lakes in The Netherlands: an evaluation of 18 case studies. Hydrobiol.
408/409:13-30.
Montgomery-Watson. 1997. Lake Elsinore NPDES Permit Feasibility Study. Final Phase
I Technical Report.
Rydin, E. and Welch, E.B. (1999) Dosing alum to Wisconsin lake sediments based on in
vitro formation of aluminum bound phosphate. Lake and Reservoir Management. 15:
324-331.
32

Final Report: Lake Elsinore Model 12 March 2006 ______________________________________________________________________________________
Scheffer, M. 1998. Ecology of Shallow Lakes. In Populations and Community Biology
Ser. 22. Chapman and Hall, London. 357 pp.
Tetra-Tech, Inc. 2003. Lake Elsinore and Canyon Lake Nutrient Source Assessment.
Final Report. Prepared for LESJWA.
Veiga-Nascimento, R.A. and M.A. Anderson. 2004. Lake Elsinore Recycled Water
Monitoring Project. Final Report submitted to LESJWA. 59 pp.+Appendices.
33