predicting consumer behavior using clickstream analysisalm3/presentations/webshop 2003.pdf · 2...
TRANSCRIPT

1
Predicting Consumer Behavior using Clickstream Analysis
Alan MontgomeryAssociate Professor
Carnegie Mellon UniversityGraduate School of Industrial Administration
e-mail: [email protected]: http://www.andrew.cmu.edu/user/alm3
WebShopWebShop 2003, 2003, UnivUniv of Marylandof Maryland13 June 200313 June 2003
© 2003 by Alan Montgomery, All rights reserved.
2
Outline
• What is clickstream data?• User Profiling
– What does ‘what you view’ say about ‘who you are?’
• Path Analysis– What does ‘what you view’ say about ‘what you want’?
• Analyzing Textual Information in Clickstream Data• Conclusions

2
Defining Clickstream Data
The raw input for web mining
4
What is clickstream data?
• A record of an individual’s movement through time at a web site
• Contains information about:– Time– URL content– User’s machine– Previous URL viewed– Browser type

3
5
Sources of clickstream data
• Web Servers– Each hit is recorded in the web server log
• Media Service Providers– DoubleClick, Flycast
• ISP/Hosting Services– AOL, Juno, Bluelight.com
• Marketing Research Companies– ComScore Media Metrix and NetRatings
User Profiling
What does ‘where you go’ sayabout ‘who you are’?

4
New Yorker, 5 July 1993, p. 61
8
Is this user male or female?
95% probability that user is female
User visits the following five sites in the Doubleclick
network

5
9
Test the hypothesis that a user is female by updating the current guess using new information
Bayesian updating formula
)1)(1( ppppppp
−−+⋅⋅
=
Oldprobability
Newprobability
Newinformation
Female Male
10
Probability user is female
Probability a Female Visits
the site
Probability visitor is
Female given visits to
Overall Internet 45% 45.0%cbs.com 54% 49.0%ivillage.com 66% 65.1%libertynet.org 63% 76.0%nick.com 57% 80.8%onlinepsych.com 83% 95.4%
Best Guess

6
11
What can we learn?
12
A Full Month of Browsing
aol.comastronet.comavon.comblue-planet.comcartoonnetwork.comcbs.comcountry-lane.comeplay.comhalcyon.comhomearts.comivillage.com
libertynet.orglycos.comnetradio.netnick.comonhealth.comonlinepsych.comsimplenet.comthriveonline.comvalupage.comvirtualgarden.comwomenswire.com
48%64%75%52%56%54%76%47%41%70%66%
63%39%27%57%59%83%44%76%59%71%66%
% of female visitors during one month (Media Metrix):
Example
99.97% probability that user is female
7
13
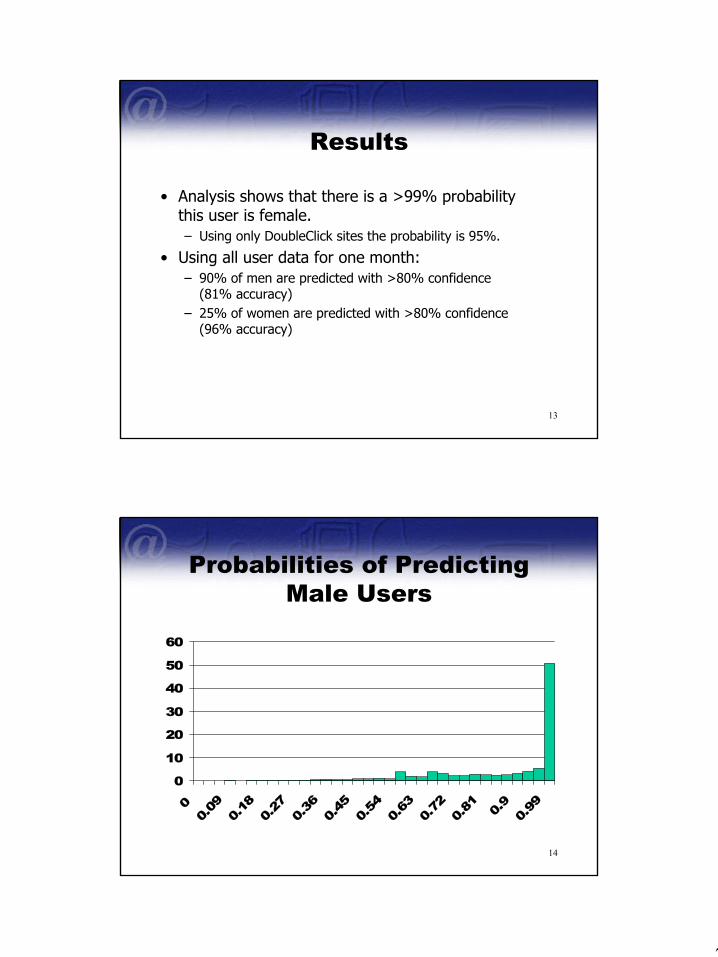
Results
• Analysis shows that there is a >99% probability this user is female.– Using only DoubleClick sites the probability is 95%.
• Using all user data for one month:– 90% of men are predicted with >80% confidence
(81% accuracy)– 25% of women are predicted with >80% confidence
(96% accuracy)
14
Probabilities of Predicting Male Users
0
10
20
30
40
50
60
00.09
0.18
0.27
0.36
0.45
0.54
0.63
0.72
0.81 0.
90.99

8
15
Key Points of User Profiling
We can identify ‘who you are’ from ‘where you go’
• What the user views on the web reveals their interests and preferences– We can personalize the web experience without explicitly requiring
customers to login and identify themselves
• Browsing and product choices can reveal key information about interest and price sensitivity
• Requires marketers to be smarter in designing their websites and analyzing their information. Big profitability gains if this is done correctly.
Http://www.moreinfo.com/au.cranlerma/fol2.htm

9
Path Analysis
What does a user’s web navigation path say about purchase conversion or a user’s goals?
Clickstream Example #1

10
19
Information rules
20

11
21
22

12
23
Predicting Purchase Conversion
What is the chance of this user making a
purchase during this session?
1st viewing = 7%
2nd viewing = 14%
3rd viewing = 20%
4th viewing = 60%
Home
Category
Product
Shopping Cart
Clickstream Example #2

13
25
User 1 DemographicsSex: MaleAge: 55Occupation: Service WorkerState: Washington
{Category}
{Category}
{Home}
{Shop Cart}
{Category}
{Account}
Will this user buy?
Purchase...
Clickstream Example #3

14
27
No Purchase
User 2 DemographicsSex: FemaleAge: 17Occupation: StudentState: Virginia
{Home}{Information}
{Home}{Information}
{Category}
{Category}...
Will this user buy?
Identifying Browsing Patterns

15
29
Categorizing Pages
Home pageUser account pagesPage with list of productsProduct information pagesShipping, order status, etcPre-order pagesConfirmation/purchase pageNon B&N pages
HomeAccountCategoryProductInformationShoppingCartOrderEnter/Exit
HACPISOE
DescriptionCategoryAbbr
30
Some Sample User Sessions
HIAAAAIAIIIICIIICICICCICICCIPPIPPIPPPIPIICCSIIIPPPPPIPIPSISISISSSOIIIIIHEHCCPPPCCPCCCCCCCCCPSCSCSPCCPCPCCCCCCCSAAAAAAAAAASSOIIIIISASCCCEIIICICPCPPPCPCICICPCCCPCPPPIPSIIAASSSIIIIOIIEIISIASSSIOIEIPPPPSASSSSSOIAAAHCCPCCCCCCE
678910
ICCCCCCCCCPCCPCCCCCCCCCCCCCCCCCCCCCCCCCCCCCEIHHEIEIHICPPPCEIHHIIICIIE
12345
PathUser
Brow
sers
Buye
rs

16
31
Probability of Viewing a Page
1/93/1.8/11/1.8/17/1Inf
9%4%
35%17%33%2%0%
1%13%27%17%24%15%3%
HomeAccountCategoryProductInformationShopping CartPurchase
Odd RatioBrowserPurchaserCategory
32
Transition Matrix Category of Previous Viewing
Category Home Account Category Product Inform. ShopCart Order Exit Home .23 .01 .01 .01 .10 .02 0 .16 Account .01 .69 .01 .01 .02 .15 0 .01 Category .17 .02 .60 .31 .15 .05 0 .16 Product .01 0 .20 .43 .10 .05 0 .05 Information .25 .06 .08 .12 .46 .15 .87 .61 Shop. Cart .01 .16 .01 .03 .02 .45 .13 .01 Order 0 0 0 0 0 .10 0 0 Ca
tego
ry o
f Cur
rent
V
iew
ing
Exit .32 .06 .09 .09 .14 .02 0 0 Marginal .06 .05 .32 .17 .23 .05 .01 .11 Initial Prob. .16 .02 .16 .06 .60 .01 0 0
Table 6. Sample transition matrix for categories of viewings. (Notice that the columns sum to one, and there are a total of 14,512 observations.)

17
Methodology
34
Choice Model of Browsing
CategoryLatentUtilities
Choices
Memory/Trends:Autoregressive
Switching:Hidden Markov
Process
Page and UserCharacteristics

18
35
User 1 DemographicsSex: MaleAge: 55Occupation: Service WorkerState: Washington
14.3%
12.3%
13.8%
35.3%
13.2%
52.4%
Will this user buy?
Purchase...
36
No Purchase
User 2 DemographicsSex: FemaleAge: 17Occupation: StudentState: Virginia
0.24%0.26%0.06%
0.05%
0.04%
0.03%...
Will this user buy?

19
37
Predicting Purchase Conversion
0.00%5.00%
10.00%15.00%20.00%25.00%30.00%35.00%40.00%45.00%
1 2 3 4 5 6
Viewing
Pur
chas
e Pro
babi
l
PurchaseNo Purchase
38
Key Points of Path Analysis
We can infer ‘what you want’ from ‘what you view’
• The path a user takes reveals goals and interests– We look at pages we are interested in– Avoid those pages that are irrelevant
• Path Analysis indicates we can intervene before a non-purchaser leaves the site
• Presenting promotional information to purchasers is distracting, but increases conversion for surfers
• Show the right information at the right time
20
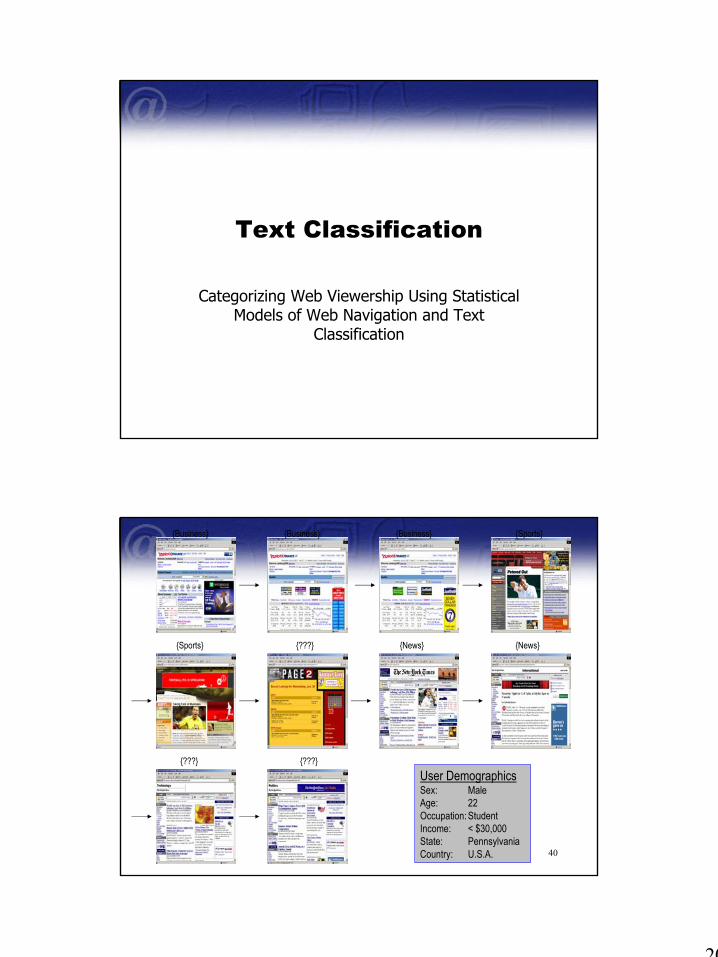
Text Classification
Categorizing Web Viewership Using Statistical Models of Web Navigation and Text
Classification
40
User DemographicsSex: MaleAge: 22Occupation: StudentIncome: < $30,000State: PennsylvaniaCountry: U.S.A.
{Business} {Business} {Business} {Sports}
{Sports} {???} {News} {News}
{???} {???}

21
41
Information Available
Clickstream Data
• Panel of representative web users collected by Jupiter Media Metrix
• Sample of 30 randomly selected users who browsed during April 2002– 38k URLs viewings– 13k unique URLs visited– 1,550 domains
• Average user– Views 1300 URLs– Active for 9 hours/month
Classification Information
• Dmoz.org - Pages classified by human experts
• Page Content - Text classification algorithms from Comp. Sci./Inform. Retr.
42
Dmoz.org
• Largest, most comprehensive human-edited directory of the web
• Constructed and maintained by volunteers (open-source), and original set donated by Netscape
• Used by Netscape, AOL, Google, Lycos, Hotbot, DirectHit, etc.
• Over 3m+ sites classified, 438k categories, 43k editors (Dec 2001)
Categories1. Arts2. Business3. Computers4. Games5. Health6. Home7. News8. Recreation9. Reference10. Science11. Shopping12. Society13. Sports14. Adult

22
43
Problem
• Web is very large and dynamic and only a fraction of pages can be classified– 147m hosts (Jan 2002, Internet Domain Survey, isc.org)– 1b (?) web pages+
• Only a fraction of the web pages in our panel are categorized– 1.3% of web pages are exactly categorized– 7.3% categorized within one level– 10% categorized within two levels– 74% of pages have no classification information
Text Classification

23
45
Background
• Informational Retrieval– Overview (Baeza-Yates and Ribeiro-Neto 2000, Chakrabarti
2000)– Naïve Bayes (Joachims 1997)– Support Vector Machines (Vapnik 1995 and Joachims 1998)– Feature Selection (Mladenic and Grobelnik 1998, Yang
Pederson 1998)– Latent Semantic Indexing– Support Vector Machines– Language Models (MacKey and Peto 1994)
46
True Class: Sports

24
47
Page Contents = HTML Code + Regular Text
48
Tokenization & Lexical Parsing
• HTML code is removed• Punctuation is removed• All words are converted to lowercase• Stopwords are removed
– Common, non-informative words such as ‘the’, ‘and’, ‘with’, ‘an’, etc…
Determine the term frequency (TF) of each remaining unique word

25
49
Result: Document Vector
home 2game 8hit 4runs 6threw 2ejected 1baseball 5major 2league 2bat 2
50
Classifying Document Vectors
home 2game 8hit 4runs 6threw 2ejected 1baseball 5major 2league 2bat 2
bush 58congress 92tax 48cynic 16politician 23forest 9major 3world 29summit 31federal 64
sale 87customer 28cart 24game 16microsoft 31buy 93order 75pants 21nike 8tax 19
game 97football 32hit 45goal 84umpire 23won 12league 58baseball 39soccer 21runs 26
{News Class} {Sports Class} {Shopping Class}
? ? ?
Test Document

26
51
Classifying Document Vectors
home 2game 8hit 4runs 6threw 2ejected 1baseball 5major 2league 2bat 2
bush 58congress 92tax 48cynic 16politician 23forest 9major 3world 29summit 31federal 64
sale 87customer 28cart 24game 16microsoft 31buy 93order 75pants 21nike 8tax 19
game 97football 32hit 45goal 84umpire 23won 12league 58baseball 39soccer 21runs 26
{News Class} {Sports Class} {Shopping Class}
Test Document
52
home 2game 8hit 4runs 6threw 2ejected 1baseball 5major 2league 2bat 2
bush 58congress 92tax 48cynic 16politician 23forest 9major 3world 29summit 31federal 64
sale 87customer 28cart 24game 16microsoft 31buy 93order 75pants 21nike 8tax 19
game 97football 32hit 45goal 84umpire 23won 12league 58baseball 39soccer 21runs 26
{News Class} {Sports Class}
Test Document
{Shopping Class}
P( {News} | Test Doc) = 0.02 P( {Sports} | Test Doc) = 0.91 P( {Shopping} | Test Doc) = 0.07
Classifying Document Vectors

27
53
home 2game 8hit 4runs 6threw 2ejected 1baseball 5major 2league 2bat 2
game 97football 32hit 45goal 84umpire 23won 12league 58baseball 39soccer 21runs 26
{Sports Class}
Test Document
P( {Sports} | Test Doc) = 0.91
Classifying Document Vectors
54
Classification Model
• A document is a vector of term frequency (TF) values, each category has its own term distribution
• Words in a document are generated by a multinomial model of the term distribution in a given class:
• Classification: )}d|c(P{maxargCc∈
|V| : vocabulary size nic : # of times word i appears in class c
})c|w(P)c(P{maxarg|V|
i
ni
Cc
ci∏
=∈ 1
)}p,...,p,p(p,n{M~d c|v|
ccc 21=v

28
55
Results
• 25% correct classification• Compare with random guessing of 7%• More advanced techniques perform slightly better:
– Shrinkage of word term frequencies (McCallum et al 1998)– n-gram models– Support Vector Machines
User Browsing Model

29
57
User Browsing Model
• Web browsing is “sticky” or persistent: users tend to view a series of pages within the same category and then switch to another topic
• Example:{News} {News} {News}
58
Markov Switching Modelartsbusinessomputers games health home newscreationeferencescienceshopping society sports adult
arts 83% 4% 5% 2% 1% 2% 6% 3% 2% 6% 2% 3% 4% 1%business 3% 73% 5% 3% 2% 3% 6% 2% 3% 3% 3% 2% 3% 2%computers 5% 11% 79% 3% 3% 7% 5% 3% 4% 4% 5% 5% 2% 2%games 1% 3% 2% 90% 1% 1% 1% 1% 0% 1% 1% 1% 1% 0%health 0% 0% 0% 0% 84% 1% 1% 0% 0% 1% 0% 1% 0% 0%home 0% 1% 1% 0% 1% 80% 1% 1% 0% 1% 1% 1% 0% 0%news 1% 1% 1% 0% 1% 0% 69% 0% 0% 1% 0% 1% 1% 0%recreation 1% 1% 1% 0% 1% 1% 1% 86% 1% 1% 1% 1% 1% 0%reference 0% 1% 1% 0% 1% 0% 1% 0% 85% 2% 0% 1% 1% 0%science 1% 0% 0% 0% 1% 1% 1% 0% 1% 75% 0% 1% 0% 0%shopping 1% 3% 2% 1% 1% 2% 1% 1% 0% 1% 86% 1% 1% 0%society 1% 1% 2% 0% 2% 1% 3% 1% 2% 2% 0% 82% 1% 1%sports 2% 1% 1% 0% 0% 0% 3% 1% 1% 0% 0% 1% 85% 0%adult 1% 1% 1% 0% 0% 0% 1% 0% 0% 0% 0% 1% 0% 93%
16% 10% 19% 11% 2% 3% 2% 6% 3% 2% 7% 6% 5% 7%
Pooled transition matrix, heterogeneity across users

30
59
Implications
• Suppose we have the following sequence:
• Using Bayes Rule can determine that there is a 97% probability of news, unconditional=2%, conditional on last observation=69%
{News} ? {News}
Results

31
61
Methodology
Bayesian setup to combine information from:• Known categories based on exact matches• Text classification• Markov Model of User Browsing
– Introduce heterogeneity by assuming that conditional transition probability vectors drawn from Dirichletdistribution
• Similarity of other pages in the same domain– Assume that category of each page within a domain follows
a Dirichlet distribution, so if we are at a “news” site then pages more likely to be classified as “news”
62
Findings
Random guessingText Classification+ Domain Model
+ Browsing Model
7%25%41%78%

32
Findings about Text Classication
64
Key Points of Text Processing
Can turn text and qualitative data into quantitative data
• Each technique (text classification, browsing model, or domain model) performs only fairly well (~25% classification)
• Combining these techniques together results in very good (~80%) classification rates

33
65
Applications
• Newsgroups– Gather information from newsgroups and determine whether
consumers are responding positively or negatively• E-mail
– Scan e-mail text for similarities to known problems/topics• Better Search engines
– Instead of experts classifying pages we can mine the information collected by ISPs and classify it automatically
• Adult filters– US Appeals Court struck down Children’s Internet Protection
Act on the grounds that technology was inadequate
Conclusions

34
67
Lessons about Behavior
• We reveal a wealth of information about ourselves through clicking, which can then be used to accurately predict about who we are and our interests.
• This works because we tend for information that is compatible with our interests and goals.