predicting financial stability of select bse companies revisiting
TRANSCRIPT

Predicting financial stability of select BSE companies revisiting Altman Z score
Vineet Chouhan1,a, Bibhas Chandra2,b, Shubham Goswami1,c
1School of Management, Sir Padampat Singhania University, Bhatewar, Udaipur, Rajasthan, India a,cMobile: +91-9772778431 , +91-9461347456
2Management Department, Indian School of Mines, Dhanbad, Jharkhand, India
a,b,cE-mail address: [email protected] , [email protected] , [email protected]
ABSTRACT
In the era of globalization, prediction of financial distress is of interest not only to managers but
also to external stakeholders of a company. The stakeholders are continuously seeking the optimal
solution for performance forecasting, as a way to rationalize the decision-making process. The recent
past shows that financial stability of companies is at the stake. Stockholders, Managers, Creditor and
employees of the business are always concerned about financial stability of the companies. The most
frequently tool for financial analysis is financial ratios. However, financial ratios are no-longer proved
appropriate for ‘Stockholders’ equity position and creditors’ claims. Stakeholder’s have concerns about
the consequences of financial distress for companies, and controls of capital adequacy through the
regulatory capital requirement (Mingo, 2000). This shared interest creates persistent investigations and
continuing attempts to answer an incessant question that how financial distress can be predicted, or
what reveals the credit risk of firms. For this purpose most commonly used tool is Altman Z score, but
due to nature of the explanatory variables, financial distress prediction research has not reached an
unequivocal conclusion. The primary goal of this paper is to analyze and reexamine the Altman Z score.
In order to facilitate the current research, various ratios were taken from Altman’s Z score. To fulfill
our objective Z score ratios were used to divide sample firms into healthy and unstable among BSE-30
companies. First the Z score is calculated for 10 companies selected for this purpose for a period of 5
years each. And then it is divided as per z scores, later the significant in the changes in the ratio is
calculated with the help of One sample Komogrov-Smirnow test, which resulted that the change in the
z scores is not significant in case of all the companies.
Keywords: companies; Komogrov-Smirnow; Stockholders; Managers; Creditor; employees of the
business
1.. INTRODUCTION
Ratio analysis is used in various part of the world for measuring financial accuracy and
creditworthiness of the firms, but, Academician seems to be moving toward the elimination of
ratio analysis as an analytical technique in assessing the performance of the business enterprise.
Theorists downgrade arbitrary rules of thumb, such as company ratio comparisons, widely used
by practitioners. Since attacks on the relevance of ratio analysis emanate from many esteemed
International Letters of Social and Humanistic Sciences Online: 2014-04-19ISSN: 2300-2697, Vol. 26, pp 92-105doi:10.18052/www.scipress.com/ILSHS.26.92© 2014 SciPress Ltd., Switzerland
This is an open access article under the CC-BY 4.0 license (https://creativecommons.org/licenses/by/4.0/)
members of the scholarly world, which mean that ratio analysis is limited implications and it
has the significance of such an approach been unattractively garbed. We have to bridge the gap,
between traditional ratio "analysis" and the more rigorous statistical techniques.
The detection of company operating and financial difficulties is a subject which has been
particularly susceptible to financial ratio analysis (Chouhan et. al, 2010, 2011a, b). Prior to the
development of quantitative measures of company performance, agencies were established to
supply a qualitative type of information assessing the creditworthiness of particular merchants.
Formal aggregate studies concerned with portents of business failure were evident in the
1930's.
Altman (1968) was the first researcher to apply the Multiple Discriminant Analysis
(MDA) approach to the financial distress prediction domain. He developed a Z-score
bankruptcy prediction model and determined a cut point of Z-score (2.675) to classify healthy
and distressed firms. The results showed that the Z-score model had sound prediction
performance one year and two years before financial distress, but did not indicate good
prediction utility three to five years before financial distress. A number of authors followed
atman’s work, and applied the Z-score model into different markets, different time periods and
different industries, such as, Taffler (1982, 1984), Pantalone and Platt (1987), Betts and
Belhoul (1987) and Piesse and Wood (1992).
1. 1. Multiple Discriminant Analysis
MDA assumes that the covariance matrices of two populations are identical and both
populations need to be described by multivariate normal distribution. Clearly, these
assumptions do not always reflect the real world. Deakin (1976) argued that even if after
performing the normality transforming process, financial ratio data do not follow normal
distribution. Moreover, Hamer (1983) evaluated the sensitivity of financial distress prediction
models in terms of four different variable sets from previous research (Altman, 1968; Deakin,
1972; Blum, 1974; Ohlson, 1980) and she pointed out that the covariance matrices in each
variable set were statistically different. Beaver (1967) was the first to identify the
characteristics of failing firms in comparison to a matched paired sample of healthy firms.
Using univariate discrimination test and found that financial ratios are proved to be useful
predictors and found that certain financial ratios can be very useful predictors of failure even
five years before it happens.
This study can be thought of as the pioneering work which initiated a series of other
works in the same area. Following this first study two major statistical techniques, Multiple
Discriminant Analysis (MDA) and Regression Analysis (RA), were applied by many authors
to predict imminent bankruptcies. E. Altman (1968, 1978) was the first to apply the MDA
method to the failure prediction problem and his model (known as Ζ Score analysis) was 90 %
accurate in classifying firms correctly one year prior to failure. In other methods, Regression
Analysis was applied by Edmister (1971) who obtained high classification results. However,
one major shortcoming was the fact that he did not use the variables in their raw form but,
instead, he transformed each. MDA was also applied by Deakin (1972) who found that his
models were at least 95 % accurate for the first three years prior to bankruptcy.
The two techniques (MDA and RA) were compared in a study by Collins (1980) who
concluded that both methods provided good predictive results. In Japan a number of studies
(for example, Nikkei-Business, Takahashi and Ko) obtained high classification performances
(85 % or above). Von Stein (1981) in Germany, Weibel (1973) in Switzerland, Taffler et al and
Tissaw (1977) and Marais (1979) in England, Bilderbeek (1977) in Netherlands and Altman
and Lavallee (1981) in Canada used MDA. In all of these studies the estimated models had
International Letters of Social and Humanistic Sciences Vol. 26 93
high success rates ranging from 70 % to 90 %. Similar studies by Altman (1973) in France and
Castagna and Matolscy (1981) in Australia obtained average results.
Generalized linear models or multiple logistic regression models are also popular.
Ohlsons O-Score (Ohlson, 1980) is based on generalized linear models with the logit link
function, also referred to as logit analysis. Neural network models are powerful and popular
alternatives, with the ability to incorporate a very large number of features in an adaptive
nonlinear model, Wilson and Sharda (1994). In India prediction models have been developed
by Gupta (1979), Kaveri (1980), Srivastava (1981), and Yadav (1986). Gupta (1979) has made
an attempt to examine a variety of ratios and determined the best set of ratios. Yadav (1986)
developed discriminant model by using financial ratios which covers the financial
characteristics of the firm. Rekha Pai et al (2006) has made a comparison of PCA-MDA model
and Neural networks techniques to predict industrial sickness and has proved that the traditional
statistical model seem to perform as a better predictive technique than the soft computing
model. Regardless of the advantages or the disadvantages of the predictive model, the very idea
of developing such models to predict financial distress and failure itself is welcome allover, for
a model could help to detect the likelihood of forthcoming sickness and thus facilitate to
prevent its onslaught in an early stage. The bankruptcy models can be used as early warning
signals, such that, corrective action may be undertaken immediately by the management.
The paper begins with a literature review on the credit risk measure, followed by
discussion on the option-based credit risk measure. The paper also describes the data collected,
the variables analyzed and the statistical methods adopted in the paper. We conclude, after
statistical results for the Altman’s Z-score and the comparison with the option-based measure
are discussed.
1. 2. Objectives
The main objectives of the current study are enlisted as below:
1. To calculate the prominent ratios of select BSE-30 companies included in Altman Z
score.
2. To identify the change in time series data correspond to Altman Z score for each select
BSE-30 companies.
2.. REVIEW OF LITERATURE
The first multivariate study was published by Altman (1968). He has used multivariate
discriminant analysis to develop a five-factor model to predict bankruptcy of manufacturing
firms. The "Z-score", as it was called, predicted bankruptcy if the firm's score fell within a
certain range.
Initiated by Beaver (1966), Altman (1968), and Ohlson (1980), academic studies to
measure financial vulnerability continued for three decades. Beaver found that the cash flow
to debt ratio was the best single ratio predictor of distress in his univariate discriminant analysis.
Altman’s Z-Score model used multivariate discriminant analysis to select the five most
significant variables for measuring the financial distress of firms. Ohlson’s O-Score model
used a logit analysis to generate a one-year prediction model, and his academic descendants
frequently referred to his discrete variables as a proxy for the probability of financial distress.
Altman (1968) collected data from 33 failed firms and 33 matching firms, during the
period 1946-1965, to find discriminating variables for bankruptcy prediction. In his seminal
94 Volume 26
paper, Altman evaluated 22 potentially significant variables of the 66 firms by using multiple
discriminant analysis to build the discriminant function with five variables. The discriminant
function is as follows:
54321 999.06.03.34.12.1 XXXXXZ ,
where:
1X Working Capital/Total Assets
2X Retained Earnings/Total Assets
3X EBIT/Total Assets
4X Market Value of Equity/Book Value of Total Debt, and
5X Sales/Total assets
X1-Working Capital/Total Assets
The Working capital/Total assets ratio, frequently found in studies of corporate problems,
is a measure of the net liquid assets of the firm relative to the total capitalization. Working
capital is defined as the difference between current assets and current liabilities. Liquidity and
size characteristics are explicitly considered. Ordinarily, a firm experiencing consistent
operating losses will have shrinking current assets in relation to total assets. Of the three
liquidity ratios evaluated, this one proved to be the most valuable. 22 Inclusion of this variable
is consistent with the Merwin study which rated the net working capital to total asset ratio as
the best indicator of ultimate discontinuance.
X2-Retained Earnings/Total Assets
This measure of cumulative profitability over time was cited earlier as one of the "new"
ratios. The age of a firm is implicitly considered in this ratio. For example, a relatively young
firm will probably show a low RE/TA ratio because it has not had time to build up its
cumulative profits. Therefore, it may be argued that the young firm is somewhat discriminated
against in this analysis, and its chance of being classified as bankrupt is relatively higher than
another, older firm. But, this is precisely the situation in the real world. The incidence of failure
is much higher in a firm's earlier.
X3-Earnings before Interest and Taxes/Total Assets
This ratio is calculated by dividing the total assets of a firm into its earnings before
interest and tax reductions. In essence, it is a measure of the true productivity of the firm's
assets, abstracting from any tax or leverage factors. Since a firm's ultimate existence is based
on the earning power of its assets, this ratio appears to be particularly appropriate for studies
dealing with corporate failure. Furthermore, insolvency in a bankruptcy sense occurs when the
total liabilities exceed a fair valuation of the firm's assets with value determined by the earning
power of the assets.
X4-Market Value of Equity/Book Value of Total Debt
Equity is measured by the combined market value of all shares of stock, preferred and
common, while debt includes both current and long-term. The measure shows how much the
firm's assets can decline in value (measured by market value of equity plus debt) before the
International Letters of Social and Humanistic Sciences Vol. 26 95
liabilities exceed the assets and the firm becomes insolvent. This ratio adds a market value
dimension which other failure studies did not consider. It also appears to be a more effective
predictor of bankruptcy than a similar, more commonly used ratio: Net worth/Total debt (book
values).
X5-Sales/Total Assets
The capital-turnover ratio is a standard financial ratio illustrating the sales generating
ability of the firm's assets. It is one measure of management's capability in dealing with
competitive conditions. This final ratio is quite important because, as indicated below, it is the
least significant ratio on an individual basis. In fact, based on the statistical significance
measure, it would not have appeared at all. However, because of its unique relationship to other
variables in the model, the Sales/Total assets ratio ranks second in its contribution to the overall
discriminating ability of the model.
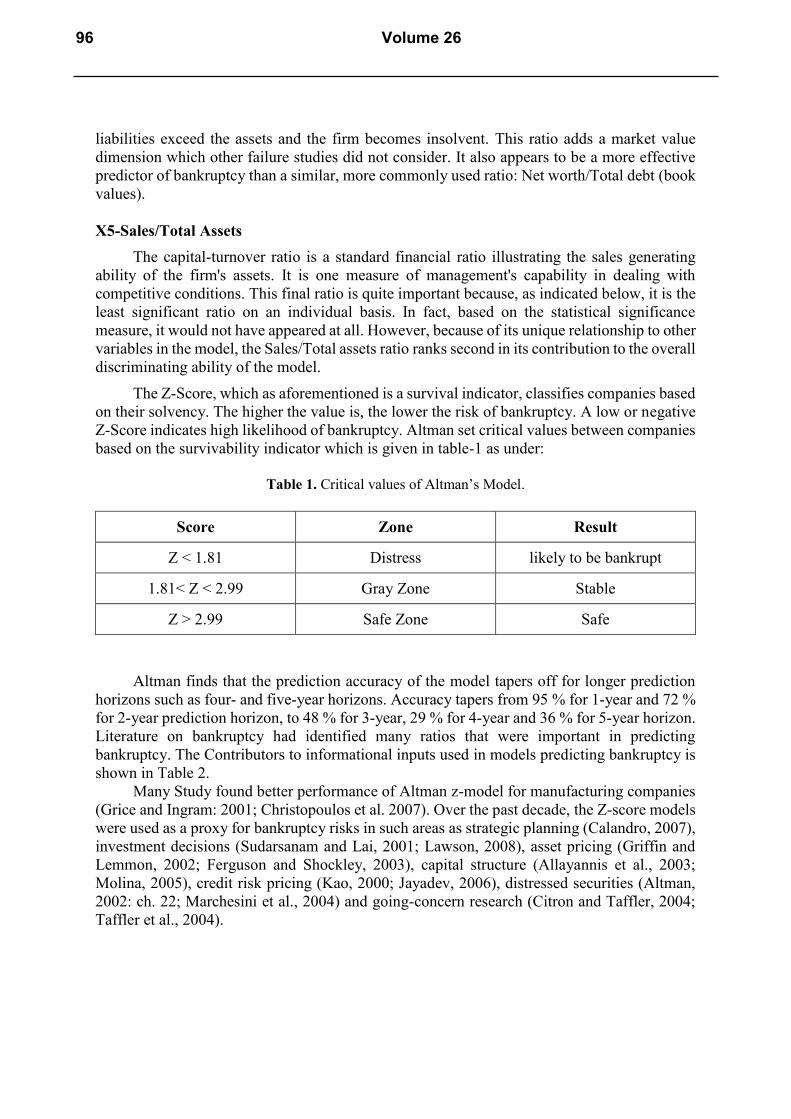
The Z-Score, which as aforementioned is a survival indicator, classifies companies based
on their solvency. The higher the value is, the lower the risk of bankruptcy. A low or negative
Z-Score indicates high likelihood of bankruptcy. Altman set critical values between companies
based on the survivability indicator which is given in table-1 as under:
Table 1. Critical values of Altman’s Model.
Score Zone Result
Z < 1.81 Distress likely to be bankrupt
1.81< Z < 2.99 Gray Zone Stable
Z > 2.99 Safe Zone Safe
Altman finds that the prediction accuracy of the model tapers off for longer prediction
horizons such as four- and five-year horizons. Accuracy tapers from 95 % for 1-year and 72 %
for 2-year prediction horizon, to 48 % for 3-year, 29 % for 4-year and 36 % for 5-year horizon.
Literature on bankruptcy had identified many ratios that were important in predicting
bankruptcy. The Contributors to informational inputs used in models predicting bankruptcy is
shown in Table 2.
Many Study found better performance of Altman z-model for manufacturing companies
(Grice and Ingram: 2001; Christopoulos et al. 2007). Over the past decade, the Z-score models
were used as a proxy for bankruptcy risks in such areas as strategic planning (Calandro, 2007),
investment decisions (Sudarsanam and Lai, 2001; Lawson, 2008), asset pricing (Griffin and
Lemmon, 2002; Ferguson and Shockley, 2003), capital structure (Allayannis et al., 2003;
Molina, 2005), credit risk pricing (Kao, 2000; Jayadev, 2006), distressed securities (Altman,
2002: ch. 22; Marchesini et al., 2004) and going-concern research (Citron and Taffler, 2004;
Taffler et al., 2004).
96 Volume 26
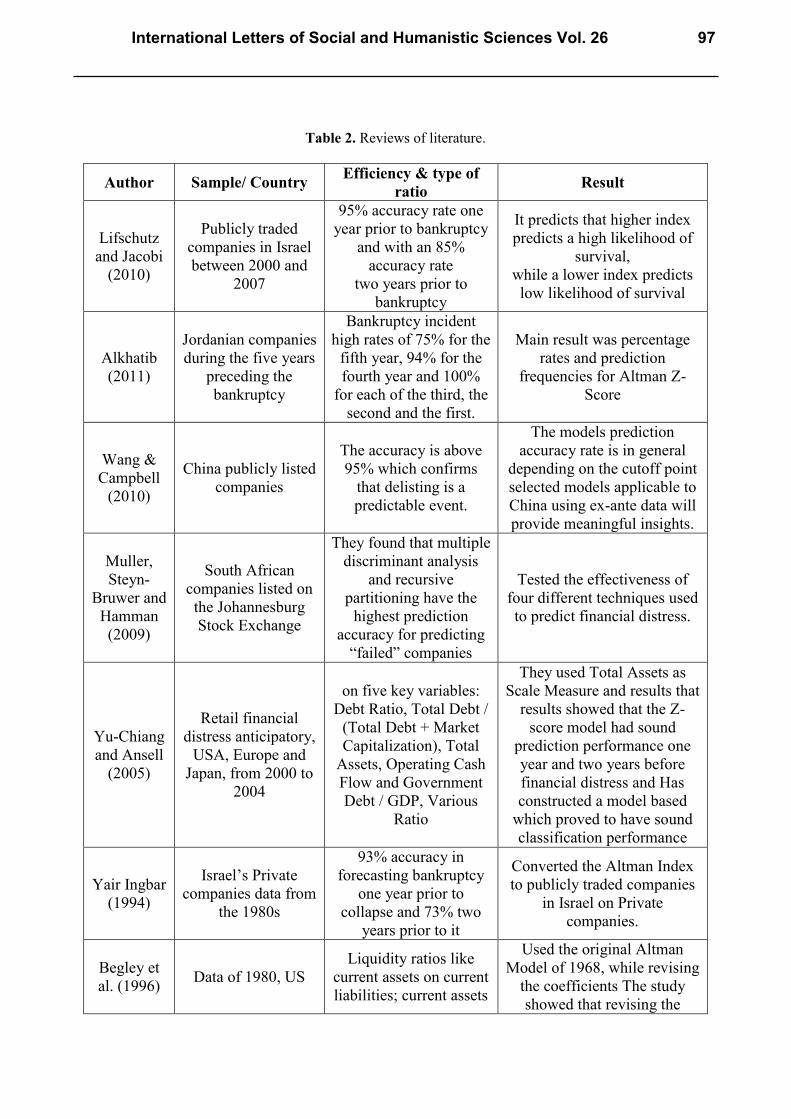
Table 2. Reviews of literature.
Author Sample/ Country Efficiency & type of
ratio Result
Lifschutz
and Jacobi
(2010)
Publicly traded
companies in Israel
between 2000 and
2007
95% accuracy rate one
year prior to bankruptcy
and with an 85%
accuracy rate
two years prior to
bankruptcy
It predicts that higher index
predicts a high likelihood of
survival,
while a lower index predicts
low likelihood of survival
Alkhatib
(2011)
Jordanian companies
during the five years
preceding the
bankruptcy
Bankruptcy incident
high rates of 75% for the
fifth year, 94% for the
fourth year and 100%
for each of the third, the
second and the first.
Main result was percentage
rates and prediction
frequencies for Altman Z-
Score
Wang &
Campbell
(2010)
China publicly listed
companies
The accuracy is above
95% which confirms
that delisting is a
predictable event.
The models prediction
accuracy rate is in general
depending on the cutoff point
selected models applicable to
China using ex-ante data will
provide meaningful insights.
Muller,
Steyn-
Bruwer and
Hamman
(2009)
South African
companies listed on
the Johannesburg
Stock Exchange
They found that multiple
discriminant analysis
and recursive
partitioning have the
highest prediction
accuracy for predicting
“failed” companies
Tested the effectiveness of
four different techniques used
to predict financial distress.
Yu-Chiang
and Ansell
(2005)
Retail financial
distress anticipatory,
USA, Europe and
Japan, from 2000 to
2004
on five key variables:
Debt Ratio, Total Debt /
(Total Debt + Market
Capitalization), Total
Assets, Operating Cash
Flow and Government
Debt / GDP, Various
Ratio
They used Total Assets as
Scale Measure and results that
results showed that the Z-
score model had sound
prediction performance one
year and two years before
financial distress and Has
constructed a model based
which proved to have sound
classification performance
Yair Ingbar
(1994)
Israel’s Private
companies data from
the 1980s
93% accuracy in
forecasting bankruptcy
one year prior to
collapse and 73% two
years prior to it
Converted the Altman Index
to publicly traded companies
in Israel on Private
companies.
Begley et
al. (1996) Data of 1980, US
Liquidity ratios like
current assets on current
liabilities; current assets
Used the original Altman
Model of 1968, while revising
the coefficients The study
showed that revising the
International Letters of Social and Humanistic Sciences Vol. 26 97
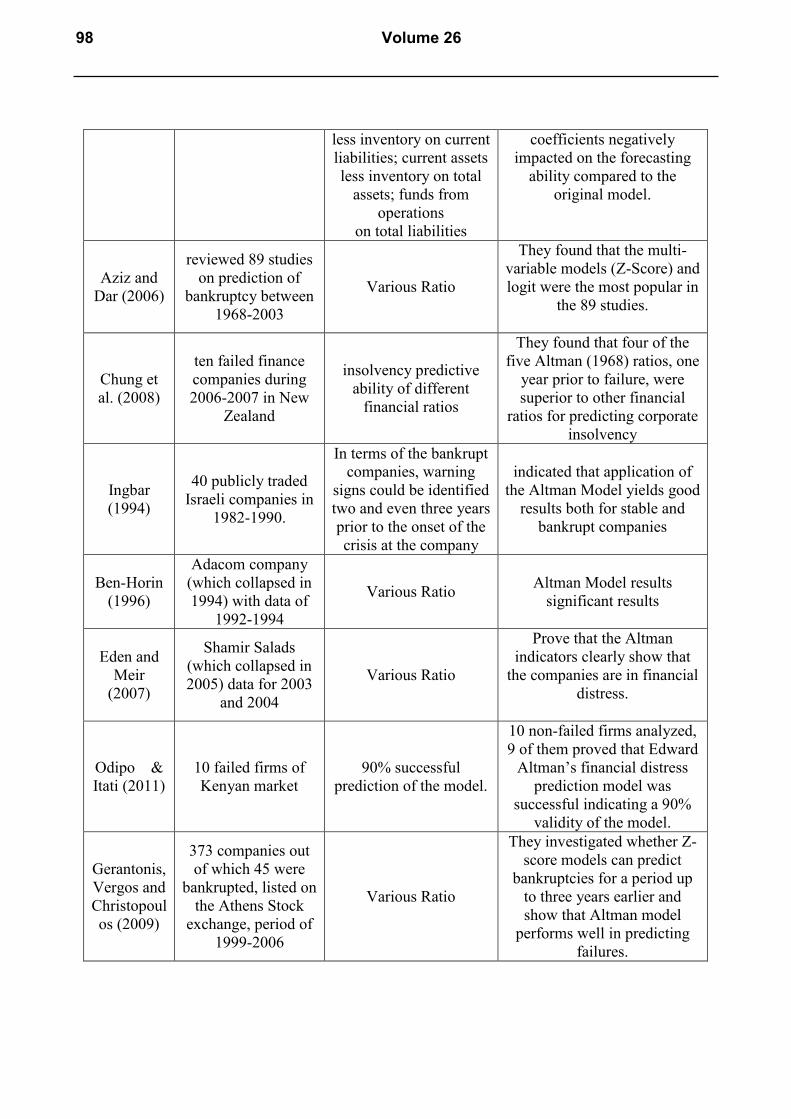
less inventory on current
liabilities; current assets
less inventory on total
assets; funds from
operations
on total liabilities
coefficients negatively
impacted on the forecasting
ability compared to the
original model.
Aziz and
Dar (2006)
reviewed 89 studies
on prediction of
bankruptcy between
1968-2003
Various Ratio
They found that the multi-
variable models (Z-Score) and
logit were the most popular in
the 89 studies.
Chung et
al. (2008)
ten failed finance
companies during
2006-2007 in New
Zealand
insolvency predictive
ability of different
financial ratios
They found that four of the
five Altman (1968) ratios, one
year prior to failure, were
superior to other financial
ratios for predicting corporate
insolvency
Ingbar
(1994)
40 publicly traded
Israeli companies in
1982-1990.
In terms of the bankrupt
companies, warning
signs could be identified
two and even three years
prior to the onset of the
crisis at the company
indicated that application of
the Altman Model yields good
results both for stable and
bankrupt companies
Ben-Horin
(1996)
Adacom company
(which collapsed in
1994) with data of
1992-1994
Various Ratio Altman Model results
significant results
Eden and
Meir
(2007)
Shamir Salads
(which collapsed in
2005) data for 2003
and 2004
Various Ratio
Prove that the Altman
indicators clearly show that
the companies are in financial
distress.
Odipo &
Itati (2011)
10 failed firms of
Kenyan market
90% successful
prediction of the model.
10 non-failed firms analyzed,
9 of them proved that Edward
Altman’s financial distress
prediction model was
successful indicating a 90%
validity of the model.
Gerantonis,
Vergos and
Christopoul
os (2009)
373 companies out
of which 45 were
bankrupted, listed on
the Athens Stock
exchange, period of
1999-2006
Various Ratio
They investigated whether Z-
score models can predict
bankruptcies for a period up
to three years earlier and
show that Altman model
performs well in predicting
failures.
98 Volume 26

Vergos and
Christopoul
os et al
(2006)
Greek telecom
company failures
predictions and company
announcements may
affect considerably
market prices up to 18
months before the
announcement of
negative financial results,
they used Various Ratio.
Something that leads to
incorporation of probability of
failure in company prices, and
respective company Altman
z-score that are affected by
market price of shares, well
before the company will
declare bankruptcy. Altman is
useful in predicting.
Charitou
and
Trigeogis
(2000)
139 firms that filed
bankruptcy between
1983 and 1994
Independently, and
tested some other
accounting variables in
terms of their
discriminating power for
the default probability of
firms of interest.
Significance of each variable
of Altman z-score is
significant.
Hillegeist
et al.
(2002)
516 bankruptcy
filings between 1979
and 1997
Adjusted with the firm’s
expected return on
assets
Altman’s Z-Score by
introducing a unique discrete
hazard methodology and
compared the risk-neutral
default probability.
Kim (2007)
They fail to assert
that the option-based
model performs
better than variables
in Altman’s Z-score
model
It is losing its prediction
power for long-term
prediction, and its
accuracy is deteriorating
for recent years’ data.
Option-based measure
provides significant results as
a 1-year prediction measure
for recent years in individual
industries.
Back et al.
(1996)
11 papers to
reexamine 31
financial ratios
Used three distinctive
statistical techniques
discriminant analysis,
logit regression, and
neural networks.
No consensus has been built
on the best technique and the
most significant explanatory
variables.
Altman and
Narayanan
(1971)
identify financially
stressed companies Various Ratios
No statistical method was
consistently dominant
Smith and
Winakor
(1935)
183 failed firms
from a variety of
industries
Various Ratio
Working Capital to Total
Assets was a far better
predictor of financial
problems
Smith at al. (1935) concluded that failing firms exhibit significantly different ratio
measurements than continuing entities (Merwin, 1942). In addition, another study was
concerned with ratios of large asset-size corporations that experienced difficulties in meeting
their fixed indebtedness obligation (Hickman 1958). The previous studies involved the analysis
of financial ratios in a bankruptcy-prediction context which includes Beaver; 1966, Altman Z
score (Altman 1968), ZetaTM Analysis (Altman et al.,1977), Marc Blum (1974), Merton’s
(1974), Frederikslust (1978), Ohlson (1980), Taffler, (1983), Back et al, (1995), Back et al,
International Letters of Social and Humanistic Sciences Vol. 26 99

(1997); Spanos et al, (1999), Gupta (1979), Kaveri (1980), Srivastava (1981), and Yadav
(1986), etc.
Another stream of financial distress literature has been utilizing various statistical
methods to predict the bankruptcy of firms. A few significant methods are: multinomial choice
models such as logit and/or probit models (Martin, 1977; Santomero and Vinso, 1977; Ohlson,
1980; Zmijewski, 1984), multiple discriminant analysis (Altman, 1968), recursive partitioning
(Frydman, Altman and Kao, 2002), neural networks (Altman, Marco and Varetto, 1994), and
discrete hazard models (Hillegeist et al., 2002).
2. 1. S&P BSE SENSEX-The Barometer of Indian Capital Markets
S&P BSE SENSEX is treated as The Barometer of Indian Capital Markets compiled in
1986; it is calculated on a "Market Capitalization-Weighted" methodology of 30 component
stocks representing large, well-established and financially sound companies across key sectors.
The base year of S&P BSE SENSEX was taken as 1978-79. S&P BSE SENSEX today is
widely reported in both domestic and international markets through print as well as electronic
media. It is scientifically designed and is based on globally accepted construction and review
methodology. Since September 1, 2003, S&P BSE SENSEX is being calculated on a free-float
market capitalization methodology. The "free-float market capitalization-weighted"
methodology is a widely followed index construction methodology on which majority of global
equity indices are based; all major index providers like MSCI, FTSE, STOXX, and Dow Jones
use the free-float methodology. The growth of the equity market in India has been phenomenal
in the present decade. Right from early nineties, the stock market witnessed heightened activity
in terms of various bull and bear runs. In the late nineties, the Indian market witnessed a huge
frenzy in the 'TMT' sectors. More recently, real estate caught the fancy of the investors. S&P
BSE SENSEX has captured all these happenings in the most judicious manner. One can
identify the booms and busts of the Indian equity market through S&P BSE SENSEX. As the
oldest index in the country, it provides the time series data over a fairly long period of time
(from 1979 onwards). Small wonder, the S&P BSE SENSEX has become one of the most
prominent brands in the country.
3. .RESEARCH METHODOLOGY AND DATA SOURCE
3. 1. Sample Selection
The importance of Indian Equity market can be identified through S&P BSE SENSEX,
as it is the oldest index in the country, it provides the time series data over a fairly long period
of time (from 1979 onwards) and became one of the most prominent brands in the country. For
the purpose of this research paper 10 companies were selected as a tentative sample on the
basis of Convenient Sampling method, which is part of BSE-30 Companies currently operating
in India.
3. 2. Data Source
The data required for the present study are the financial records and financial ratios
suggested by Altman for the 10 BSE companies which were collected through the original
source i.e., Annual Report from official websites of the companies through internet. The data
which included various ratios were calculated through the collected data of annual report and
were taken into account for further analysis.
100 Volume 26
3. 3. Hypothesis
Based upon the objectives of the study and supported by extensive literature reviews, the
following hypotheses need to be tested:
H0: The time series data correspond to Altman Z score for each select BSE-30 companies
exhibit a no differences during last 5 years.
H1: The time series data correspond to Altman Z score for each select BSE-30 companies
exhibit a significant change during last 5 years.
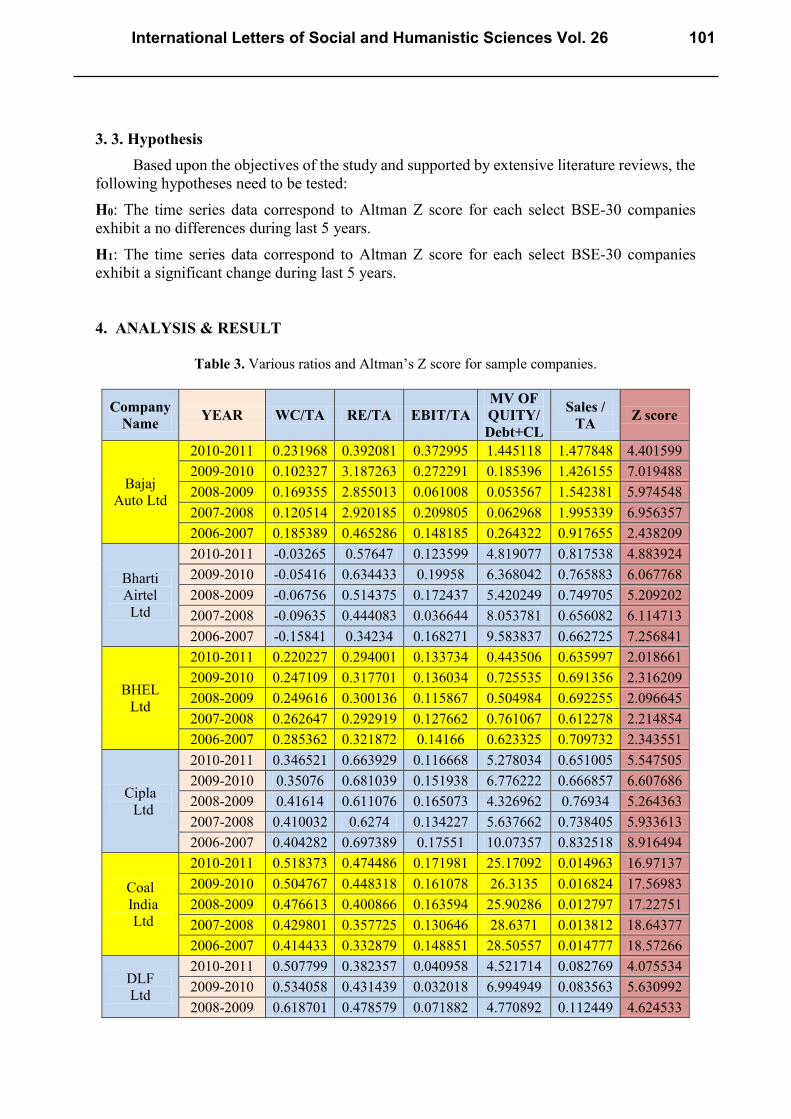
4. .ANALYSIS & RESULT
Table 3. Various ratios and Altman’s Z score for sample companies.
Company
Name YEAR WC/TA RE/TA EBIT/TA
MV OF
QUITY/
Debt+CL
Sales /
TA Z score
Bajaj
Auto Ltd
2010-2011 0.231968 0.392081 0.372995 1.445118 1.477848 4.401599
2009-2010 0.102327 3.187263 0.272291 0.185396 1.426155 7.019488
2008-2009 0.169355 2.855013 0.061008 0.053567 1.542381 5.974548
2007-2008 0.120514 2.920185 0.209805 0.062968 1.995339 6.956357
2006-2007 0.185389 0.465286 0.148185 0.264322 0.917655 2.438209
Bharti
Airtel
Ltd
2010-2011 -0.03265 0.57647 0.123599 4.819077 0.817538 4.883924
2009-2010 -0.05416 0.634433 0.19958 6.368042 0.765883 6.067768
2008-2009 -0.06756 0.514375 0.172437 5.420249 0.749705 5.209202
2007-2008 -0.09635 0.444083 0.036644 8.053781 0.656082 6.114713
2006-2007 -0.15841 0.34234 0.168271 9.583837 0.662725 7.256841
BHEL
Ltd
2010-2011 0.220227 0.294001 0.133734 0.443506 0.635997 2.018661
2009-2010 0.247109 0.317701 0.136034 0.725535 0.691356 2.316209
2008-2009 0.249616 0.300136 0.115867 0.504984 0.692255 2.096645
2007-2008 0.262647 0.292919 0.127662 0.761067 0.612278 2.214854
2006-2007 0.285362 0.321872 0.14166 0.623325 0.709732 2.343551
Cipla
Ltd
2010-2011 0.346521 0.663929 0.116668 5.278034 0.651005 5.547505
2009-2010 0.35076 0.681039 0.151938 6.776222 0.666857 6.607686
2008-2009 0.41614 0.611076 0.165073 4.326962 0.76934 5.264363
2007-2008 0.410032 0.6274 0.134227 5.637662 0.738405 5.933613
2006-2007 0.404282 0.697389 0.17551 10.07357 0.832518 8.916494
Coal
India
Ltd
2010-2011 0.518373 0.474486 0.171981 25.17092 0.014963 16.97137
2009-2010 0.504767 0.448318 0.161078 26.3135 0.016824 17.56983
2008-2009 0.476613 0.400866 0.163594 25.90286 0.012797 17.22751
2007-2008 0.429801 0.357725 0.130646 28.6371 0.013812 18.64377
2006-2007 0.414433 0.332879 0.148851 28.50557 0.014777 18.57266
DLF
Ltd
2010-2011 0.507799 0.382357 0.040958 4.521714 0.082769 4.075534
2009-2010 0.534058 0.431439 0.032018 6.994949 0.083563 5.630992
2008-2009 0.618701 0.478579 0.071882 4.770892 0.112449 4.624533
International Letters of Social and Humanistic Sciences Vol. 26 101
2007-2008 0.62109 0.466181 0.132992 19.3614 0.236023 13.68946
2006-2007 0.50507 0.030961 0.05537 19.99826 0.101158 12.93216
HDFC
Bank
Ltd
2010-2011 0.527337 0.090364 0.014126 0.817494 0.08729 1.383627
2009-2010 0.550239 0.095263 0.013276 0.827564 0.089974 1.423889
2008-2009 0.497977 0.078135 0.012298 0.523337 0.108485 1.169923
2007-2008 0.429665 0.083944 0.011939 0.958041 0.0925 1.339749
2006-2007 0.431994 0.067365 0.015141 0.979686 0.091988 1.342378
Hero
Motorcorp
Ltd
2010-2011 -0.45063 0.268898 0.211179 40.50133 1.789 26.6206
2009-2010 -0.24657 0.401859 0.309725 77.57622 1.860887 49.69356
2008-2009 -0.19453 0.618032 0.274091 93.96997 2.030665 59.94692
2007-2008 -0.19973 0.580715 0.252846 67.4927 2.036396 43.9377
2006-2007 -0.16355 0.572605 0.266767 74.40819 2.719633 48.84755
Hindalco
Industries
Ltd
2010-2011 0.036286 0.638619 0.058093 2.61592 0.516433 3.214786
2009-2010 0.032221 0.661778 0.046405 2.32684 0.466476 2.980405
2008-2009 0.100888 0.650618 0.070374 0.664627 0.502615 2.165055
2007-2008 0.088078 0.554643 0.094476 2.918252 0.620118 3.564414
2006-2007 0.104968 0.492395 0.141264 4.547351 0.732292 4.741456
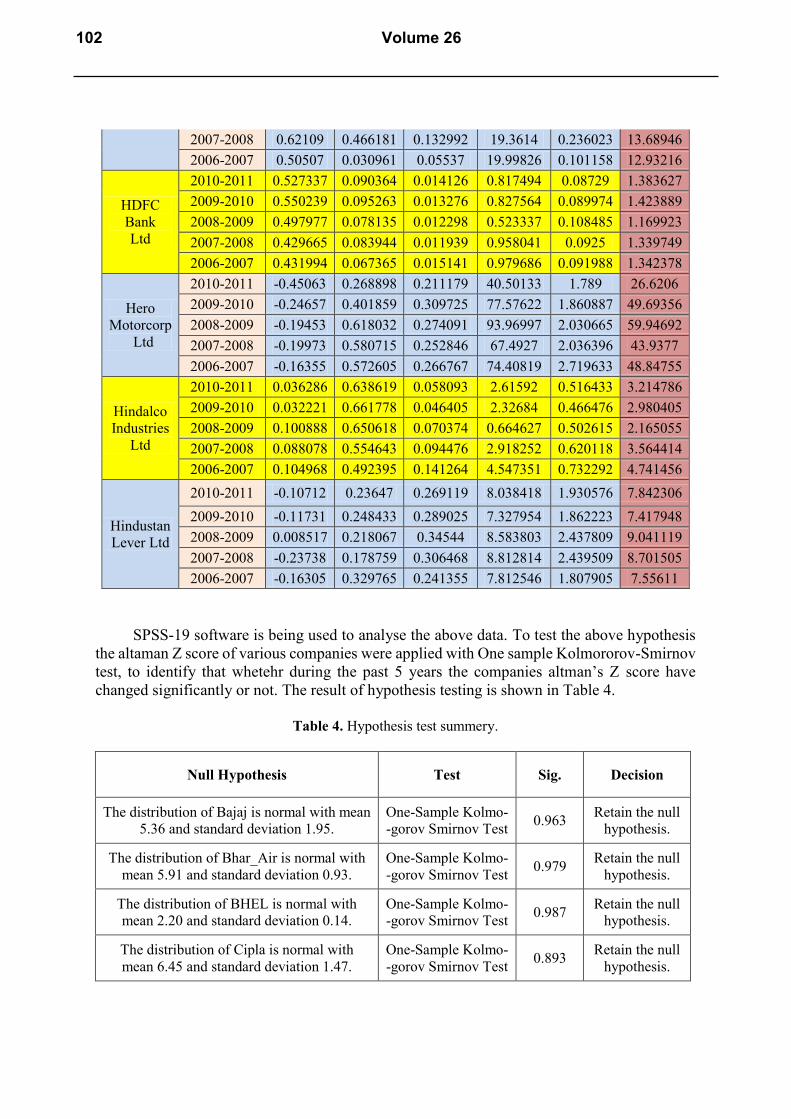
Hindustan
Lever Ltd
2010-2011 -0.10712 0.23647 0.269119 8.038418 1.930576 7.842306
2009-2010 -0.11731 0.248433 0.289025 7.327954 1.862223 7.417948
2008-2009 0.008517 0.218067 0.34544 8.583803 2.437809 9.041119
2007-2008 -0.23738 0.178759 0.306468 8.812814 2.439509 8.701505
2006-2007 -0.16305 0.329765 0.241355 7.812546 1.807905 7.55611
SPSS-19 software is being used to analyse the above data. To test the above hypothesis
the altaman Z score of various companies were applied with One sample Kolmororov-Smirnov
test, to identify that whetehr during the past 5 years the companies altman’s Z score have
changed significantly or not. The result of hypothesis testing is shown in Table 4.
Table 4. Hypothesis test summery.
Null Hypothesis Test Sig. Decision
The distribution of Bajaj is normal with mean
5.36 and standard deviation 1.95.
One-Sample Kolmo-
-gorov Smirnov Test 0.963
Retain the null
hypothesis.
The distribution of Bhar_Air is normal with
mean 5.91 and standard deviation 0.93.
One-Sample Kolmo-
-gorov Smirnov Test 0.979
Retain the null
hypothesis.
The distribution of BHEL is normal with
mean 2.20 and standard deviation 0.14.
One-Sample Kolmo-
-gorov Smirnov Test 0.987
Retain the null
hypothesis.
The distribution of Cipla is normal with
mean 6.45 and standard deviation 1.47.
One-Sample Kolmo-
-gorov Smirnov Test 0.893
Retain the null
hypothesis.
102 Volume 26

The distribution of Coal India is normal with
mean 17.80 and standard deviation 0.77.
One-Sample Kolmo-
-gorov Smirnov Test 0.930
Retain the null
hypothesis.
The distribution of DLF is normal with a
mean 8.19 and standard deviation 4.71
One-Sample Kolmo-
-gorov Smirnov Test 0.736
Retain the null
hypothesis.
The distribution of HDFC is normal with
mean 1.33 and standard deviation 0.10.
One-Sample Kolmo-
-gorov Smirnov Test 0.639
Retain the null
hypothesis.
The distribution of HERO_MOTO is normal
with mean 45.81 and standard deviation
12.21.
One-Sample Kolmo-
-gorov Smirnov Test 0.937
Retain the null
hypothesis.
The distribution of HINDLKO is normal
with mean 3.33 and standard deviation 0.94.
One-Sample Kolmo-
-gorov Smirnov Test 0.986
Retain the null
hypothesis.
The distribution of HUL is normal with mean
8.11 and standard deviation 0.72.
One-Sample Kolmo-
-gorov Smirnov Test 0.923
Retain the null
hypothesis.
Asymptotic significance is displayed. The significance level is 0.05. The above analysis
explains that in case of all the companies despite of changes in the Altman’s Z score the
difference is statistically not significant.
5. .CONCLUSION
The application of financial distress measurement literature flows into the international
application of credit risk measurement to verify the robustness of such measures and techniques
in different countries. This measure creates a significant impact on other finance research since
its ability to test existing hypotheses with the new continuous variable may hold promise for a
new stream of studies. Workable and promising topics with the new credit risk measure are not
limited to the following examples. Our hypothesis concerning Altman’s Z-score is based on
arguments that the Z-score have changed in the selected BSE companies, have found to be an
unreached conclusion and all the companies are found to be in safe zone except HDFC Bank
and BHEL. Finally we can conclude that Altman’s model still exists and used by the companies
for measuring creditworthiness of the companies and it still remains promising but challenging.
References
[1] Alkhatib K., Al Bzour A. E., International Journal of Business and Management 6(3)
(2011) 208-215.
[2] Altman, E. I. Bankruptcy, Credit Risk and High Yield Junk Bonds. Blackwell (2002).
[3] Altman E. I., Journal of Finance 23 (1968) 589-609.
[4] Altman E.I., Haldeman R. G., Narayanan P., Journal of Banking and Finance 1 (1987)
29-54.
[5] Aziz M. A., Dar H. A., Corporate Governance 6(1) (2006) 18-33.
International Letters of Social and Humanistic Sciences Vol. 26 103

[6] Back B., Laitinen T., Sere K., Wezel M. Chooking, Bankruptcy Predictions Using
Discriminant Analysis, Logit Analysis, and Genetic Algorithms. Technical Report, Turku
Center for Computer Science (1996) 40.
[7] Beaver W. H., Journal of Accounting Research 4 (1966) 71-111.
[8] Begley J., Mining J., Watts S., Review of Accounting Studies 1(4) (1996) 267-284.
[9] Ben-Horin M., Tcherikover (1996) 305-307.
[10] Charitou A., Trigeogis L., Option-Based Bankruptcy Predicion Working paper
University of Cypus (2002).
[11] Chouhan V., The Pacific Business Review International 1 (2011) 70-75.
[12] Chouhan V., Bhatt A., Vyas D., The Indian Journal of Business Administration 7 (2011)
149-162.
[13] Chouhan V., The Indian Journal of Business Administration 6 (2010) 202-208.
[14] Christopoulos A., Vergos K., How Stock prices react to managerial decisions and other
profit signaling events in the Greek mobile telecom market?, 3rd International
Conference on Applied Financial Economics, Samos Island, (2006).
[15] Chung K. C., Tan S. S., Holdsworth D. K., International Journal of Business and
Management 3(1) (2008) 19-29.
[16] Deakin E. B., Business failure prediction: An empirical analysis. In E. Altman, & A.
Sametz (Eds.), Financial crises: Institutions and markets in a fragile environment. New
York, John Wiley (1977).
[17] Eden I., Meir Y., Roeh Haheshbon 5 (2007) 100-101.
[18] Gerantonis N., Vergos K., Christopoulos A. G., Research Journal of International
Studies 12 (2009) 21- 28.
[19] Hillegeist S. A., Keeting E. K., Cram D. P., Lundstedt K. G., Assessing the Probability
of Bankruptcy Working Paper, Northwestern University (2002).
[20] Ingbar Y., Analysis of financial statement Israel Institute of Productivity. (Chapter 13).
(1994).
[21] Kim H., Gu Z., The Journal of Hospitality Financial Management 14(1) (2006) 17-34.
[22] Lawson R., Journal of Investing 17(4) (2008) 38-55.
[23] Lifschutz S., Jacobi A., International Journal of Business and Management 5(4) (2010)
133-141.
[24] Muller G. H., B. W. Steyn-Bruwer, W. D. Hamman, South African Journal of Business
Management 40(1) (2009) 21-32.
[25] Odipo B. K., A.S. Itati, Evaluation of Applicability of ALTMAN'S Revised Model in
Prediction of Financial Distress: A Case of Companies Quoted in the NAIROBI Stock
Exchange (2011) 1-39.
[26] Ohlson J., Journal of Accounting Research 18 (1) (1980) 109-131.
[27] Santomero A. M., Vinso J. D., Journal of Banking and Finance 1 (1997) 185-205.
104 Volume 26
[28] Smith R., A. Winakor, Changes in Financial Structure of Unsuccessful Industrial
Corporations Bureau of Business Research, Bulletin No. 51. Urbana: University of
Illinois Press (1935).
[29] Taffler R. J., Lu J., Kausar A., Journal of Accounting & Economics 38(1-3) (2004) 263-
296.
[30] Wang Y., Campbell M., Journal of Business and Management 16(1) (2010) 75-88.
[31] Yu-Chiang Hu, Jake Ansell, Developing Financial Distress Prediction Models. A Study
of US, Europe and Japan Retail Performance. University of Edinburgh, U.K (2005).
( Received 08 April 2014; accepted 15 April 2014 )
International Letters of Social and Humanistic Sciences Vol. 26 105